Summary
Financial intermediation activity with the private sector continued to grow in June. The real balance of credit to companies and households in pesos increased 4.2% in the month (78.1% real y.o.y.), mainly due to commercial lines and loans with real collateral. The balance of financing to the private sector in foreign currency increased 3.8% between the end of the month (139.8% YoY)-variations in currency of origin-.
In June, the real balance of private sector deposits in pesos increased 3.9% in real terms compared to May. The monthly performance was mainly explained by the behavior of the balance of demand accounts (7.1% in real terms), influenced by the action of seasonal factors (for example, the payment of the half bonus). The real balance of private sector time deposits in pesos remained unchanged in magnitude during the period (0.2% in real terms). Regarding the foreign currency segment, the balance of private sector deposits increased 1.5% in the month (72.7% y.o.y.) – variations in currency of origin.
The NPL ratio of total credit to the private sector stood at 2.9% in June, reaching 5.2% for loans to households and 1.1% for those to companies. At the end of the first half of the year, the financial system continued to present high levels of forecasting (equivalent to 119% of the balance of credit in an irregular situation).
In June, the systemic liquidity ratio in pesos, which includes only withdrawals, remained without significant changes compared to last month, totaling 13% of deposits in national currency (+1.3 p.p. y.o.y.). The broad liquidity indicator in pesos reached 46.6% of deposits in pesos, increasing 1.2 p.p. compared to May (-16.4 p.p. y.o.y.). The liquidity ratio in foreign currency increased by 2.3 p.p. in the period, reaching 60.4% of deposits in the same denomination (-14.1 p.p. y.o.y.).
Solvency indicators for all banks remained at relatively high levels at the end of the first half of the year. In June, the capital integration ratio for the financial system stood at 28.1% of risk-weighted assets (RWA), down 1.2 p.p. compared to last month. The aggregate excess of capital (net integration of the minimum regulatory requirement) with respect to the regulatory requirement totaled 247% in the period (-15 p.p. compared to May). All groups of financial institutions had leverage levels – calculated in accordance with the Basel Committee guidelines – well above the regulatory minimum (3%).
In the first half of 2025, the financial system presented positive results equivalent to 1.2% annualized -a.- of assets (ROA) and 4.9%y. of net worth (ROE), below the levels recorded in the previous semester. In the cumulative 12 months to June, the ROA of all financial institutions totaled 1.4% (ROE of 5.7%), reducing 5.6 p.p. in year-on-year terms (-24.3 p.p. y.o. in ROE).
I. Financial intermediation activity
Financial intermediation activity with the private sector continued to grow in June. Taking into account the main movements (in homogeneous currency) of the balance sheet of the set of financial institutions for the segment in pesos, the increase in the balance of deposits (private and public sector) and the fall in LEFIs were the main sources of funds in the month. These resources were mainly channeled to increase the real balance of credit to the private sector. With respect to foreign currency items, the balance of private sector deposits and funding increased during the period through the issuance of negotiable bonds, with an increase in liquid assets and credit to the private sector as a counterpart. 1
In June, the real balance of credit to the private sector in pesos increased 4.2% compared to the previous month. The performance in the period was generalized among the groups of financial institutions and was mainly explained by commercial lines, followed by loans with real collateral (5.6% real and 4% real respectively, see Chart 1). In a year-on-year comparison, the real balance of financing to the private sector in pesos accumulated a growth of 78.1%, with greater relative dynamism in the consumer segment.
Graph 1 | Real balance of credit to the private sector in pesos*
Monthly changes
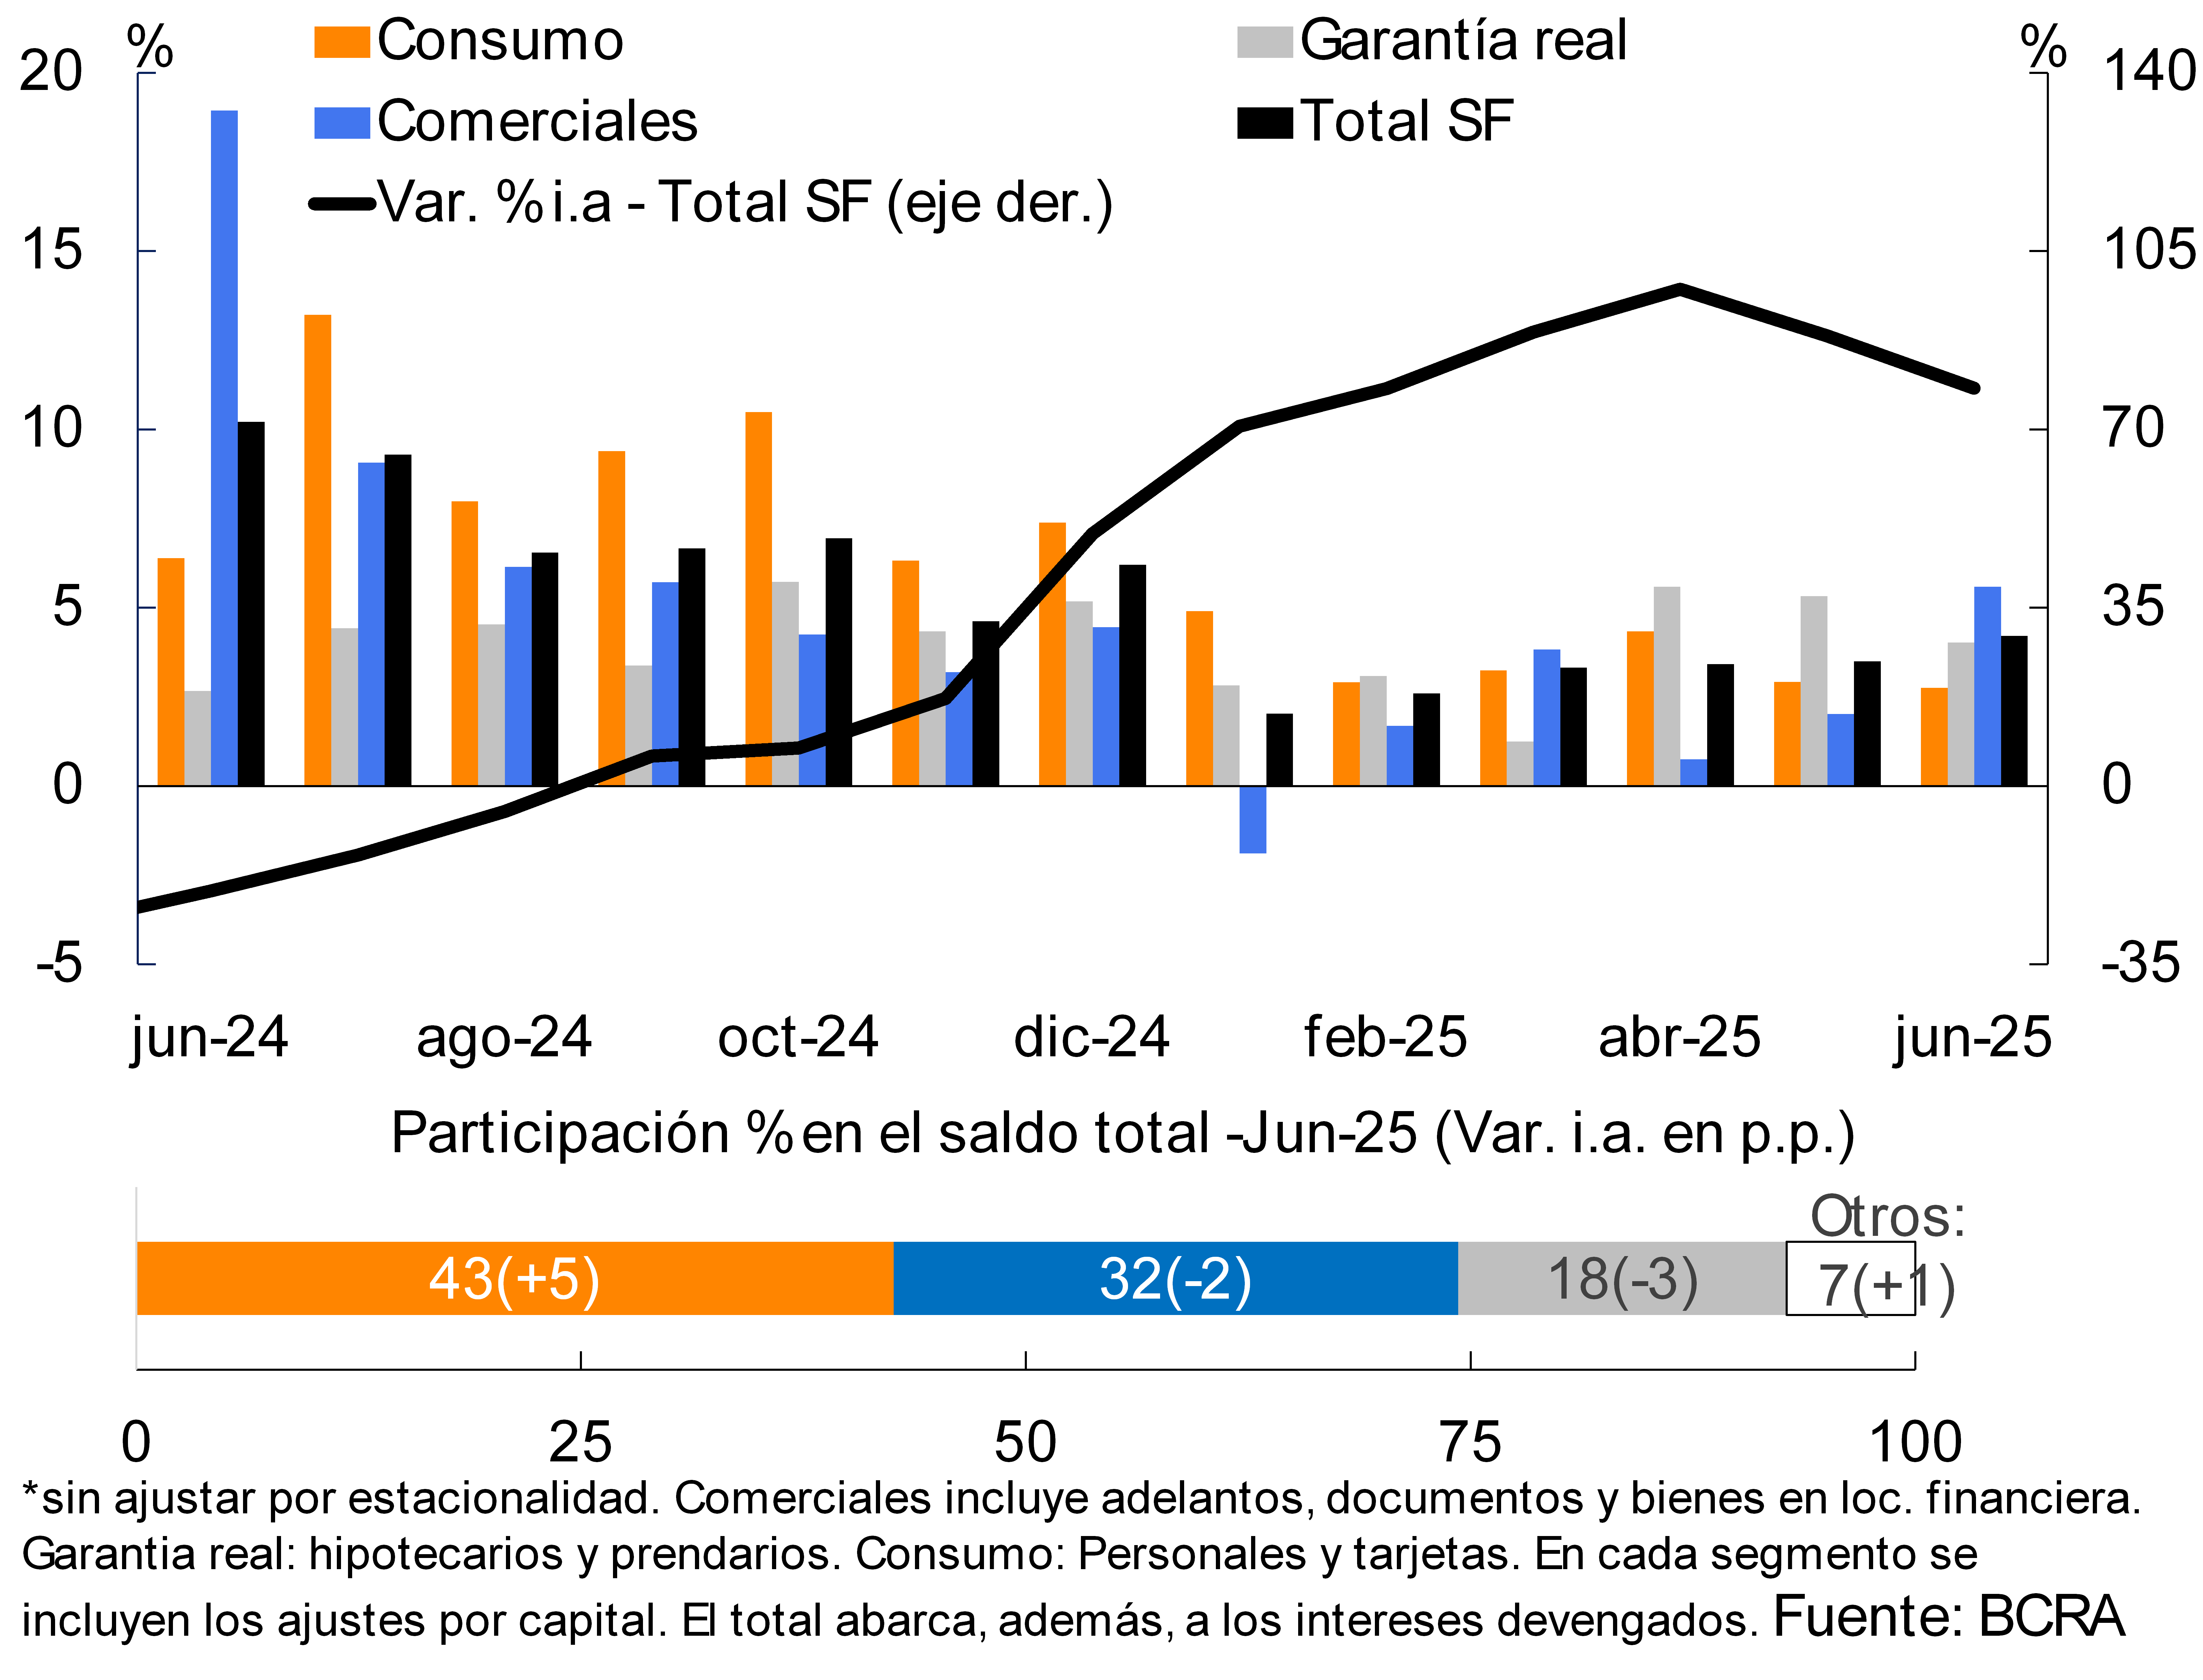
Chart 2 : Foreign currency financial intermediation to the private sector
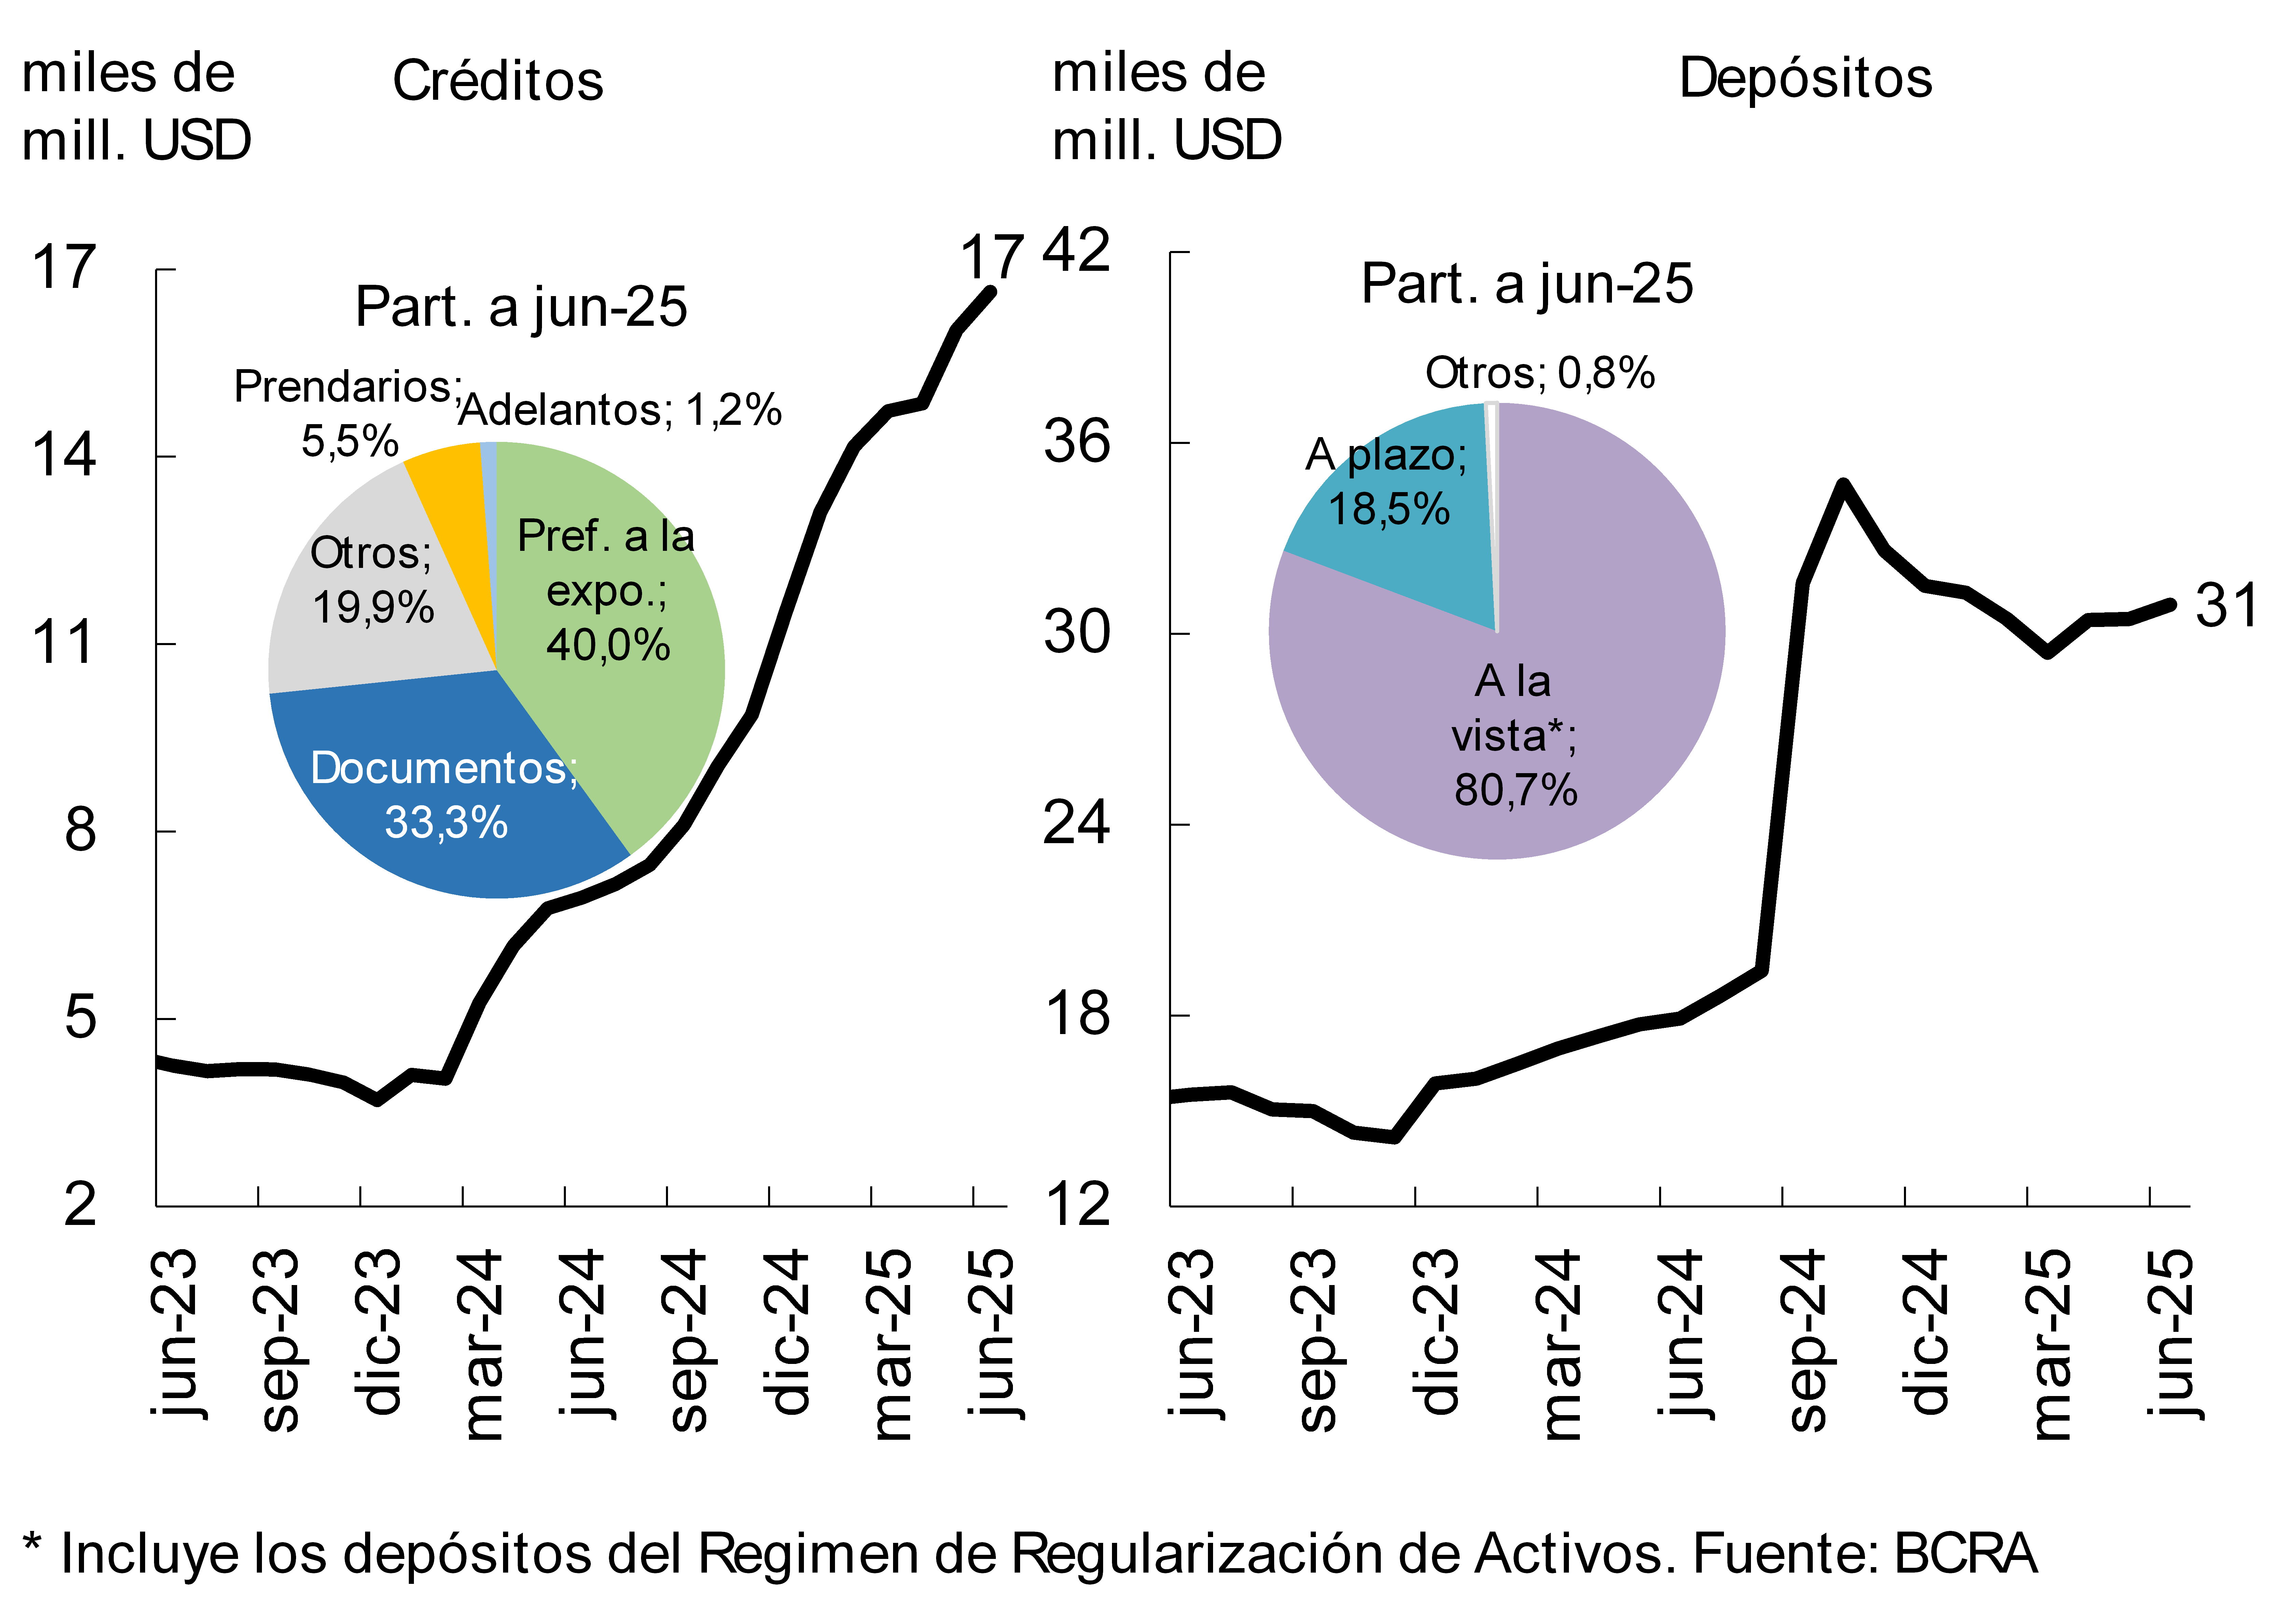
The balance of credit to the private sector in foreign currency grew 3.8% at the systemic level between the peak of the month – in currency of origin – (see Graph 2). The increase in the period was mainly explained by the performance of private banks (more than 84% of the growth in the month) and by commercial lines. In year-on-year terms, the balance of financing in foreign currency to the private sector accumulated an increase of 139.8% -in currency of origin-.
The real balance of total financing (in domestic and foreign currency) to the private sector increased 3.8% between the peak of the month. The real balance of total credit to companies2 grew 4.8% in June (78.4% real y.o.y.), with a greater relative increase in loans to firms providing services and those linked to trade activity (9.2% real and 6.3% real in the month, respectively). For its part, the real balance of loans to households increased 2.4% in the month, highlighting the growth of mortgage loans and cards (3.8% real and 2.5% real monthly respectively).
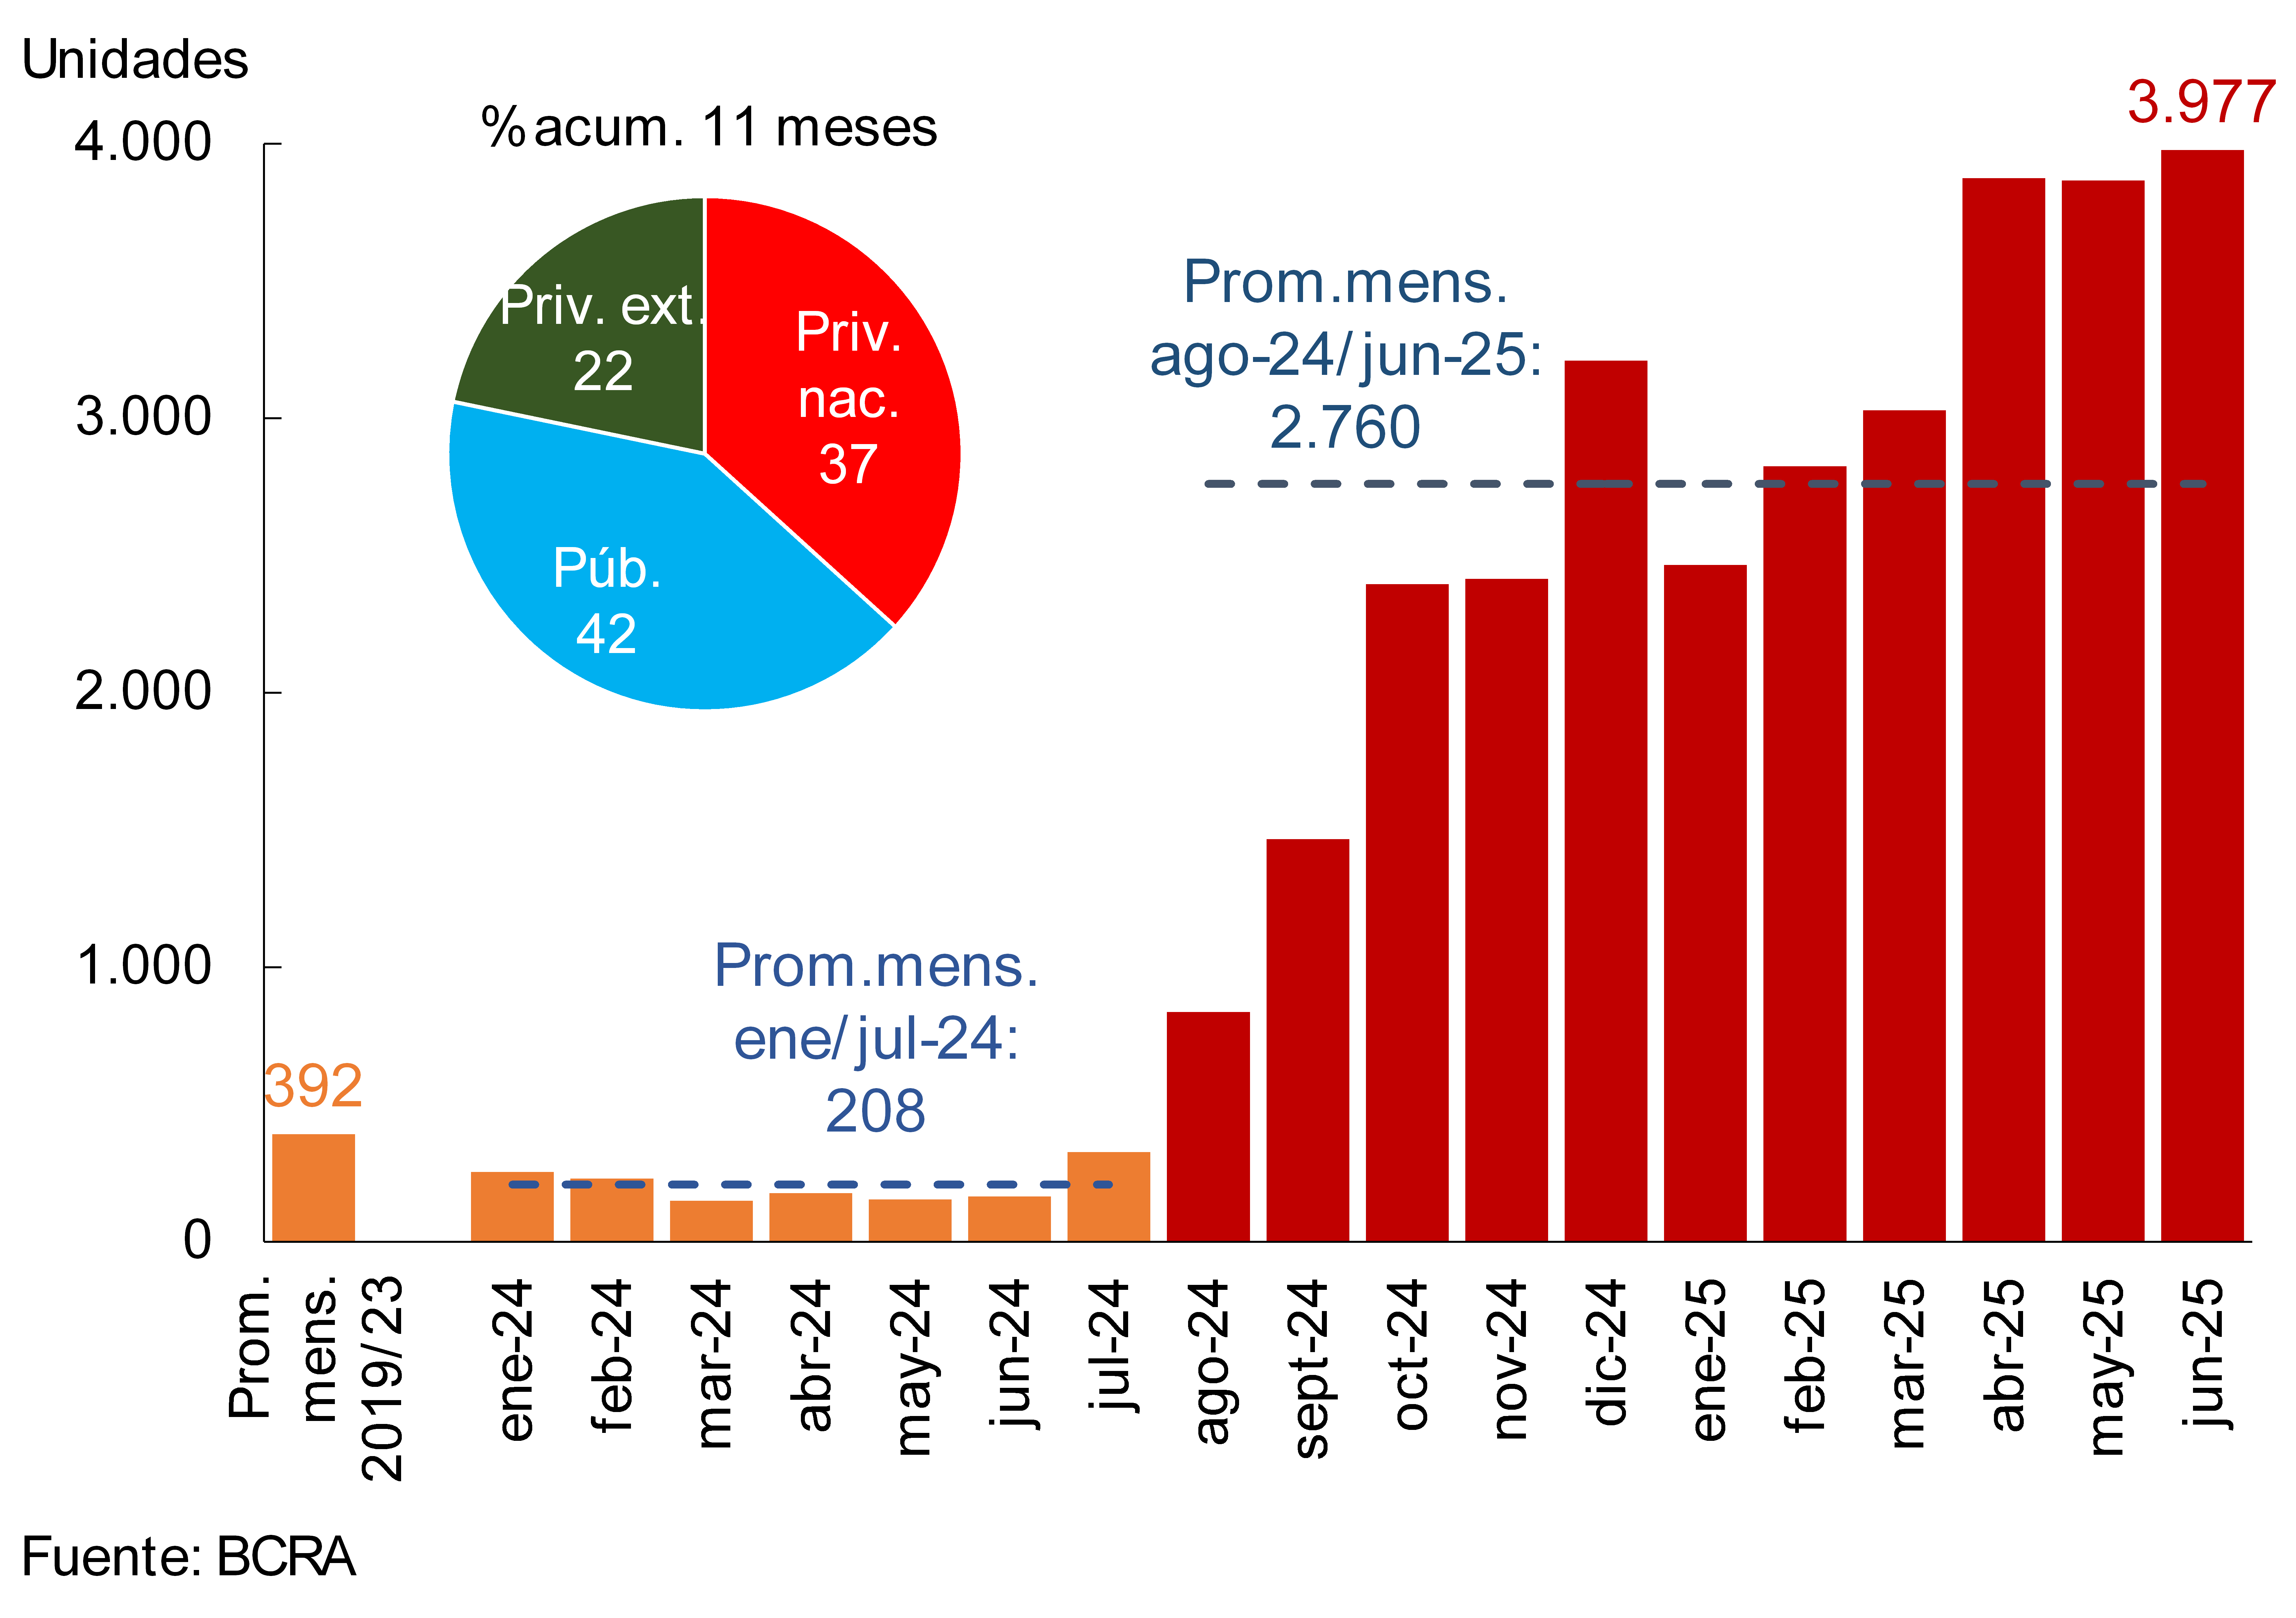
In June, it is estimated that the financial system incorporated nearly 4,000 new mortgage borrowers (-registrations- of individuals, see Graph 3), a level that remains in line with those registered in the previous two months. In the cumulative period between August 2024 (the month in which the UVA segment began to be energized) and June 2025, approximately 30,400 new debtors were added to the financial system (it is estimated that the current number of mortgage debtors in UVA amounts to almost 125,000).
Graph 3 | Estimation of mortgage registrations (individuals)
Financial system
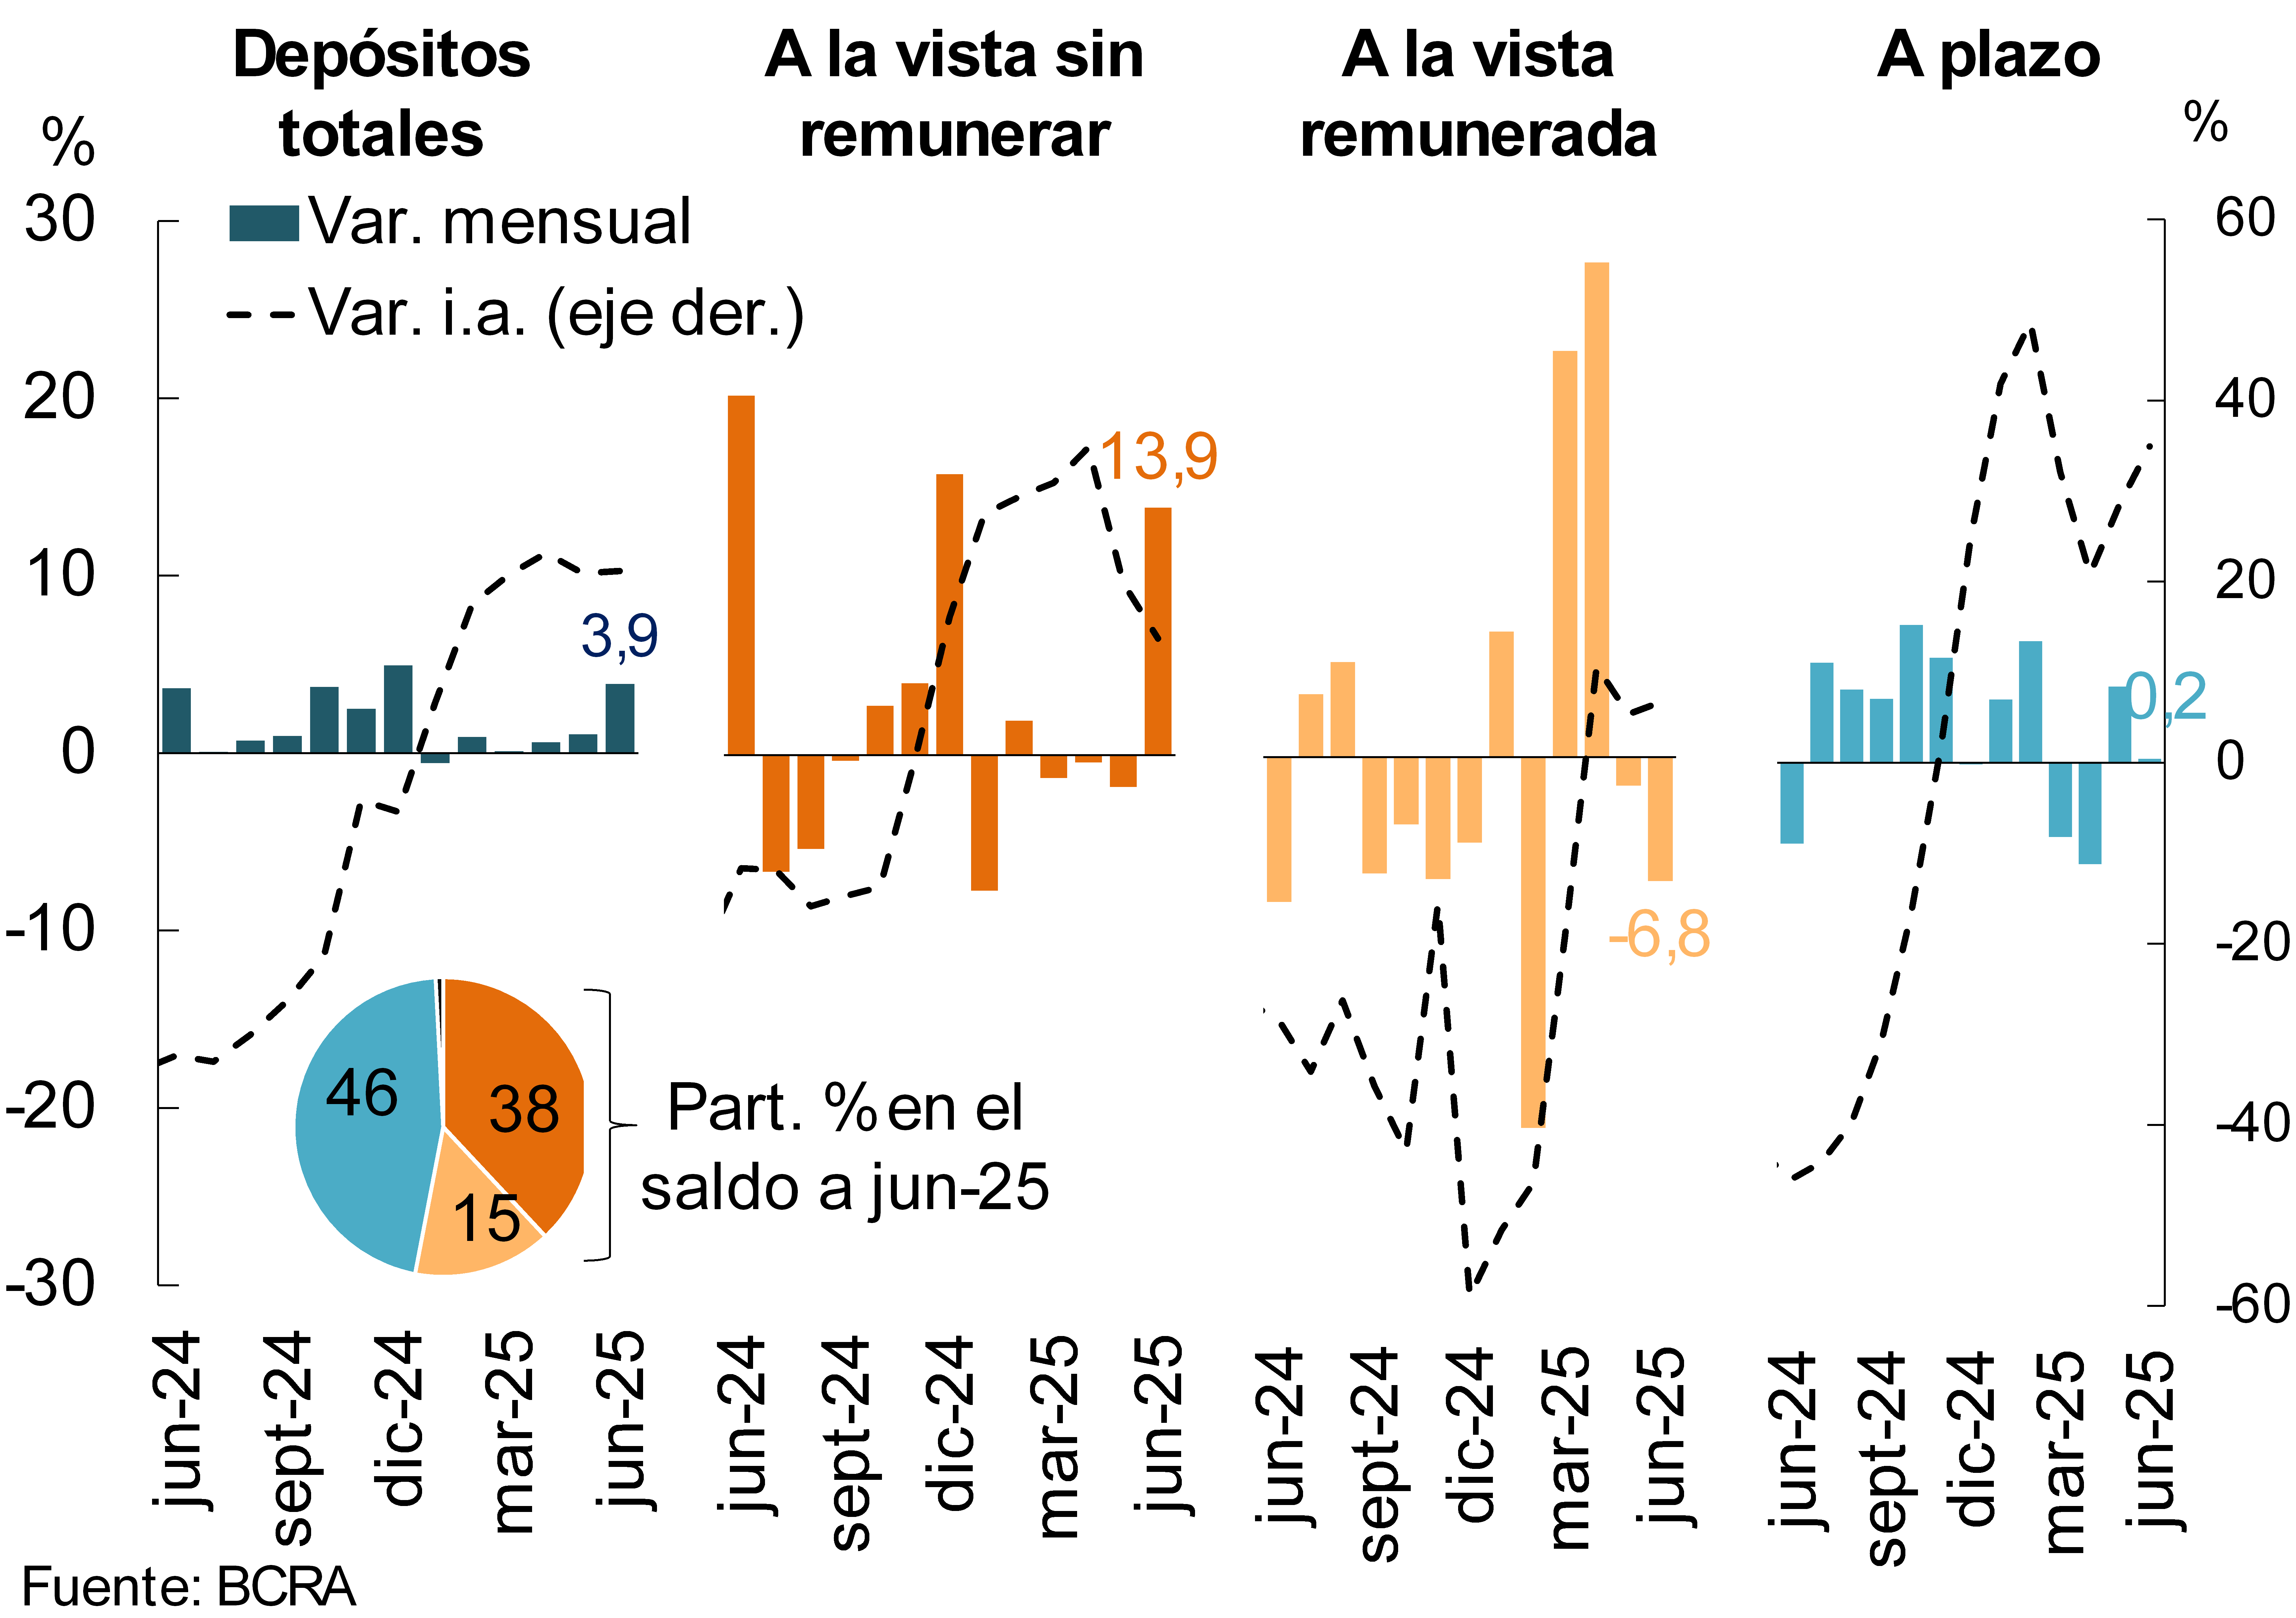
With regard to the funding of all financial institutions, the real balance of private sector deposits in pesos increased by 3.9% in real terms in the month (see Chart 4). The monthly increase was mainly explained by demand accounts, which grew 7.1% in real terms compared to May, partly reflecting the impact of the payment of the half bonus. Non-interest-bearing demand accounts increased 13.9% in real terms in the period, more than offsetting the 6.8% drop in demand deposits that pay interest rates. The real balance of time deposits in pesos in the private sector remained unchanged in magnitude in the month (0.2% in real terms). In a year-on-year comparison, the real balance of private sector deposits in pesos accumulated an increase of 20.5%, with increases in all deposit segments.
Graph 4: Real balance of private sector deposits in pesos*.
As for the foreign currency segment, in June the balance of private sector deposits increased 1.5% compared to May and 72.7% in year-on-year terms -in currency of origin- (see Chart 2). The real balance of total deposits (considering all sectors and currencies) grew 2.1% in the month, accumulating a year-on-year increase of 23.7%.
II. Evolution and aggregate composition of the balance sheet
In June, the total assets of the financial system grew 1.9% in real terms, accumulating a year-on-year increase of 15.1% in real terms.
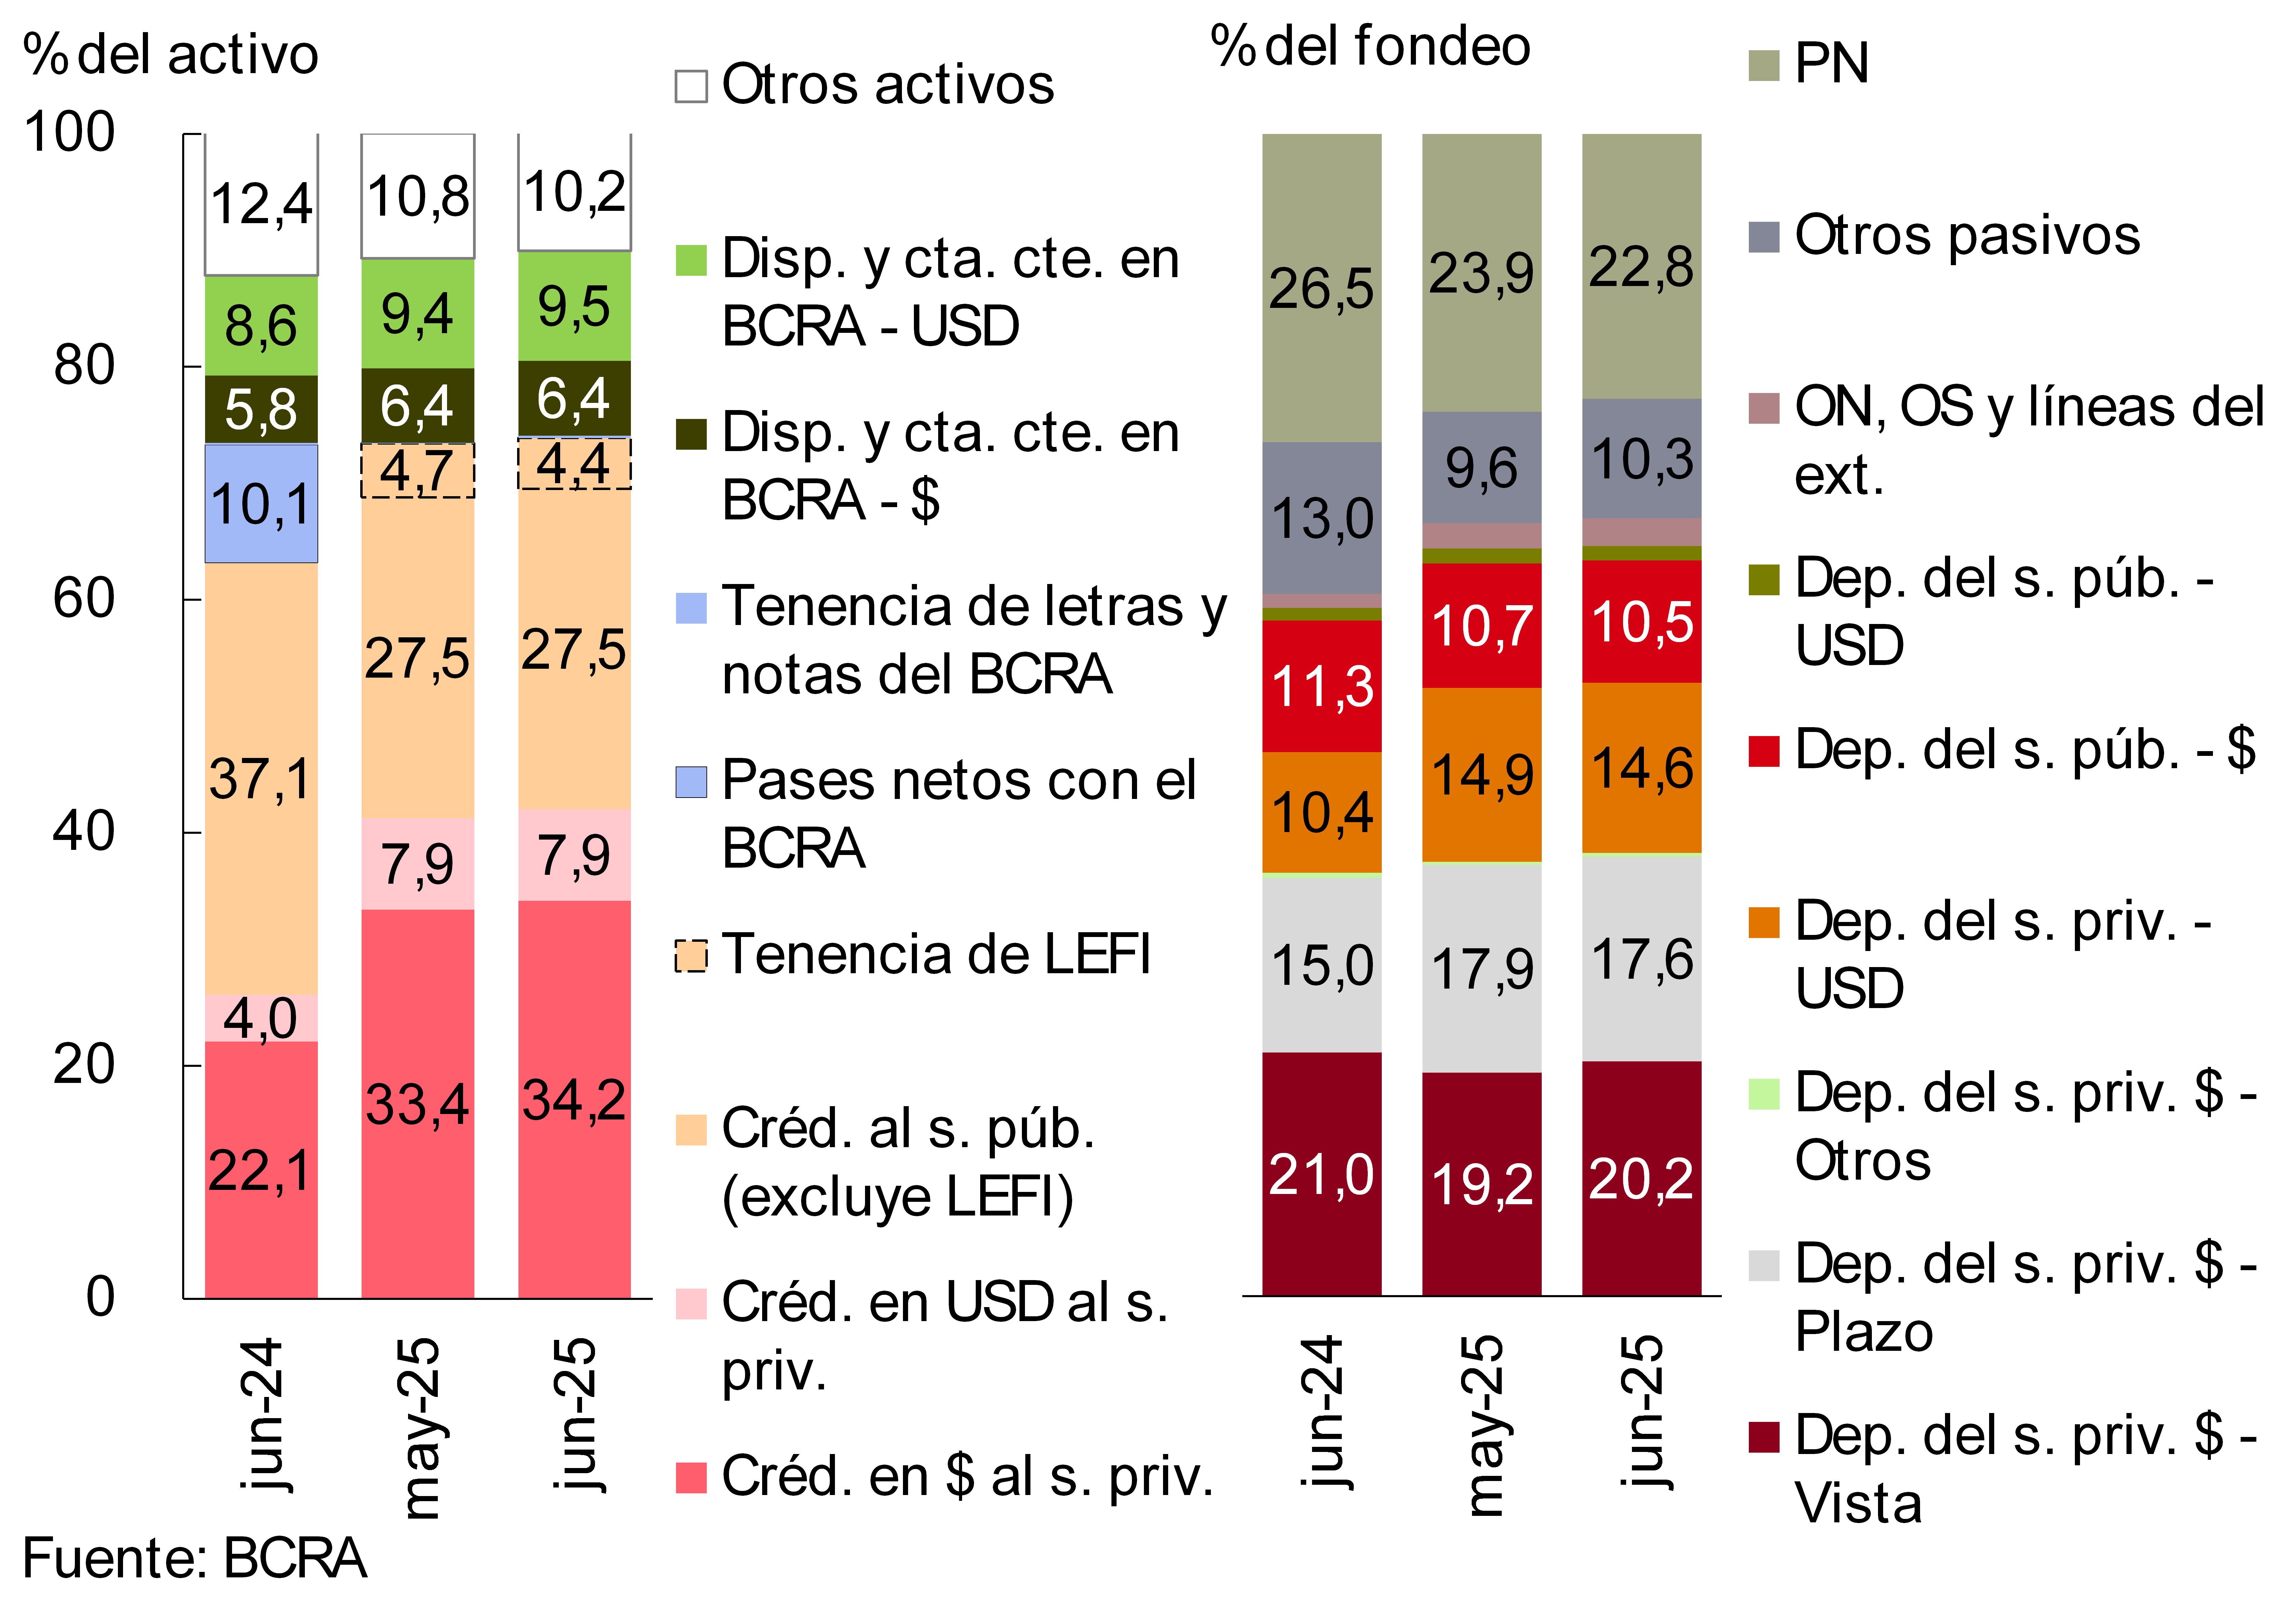
During the month, the share of credit to the private sector within the total assets of financial institutions continued to increase, while exposure to the public sector continued to decline (to 31.8%). 3 As a result, the gap between the two components widened to 10.2 p.p. of the asset (see Chart 5). Regarding the composition of the funding of the group of entities, between the beginning of the month the share of demand deposits in pesos of the private sector grew, while the relative weight of net worth decreased.
Chart 5 – Composition of assets and funding
Financial system – In % share
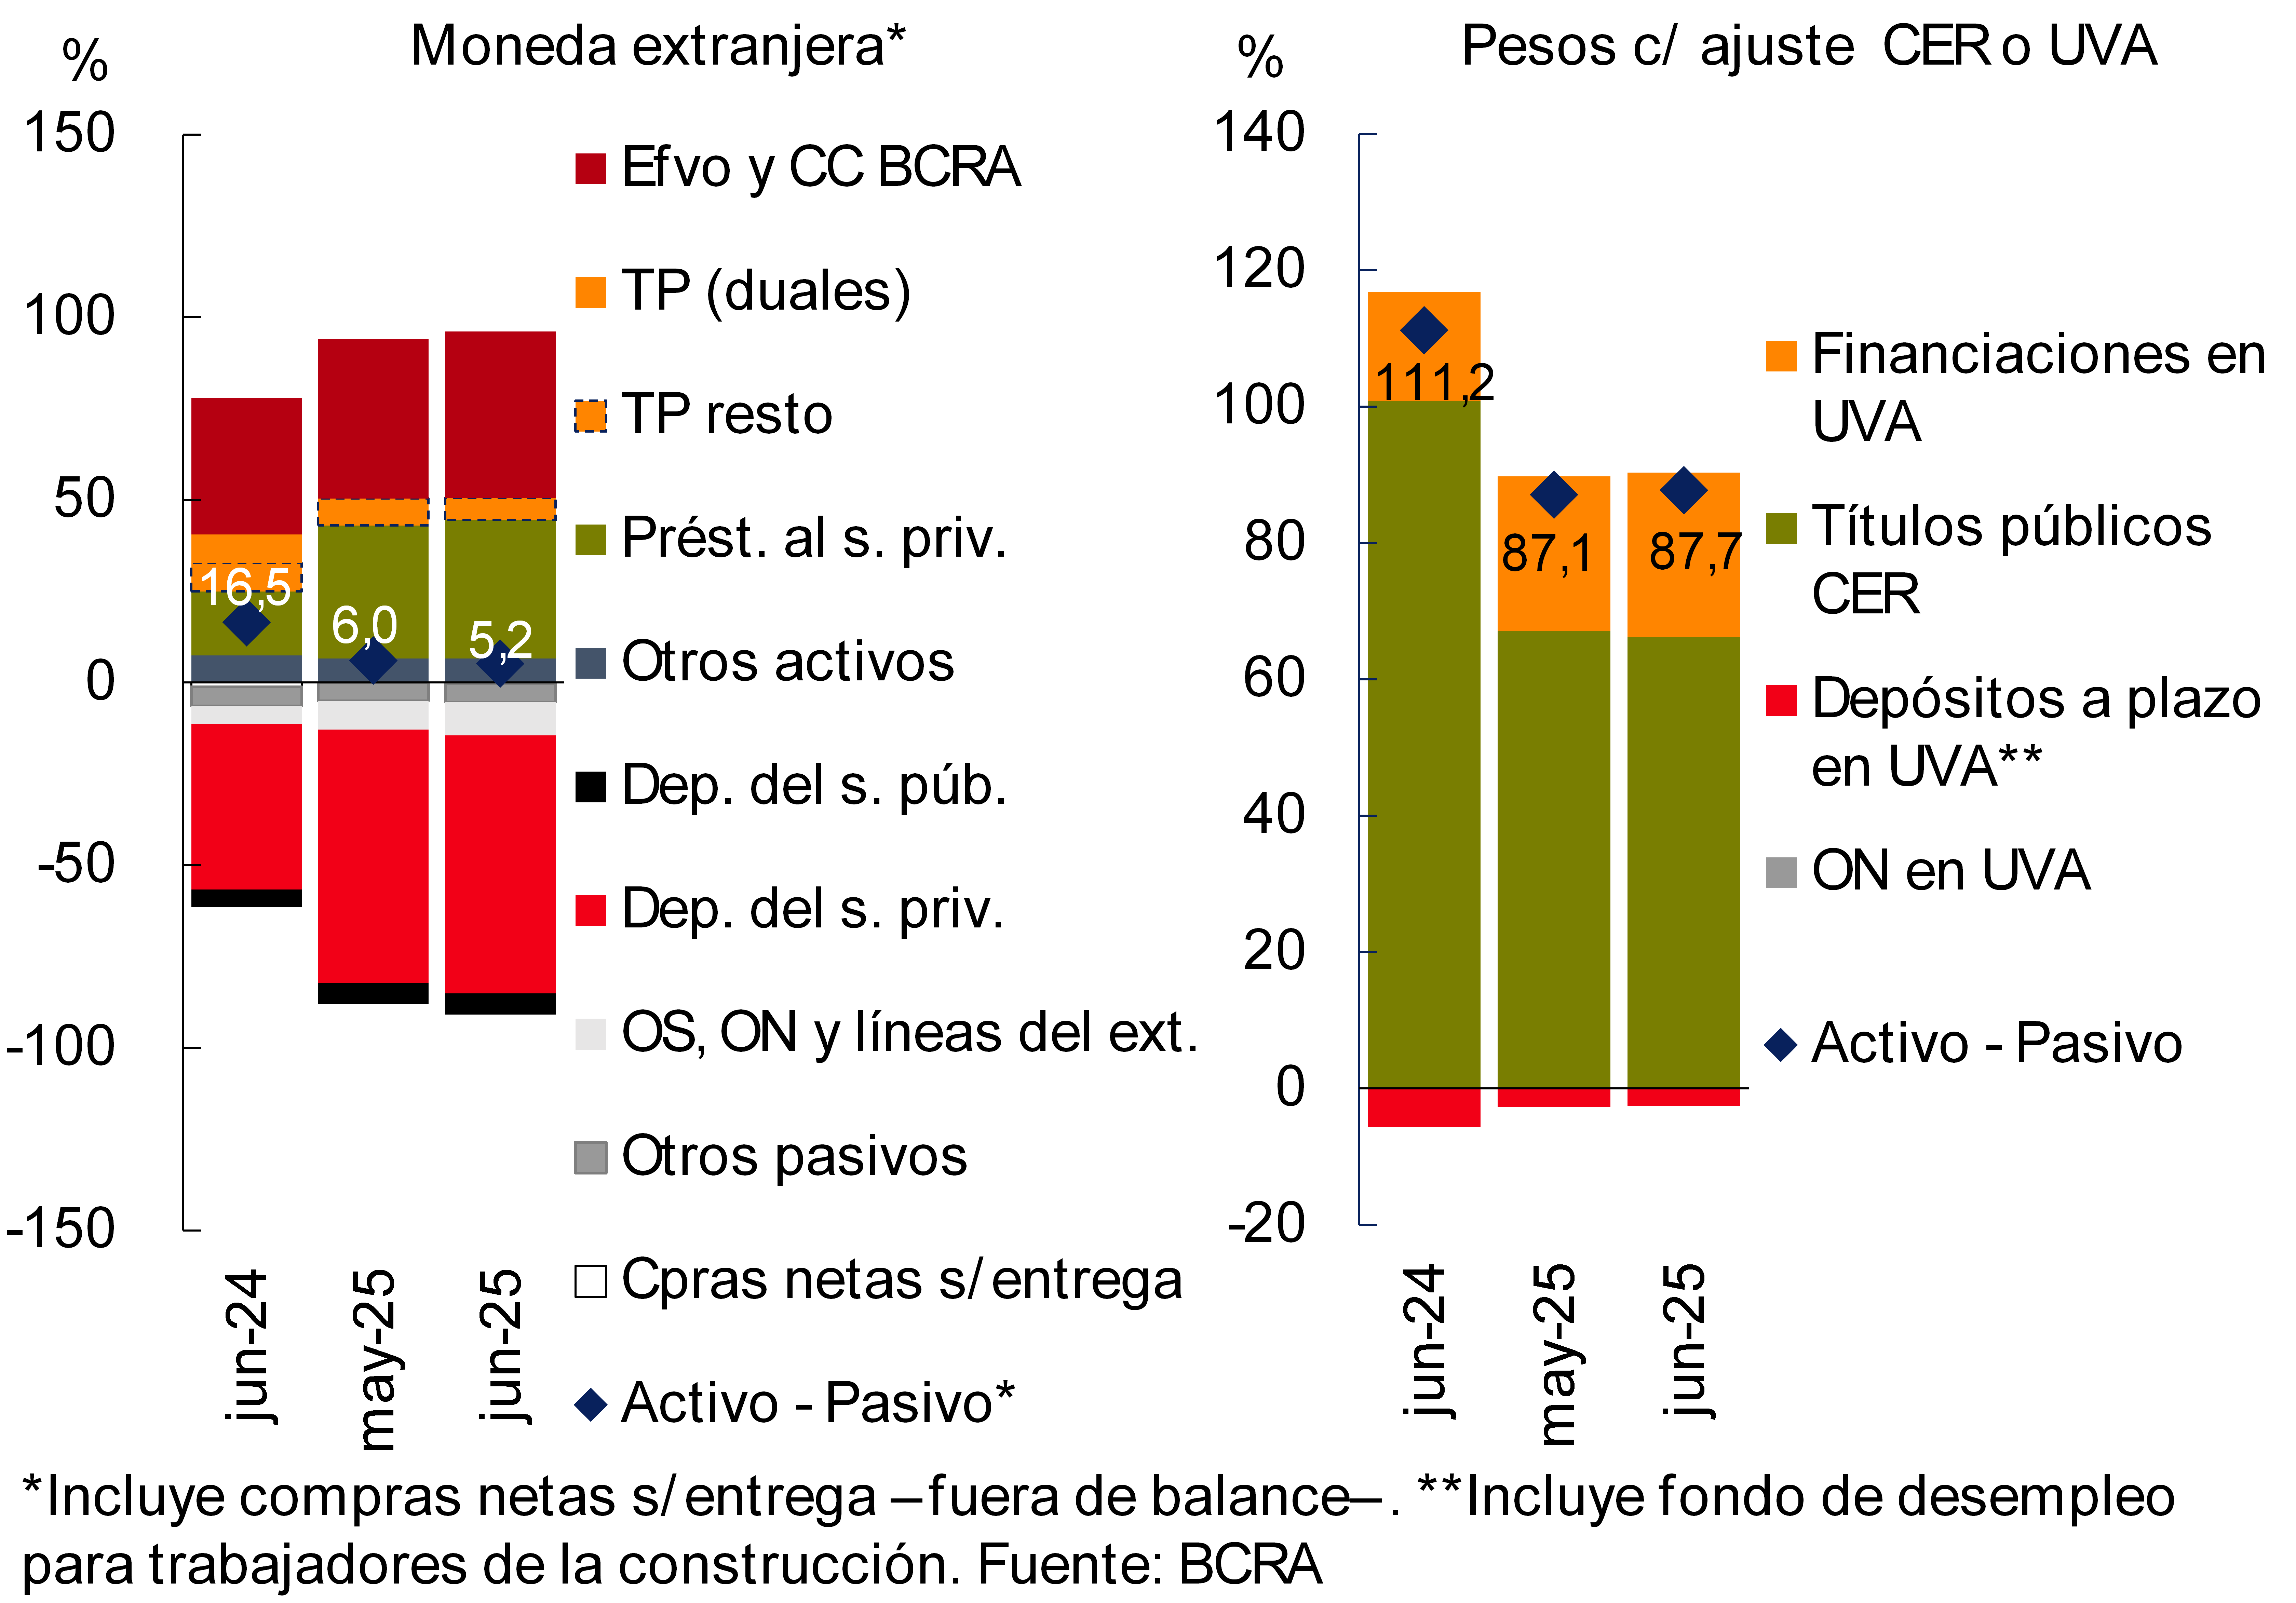
The estimated difference between assets and liabilities in foreign currency -considering off-balance sheet transactions for the purchase and sale of foreign currency- stood at 5.2% of the regulatory capital of the financial system in the period (-0.8 p.p. compared to May and -11.3 p.p. y.o.y.; see Figure 6). On the other hand, the difference between assets and liabilities with a CER adjustment clause (or agreed in UVA) totaled 87.7% of the sector’s regulatory capital, presenting a slight monthly increase of 0.7 p.p., although 23.5 p.p. below the level observed a year ago (see Graph 6).
Graph 6 | Spread between assets and liabilities
In % of the PRC – Financial system
III. Portfolio quality
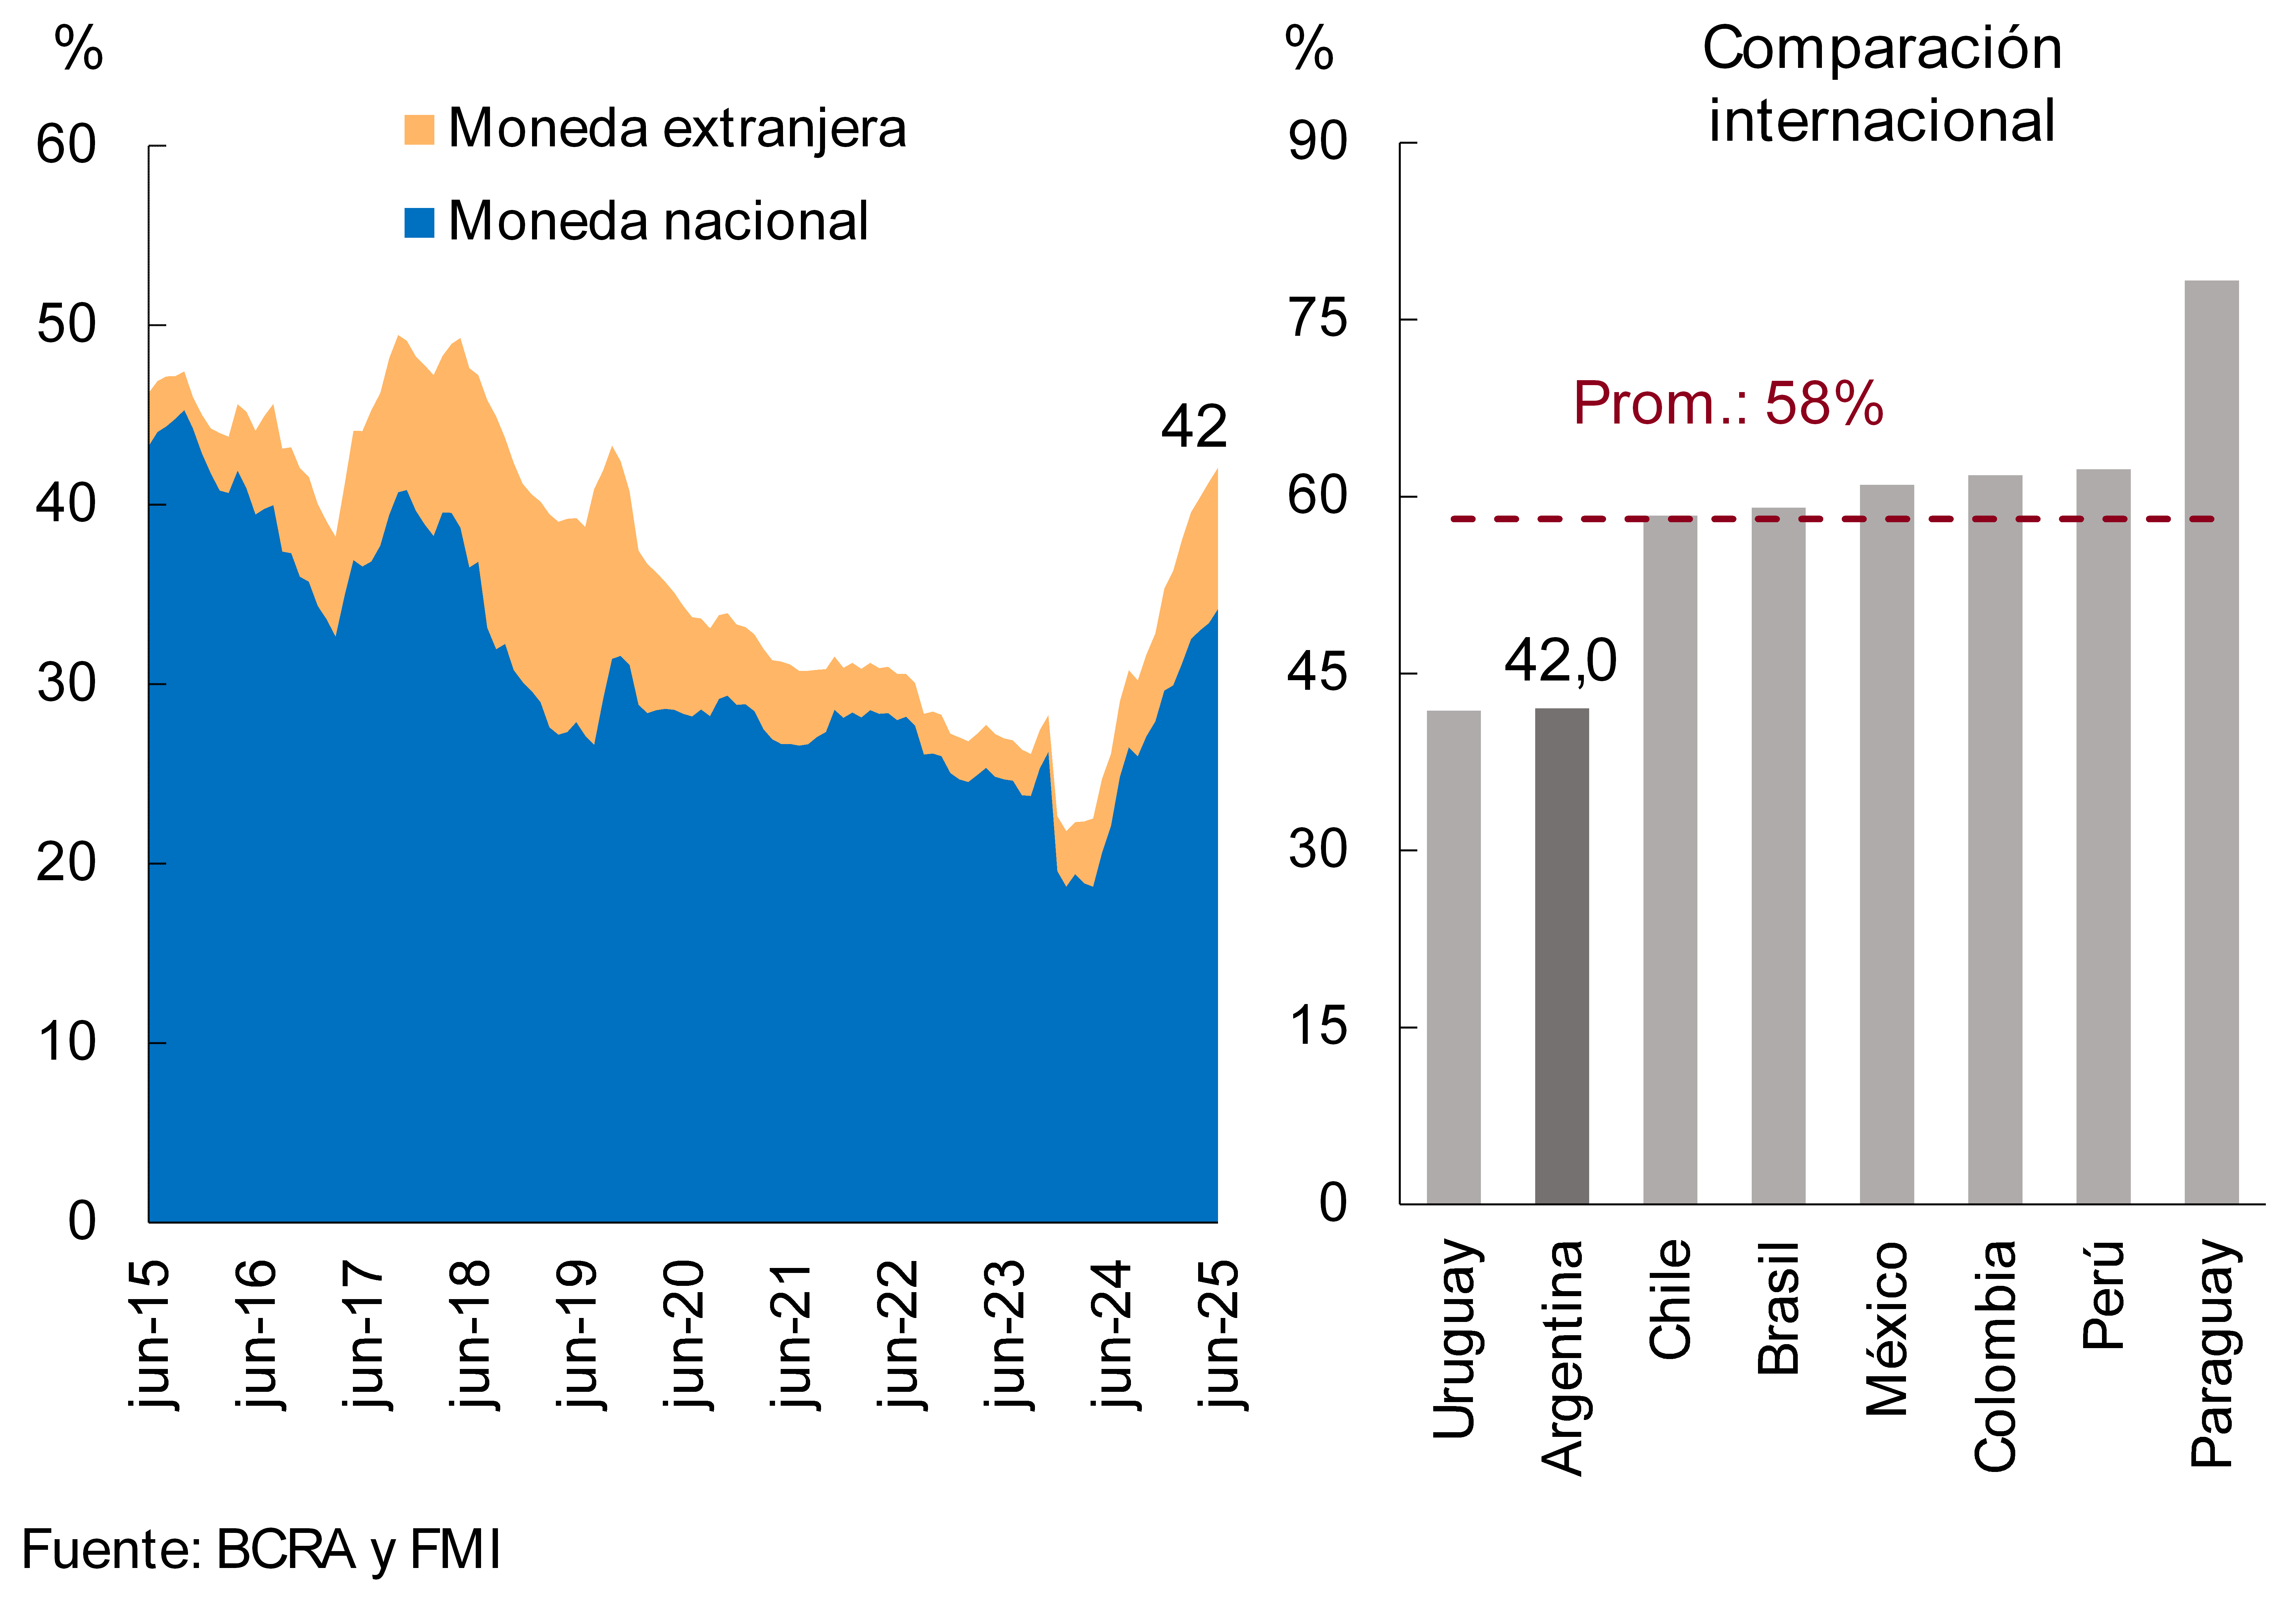
In June, the financial system’s exposure to the private sector reached 42% of total assets, increasing 0.8 p.p. compared to last month (see Chart 7). The monthly performance was mainly explained by the segment in pesos (+0.8 p.p., totaling 34.2%). Credit exposure to the private sector in foreign currency remained unchanged in magnitude in the month (at 7.9% of assets). In a year-on-year comparison, the total credit balance to companies and households accumulated an increase of 15.9 p.p. in assets, with increases in all groups of financial institutions and currency segments. 4 The current levels of this exposure indicator exceeded the average of the last 10 years (36.8% of assets), although they continue to be below the values observed in other countries of the region (average of 58%).
Figure 7 | Balance of credit to the private sector in terms of assets
Financial system
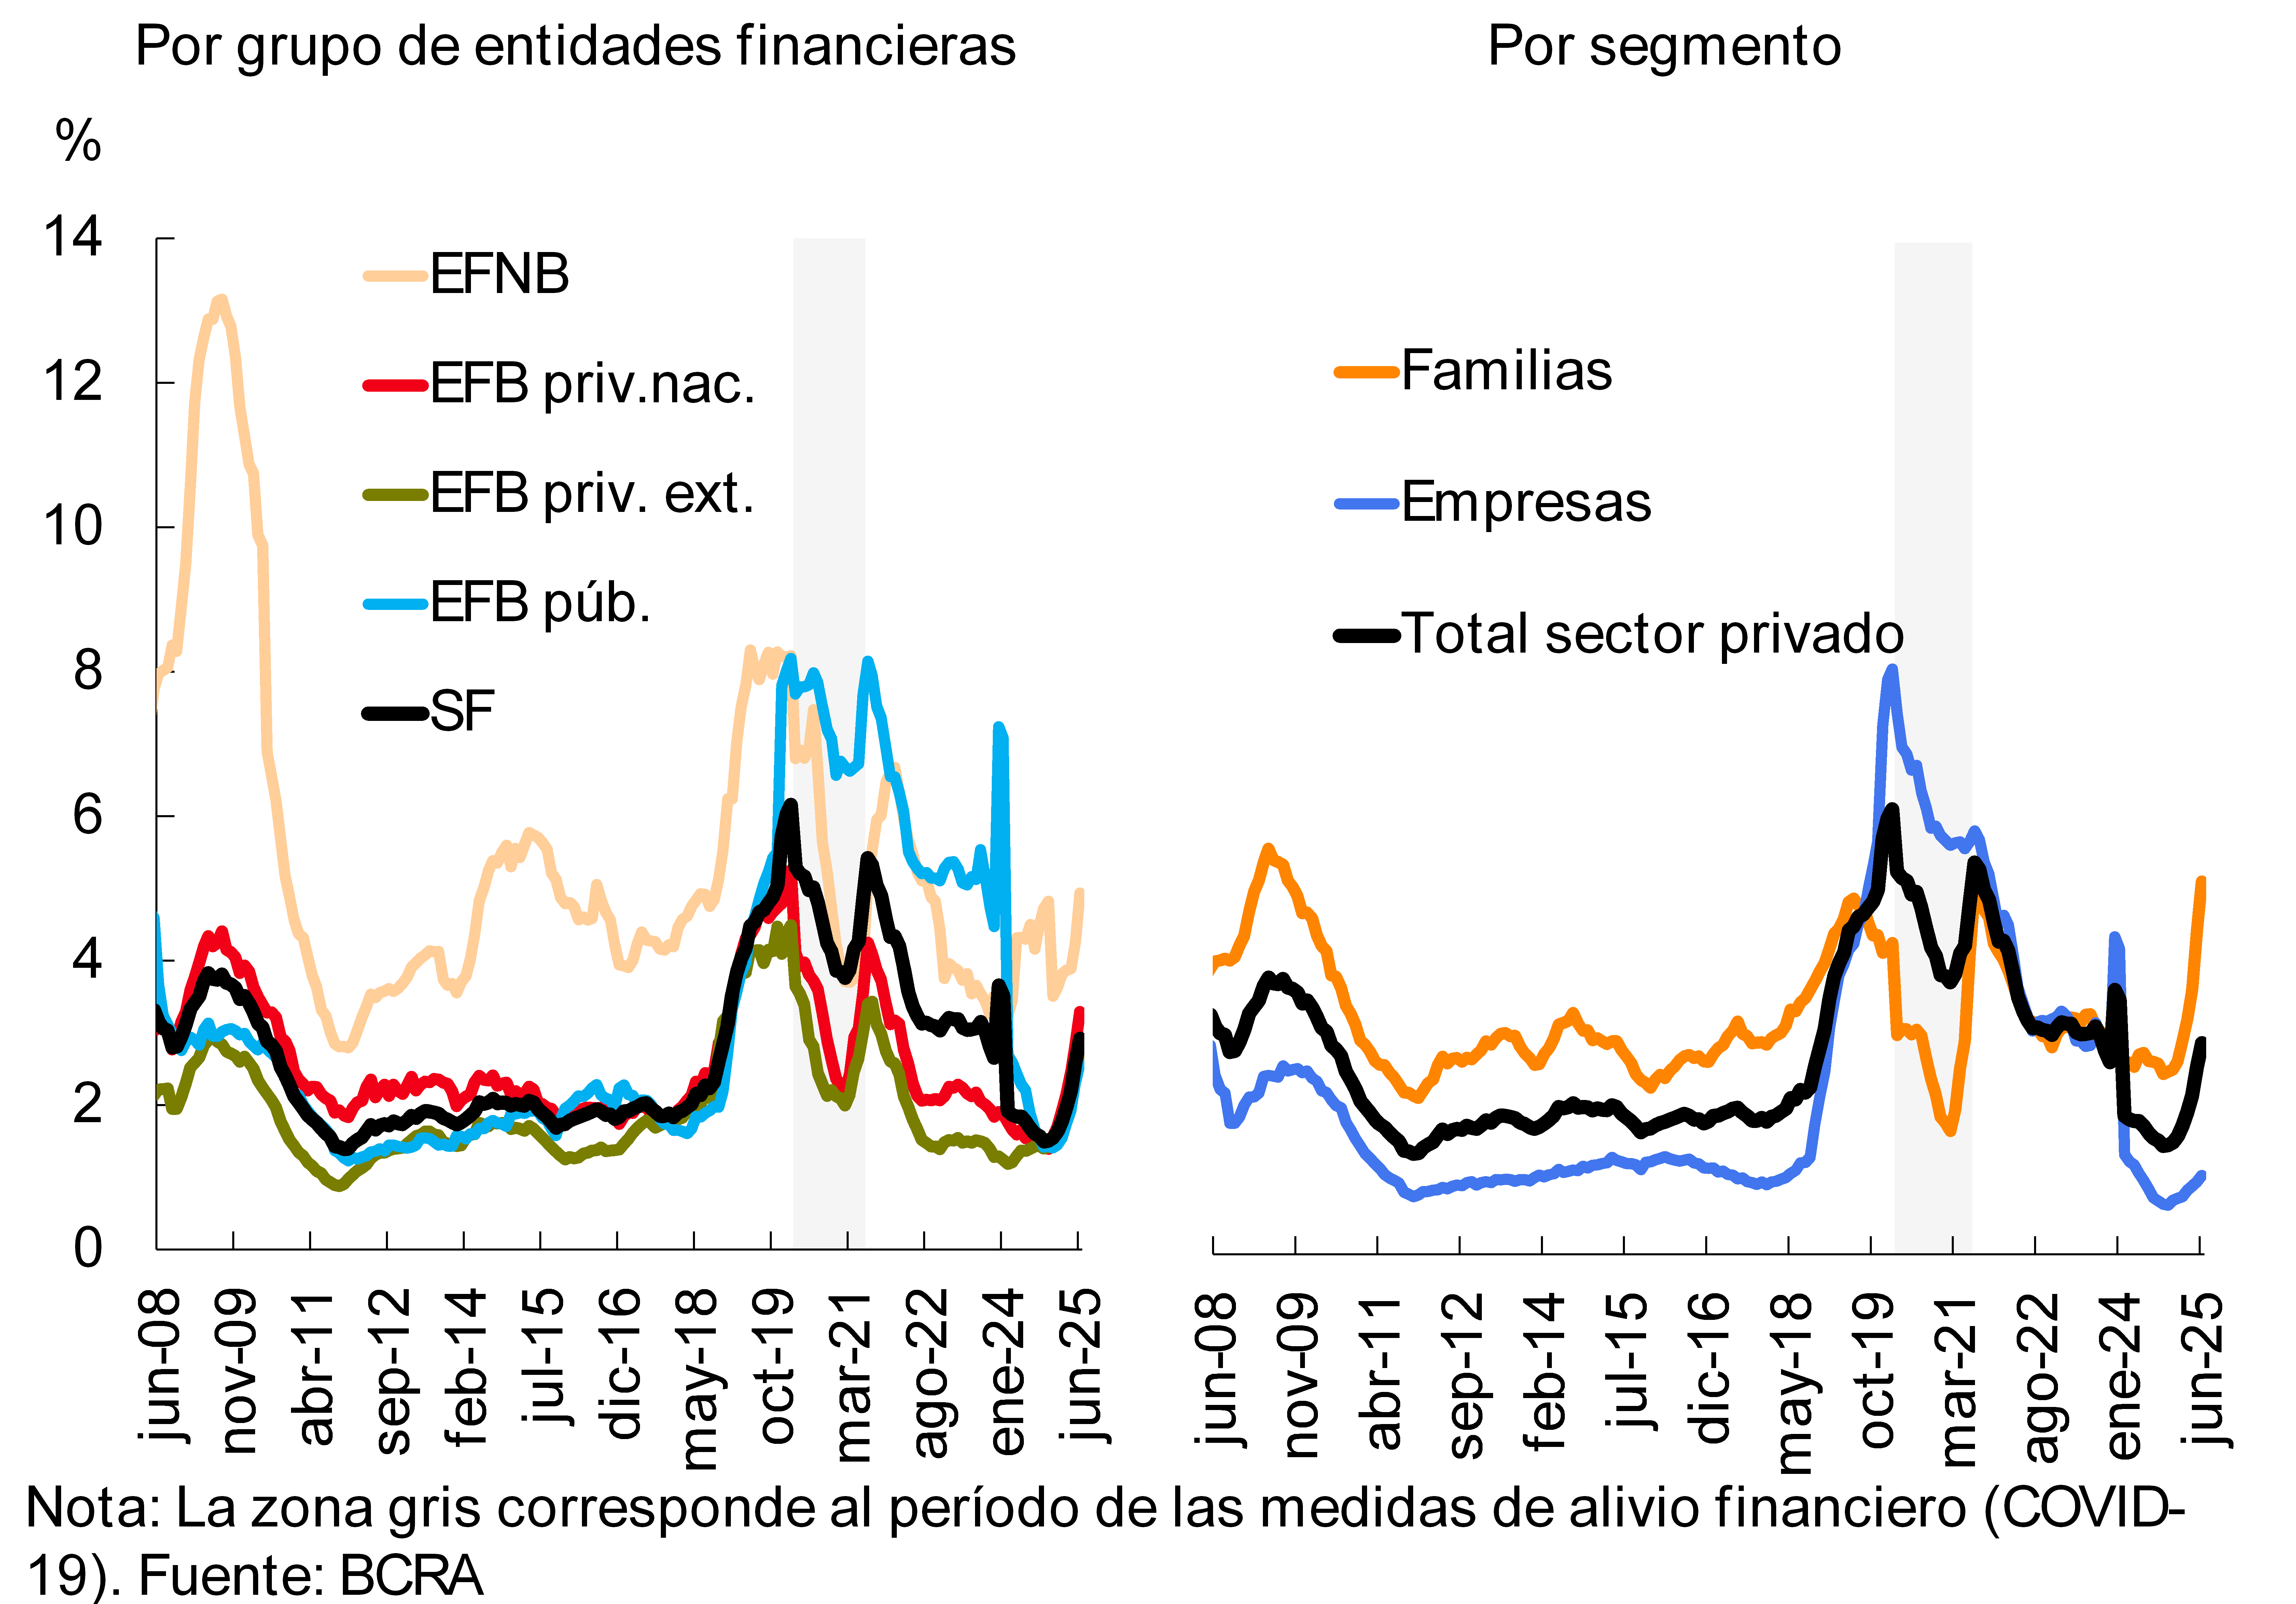
The non-performing loan ratio for private sector loans stood at 2.9% in June, 0.3 p.p. above the May figure (see Chart 8). The increase in the indicator was widespread among groups of financial institutions. The NPL ratio of credit to households reached 5.2% in the month, above last month (mainly due to lines destined for consumption). The ratio of irregularity of financing to companies totaled 1.1%, remaining without significant changes compared to the May record.
Chart 8: Private sector credit irregularity ratio
The balance of accounting forecasts represented a magnitude equivalent to 119% of the balance of the portfolio in an irregular situation (-11 p.p. monthly) and 3.5% of the balance of total financing to the private sector (+0.1 p.p. monthly).
IV. Liquidity and solvency
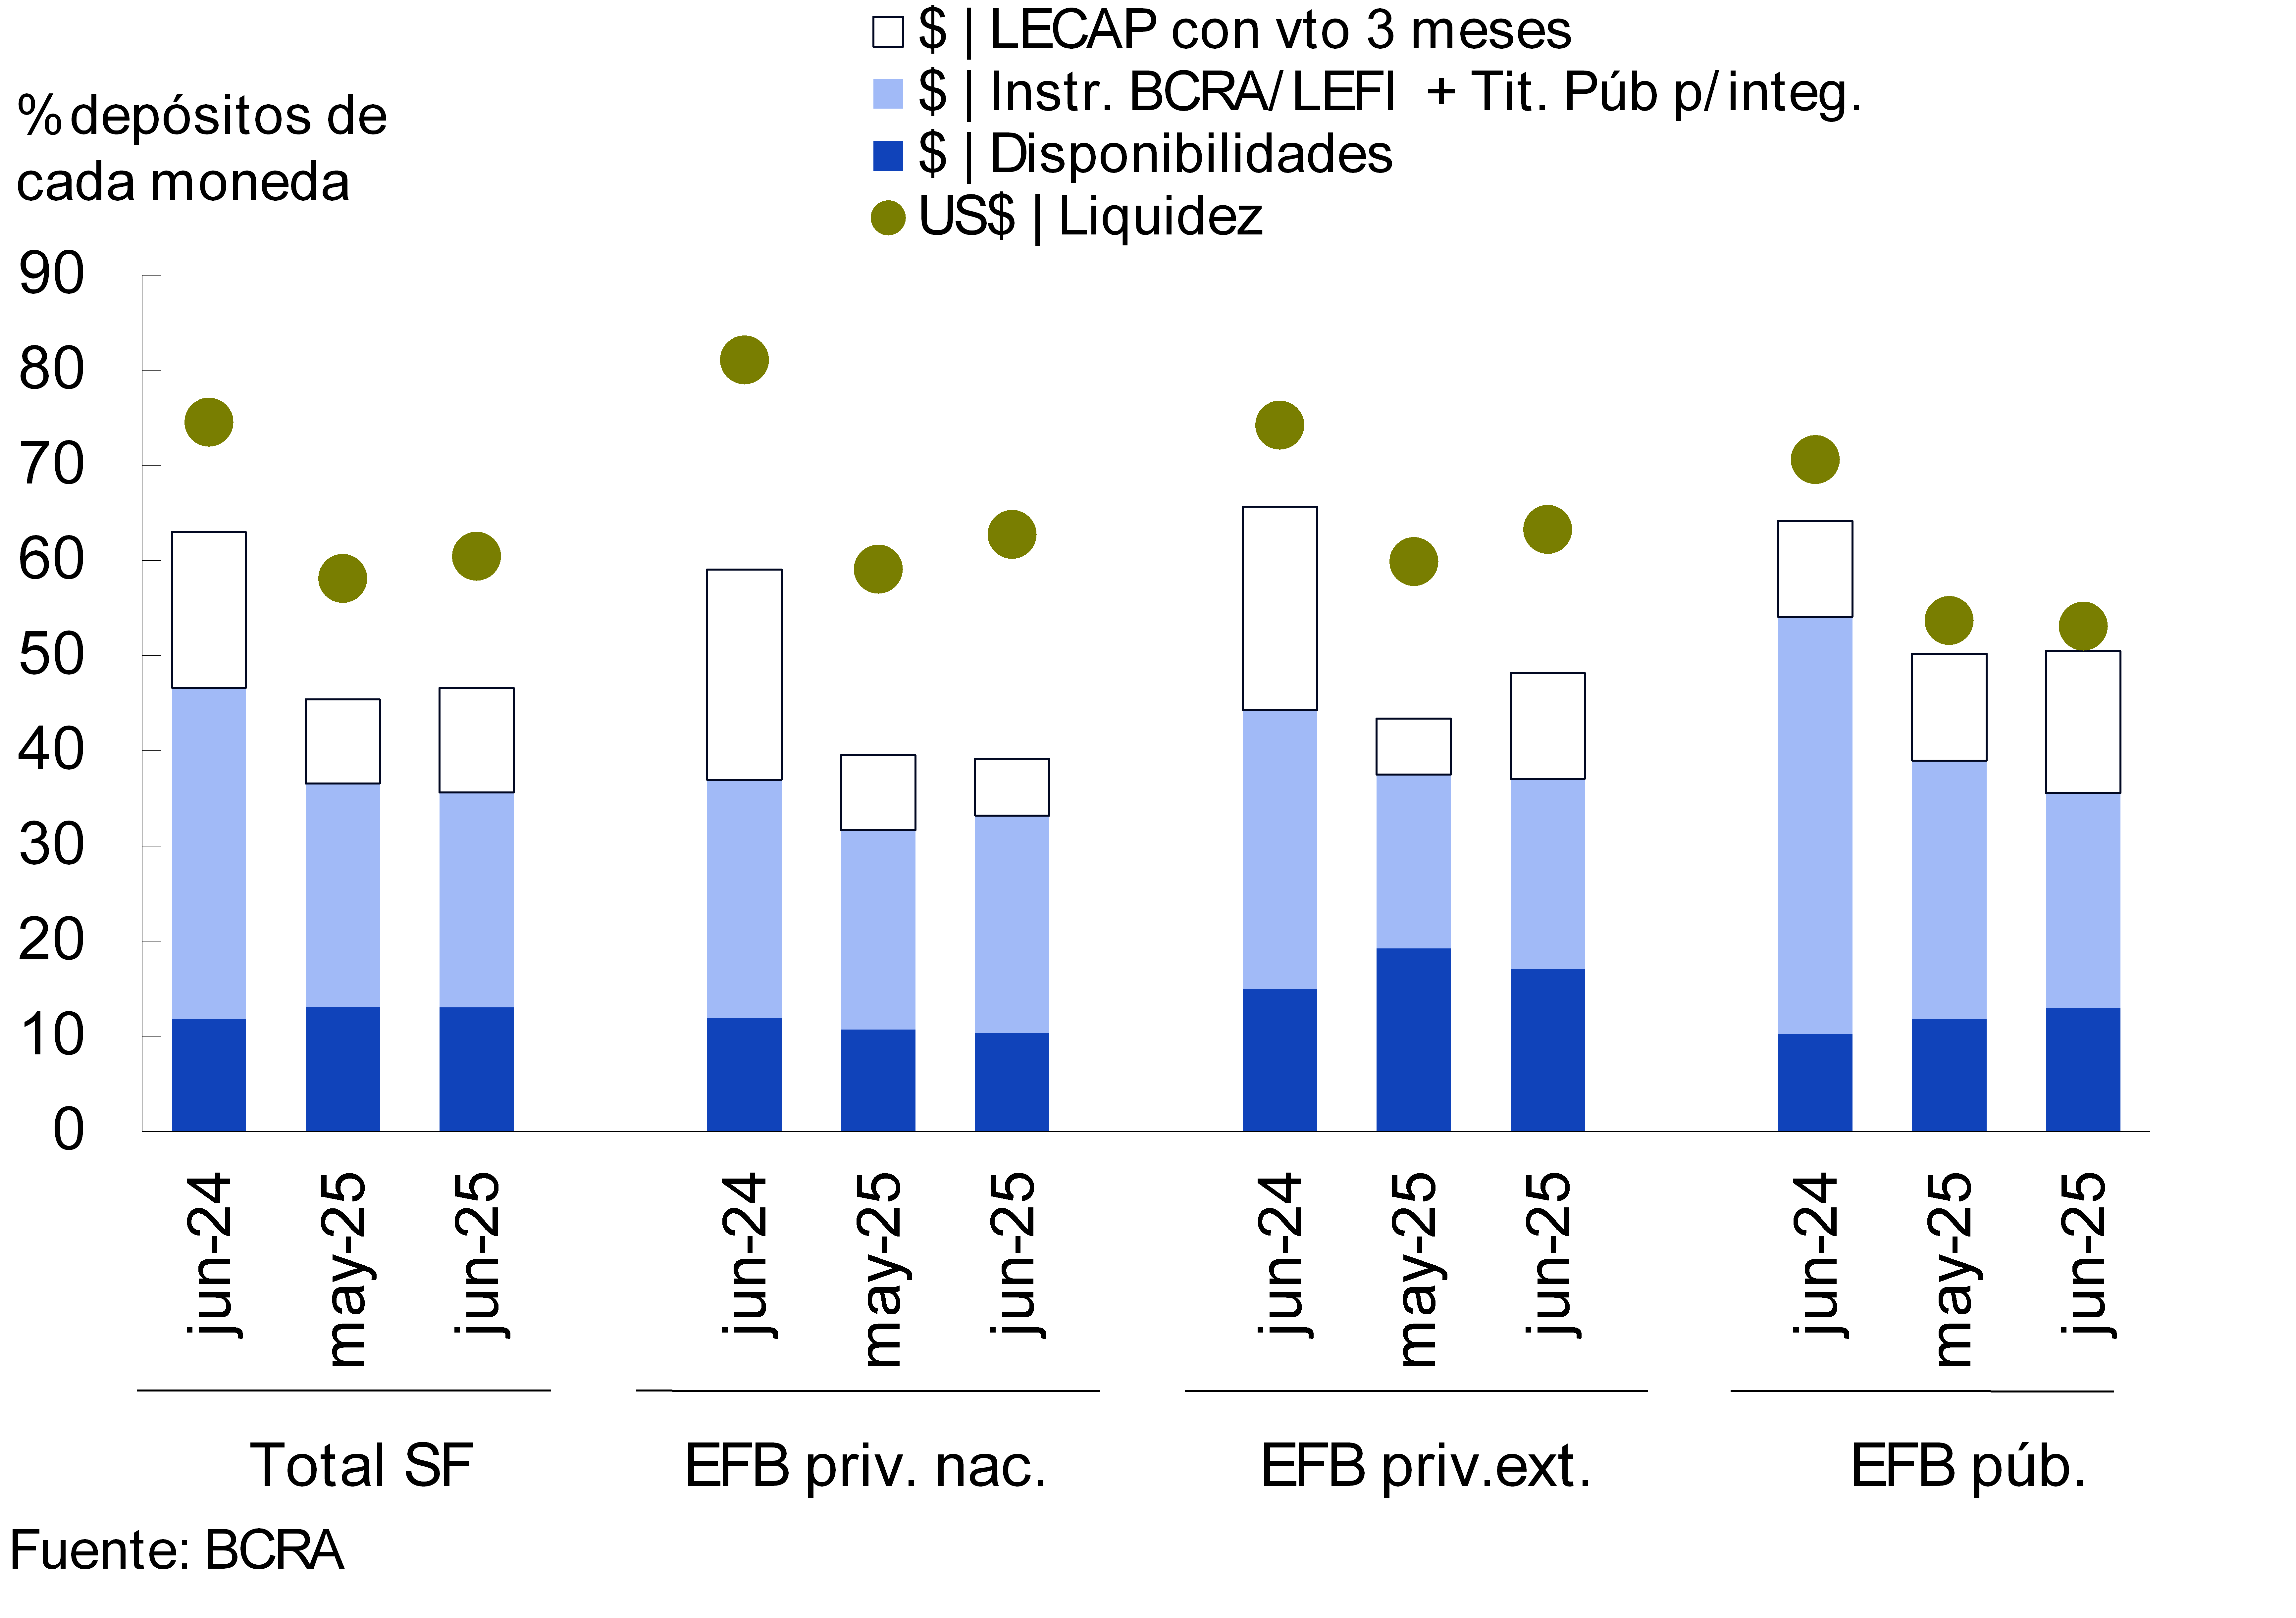
In June, the liquidity ratio in pesos, which includes only availabilities, stood at 13% at the systemic level, remaining without significant changes compared to last month (-0.1 p.p. monthly and +1.3 p.p. y.o.y.). The broad liquidity indicator in pesos5 totaled 46.6% of deposits in the same denomination in the period, 1.2 p.p. more than last month (-16.4 p.p. y.o.y.). As for the foreign currency segment, the liquidity indicator increased 2.3 p.p. in June, reaching 60.4% of these deposits (-14.1 p.p. y.o.y.). When differentiating by group of financial institutions, public banks currently have higher relative levels of liquidity in pesos, while private banks verified the same in foreign currency (see Graph 9).
Figure 9 | Liquidity
indicators As a % of deposits in each denomination
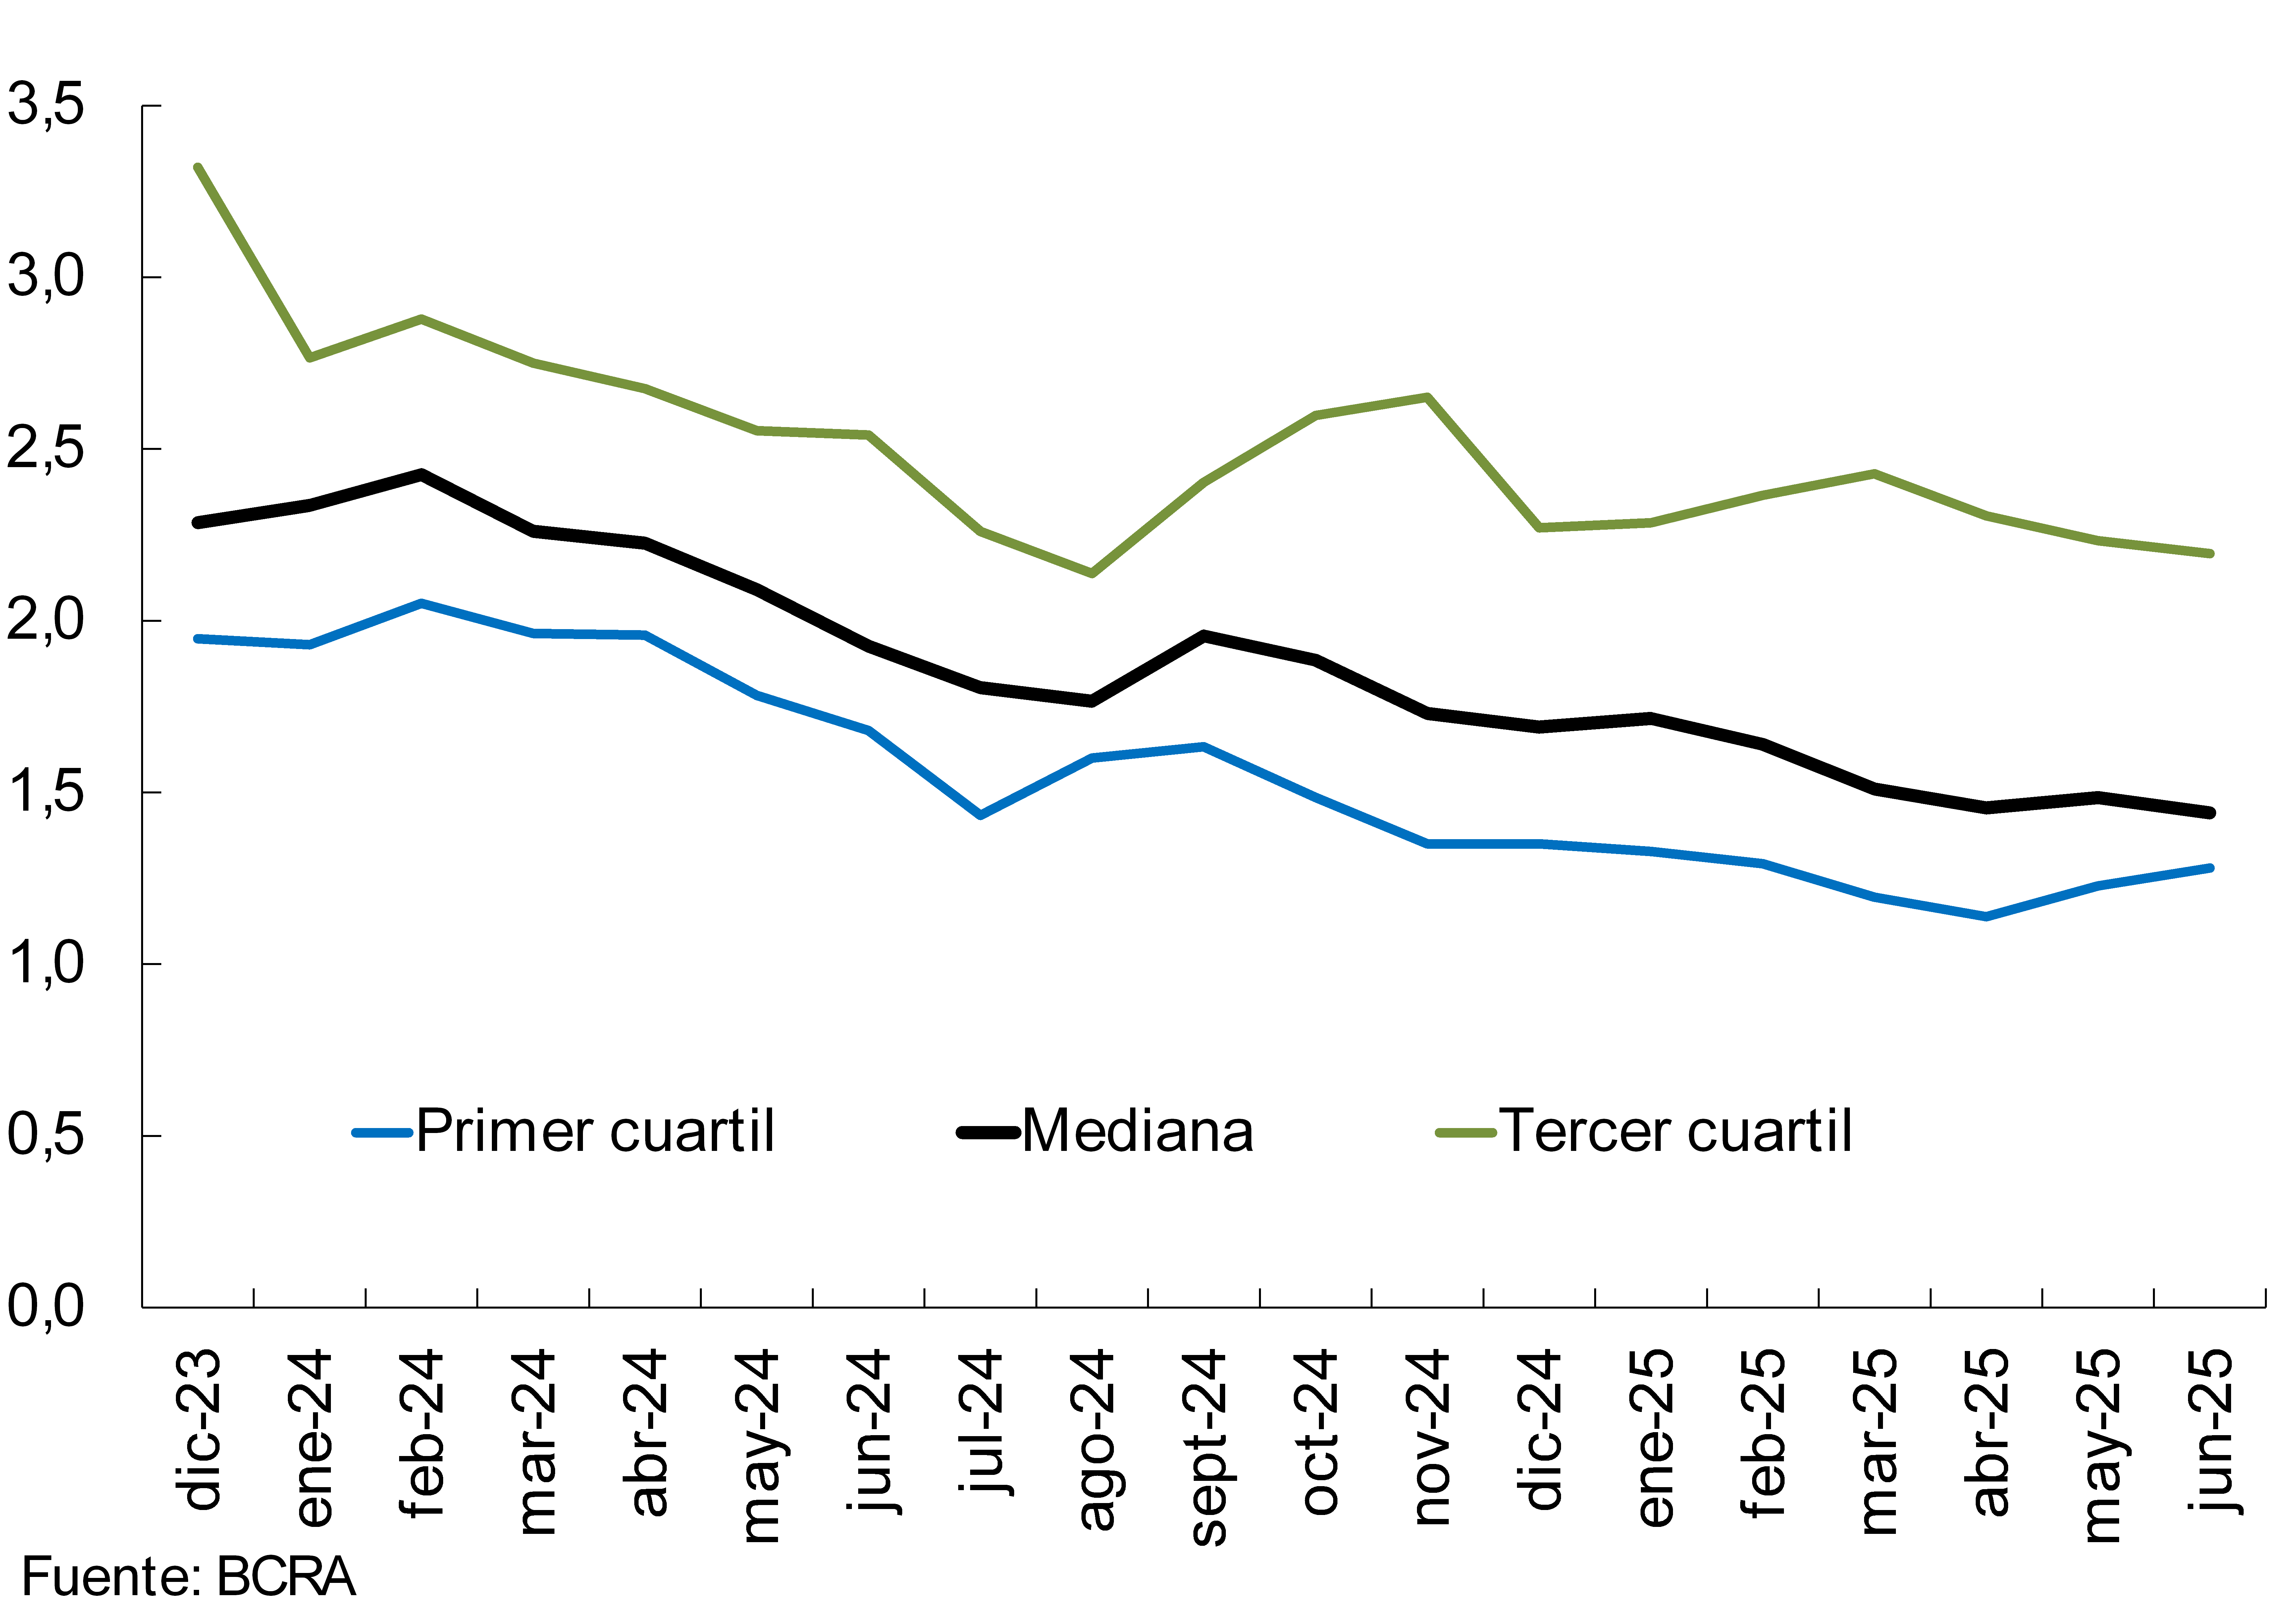
At the end of the first half of the year, all Group A financial institutions, subject to verification of the liquidity coverage ratio (LCR), registered levels above the regulatory minimum -established at 1- (see Chart 10). In June, this indicator reached a median of 1.4 for the aforementioned group of entities, without significant changes compared to May (-0.04 p.p. monthly and -0.5 p.p. y.o.y.).
Figure 10 | Liquidity coverage ratio (LCR)
Group A financial institutions – In $+ME
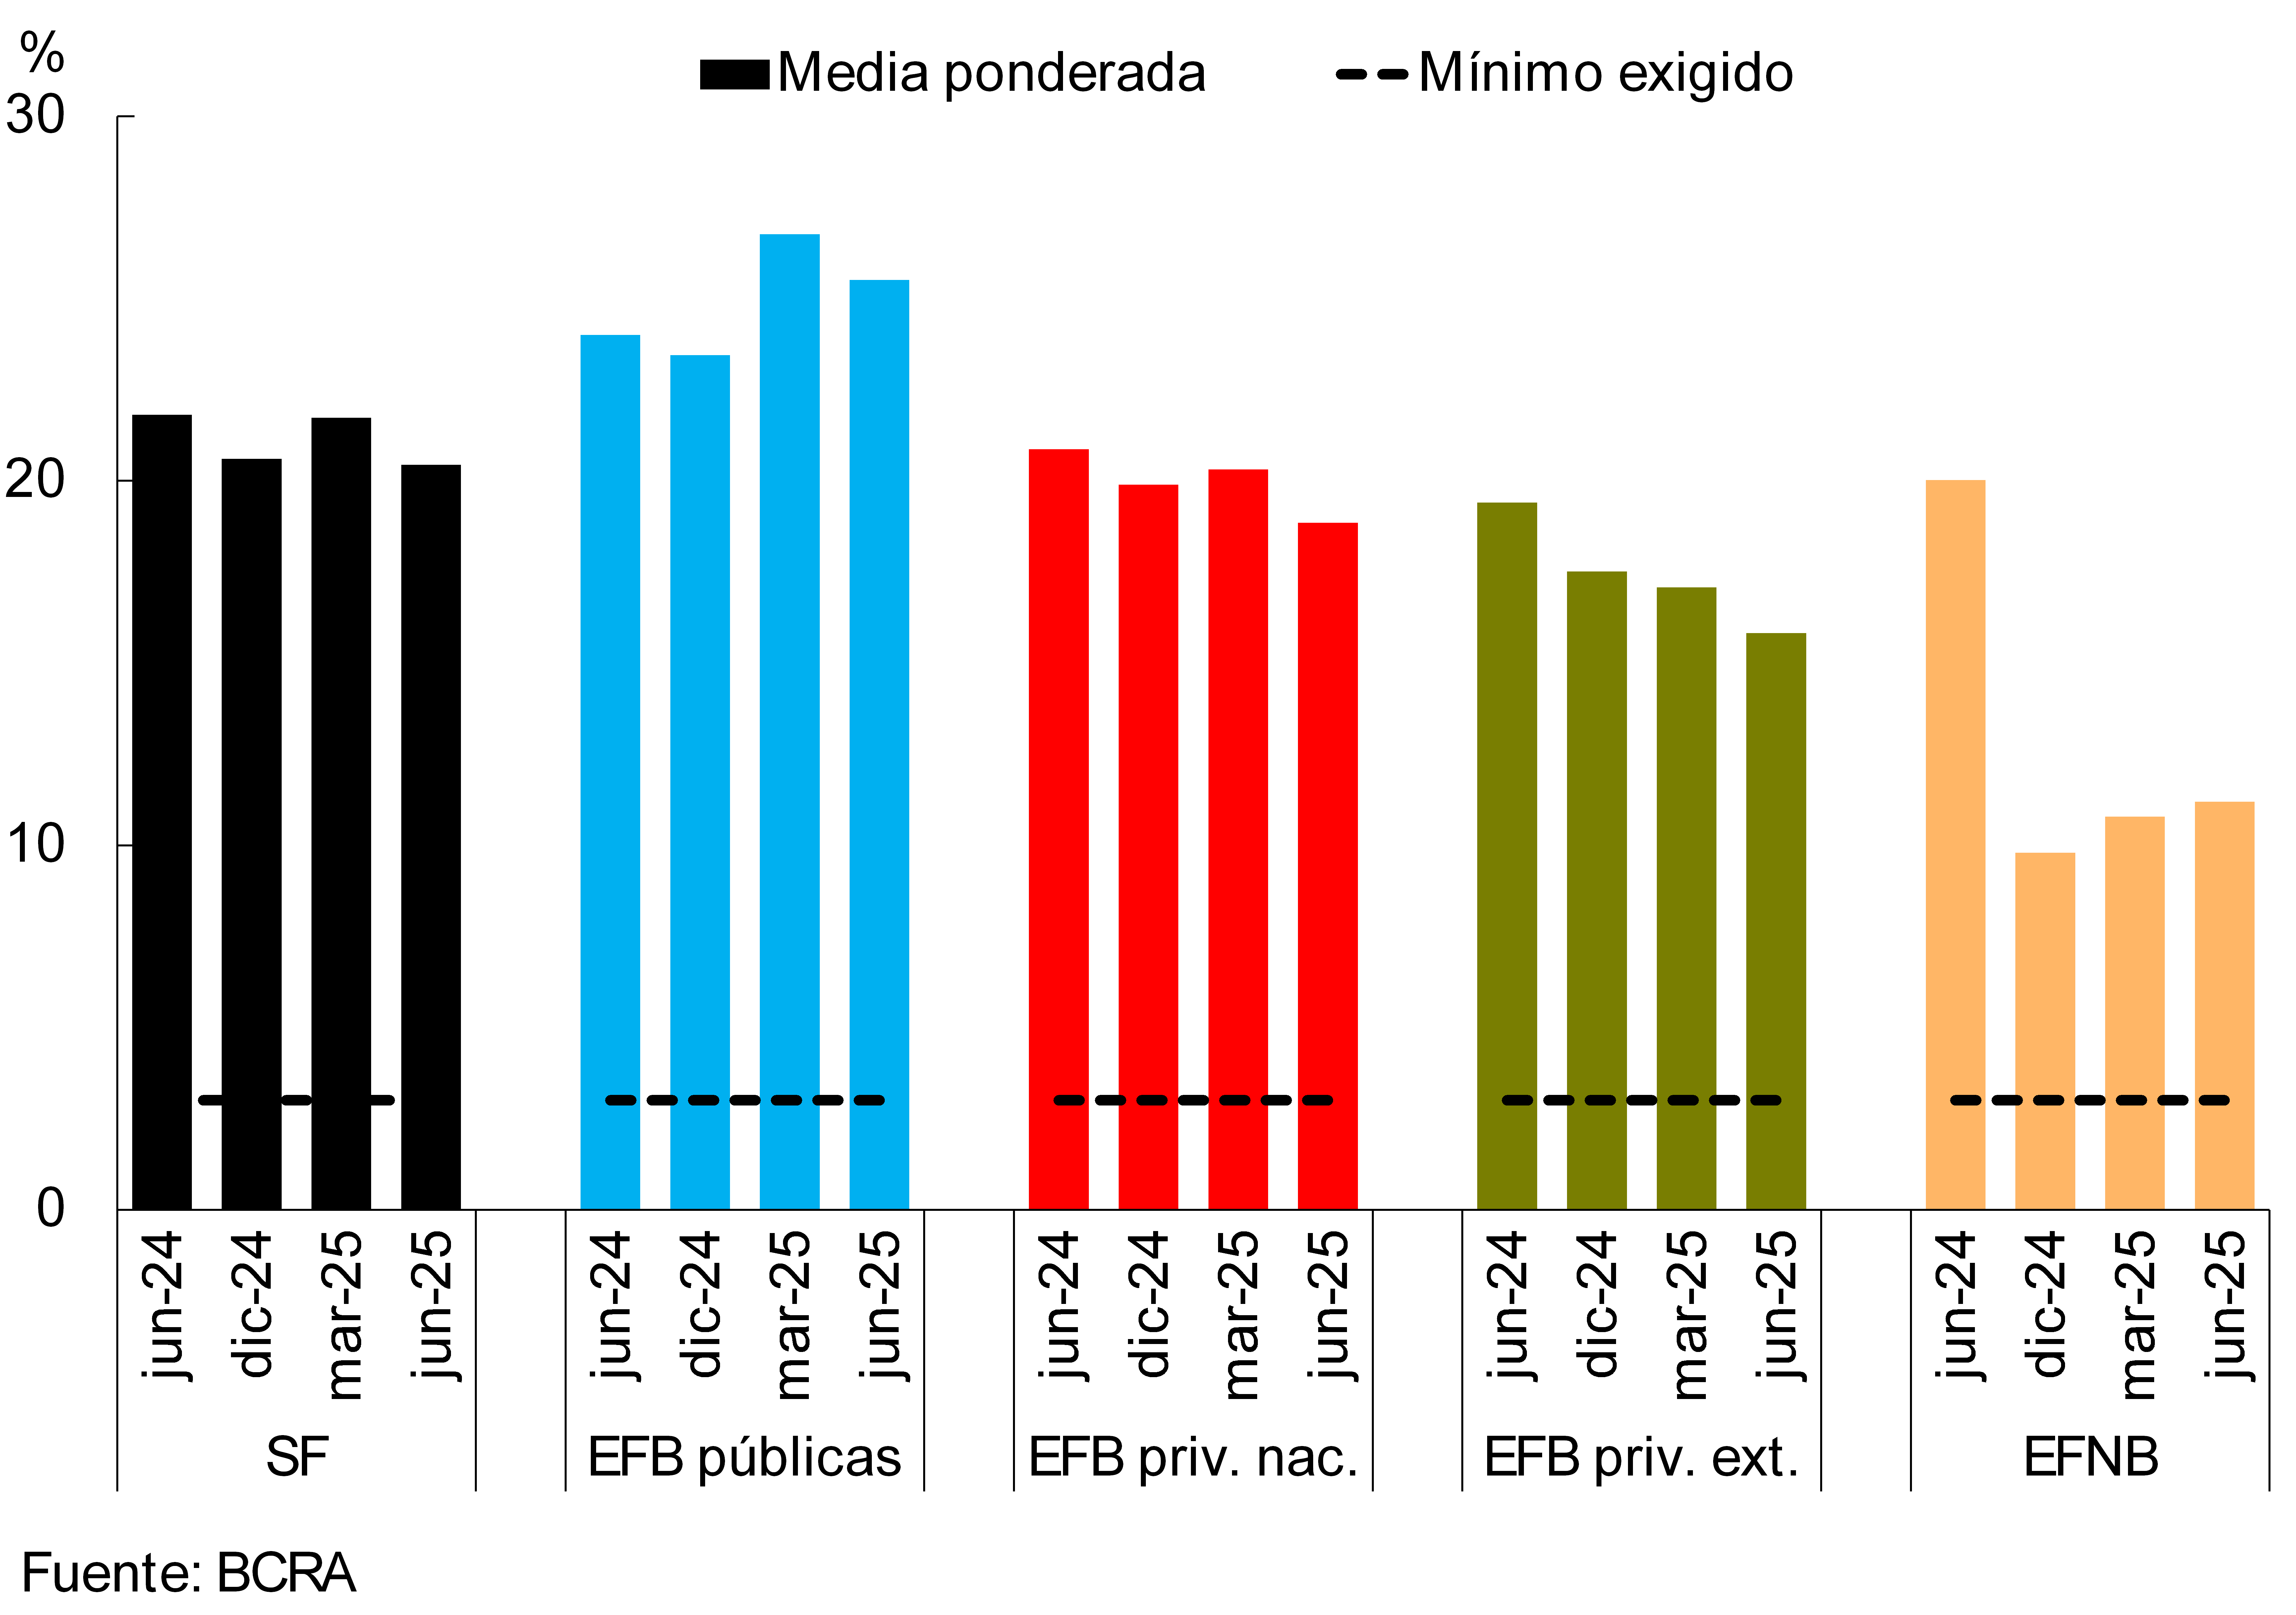
The capital integration ratio at the systemic level stood at 28.1% of risk-weighted assets (RWA) in June, 1.2 p.p. less than last month. The monthly performance was given in the context of a 2% real drop in integration (RPC) and a 2.2% real increase in RWA. The aggregate excess of capital (net integration of the minimum regulatory requirement) with respect to the regulatory requirement totaled 247% in the month (-15 p.p. compared to May and -118 p.p. y.o.y.). The leverage ratio of the aggregate financial system, calculated in accordance with the guidelines of the Basel Committee, reached 20.4% at the end of the second quarter (see Chart 11), slightly below the levels observed in previous quarters. All groups of entities presented values well above the regulatory minimum (established at 3%).
Figure 11 | Leverage
ratio Capital 1in terms of a broad measure of exposure
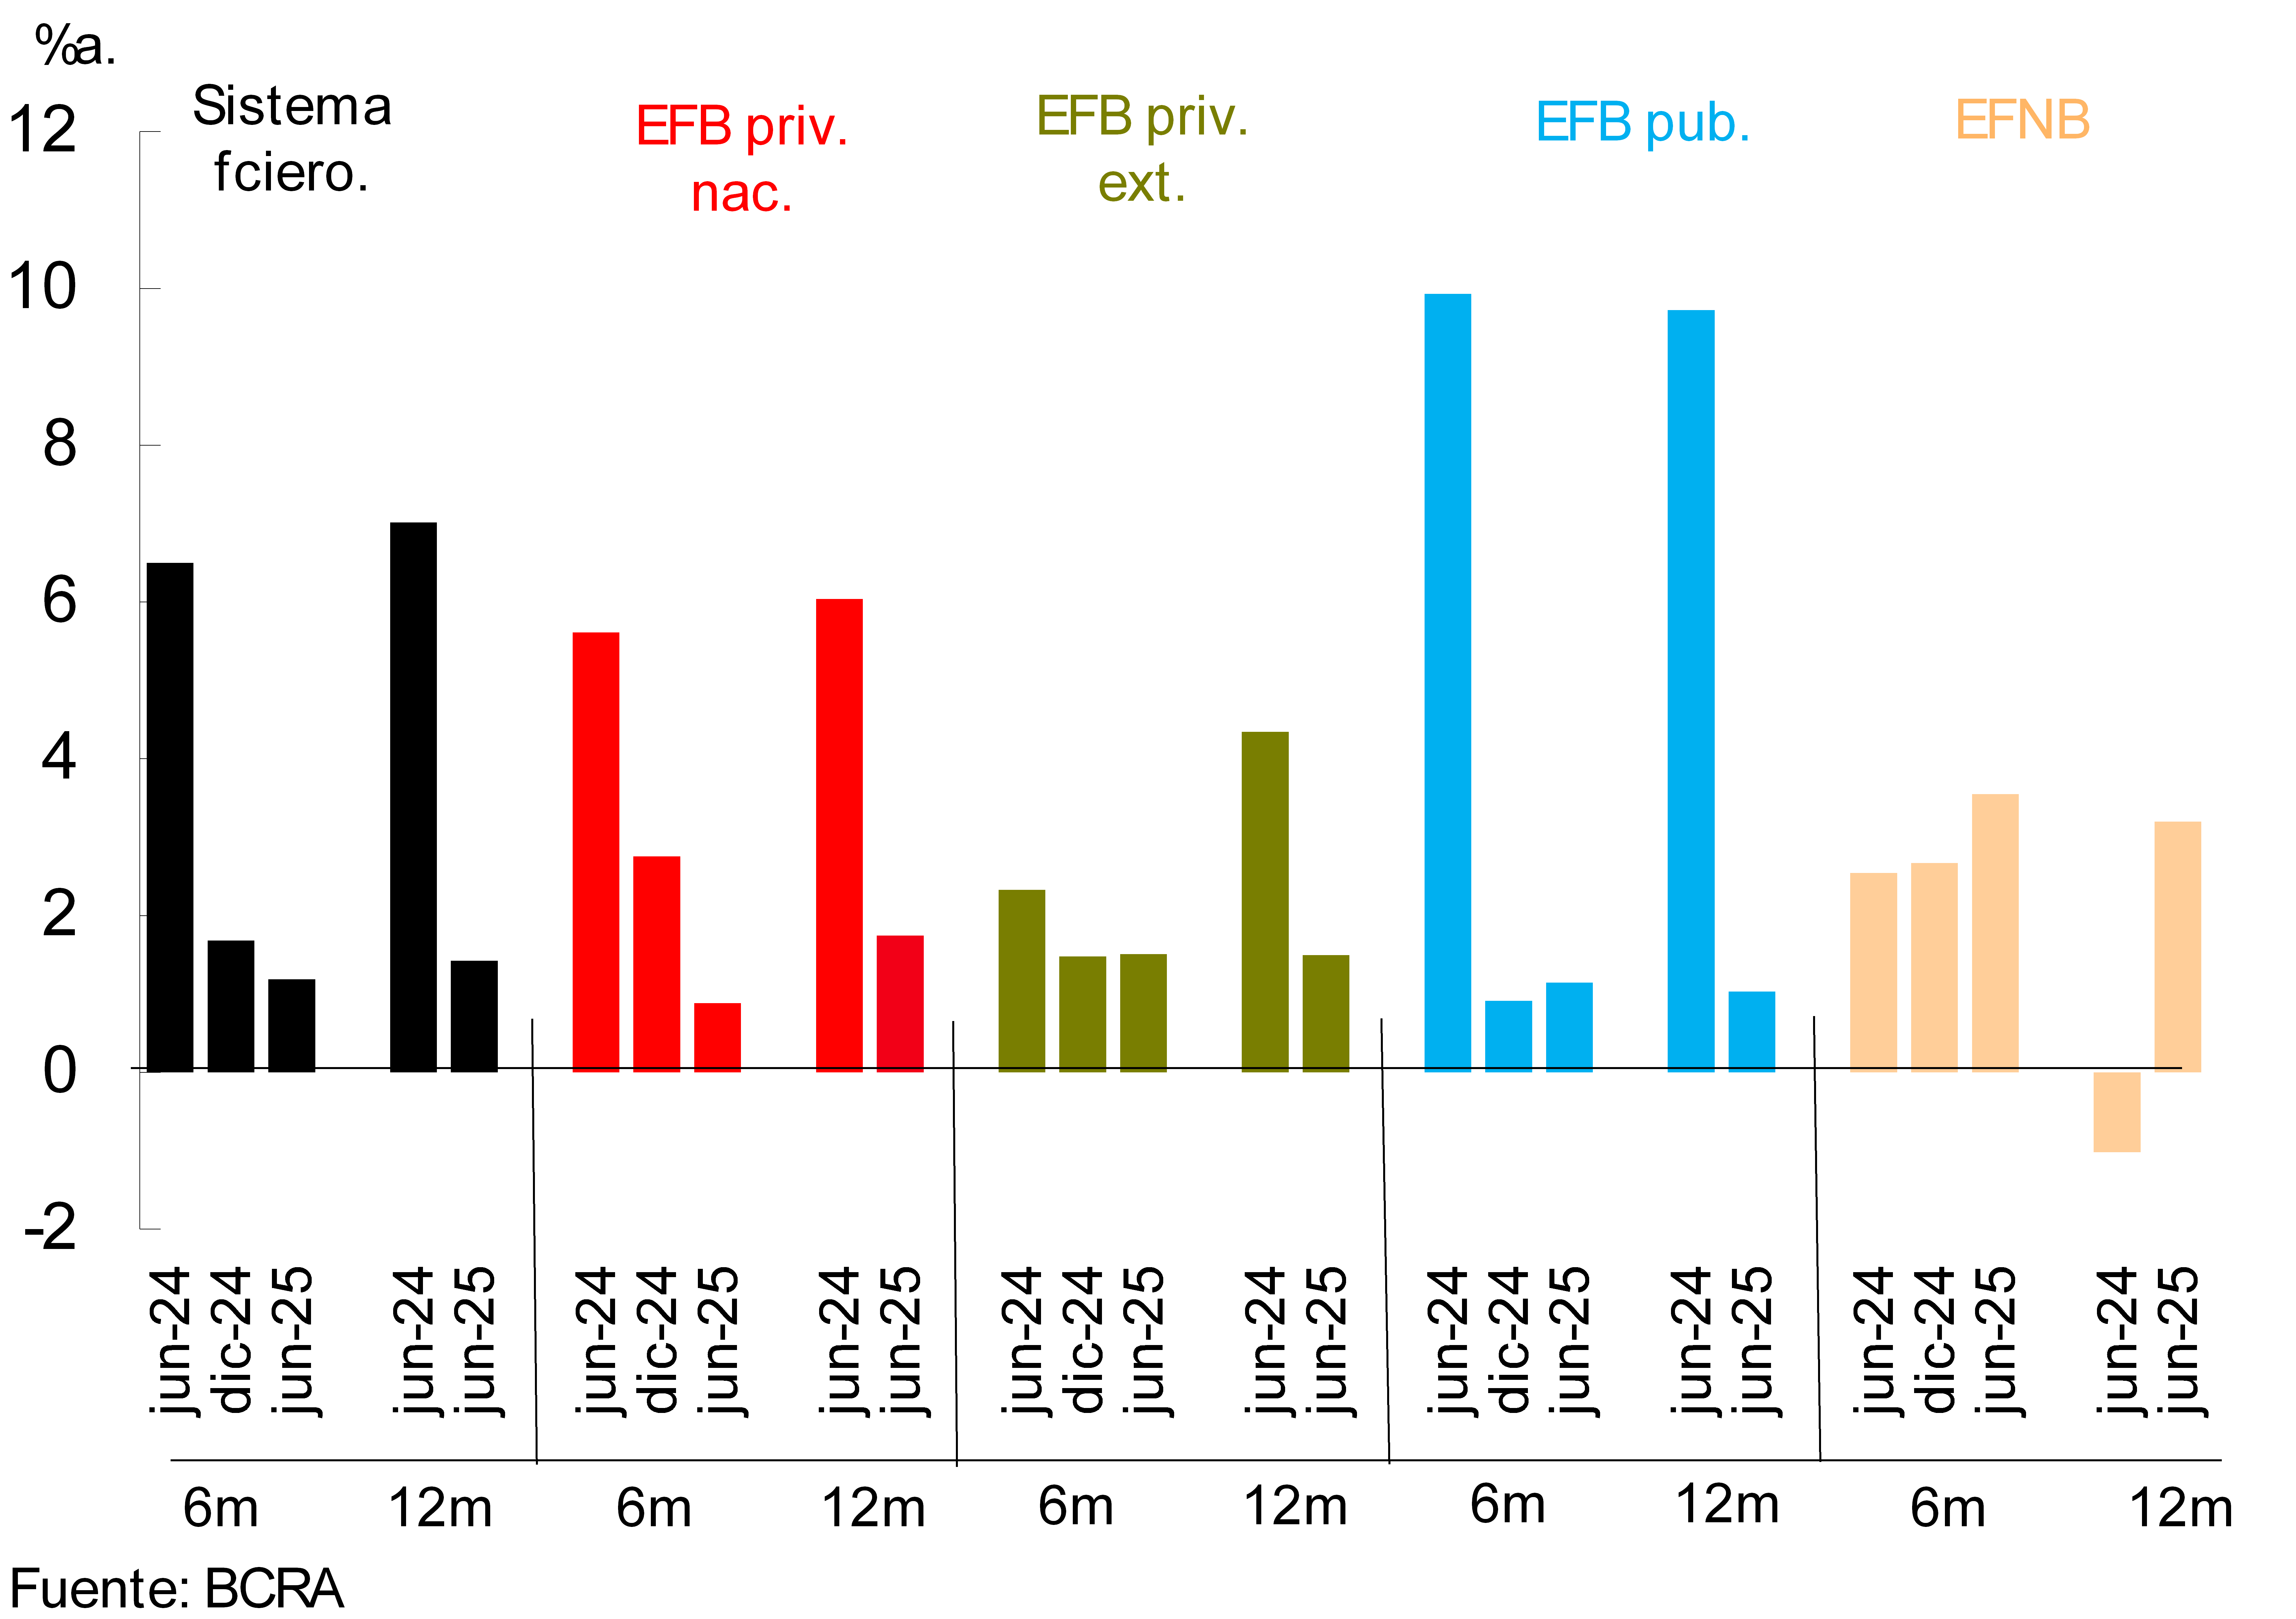
With regard to the profitability of the financial system, in the first half of 2025 the group of entities presented positive results equivalent to 1.2% annualized -a.- of assets (ROA) and 4.9% of equity (ROE). Both indicators were below the levels recorded in the second half of 2024 (see Chart 12). This performance was mainly explained by a reduction in the financial margin (influenced by lower gains on CER adjustments linked to changes in the composition of the portfolio) and by an increase in uncollectibility charges. These effects were partially tempered by lower administrative expenses. In the cumulative 12 months to June, the ROA of the financial system totaled 1.4% (ROE of 5.7%), reducing 5.6 p.p. in a year-on-year comparison (-24.3 p.p. y.o.y. in ROE).
Figure 12 | 5 and 12 months
cumulative ROA By financial institution group
V. Payment system
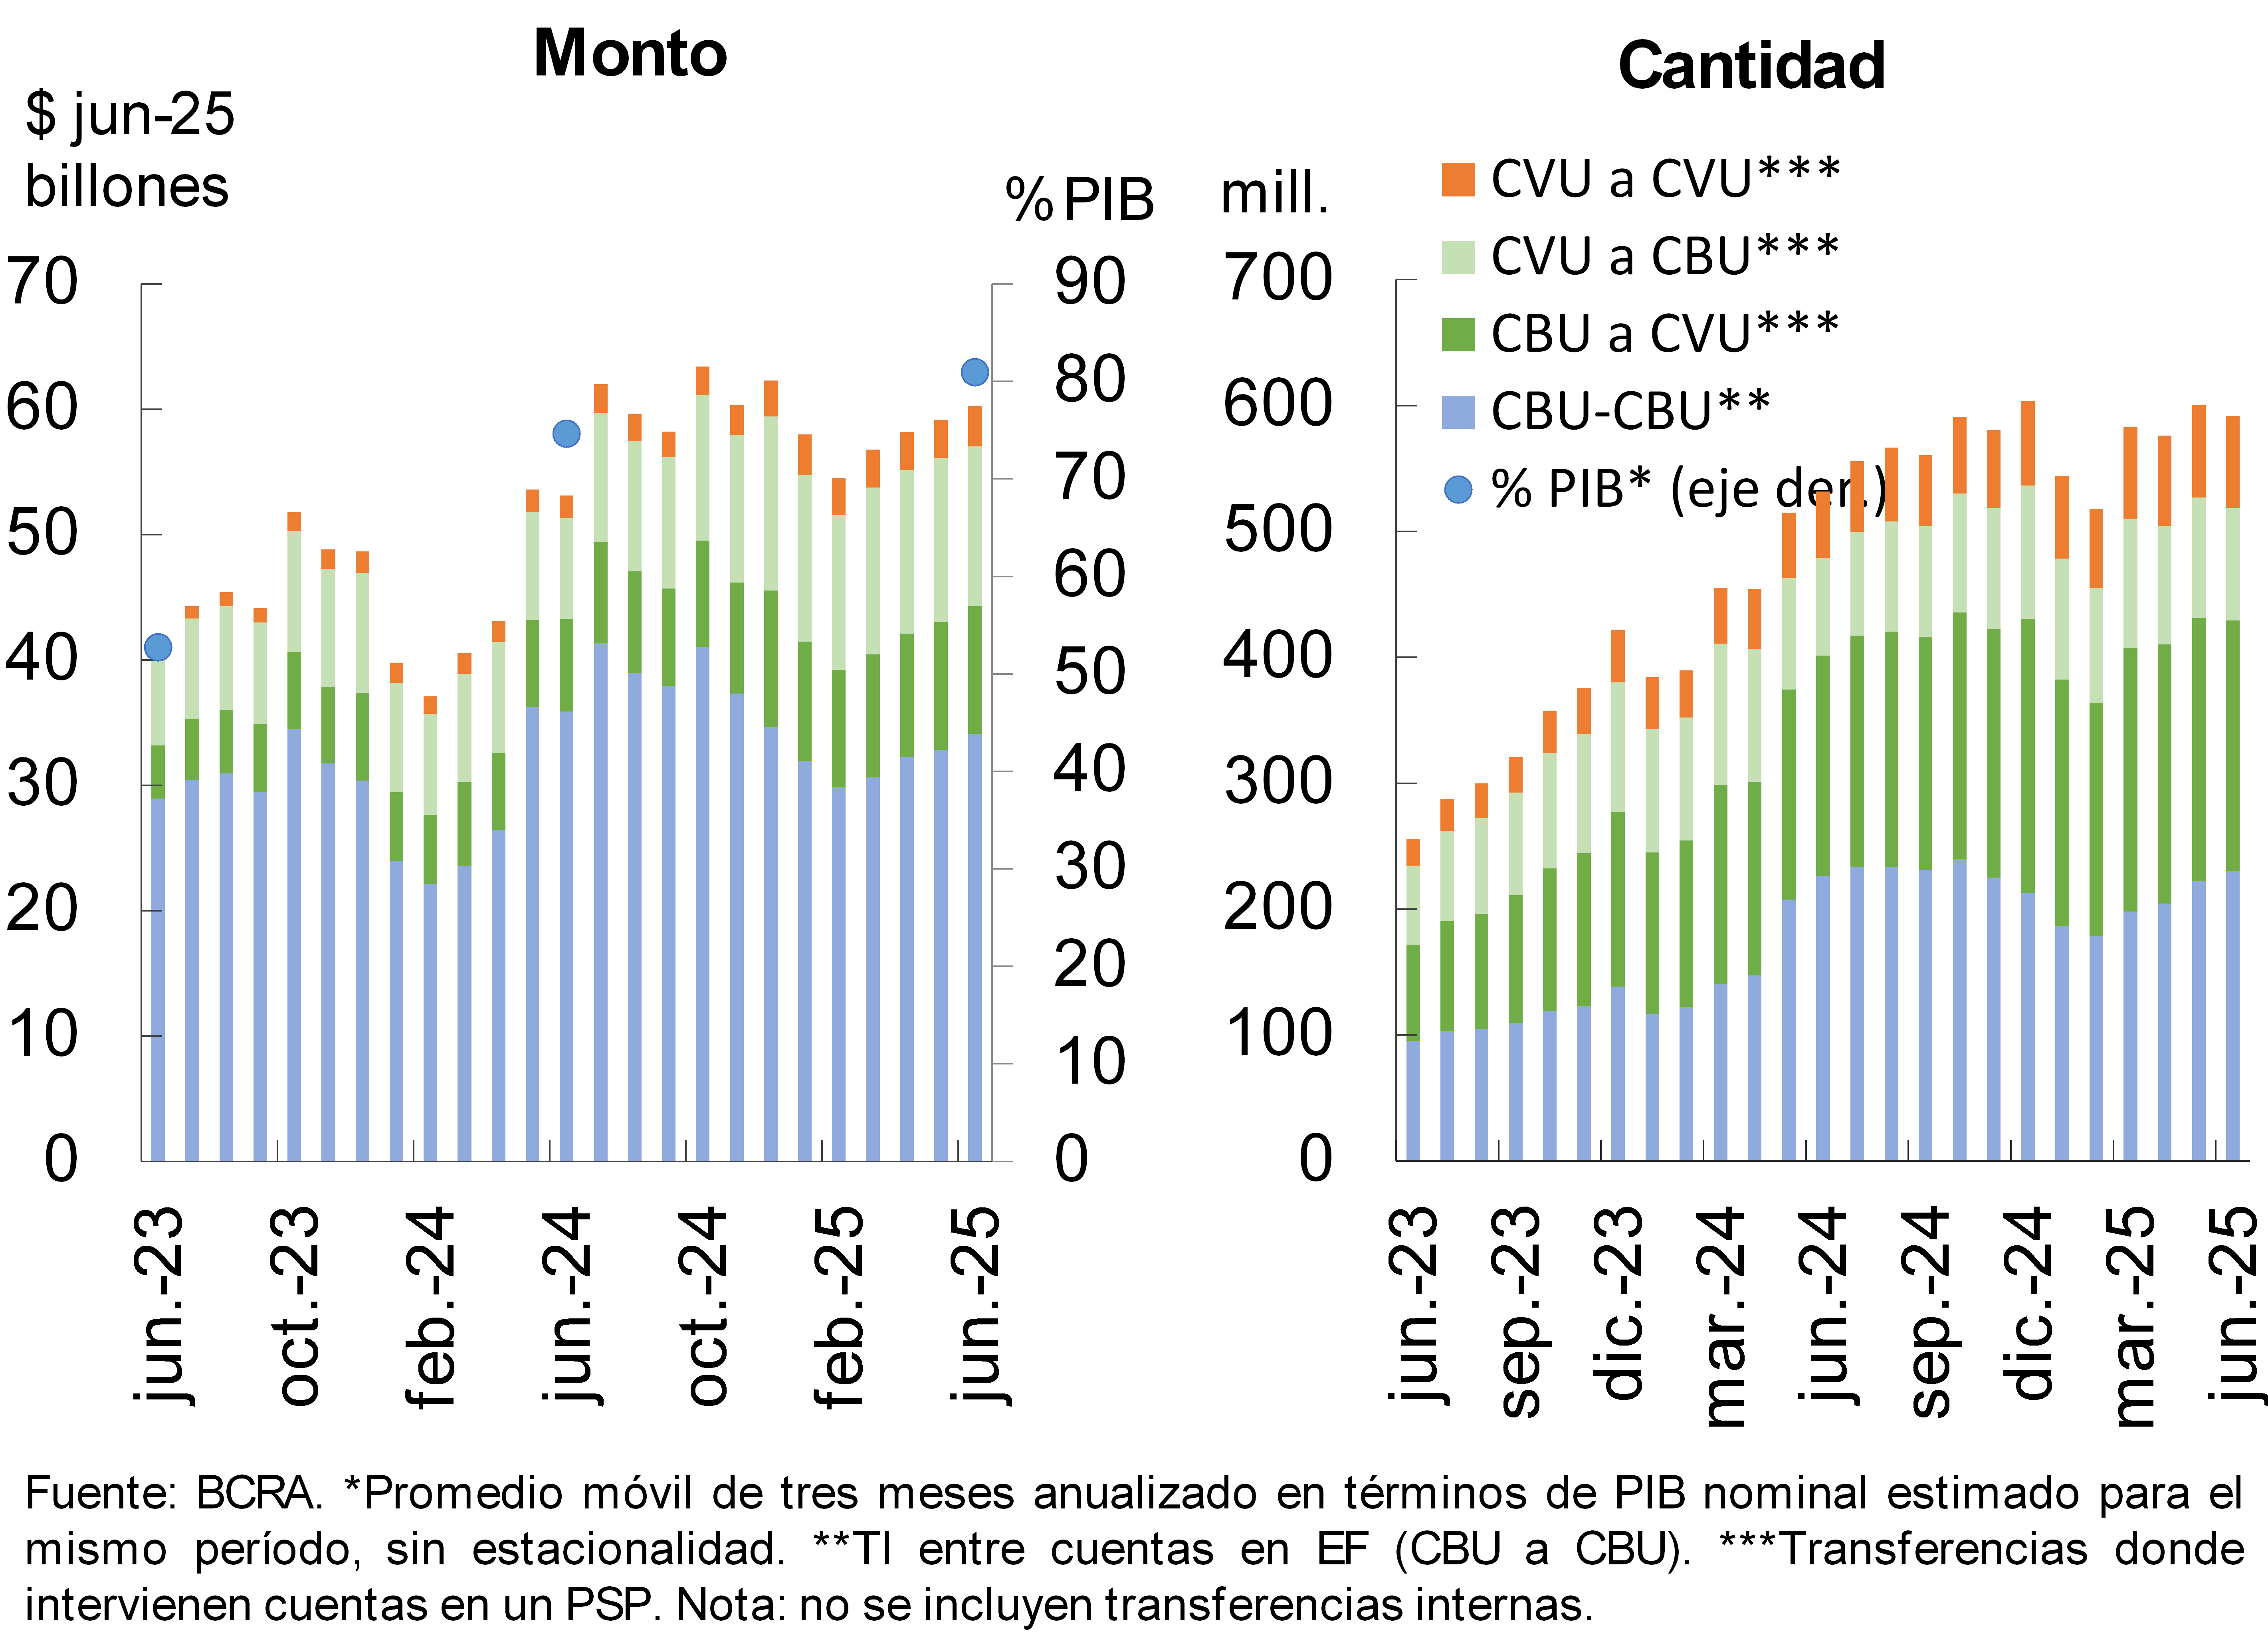
In June, immediate transfers (TI) grew in amounts (2% in real terms), although they decreased in amounts (-1.5%). Compared to June 2024, IT expanded 12.4% in real amounts and 10.8% in quantities (see Chart 13). When disaggregating the amounts operated in the different IT modalities, the year-on-year increase in transfers between CVU (76.7%), CVU to CBU (58.6%) and CBU to CVU (38%) stands out; while those taken exclusively between CBUs from different financial institutions (-7.1%) were reduced. 67 Thus, in the last year, transfers in which a CVU is involved gained participation (+11.6 p.p. y.o.y. to 44.7% of the total in real amounts), to the detriment of those in which only CBUs participate. As of June, IT increased its weight in the economy by 6.3 p.p. y.o.y. of GDP, to 80.9%.
Chart 13 – Immediate Transfers (IT)
Payments with interoperable transfers (PCTI) by QR code showed a real growth of 3.5% in amounts in June and remained stable in terms of amounts compared to May. PCTI increased 36.1% in quantities and 55.9% in real terms in amounts in the last 12 months. 8 From levels that are still limited, these operations showed an advance in terms of GDP, representing 1.6% of GDP, 0.6 p.p. above the level of a year ago.
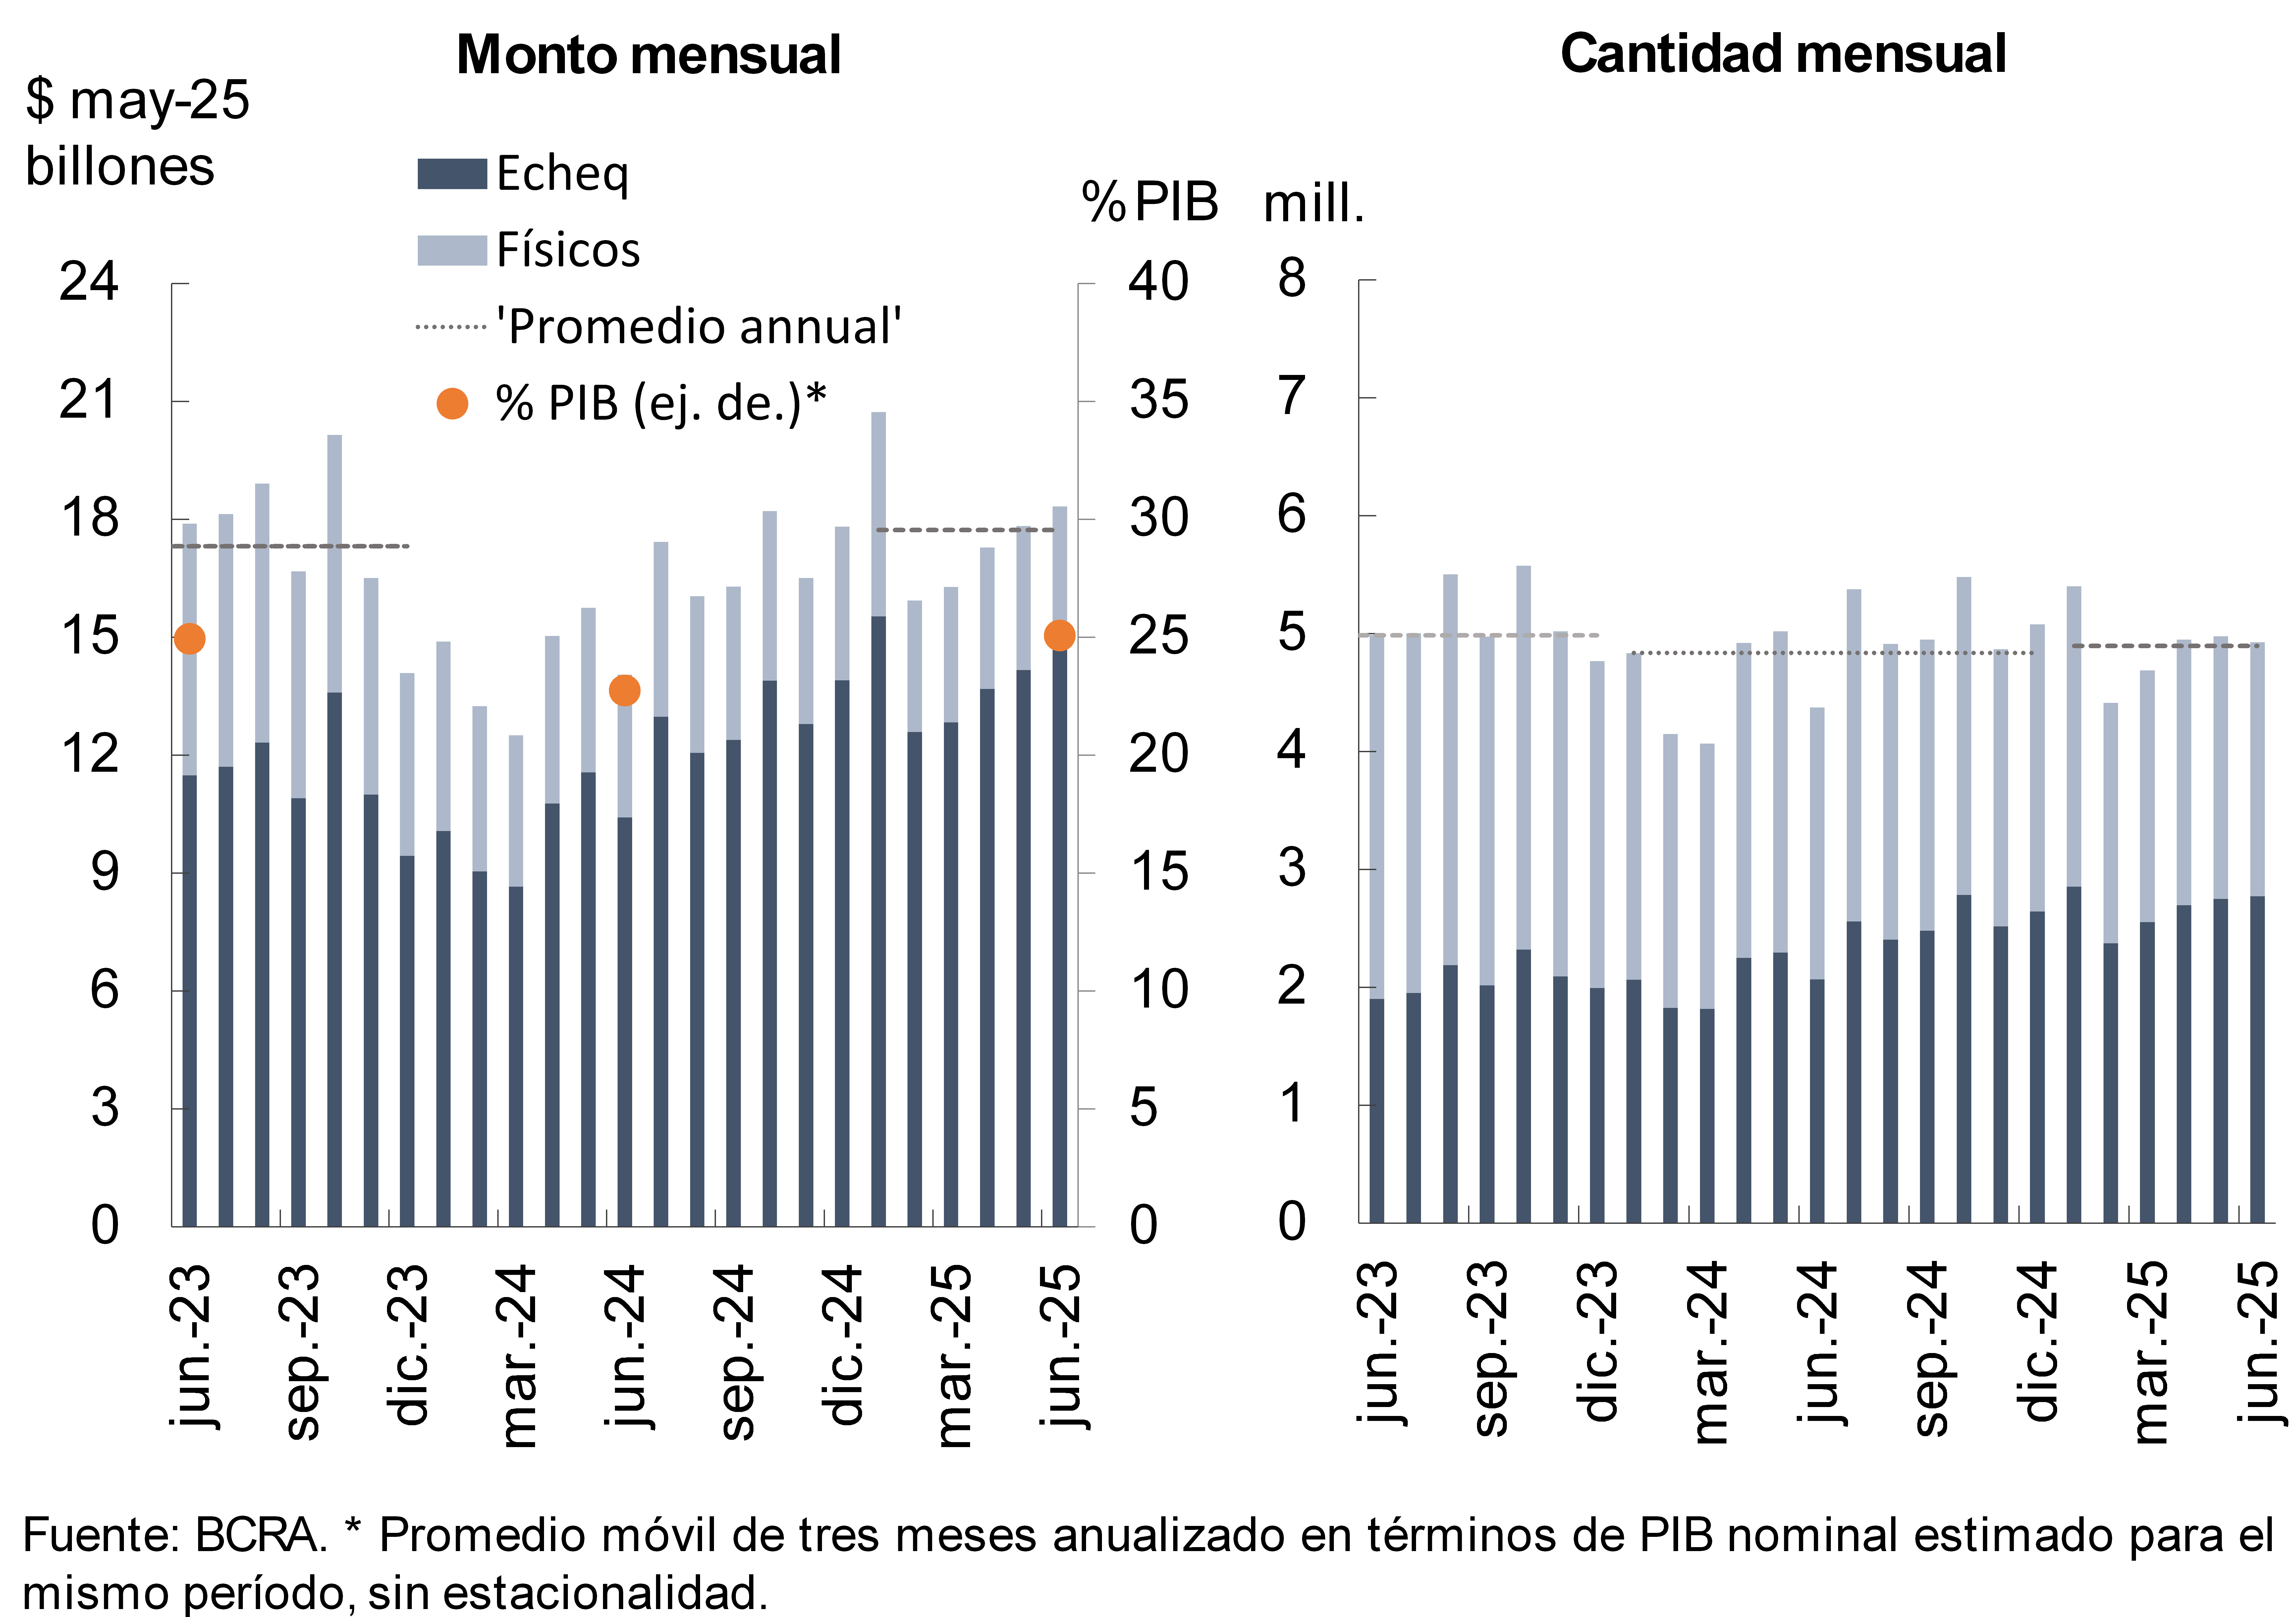
In June, the number of cleared checks was slightly reduced (-1%), with an increase in real amounts (2.8%). In relation to the same period of the previous year, the total compensated increased both in amounts (12.6%) and in amounts (30.4% in real terms) (see Graph 14). 9 The ECHEQs gradually gained ground, consolidating themselves as the most representative modality: as of June, they accounted for 56.3% of the total compensated in amounts and 81% of the amounts. As of June, ECHEQs grew 0.9% month-on-month (34.1% YoY) in quantities and 4.8% MoM (42.4% YoY). In total, cleared checks reached a value equivalent to 25.1% of GDP, 2.3 p.p. above June 2024.
Graph 14 : Check clearing
In June, the ratio of rejected checks due to lack of funds over the total cleared stood at 1.36% in amounts and 1.05% in real amounts, which represents a slight decrease of 0.03 p.p. and 0.2 p.p. compared to May, respectively. Both indicators continued to be above the levels of a year ago (0.87 p.p. y.o.y. in quantities and 0.73 p.p. y.a. in real amounts).
References
1 On the side of financing to the public sector, in the month there was the maturity of a specie accounted for in foreign currency (dollar linked), with some substitution for other specie in national currency being observed in part.
2 Financing to companies includes those granted to legal entities and commercial financing granted to individuals. On the other hand, loans to families are considered to be those granted to individuals, unless they are for commercial purposes.
3 The lower exposure to the public sector was mainly due to the reduction in LEFI holdings.
4 The ratio of credit to the private sector net of forecasts and assets was around 41.1% at the systemic level in June.
5 It considers availabilities (cash and current account at the BCRA), fiscal liquidity bills (LEFI), the balance of the types of public securities that the entities compute as integration of Minimum Cash (until mid-2024 it incorporated BCRA instruments) and the holdings of LECAP maturing in the next 3 months.
6 In year-on-year terms through June, the amount of IT among CVUs increased 38.3%, while those among CBUs grew 0.8%. On the other hand, CBU-to-CVU operations registered an increase of 13.7% YoY, while those from CVU to CBU showed an advance of 15% YoY.
7 In June, the average value of IT was $99,574.
8 In June, the average value of PCTs through QR codes was $19,174.
9 In June, the average amount of cleared checks was $3.7 million (physical format: $1.6 million; ECHEQs: $5.4 million).
Share on


