About the use of inclusive language in this publication
The use of language that does not discriminate and that makes all gender identities visible is an institutional commitment of the Central Bank of the Argentine Republic. This publication recognizes the influence of language on ideas, feelings, ways of thinking and evaluation schemes.
This document has sought to avoid sexist and binary language. However, for ease of reading, resources such as “@” or “x” are not included.
Executive summary
• In June, the financial intermediation activity in pesos of entities with the private sector grew. In this context, the financial system continued to operate with comfortable coverage margins in terms of liquidity, solvency and forecasts.
• In June, the balance of credit in pesos to the private sector increased by 0.4% in real terms (+3.6% nominal), mainly reflected in commercial lines and pledges. This monthly performance was partly explained by the Financing Line for Productive Investment (LFIP) of MSMEs, through which about $796,850 million have been granted until the end of July.
• With the aim of continuing to accompany the productive recovery process, the Executive Branch in conjunction with the BCRA recently implemented the Program called “Zero Rate Credit 2021”, aimed at assisting workers adhered to the Simplified Regime for Small Taxpayers. It consists of obtaining a loan with a subsidy of 100% of the total financial cost (similar to the “Zero-Rate Credits” of 2020). The BCRA also continues to support measures aimed at strengthening national consumption and production, such as the extension of the Ahora 12 Program, which includes financing to 24 and 30 installments for certain items.
• In line with the economic reactivation, the BCRA focused on relief measures aimed in particular at the population most affected by the pandemic. In June, the transitional scheme that allowed for an increase in the default periods to classify debtors in situation 1, 2 and 3 (60 days until 31/03/2021 and 30 days until 31/05/2021) ended, thus returning to the criteria that were used until 19/03/2020. At the moment, a financial relief measure is still in force for debtors who are employers covered by the REPRO II program, which gives them the possibility of transferring the unpaid installments of the assistance taken to the end of the life of the credit. In this context, the non-performing loan ratio to the private sector reached 4.8% in the month, 0.6 p.p. more than in May (slightly lower in a year-on-year comparison), a performance reflected in all groups of entities.
• The balance of deposits in pesos in the private sector increased by 3.9% in real terms in June (+7.2% nominal) with greater relative dynamism in private financial institutions. Demand accounts grew 7.3% in real terms (+10.7% nominal), reflecting the effect of the payment of the half bonus and higher income from parity adjustments. In addition, time deposits in pesos increased 0.6% in real terms in the period (+3.8% nominal), with a strong dynamism in the UVA segment (+10% in real terms compared to May).
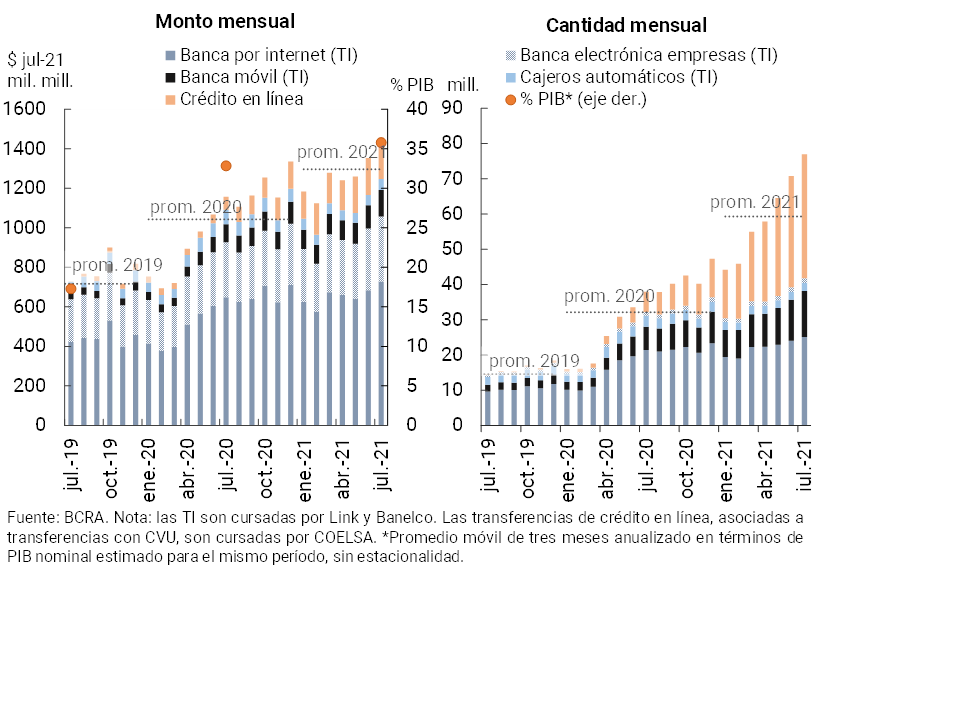
• So far in 2021, electronic means of payment have gained ground among the operations of families and companies. In July, transfers in pesos made online increased again, accumulating an increase of 25.6% YoY in real amounts and more than doubling in the number of operations. Mobile banking continues to stand out as the most dynamic channel among instant transfers. Additionally, the amount of payments made with transfers (within the framework of the “transfers 3.0” initiative implemented in December 2020 by the BCRA) grew 27.2% in real terms in July compared to June. On the other hand, the growth of ECHEQ compensation is also noteworthy, an instrument that gained relevance in recent months to represent 18.2% of the number of documents cleared and 41.8% in amounts traded.
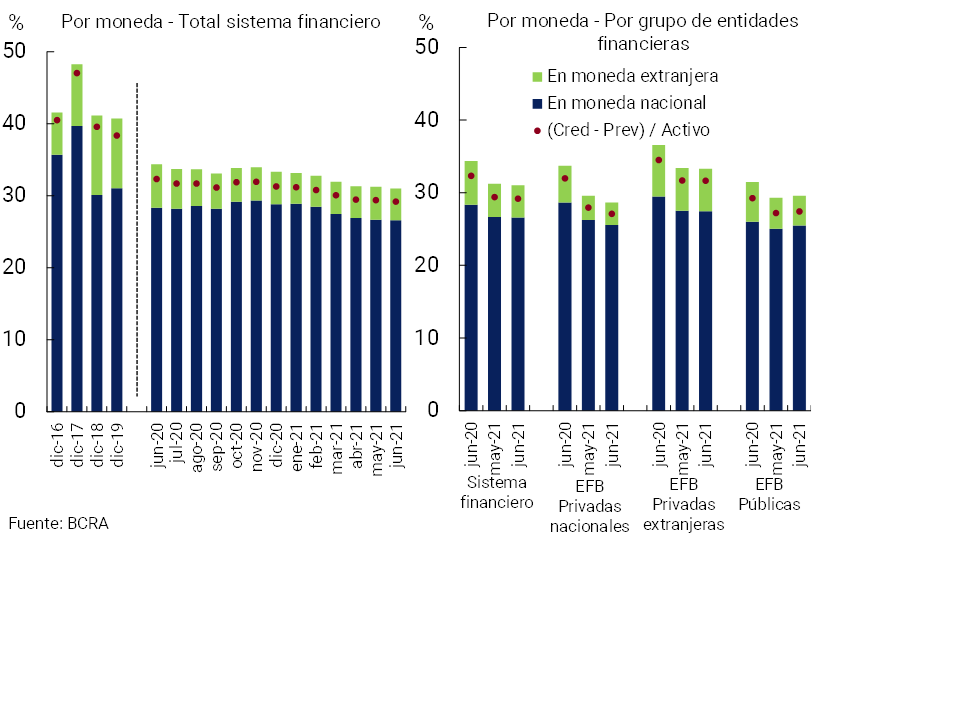
• From levels that exceed the average of the last 10 years, in June the liquidity indicator in the broad sense for the financial system decreased slightly. This ratio totaled 66.4% of deposits in the period (62.8% for the segment in pesos and 82.5% for items in foreign currency), 0.3 p.p. less than last May and 0.6 p.p. higher than the level evidenced a year ago
• The sector’s solvency indicators closed the first half of the year at comfortable levels. Aggregate regulatory capital integration (RPC) stood at 25.5% of risk-weighted assets (RWA) in June, 2.7 p.p. higher than in mid-2020. In the month, the capital position (CPR minus regulatory requirements) of the financial system totaled 214% of capital requirements (+47 p.p. y.o.y.) and 31.6% of credit to the private sector net of forecasts (+7.4 p.p. y.o.y.).
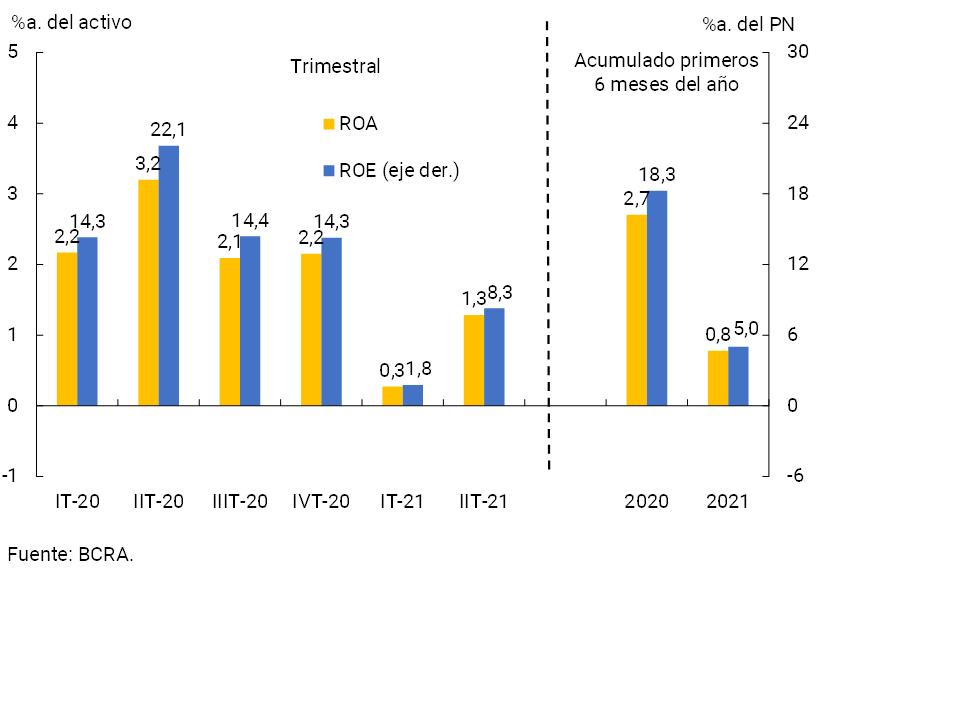
• In the first half of 2021, the financial system’s comprehensive total results in homogeneous currency were equivalent to 0.8% of assets (ROA) and 5% of equity (ROE). Current levels of profitability are lower than those evidenced throughout 2020.
I. Financial intermediation activity
In June, the financial system increased its intermediation activity in national currency with the private sector, in an operational context that continued to be influenced by the COVID-19 pandemic. Considering the most notable changes in the balance sheet of the group of entities for the segment in pesos —in homogeneous currency—1, in June the balance of private sector deposits increased and liquidity in the broad sense decreased. On the other hand, there was an increase in the balance of financing channeled to the public and private sectors, as well as a decrease in public sector deposits. For its part, the segment of items in foreign currency – expressed in currency of origin – saw an increase in deposits from the private sector and a decrease in financing to the private sector, resources that were mainly applied to increase liquidity.
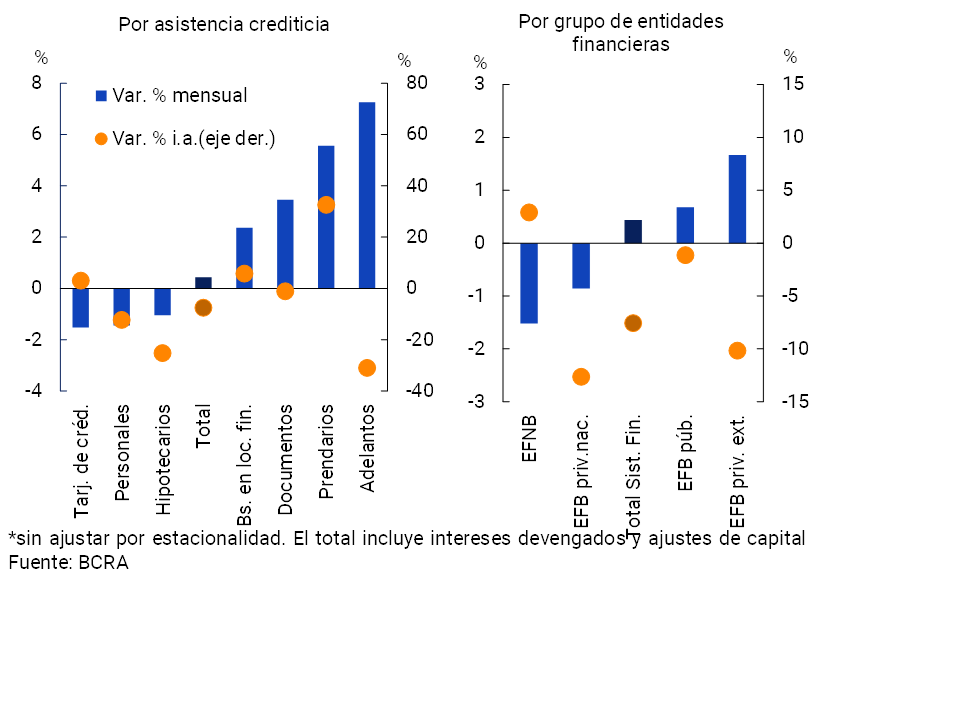
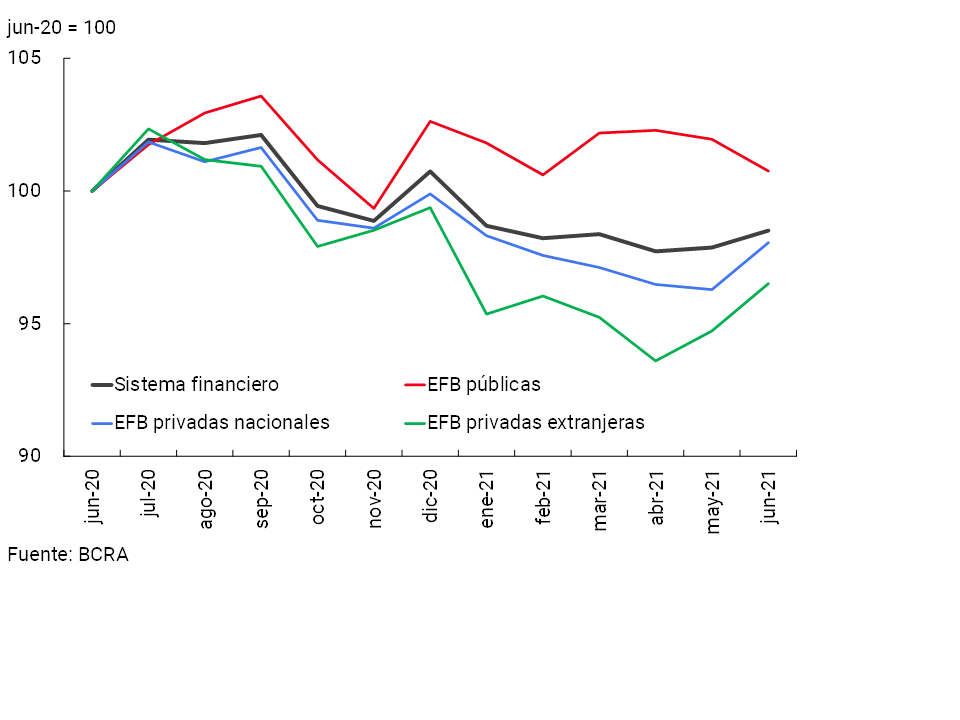
In June, the balance of credit to the private sector in pesos increased 0.4% compared to the previous month (+3.6% nominal)2, mainly due to the performance of foreign private financial institutions and public financial institutions (see Chart 1). Disaggregated by credit segment, the monthly increase was verified in commercial lines (advances, documents and goods in financial leases) and in pledges, while the rest of the assistance showed slight reductions. In a year-on-year comparison, the balance of financing in pesos to the private sector fell by 7.6% in real terms, with a heterogeneous behavior among the different lines of credit3.
Graph 1 | Credit balance to the private sector in pesos
In real terms*
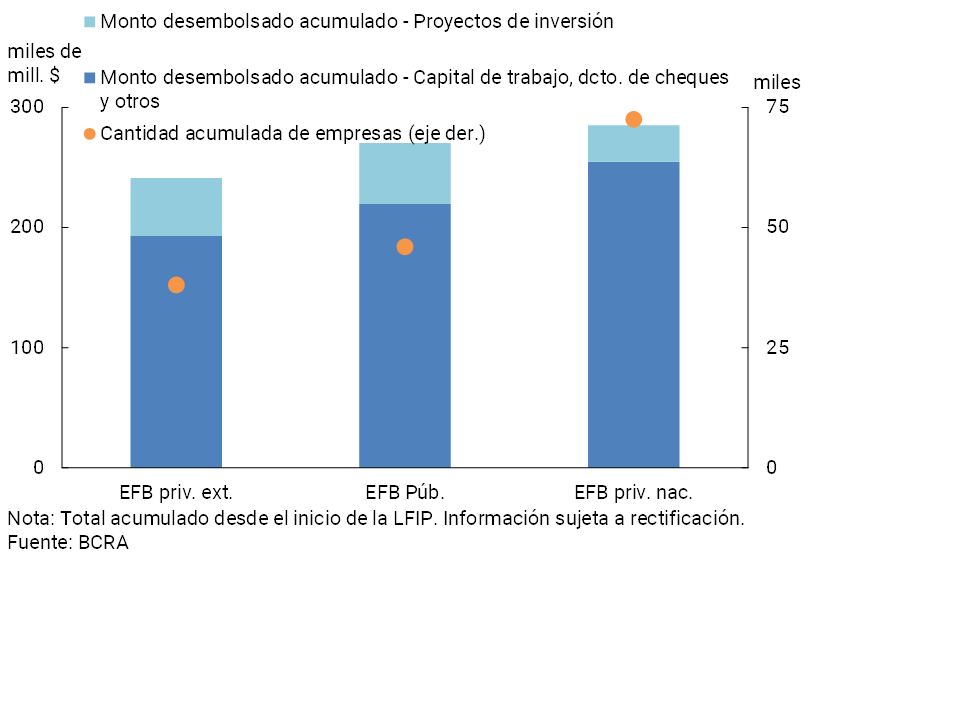
The monthly increase in financing in pesos to the private sector was partly driven by the Financing Line for Productive Investment (LFIP) for MSMEs4. Since the launch of the LFIP in mid-October 2020 and until the end of July 2021—the latest information available—nearly $796,850 million have been granted, distributed among 156,577 companies (See Graph 2). Domestic private financial institutions accounted for almost 36% of the total disbursed, followed by public (with 34%) and foreign private (with 30%). It is estimated that 84% of these resources were channeled to finance working capital needs and to cover deferred payment checks, among other destinations.
Graph 2 | Financing Line for Productive Investment of MSMEs – By Group of Financial Institutions
For its part, through the line of financing at subsidized interest rates for companies enrolled in the “Emergency Assistance Program for Work and Production” (ATP)5, more than $14,200 million were granted through 20,939 loans until the end of July.
In addition, the BCRA continues to support measures aimed at strengthening the population’s consumption and encouraging national production, such as the extension of the Ahora 12 Program, which now includes financing in 24 and 30 installments for certain items6. In particular, to the exemption opportunely established in the Minimum Cash (MS) requirements for entities, equivalent to 50% of the new financing granted within the framework of the Ahora 127 Program, at the end of July it was provided that this reduction will be capped at 8% of the items subject to the requirement —in pesos—, 2 p.p. more than the maximum previously in force8.
Finally, within the framework of the financing for single-tax and/or self-employed people launched in 2020, as of the end of July, nearly $66,500 million have been granted through the Zero-Rate Credit Line9 and about $311 million through the Zero-Rate Credit LineCulture 10. In this last sense, it should be noted that recently within the framework of Decree No. 512/21, the BCRA implemented the Program called “Zero Rate Credit 2021”, with the aim of assisting workers adhered to the Simplified Regime for Small Taxpayers (RS), in order to accompany the productive recovery process observed this year11. The program consists of obtaining a zero-rate credit with a subsidy of 100% of the total financial cost, presenting similar characteristics to those provided for in the “Zero-Rate Credits” of 2020. The debtor will have a grace period of 6 months from the accreditation for the repayment of the credit. After that time, it will be repaid in at least 12 equal and consecutive monthly installments. Financial institutions may reduce the minimum cash requirement in pesos by an amount equivalent to 60% of the sum of the financing agreed through this program.
On the other hand, in order to promote the financing of projects linked to certain strategic sectors of the country and to continue with the federalization of the capital market, in mid-August this Institution authorized financial institutions to acquire shares of Open Mutual Funds authorized by the National Securities Commission, subject to the “Special Regime for the Constitution of Open Mutual Funds for the Financing of the Infrastructure and the Real Economy”. In line with the prudential measures of the BCRA, the participation of a financial institution in each of these funds may be up to 15% of the total issue and may have up to 2% of the Eligible Patrimonial Liability of the entity in this type of assets12.
In June, the balance of credit in foreign currency to the private sector fell by 0.9% – in the currency of origin – in the aggregate of the financial system. As a result, the balance of total financing (in domestic and foreign currency) to the private sector remained without significant variations compared to the previous month (-0.1% real or +3.1% nominal), reducing 11.1% in real terms compared to the level of a year ago. The year-on-year evolution was mainly explained by the performance of private financial institutions and by the dynamics of loans to companies.
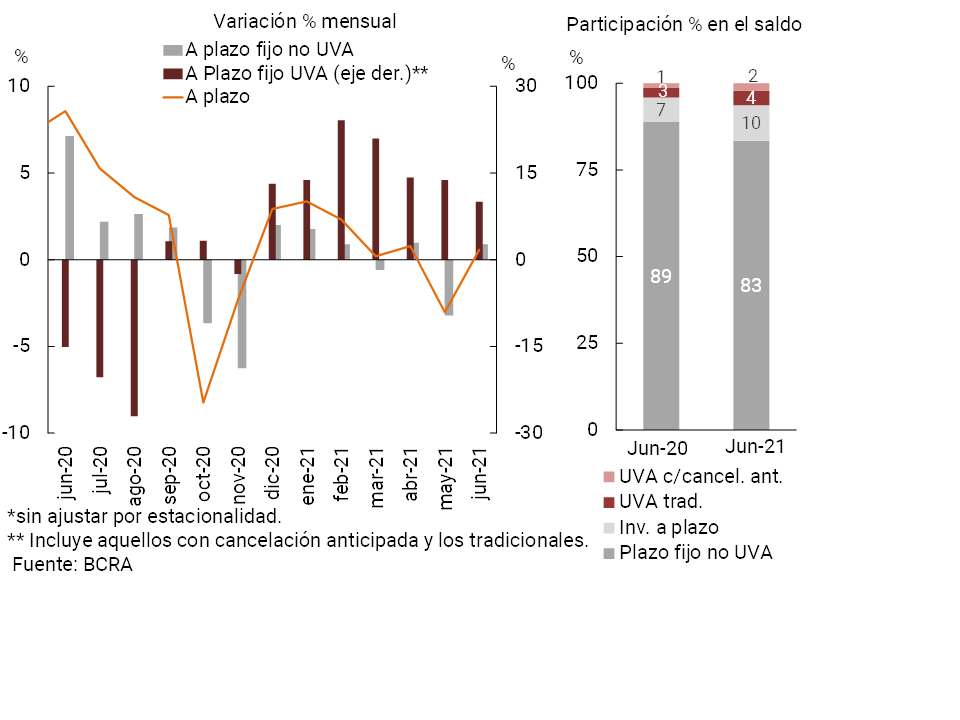
In terms of funding the financial system, the balance of deposits in national currency of the private sector increased 3.9% in real terms in June (+7.2% nominal) (see Chart 3), with greater relative dynamism in private financial institutions. Within this segment, demand accounts grew 7.3% in real terms (+10.7% nominal), partly reflecting the effect of the payment of the half bonus and the higher income from the parity adjustments in some sectors of the population. On the other hand, time deposits in pesos increased 0.6% in real terms in the period (+3.8% nominal), driven mainly by the performance of domestic private financial institutions. In particular, UVA fixed terms continued to show a positive rate of change for the seventh consecutive month, increasing 10% in real terms compared to May (see Chart 4). Disaggregated by type of deposit in UVA, those with early cancellation increased 14.9% in real terms, while traditional UVAs grew 7.7%.
Graph 3 | Balance of private sector deposits in pesos
In real terms*
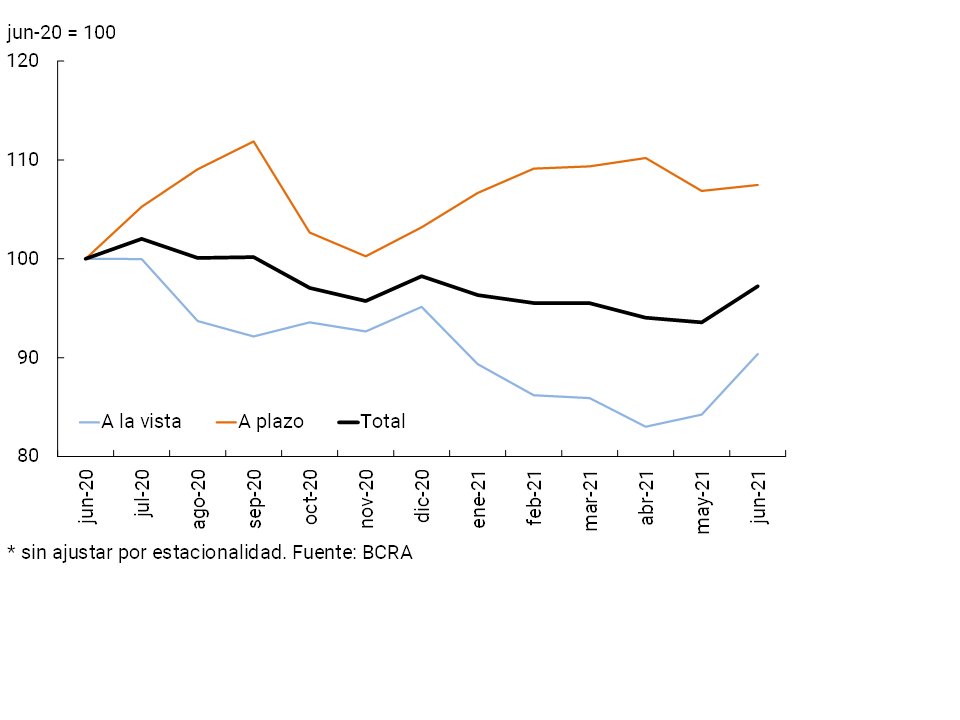
Figure 4 | Balance of private sector time deposits in pesos
In real terms*
Considering the items in foreign currency, in June the balance of deposits in this denomination of the private sector increased 0.4% —in currency of origin—, mainly driven by the performance of public financial institutions. Thus, the balance of total deposits (including domestic and foreign currency) of the private sector increased 2.8% in real terms compared to May (+6.1% nominal).
In the last twelve months, the balance of deposits in pesos of the private sector accumulated a fall of 2.8% in real terms (+46% nominal y.o.y.). The year-on-year performance was driven by demand accounts, which saw a decrease of 9.6% YoY in real terms (+35.7% YoY in nominal terms). On the other hand, time deposits in pesos of the private sector accumulated an increase of 7.5% real y.o.y. (+61.4% nominal y.o.y.). The balance of public sector deposits in national currency increased by 16.7% YoY (+75.4% YoY nominal). In this context, total deposits in pesos (considering both the private and public sectors) grew 0.8% real YoY (+51.4% YoY nominal). Finally, the balance of total deposits (all sectors and currencies) fell by 1.6% YoY in real terms (+47.8% YoY in nominal terms).
II. Aggregate composition of the balance sheet
The balance of total assets of the aggregate financial system increased by 0.6% in real terms in June, mainly due to the performance of private financial institutions (see Chart 5). In a year-on-year comparison, total assets accumulated a 1.5% real drop at the systemic level.
Graph 5 | Total Asset Balance
In real terms
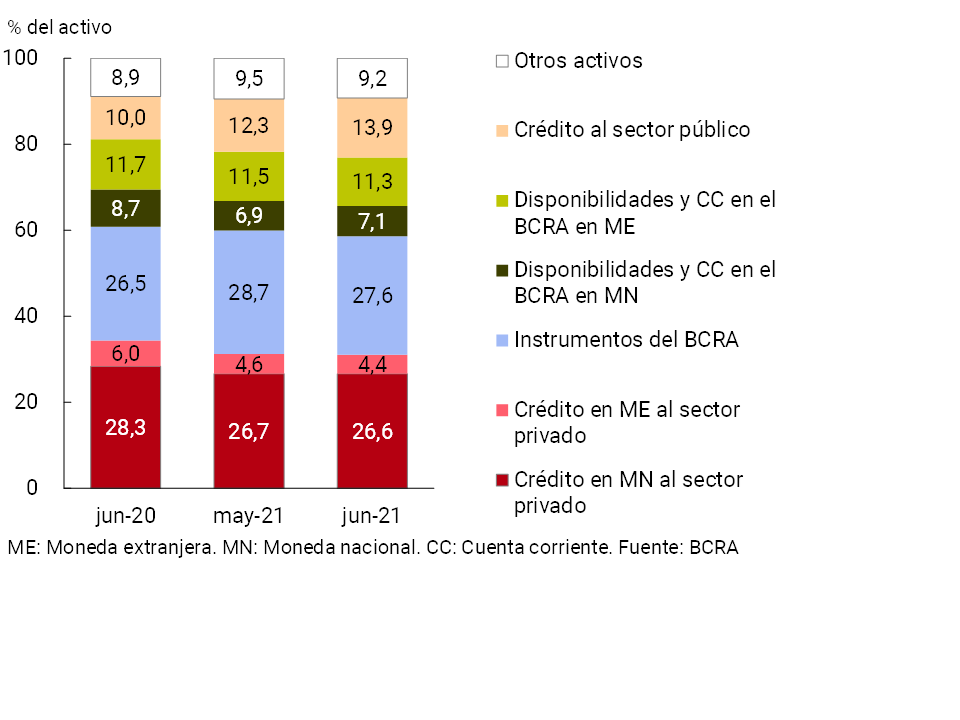
In relation to the components of the total assets of the financial institutions as a whole, in June the relative importance of credit to the public sector increased slightly (partly associated with the possibility of using new national public securities for the integration of minimum cash -for more details see Section IV-) and the balance of current accounts in the BCRA in pesos (see Graph 6). On the other hand, the rest of the items that make up the sector’s assets reduced their weighting in the period.
Graph 6 | Composition of total assets
Financial system – Share %
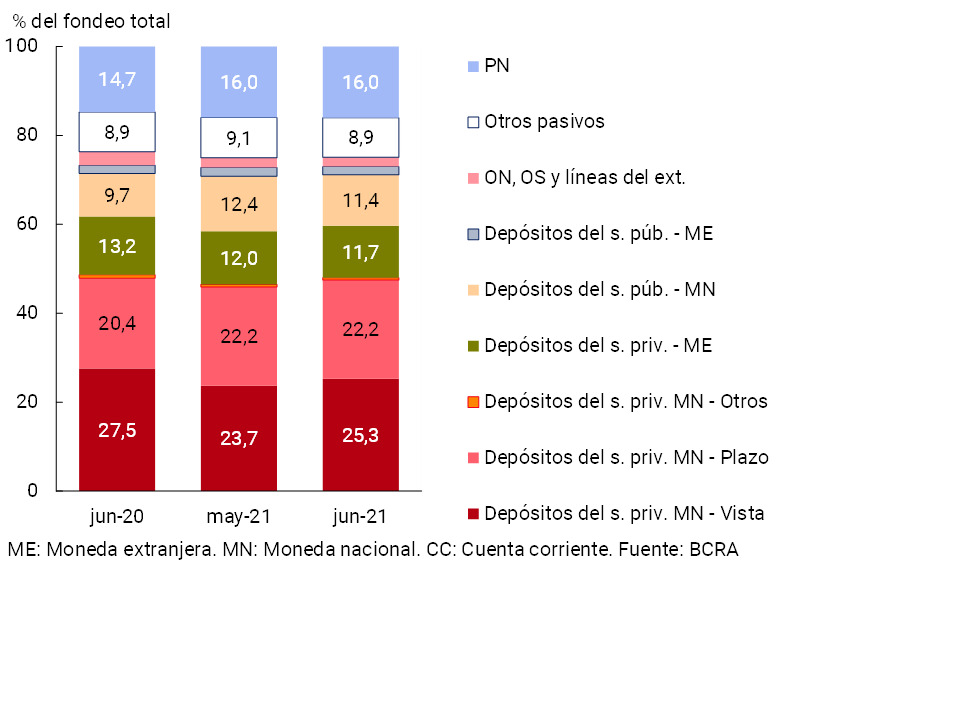
With respect to the composition of the financial system’s funding, the weighting of private sector demand accounts in pesos increased during the month, while there was a fall in the weighting of public sector deposits in the same denomination and private sector deposits in foreign currency (see Chart 7). The remaining items that make up bank funding did not show changes in magnitude in the month at the aggregate level.
Figure 7 | Total system funding composition
In % of total funding (liabilities + equity)
In June, the foreign currency assets of the financial system aggregate totaled 18.1% of total assets, 0.5 p.p. and 1.8 p.p. lower than the record of last May and the same period of 2020, respectively. On the other hand, liabilities in the same denomination represented 16.6% of total funding (liabilities and equity) in the month, decreasing 0.4 p.p. compared to the value of May (-2.1 p.p. y.o.y.). Taking into account the forward purchase and sale of foreign currency – classified off-balance sheet transactions – in June the spread between assets and liabilities of all financial institutions in this denomination represented 7.5% of regulatory capital, remaining unchanged in magnitude compared to last month (+0.1 p.p.) and being 2.8 p.p. lower than the figure for June 2020 (see Chart 8).
Figure 8 | EM Assets – EM Liabilities + EM Forward Position (Financial System)
III. Portfolio quality
In June, the gross exposure of the financial system to the private sector (including domestic and foreign currency) stood at 31% of total assets,13, 0.2 p.p. less than the value recorded in the previous month (-3.3 p.p. y.o.y.). This performance presented a heterogeneous behavior according to group of entities (increase in public and ENFB entities, and fall in the rest). When considering only financing in pesos, the ratio stood at 26.6%, slightly below May (-1.7 p.p. y.o.y.) (see Graph 9). The weighting of credit to the private sector in foreign currency in total assets decreased monthly by 0.2 p.p. to a total of 4.4% in the period (-1.6 p.p. y.o.y.).
Figure 9 | Credit balance to the Private Sector / Assets
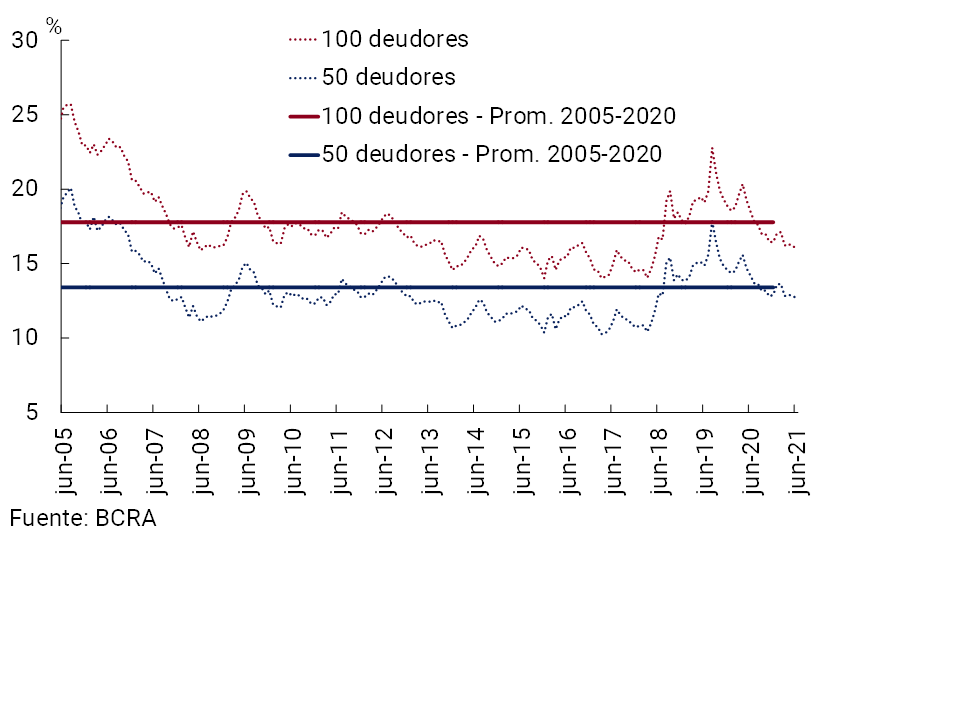
The share of the main debtors (legal and human) in the total loan portfolio of the financial system continued to decline so far in 2021. In particular, the top 100 and 50 private sector debtors14 accounted for 16.1% and 12.7% of the total credit balance in the aggregate of the financial system as of June (see Chart 10), 2.4 p.p. and 1.5 p.p. below the same month of the previous year, respectively. The current levels for these indicators were below the average of the last 16 years, reflecting a moderate concentration of private sector debtors in the financial system15.
Figure 10 | Share of the total balance of credit to the private sector of the main debtors
In June, the transitional scheme that allowed for an increase in the default periods to classify debtors in situation 1, 2 and 3 (60 days until 31/03/2021 and 30 days until 31/05/2021) ended, thus resuming the criteria that were used until 19/03/202016. To date, a financial relief measure remains in force for debtors who are employers covered by the REPRO II program, which gives them the possibility of transferring the unpaid installments of the assistance taken to the end of the life of the credit. In this context, the ratio of irregularity of credit to the private sector for the aggregate financial system rose to 4.8% in the month, 0.6 p.p. above the record for May (slightly below the same month from the level of a year ago), a performance reflected in all groups of entities (more pronounced increase in public financial institutions, see Figure 11).
Figure 11 | Irregularity of credit to the private sector
Irregular financing / Total financing (%)
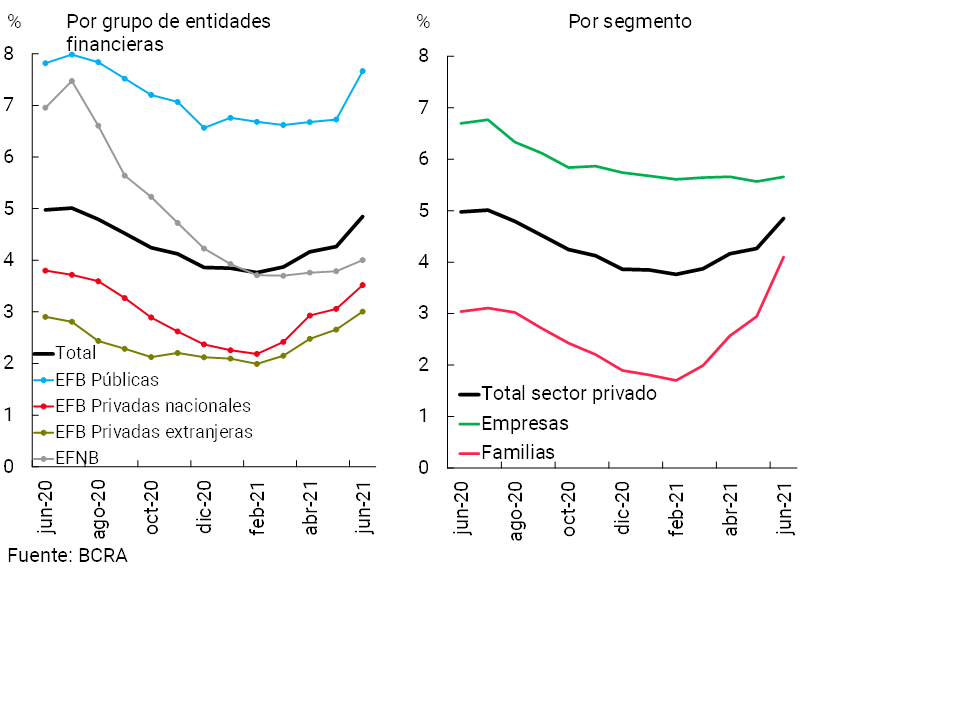
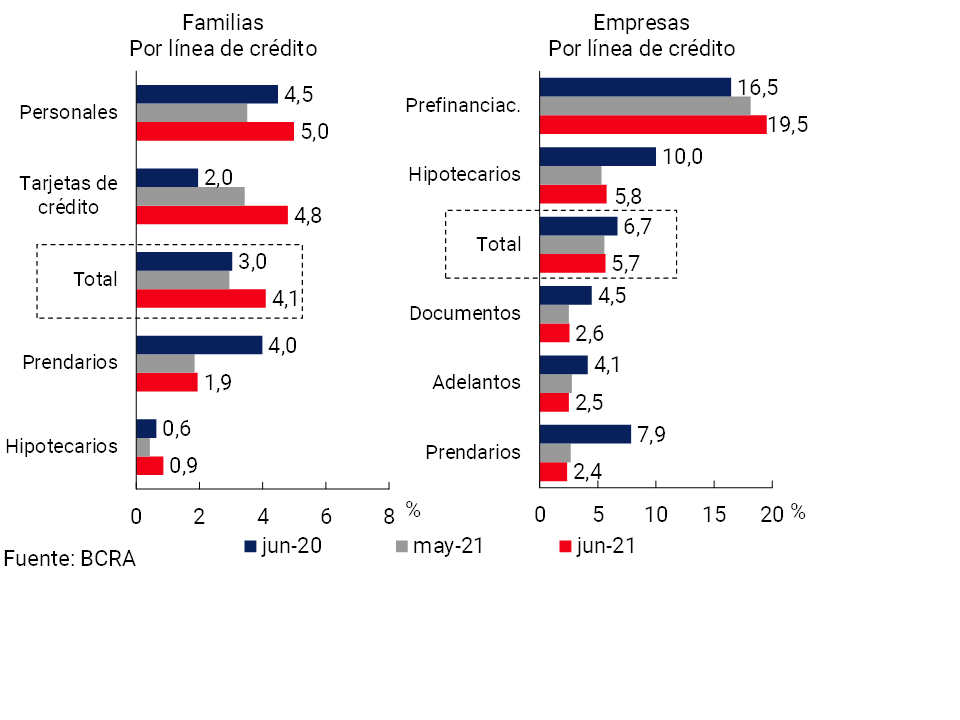
In June, the irregularity of financing to families stood at 4.1% (see Graph 12), 1.2 p.p. above the level of the previous month (+1.1 p.p. y.o.y.). The monthly performance was mainly driven by the increase in delinquencies on consumer loans (personal and credit cards). For its part, the non-performing loan indicator for companies stood at 5.7% in the period, slightly above the May figure (-1 p.p. y.o.y.).
Figure 12 | Irregularity of credit to the private sector
Irregular financing / Total financing (%)
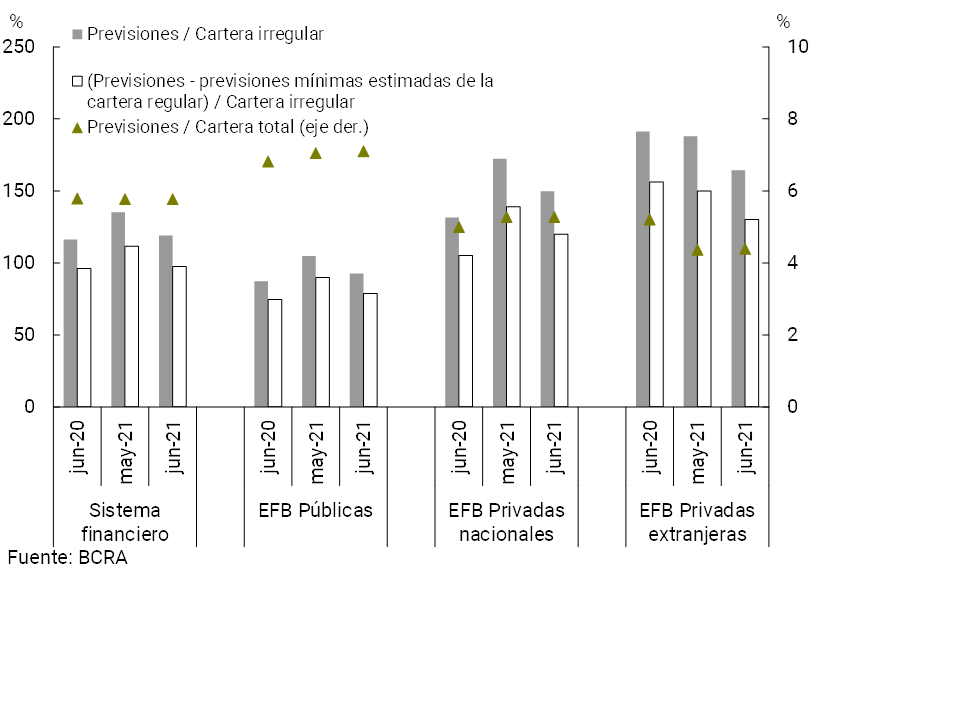
In mid-2021, the total forecasts for the aggregate financial system represented 5.8% of total credit to the private sector, in line with the May and June 2020 figures (see Chart 13). The total forecasts in terms of the non-performing portfolio stood at 119% in the month at the systemic level (-16.3 p.p. monthly and +2.7 p.p. y.o.y.). In June, the balance of regulatory forecasts attributable to the non-performing portfolio (following the criteria of the minimum regulatory forecasts for uncollectibility risk) represented 97.4% of this portfolio for the aggregate of entities.
Figure 13 | Credit to the private sector and forecasts
By Entity Group
IV. Liquidity and solvency
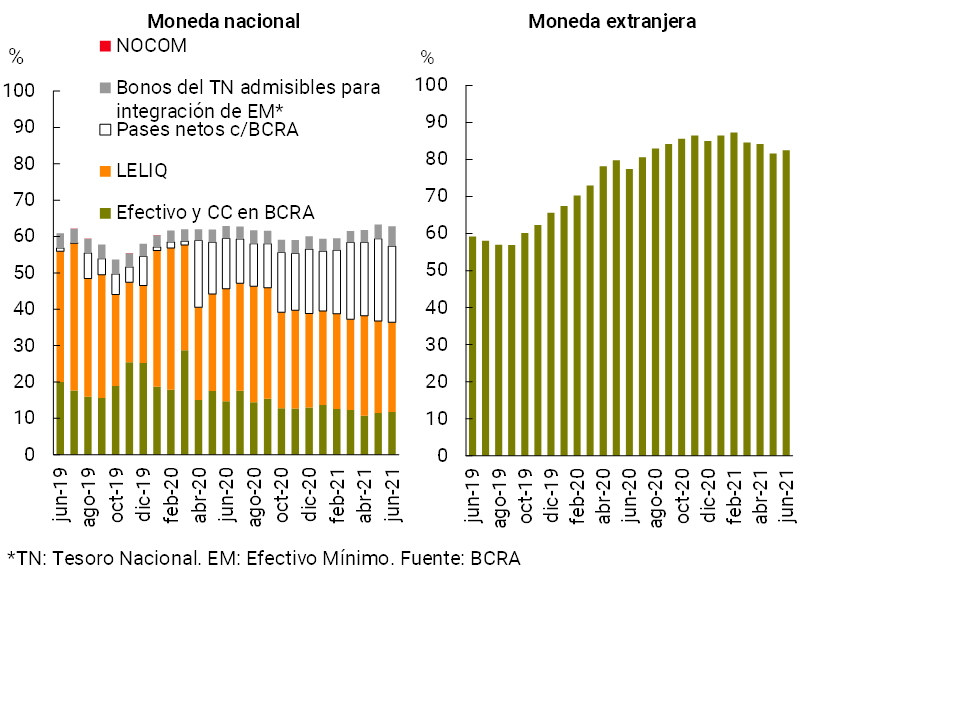
From high levels compared to the average of the last 10 years, the liquidity indicators of the financial system fell slightly in June. In the month, the broad liquidity ratio17 totaled 66.4% of deposits (62.8% considering items in pesos and 82.5% for the foreign currency segment, see Chart 14), 0.3 p.p. less than in May (-0.5 p.p. for the segment in pesos and +0.9 p.p. for items in foreign currency). Regarding the composition of liquid assets in pesos, in June the weighting of net passes with the BCRA and of the holding of LELIQ decreased, while the relevance of the current accounts that financial institutions have in this Institution and of the national public securities eligible for minimum cash integration increased, in line with the regulatory measure of the BCRA that seeks to contribute to the development of the market for domestic capitals-18. In year-on-year terms, ample liquidity increased by 0.6 p.p. of total deposits at the systemic level.
Figure 14 | Liquidity of the financial system
In % of deposits
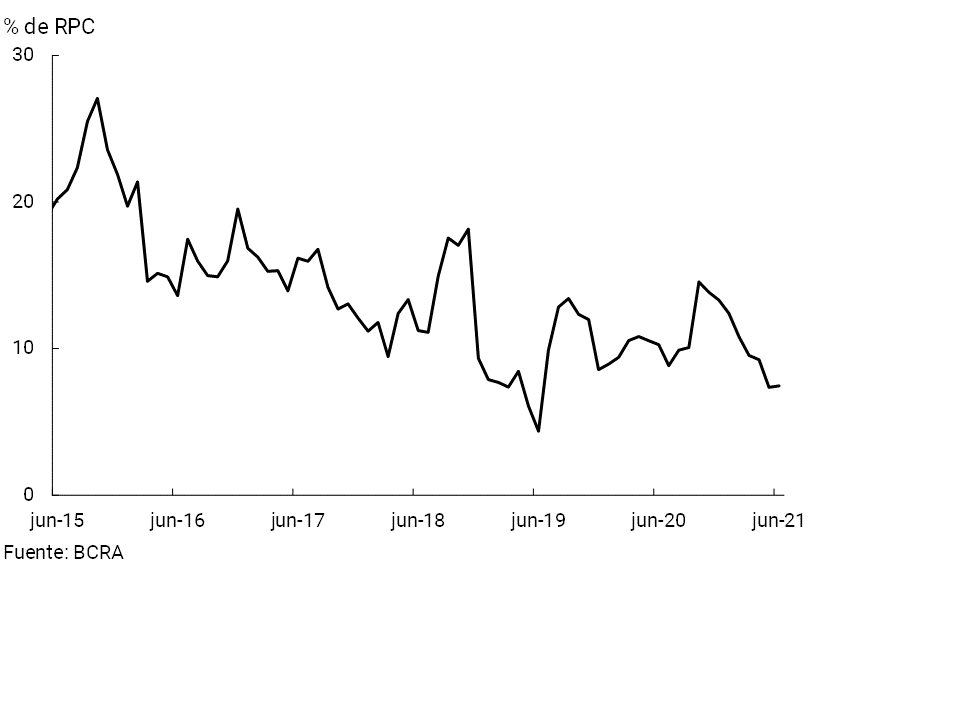
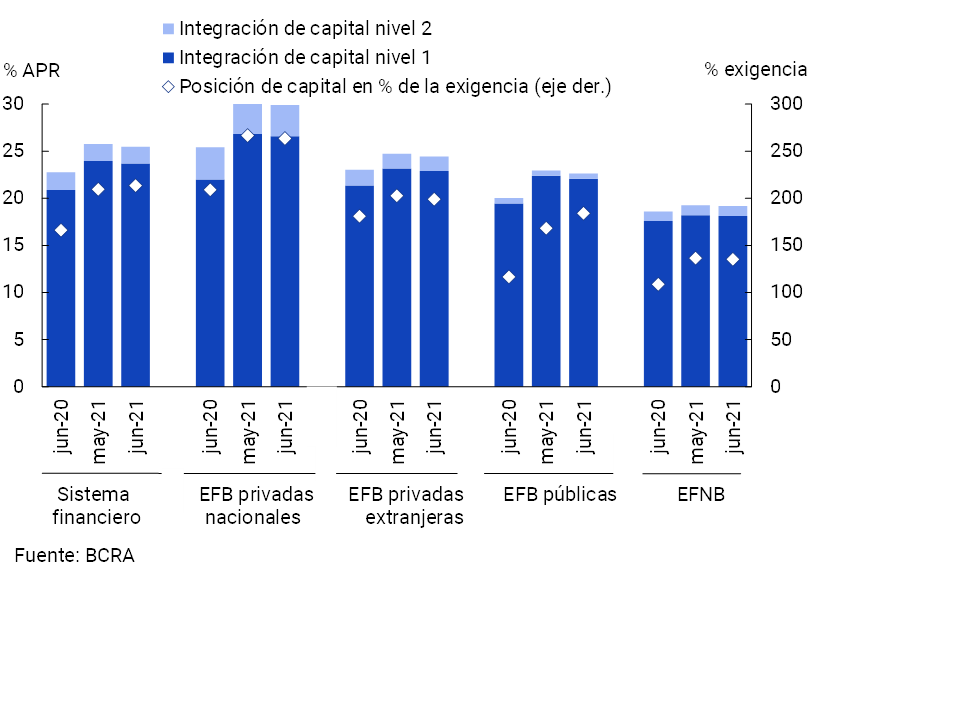
The solvency indicators of the aggregate financial system closed the first half of the year at comfortable levels. In June, the capital integration (RPC) of the group of entities represented 25.5% of risk-weighted assets (RWA) (see Chart 15). Although this level was slightly lower than the previous month, it was 2.7 p.p. higher than the figure for mid-2020. Tier 1 capital – with greater capacity to face eventual losses – totaled 93.1% of regulatory capital as of June. On the other hand, the surplus capital position (RPC net of the regulatory capital requirement) stood at 214% of the regulatory requirement in the month for the financial system as a whole, remaining at comfortable levels in all groups of entities.
Figure 15 | Integration of regulatory capital
By financial institution group
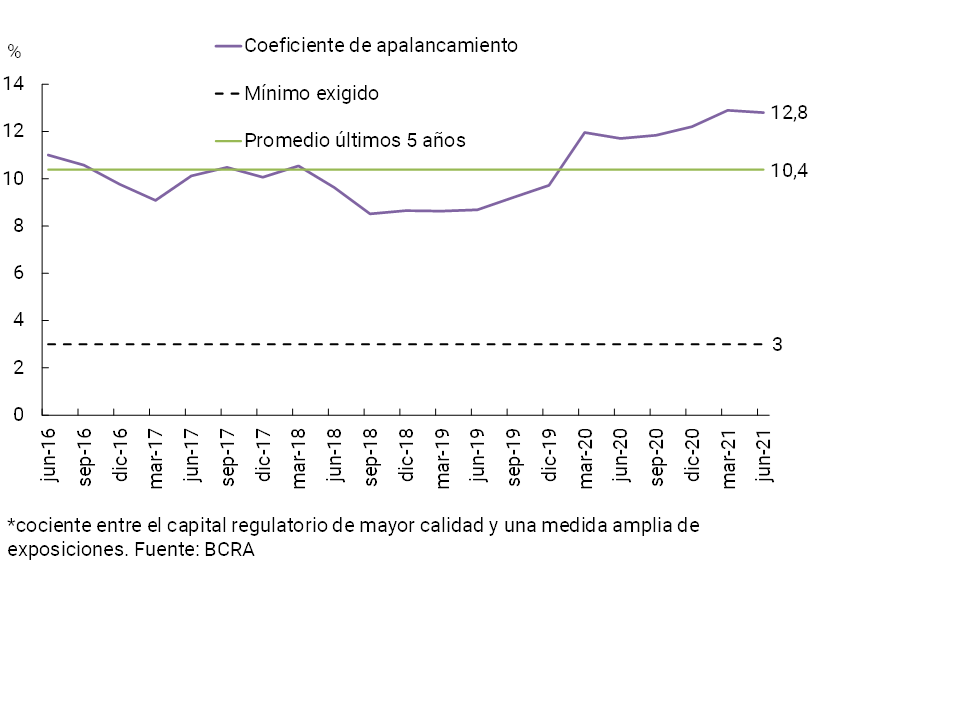
The leverage ratio of19 for the aggregate of entities stood at 12.8% in June, above the minimum threshold of 3% (see Chart 16). In the last 12 months, this ratio increased by 1.1 p.p., exceeding the average of the last 5 years.
Figure 16 | Leverage ratio of the financial system (according to Basel)*
An indicator of the sector’s ability to cope with a possible materialization of credit risk, of an extreme and low-probability nature, is the ratio of excess capital to credit to the private sector net of forecasts. In June, this indicator stood at 31.6%, 7.4 p.p. above the June 2020 record (exceeding the average of the last 10 years of 13.6%).
With regard to the sector’s internal capital generation, in the second quarter of 2021 the financial system recorded a slight increase in profitability indicators compared to the previous quarter, levels that are lower than those of 2020. Cumulative total comprehensive income in homogeneous currency between April and June totaled 1.3%y. of assets (ROA) and 8.3%y. of equity (ROE).
Considering the cumulative figure for the year, the group of entities accrued an ROA of 0.8%y. and an ROE of 5%y. (see Chart 17), levels lower than those recorded in the same period of 2020 (-1.9 p.p. and -13.2 p.p. of assets and equity, respectively). This decrease includes, among other factors, the effect of greater monetary losses, the increase in the cost of funding for deposits in pesos, lower interest income in pesos and a greater relevance of tax burdens. These effects were tempered by higher revenues from both pass premiums and securities, as well as lower income tax accruals, a decrease in uncollectibility charges and a lower relative weight of administrative expenses, among others.
Figure 17 | Comprehensive total profit in homogeneous currency of the financial system
V. Payment system
In the first part of the year, electronic means of payment continued to gain ground in the operations of families and companies, in a context in which the BCRA continues to encourage the dynamism of these means of payment, without neglecting the security of operations.
During July, online transfers in pesos, made up of immediate transfers (TI) and online credit transfers18, increased compared to June: 8.6% in amounts and 6.6% in real amounts (see Graph 18). This positive performance was reflected both in IT and in online credit transfers20. Within IT, the dynamism of operations carried out through mobile banking stood out in the month (+12% in amounts and +14.2% in real amounts). On the other hand, online credit operations increased 11.2% in quantities and 4.8% in real amounts compared to June. Compared to the same month of the previous year, the number of online transfers in pesos more than doubled and presented an increase of 25.6% in real amounts. This year-on-year dynamism was explained by the performance of online credit operations (+517% YoY in quantities and 156% YoY in real amounts) and IT (+29.6% YoY in quantities and +14.2% YoY in real amounts).
Figure 18 | Online Transfers: Immediate (TI) and Online Credit
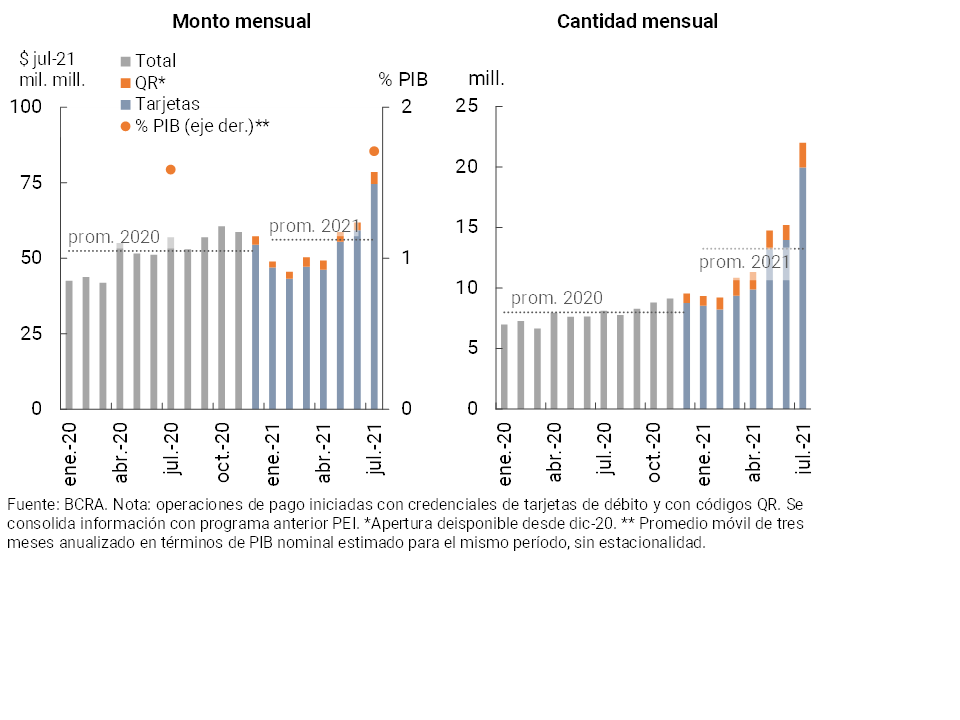
In July, payments by transfer – with immediate credit for merchants and without commissions for end users21 – increased markedly compared to June (44.6% in amounts and 27.2% in real amounts, see Graph 19). Within this group, payments initiated through QR presented a relatively greater dynamism than those made by card, although the use of QR still explains a small portion (9.3% of the number of transactions in July and 5.1% in amount, while cards account for 90.7% and 94.9%, respectively). In relation to payments initiated through QR, the BCRA recently ordered that financial institutions and payment system providers (PSPs) generate a QR code within 60 days that identifies the accounts of their commercial customers22. Currently, merchants can offer the QR system to receive payments through the acceptors or payment processors that offer them the service. This new QR differs from the existing ones because it directly identifies the merchant’s account, allowing immediate crediting via transfer, with the lowest commission in the system23. Compared to the same month of the previous year, payments with transfer increased in amounts (170.7%) and in real amounts (38%).
Figure 19 | Transfer payments
Initiation methods
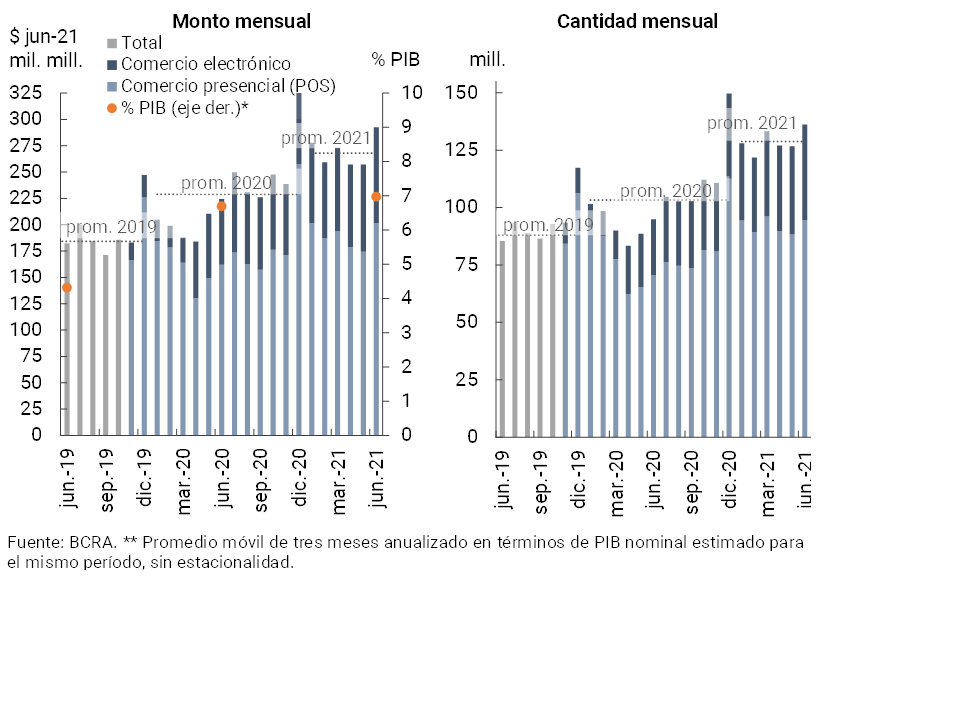
During June (latest available information) debit card transactions increased compared to the immediately previous month (+7.5% in amounts and 10.4% in real amounts). This performance was reflected in both electronic and face-to-face transactions24 (see Chart 20). In a year-on-year comparison, debit card transactions grew in amounts (43.6%) and in real amounts (26.5%), a dynamic mainly explained by the electronic format (+72.1% in amounts and +45.3% in real amounts). In this way, operations in electronic format continued to gain share in the total, totaling 30.6% in amounts and 31.1% in amounts in June.
Figure 20 | Debit card transactions
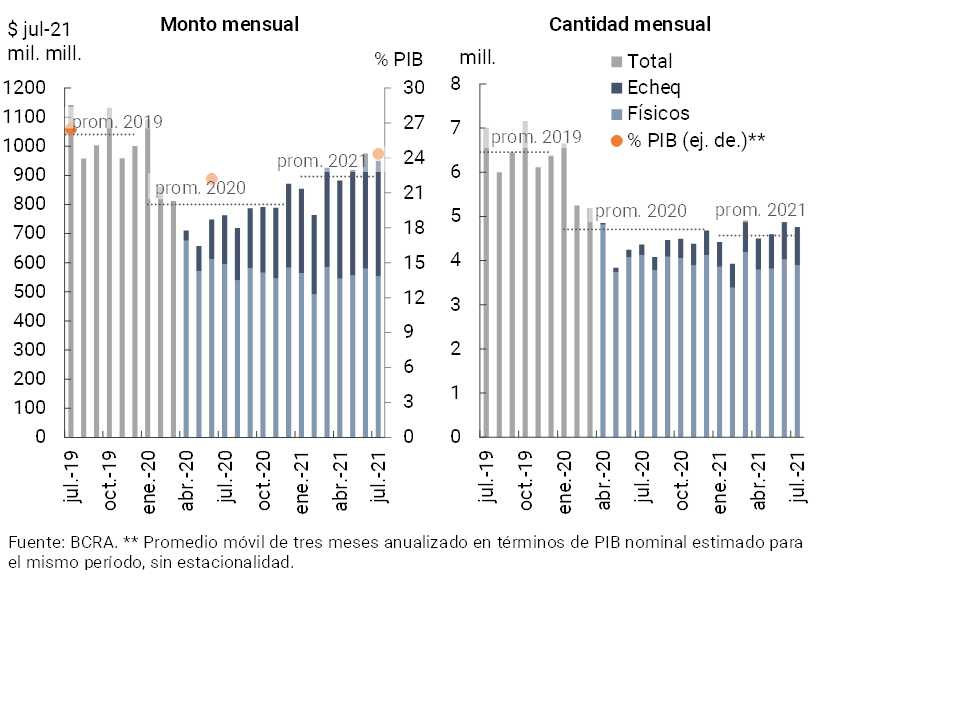
Total check clearing decreased in July compared to June (2.3% in amounts and 2.5% in amounts, see Chart 21), although it remained at levels above the 2021 average. In the ECHEQs modality, operations increased (3% in quantities and 0.6% in real amounts), while in the physical format they decreased (3.4% in quantities and 4.6% in amounts). Compared to the same month of the previous year, total transactions through check clearing increased in quantities (9%) and in real amounts (24.6%), with a considerable increase in the use of ECHEQs (253.3% in quantities and 137.2% in real amounts). Operations through ECHEQs increased their weighting in the total, totaling 18.2% (+12.6 p.p. y.o.y.) in July in quantities and 41.8% (+19.9 p.p. y.o.y.) in amounts. Driven by the dynamism of the ECHEQs, the compensated value (measured in real terms) in the year increased when compared to the 2020 average, reversing the trend observed in recent years. Among the main advantages of the ECHEQ, the following stand out: (i) simplification of the operation of issuance, endorsement, negotiation and circulation in general, through digital channels: (ii) unlimited endorsements; (iii) reduction of operating costs compared to the traditional check; (iv) greater safety and effectiveness since it allows us to know with certainty its traceability; (v) minimizes the reasons for rejection. In addition to facilitating operations and reducing costs for all actors in the system, ECHEQ has a particularly favorable impact on MSMEs throughout the country. The electronic check is a source of financing that is relevant for micro and small enterprises because it facilitates its negotiation, being able to be carried out electronically and remotely, reducing operational costs, transfer and verification of documents.
Figure 21 | Check clearing
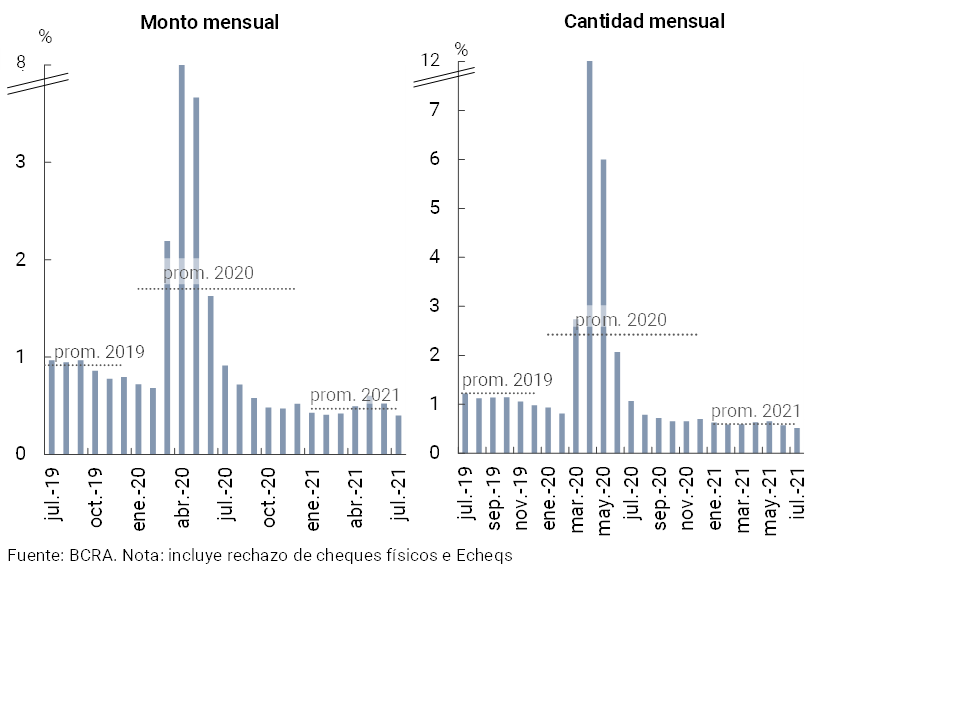
The rejection of checks due to lack of funds in terms of the total compensated decreased in July compared to June, both in amounts (-0.06 p.p., to 0.52%) and in amounts (-0.13 p.p., to 0.4%). The current levels of this ratio are moderate and below the 2021 average. (see Graph 22).
Figure 22 | Bounce checks due to insufficient funds
References
1Differences in balance sheet balances expressed in homogeneous currency. Information extracted from the Monthly Accounting Information Regime (June 2021 latest information available at the time of publication of this Report).
2Includes principal adjustments and accrued interest
3Throughout the Report, when reference is made to groups of private (national and/or foreign) and public financial institutions, it corresponds to banking entities. Non-bank entities will be referred to as “EFNB”
4For more details, see Ordered text “Financing line for productive investment in MSMEs”.
5See Communication “A” “7082” and Communication “A” “7102”.
6 For more details see “Resolution 754/21 of the Ministry of Productive Development”.
7See Communication “A” “7114”.
8 See communication “A” “7334″.
9See Communication “A” “6993″.
10See Communication “A” “7082″.
11See Communication “A” “7342″.
12See Communication “A” “7341″.
13This ratio reached 29.2% of net of the forecast accounting balance.
14Considering their debt in aggregate form in the financial system, they are not necessarily the main debtors in each of the financial institutions.
15It should be noted that current regulations set certain limits on large exposures to credit risk, which implies lower concentrations (see “https://www.bcra.gob.ar/archivos/Pdfs/Texord/t-gerc.pdf”).
16 See Communication “A” 6938″, Communication “A” 7107″, Communication “A” 7181″, Communication “A” “7245” and Point 2.1.1. of the Ordered Text “Financial Services in the framework of the Health Emergency Provided for by Decree No. 260/2020 CORONAVIRUS (COVID-19)“.
17 Considers availability, integration of minimum cash and BCRA instruments, in national and foreign currency.
18 In June, the regulations came into force that allow financial institutions to integrate with national public securities in pesos (excluding those linked to the price of the dollar) acquired by primary subscription, with a residual term of not less than 180 days and not more than 450 days, the portion of the minimum cash requirement that can be verified with LELIQ (for more detail, see Communication “A” 7290″). It should be considered that since 2018 financial institutions were already authorized to integrate part of the aforementioned requirements with “National Treasury Bonds in pesos at a fixed rate” (maturing in 2020 / 2022).
19Defined according to the guidelines set by the Basel Committee (ratio between the highest quality regulatory capital and a wide measure of exposures).
20Online credit is a transfer operation with instant accreditation associated with operations with uniform virtual keys (CVU), and managed by the Electronic Chamber for the Clearing of Means of Payment (COELSA). In the case of immediate transfers (IT), the administration of operations corresponds to the Link and Banelco networks.
21 Transfer payments represent a separate set of operations from online transfers. They correspond to payments initiated with debit card credentials and with open QR codes, while consolidating information previously presented as Immediate Electronic Payment (PEI). For a reference on this new type of operations see, for example, “Payments with Transfer begins to operate”.
22Until now they had a CBU/CVU number and an alias as identification codes.
23For more detail, see “A QR code is created to simplify payment by transfer”.
24The dynamics of face-to-face purchases took place in a context of a certain opening of the restrictions associated with the pandemic.
Share on


