Summary
• Financial intermediation of all entities with the private sector increased in July. The real balance of credit to the private sector in pesos grew 1.3% in the month, driven by lines with real guarantee and those destined for consumption. It is estimated that in July more than 4,200 new mortgage loan debtors entered the financial system, accumulating about 34,000 in the last 12 months. In year-on-year terms, the real balance of financing to the private sector in pesos increased 65.1%. On the side of the segment in foreign currency, the balance of financing to the private sector increased 5.8% compared to the previous month -in currency of origin- (146% y.o.y.).
• The real balance of private sector deposits in pesos fell in July (-2.5%), partly due to the influence of seasonal factors, which were mainly reflected in the performance of non-interest-bearing demand accounts. In year-on-year terms, the real balance of private sector deposits in pesos grew 17.4%, with a greater relative dynamism of time deposits. For its part, the balance of private sector deposits in foreign currency grew 5.4% in the month (74.9% YoY) -in currency of origin-.
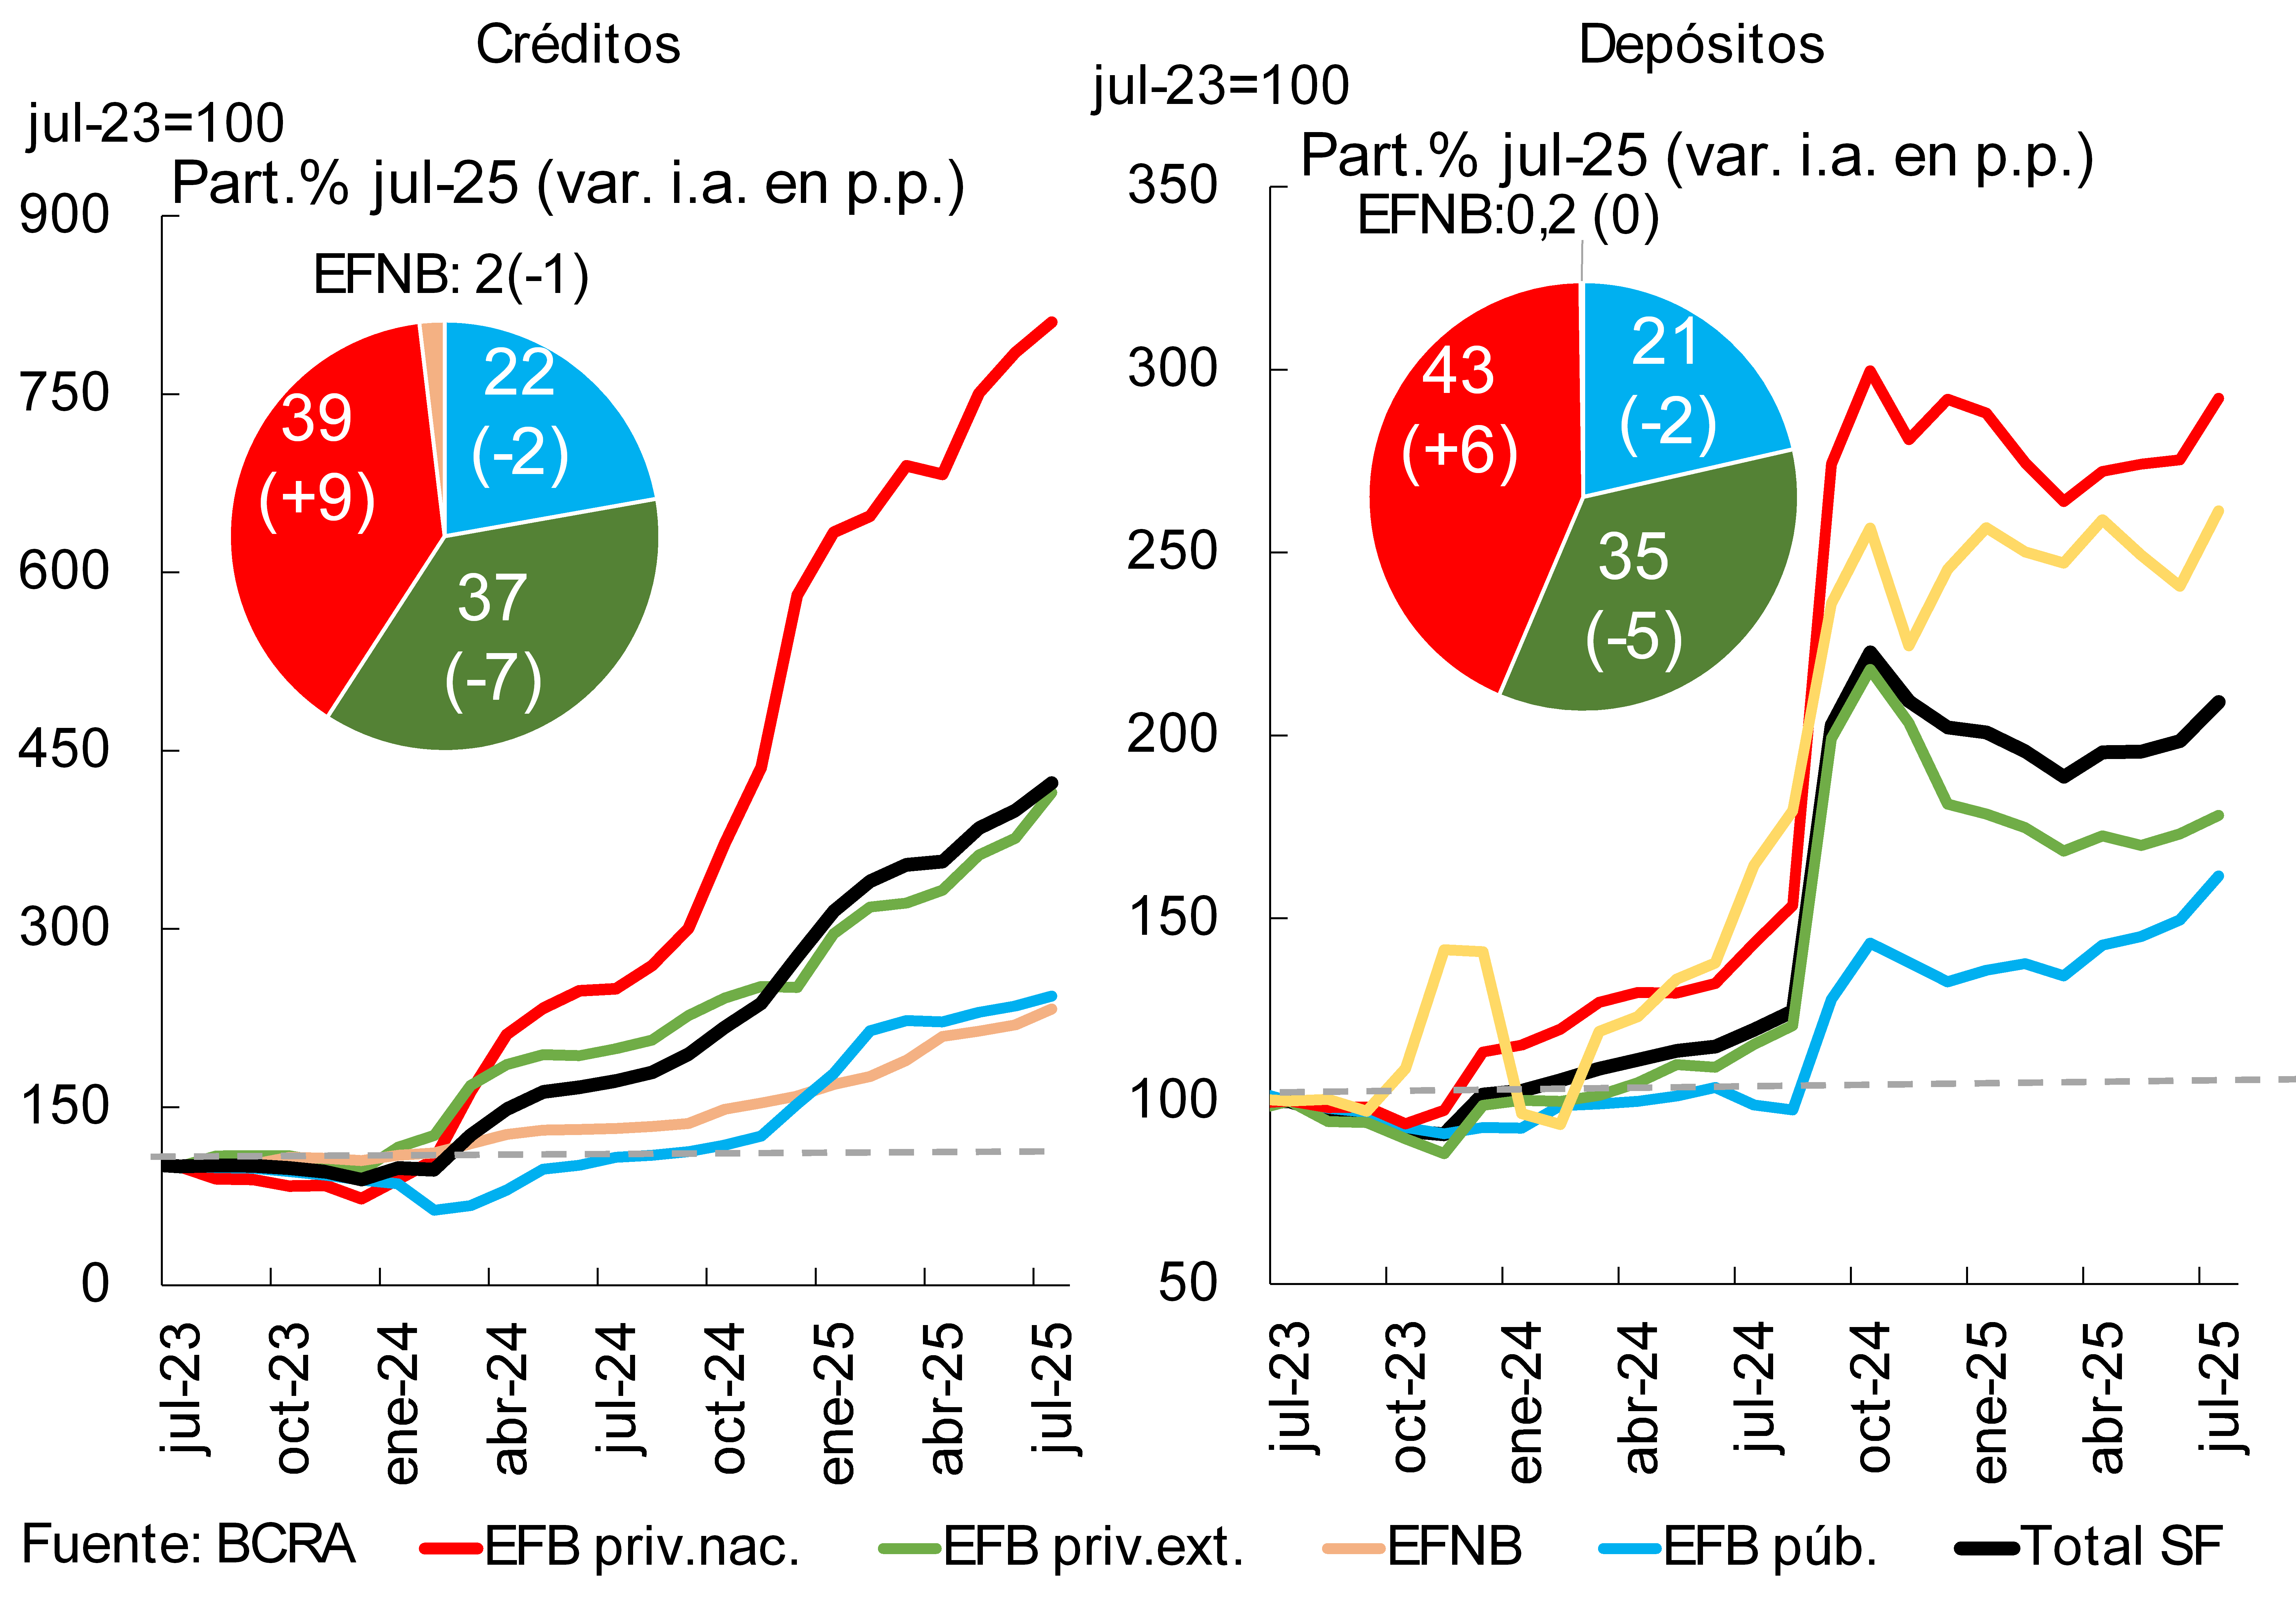
• The share of credit to the private sector in the total assets of all financial institutions increased in the month (0.9 p.p., to 43%), while financing to the public sector fell (-3.3 p.p., to 28.5%). This dynamic continued to widen the gap between the two concepts, to 14.5 p.p. of the assets of the financial system.
• In July, the non-performing loan ratio to the private sector reached 3.2%, 0.3 p.p. above June. The non-performing loan indicator for households stood at 5.6% in the month, while the irregularity coefficient for financing to companies totaled 1.2%. The balance of total forecasts of the financial system represented 115% of the portfolio in an irregular situation and 3.7% of the total credit balance to the private sector.
• The systemic liquidity indicator in pesos, which considers exclusively availabilities, increased 1.9 p.p. of deposits in national currency in July, to 14.9% (3 p.p. y.o.y.). The broad liquidity ratio in pesos represented 43.5% of deposits in the same denomination, decreasing 3.1 p.p. compared to June (-10.3 p.p. y.o.y.), mainly due to the effect of the maturity of the LEFI. In the current context of increased loans in foreign currency, in July the liquidity ratio of foreign currency items decreased by 1.3 p.p. of deposits in this denomination, to represent 59.1% (-17.5 p.p. y.o.y.).
• In July, the financial system continued to present relatively high solvency indicators. Regulatory capital integration (RPC) stood at 26.9% of risk-weighted assets (RWA) (-1.2 p.p. compared to June) and 47.6% of the balance of credit to the private sector net of forecasts (-2.2 p.p. in the month; higher than the average of the last 10 years of 42.8%). The capital position (CPR minus minimum regulatory requirements) reached 232% of the regulatory requirement for all entities (-15.5 p.p. monthly; exceeding the average of the last 10 years of 179%).
• In the accumulated of the last 7 months to July, the total comprehensive result in homogeneous currency of the financial system was equivalent to 1% annualized (a.) of assets (ROA) and 4.2% y. of net worth (ROE), levels that are lower than those observed a year ago.
I. Financial intermediation activity
Financial intermediation between all entities and the private sector increased in July. Considering the most relevant movements (in homogeneous currency) of the aggregate balance in pesos of the financial system, the main source of funds in the month came from the maturity of the LEFI. On the other hand, the real balance of other bank assets increased in the aggregate period (financing to the private sector, other public sector instruments and current accounts at the BCRA) and, to a lesser extent, the real balance of private sector deposits decreased. As for the foreign currency segment, in July the balance of deposits increased and financing to the private sector and liquid assets increased. 1
The balance of credit to the private sector in pesos grew 1.3% in real terms in July, with increases in all groups of financial institutions (see Chart 1). Secured credit lines and consumer credit lines increased compared to June (3.4% real and 2% real, respectively), while the trade credit segment decreased (-1.6% real). In year-on-year terms, the real balance of financing to the private sector in pesos increased 65.1%.
Graph 1 | Real balance of credit to the private sector in pesos*
Monthly changes
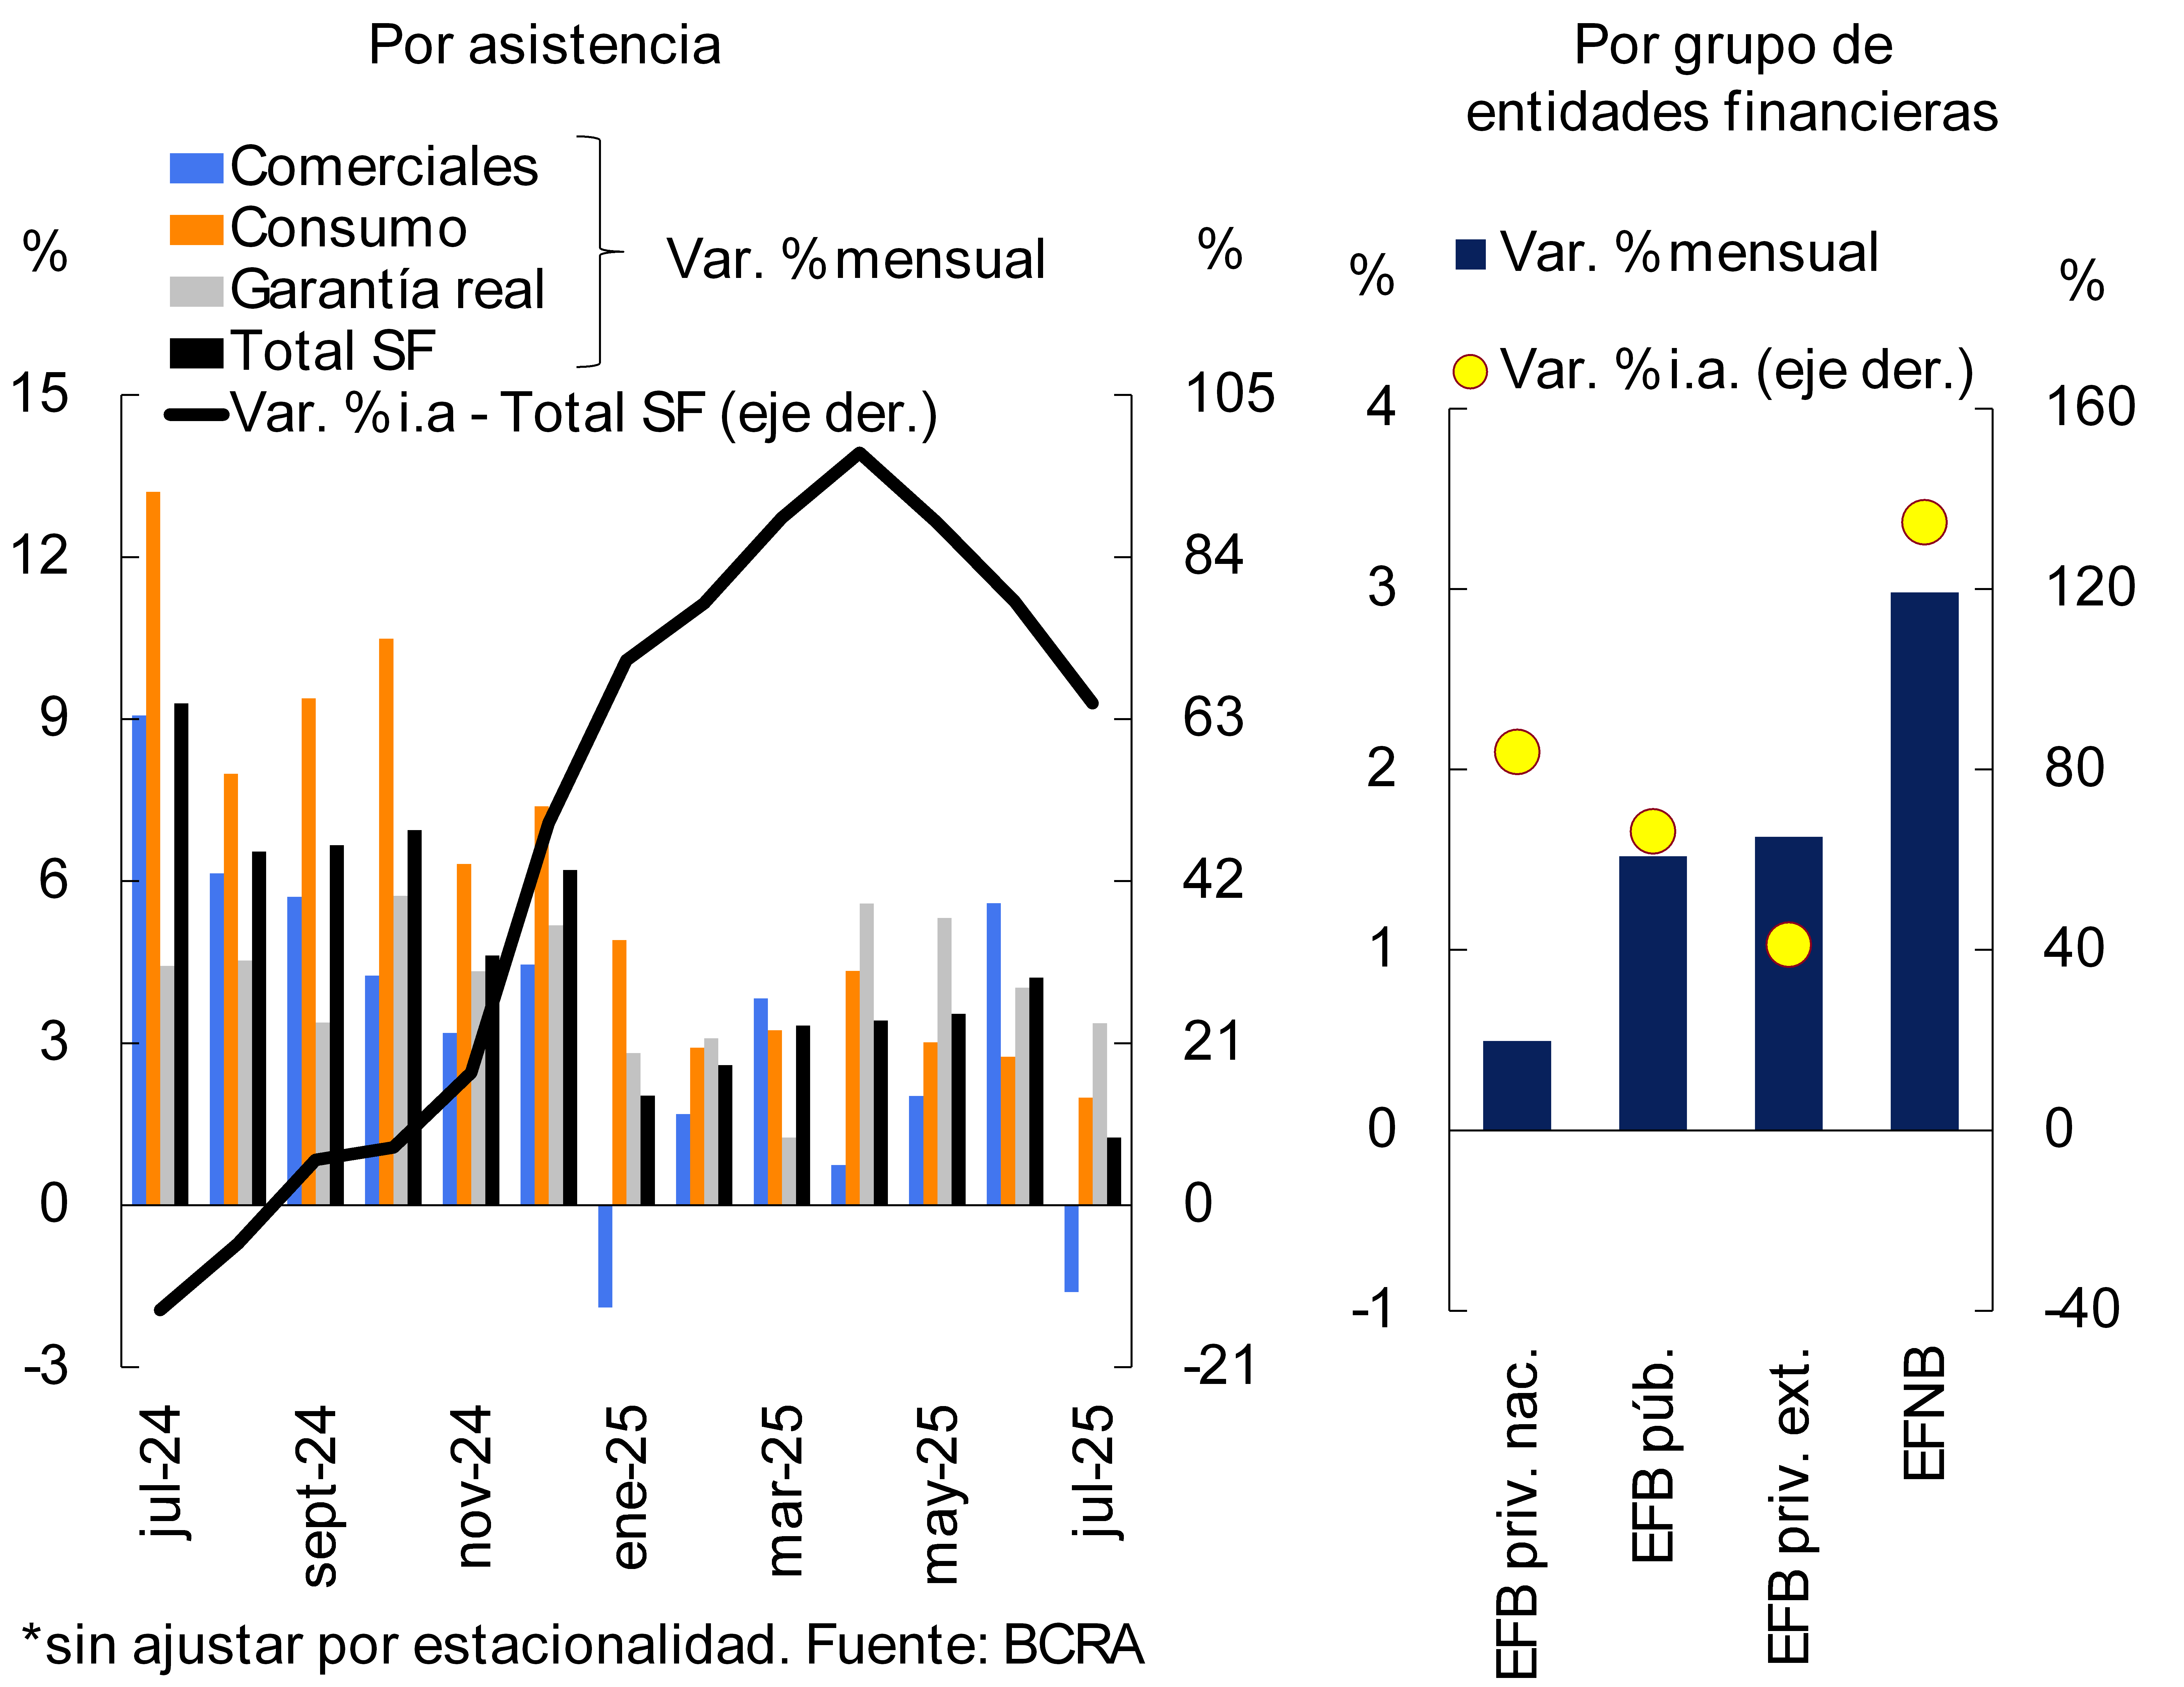
Chart 2 : Foreign currency financial intermediation to the private sector
In relation to the segment in foreign currency, the balance of credit to the private sector increased 5.8% compared to the previous month -in currency of origin- (see Graph 2), boosted mainly by private banks. In a year-on-year comparison, the balance of foreign currency financing to the private sector grew 146% -in source currency-.
In July, the real balance of total credit (in domestic and foreign currency) to the private sector increased by 4.3% compared to the previous month2, with increases in both loans channeled to companies and households. The real balance of financing to companies grew 4.9% between the peak of the month, mainly explained by the primary production sector (contributing 59% of the monthly increase)3. For its part, the real balance of credit to households increased 3.6% in the period, with increases in all credit assistance, especially credit cards and mortgage lines4.
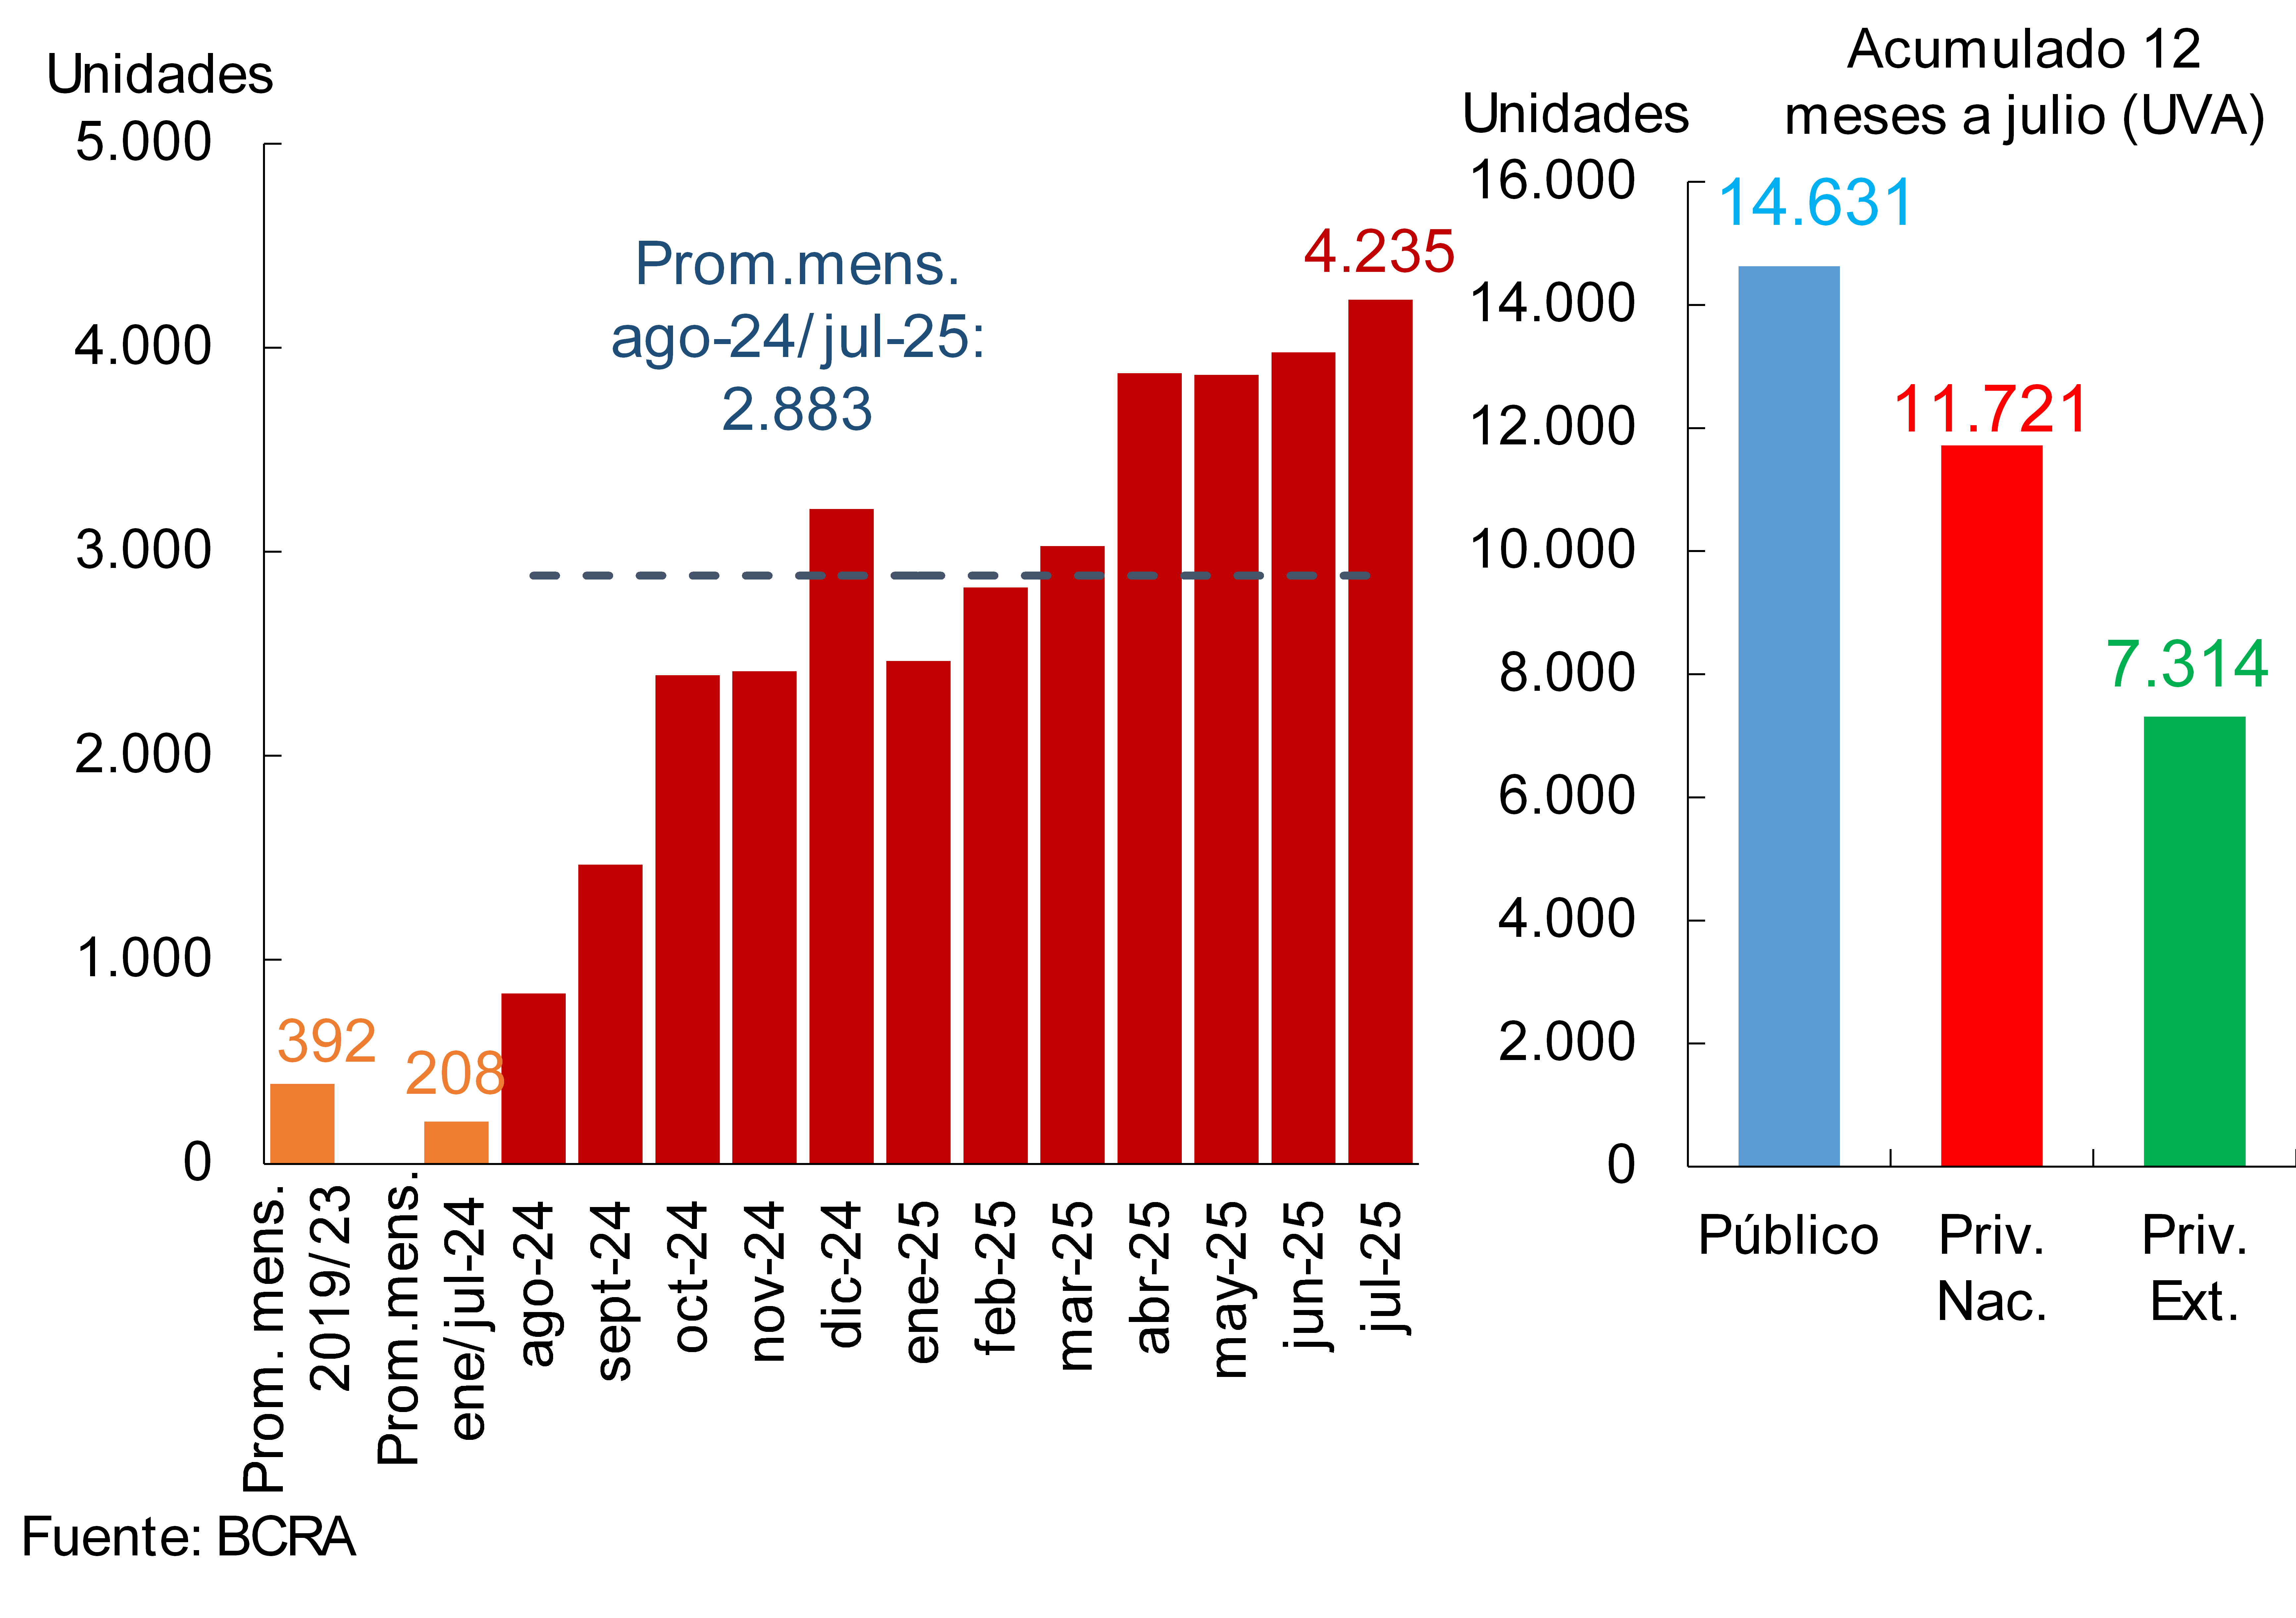
In July, it is estimated that more than 4,200 new mortgage loan debtors (“registrations” of individuals entered the financial system), an increase of 6.5% compared to last month (see Graph 3). In the accumulated of the last 12 months, it is estimated that the number of new mortgage debtors reached about 34,000, 43.5% of whom are customers of public financial institutions.
Graph 3 | Estimation of mortgage registrations (individuals)
Financial system
Graph 4: Real balance of private sector deposits in pesos*.
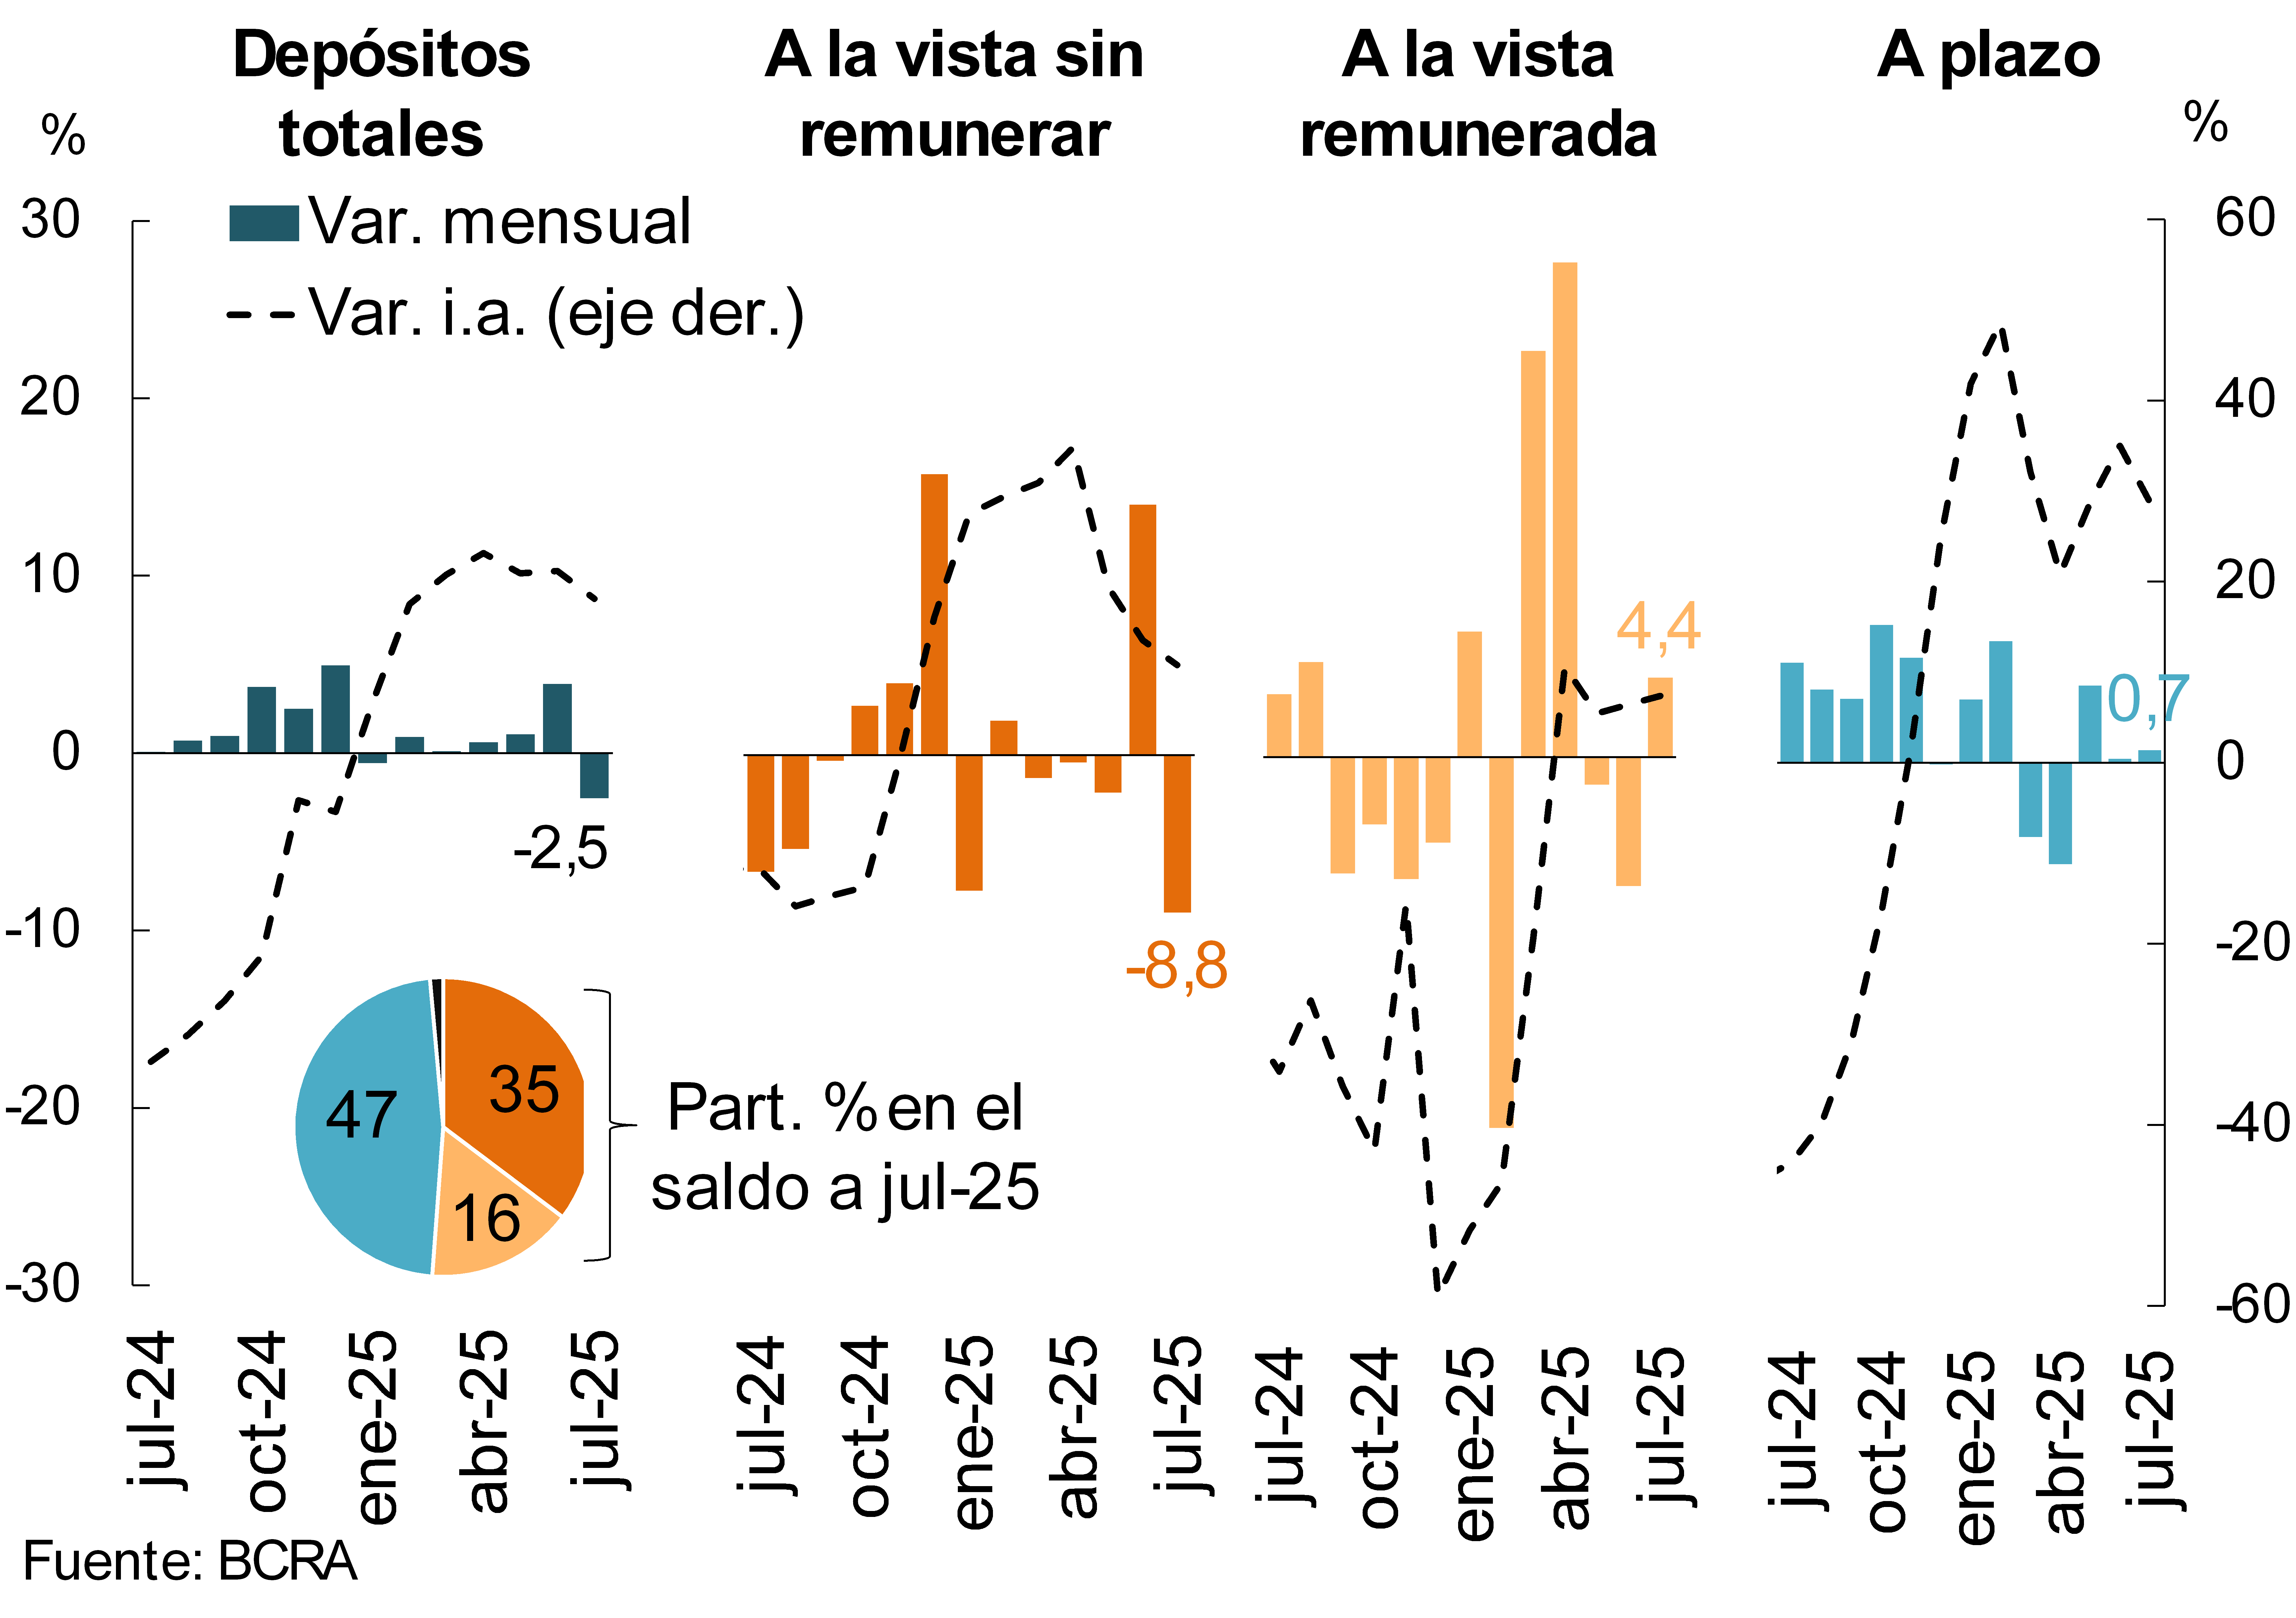
The real balance of private sector deposits in pesos fell by 2.5% in July (see Chart 4)5 in the context of seasonal factors. This performance was mainly explained by non-interest-bearing demand accounts, which decreased 8.8% in real terms between the end of the month, while interest-bearing demand deposits increased 4.4% in real terms6. For its part, the balance of time deposits in pesos of the private sector increased 0.7% compared to June7. In year-on-year terms, the real balance of private sector deposits in pesos grew 17.4%, with a greater relative dynamism of time deposits8.
In July, the balance of private sector deposits in foreign currency increased by 5.4%, accumulating a year-on-year growth of 74.9% (see Chart 2)9. The total balance of deposits (covering all currencies and sectors) increased by 2.9% in real terms compared to June (28.5% YoY in real terms).10
II. Evolution and aggregate composition of the balance sheet
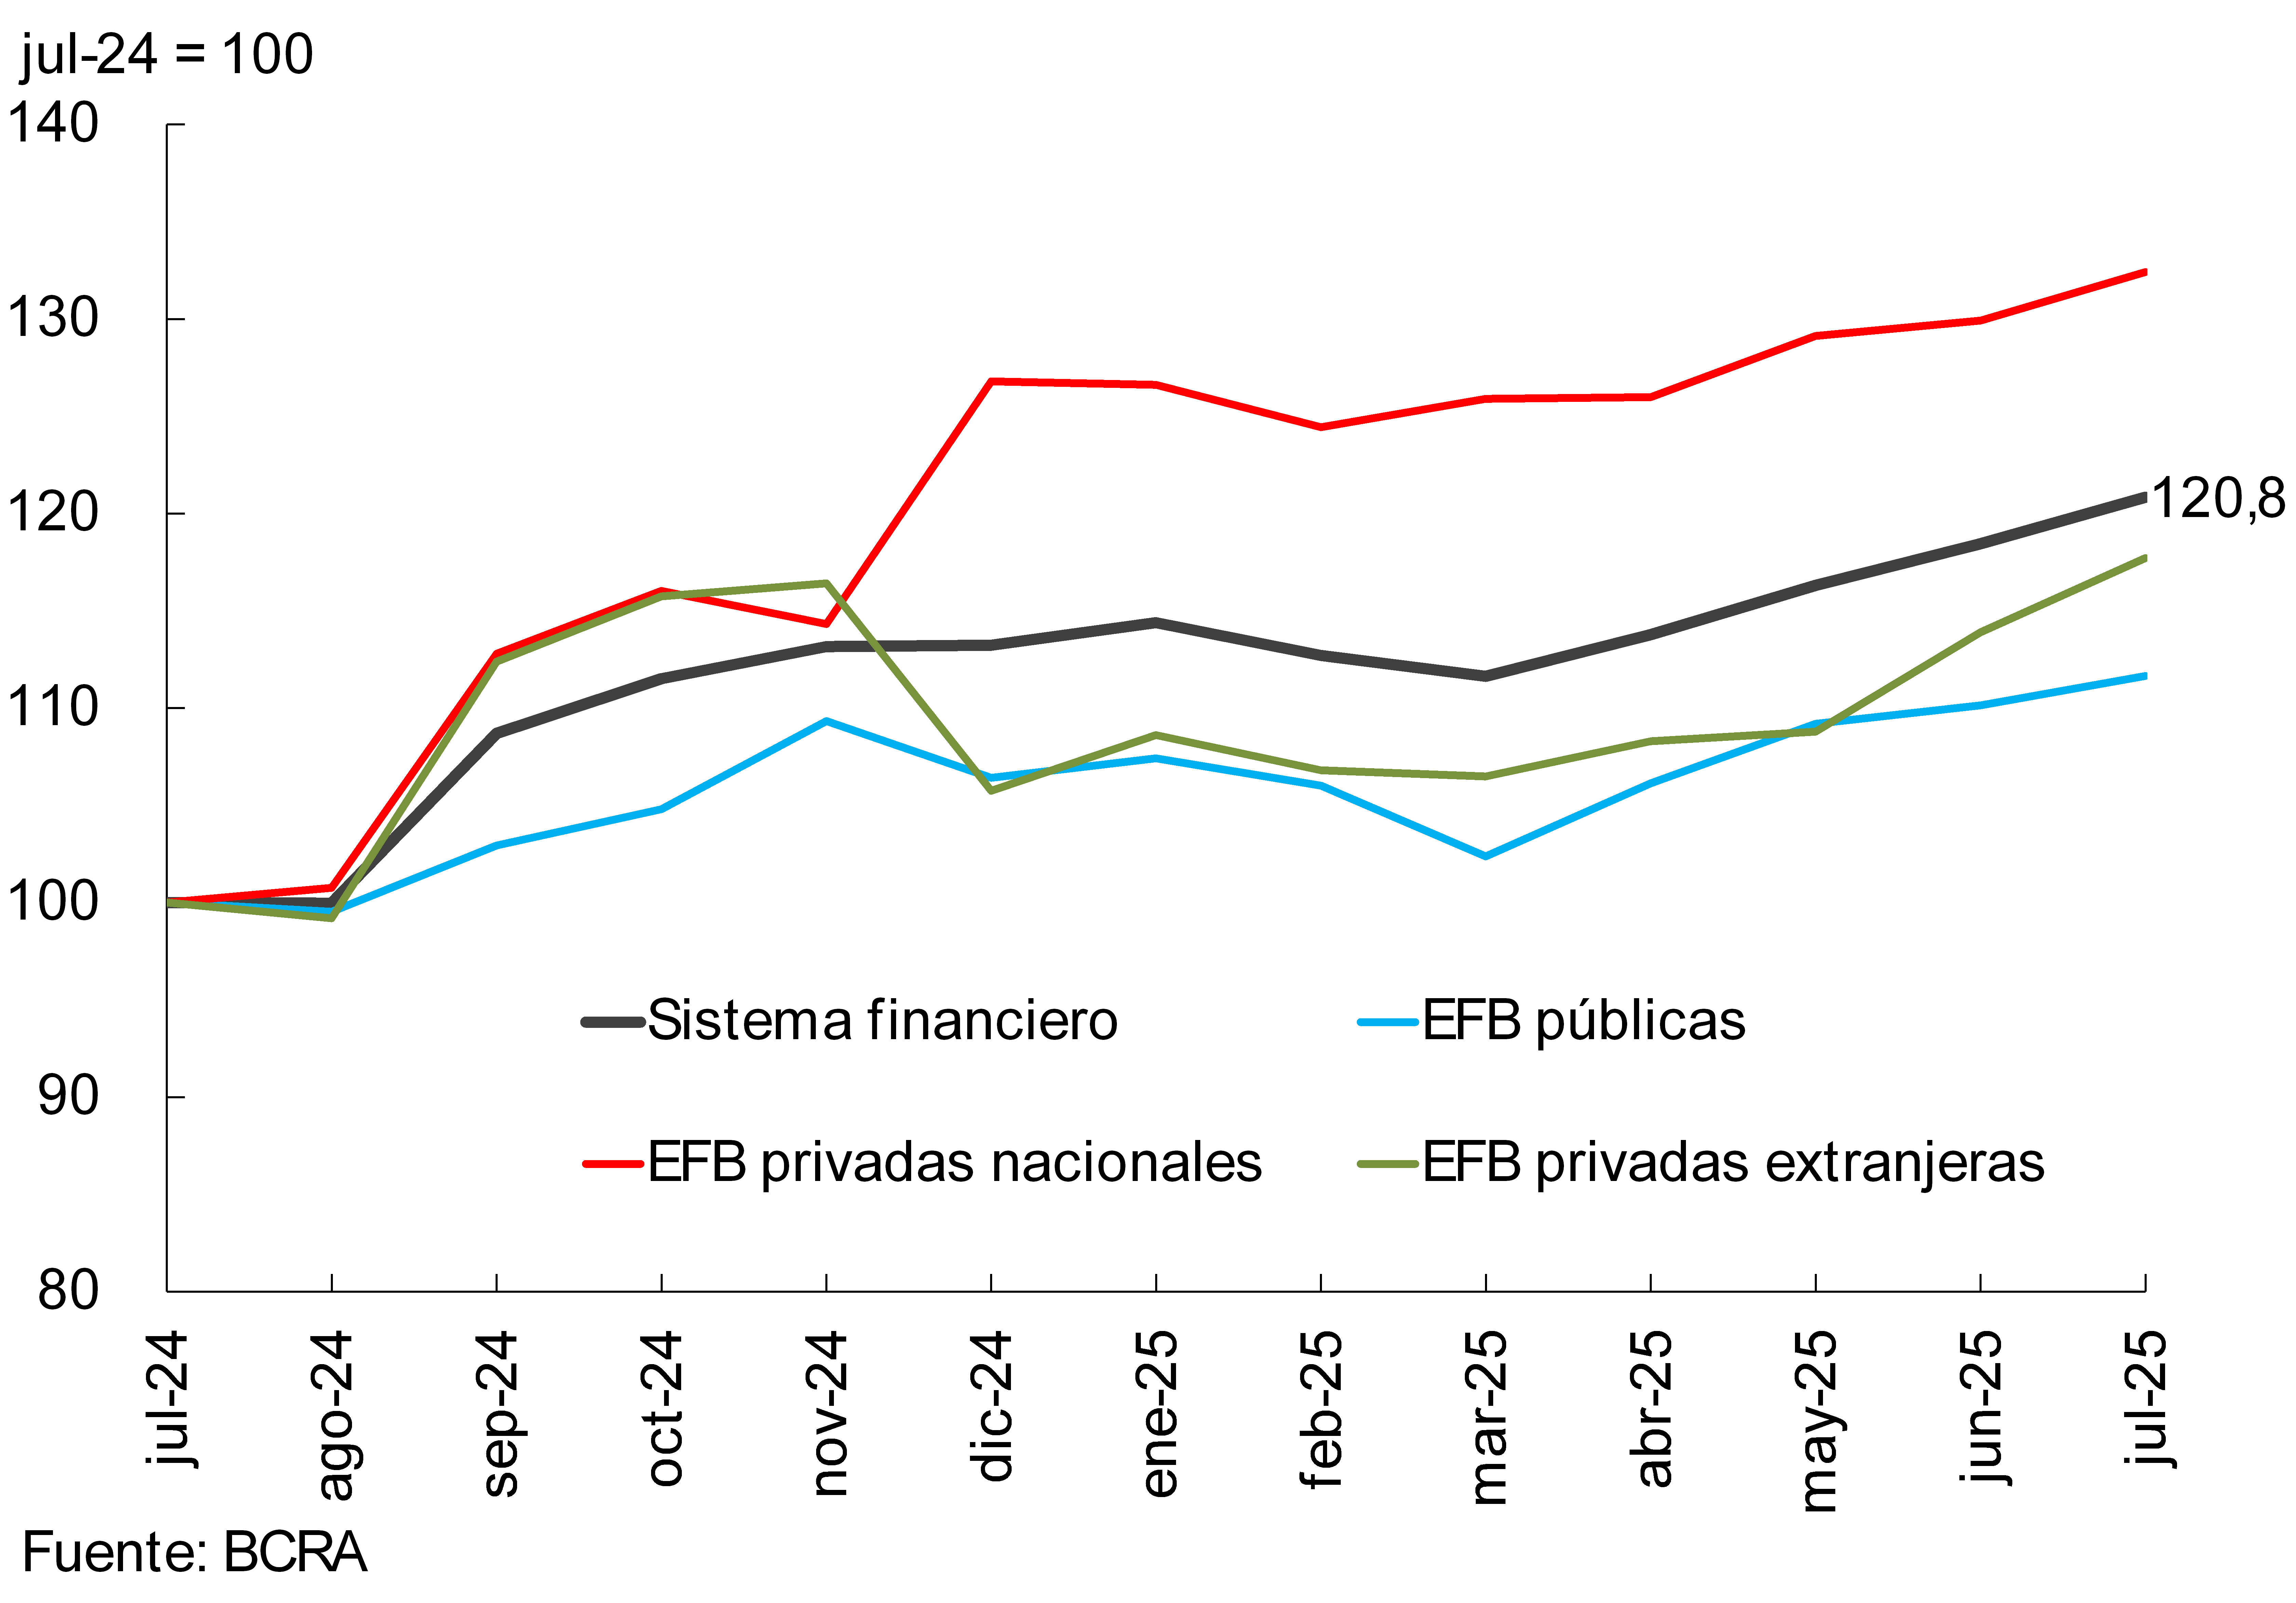
In July, the total assets of the financial system grew 2% in real terms, with a general increase in the different groups of banks (see Graph 5). In this way, total assets accumulated an increase of 20.8% in homogeneous currency compared to the record of a year ago.
Graph 5 | Total assets of the financial
system In real terms
Graph 6 | Composition of assets and funding
Financial system – Participation %
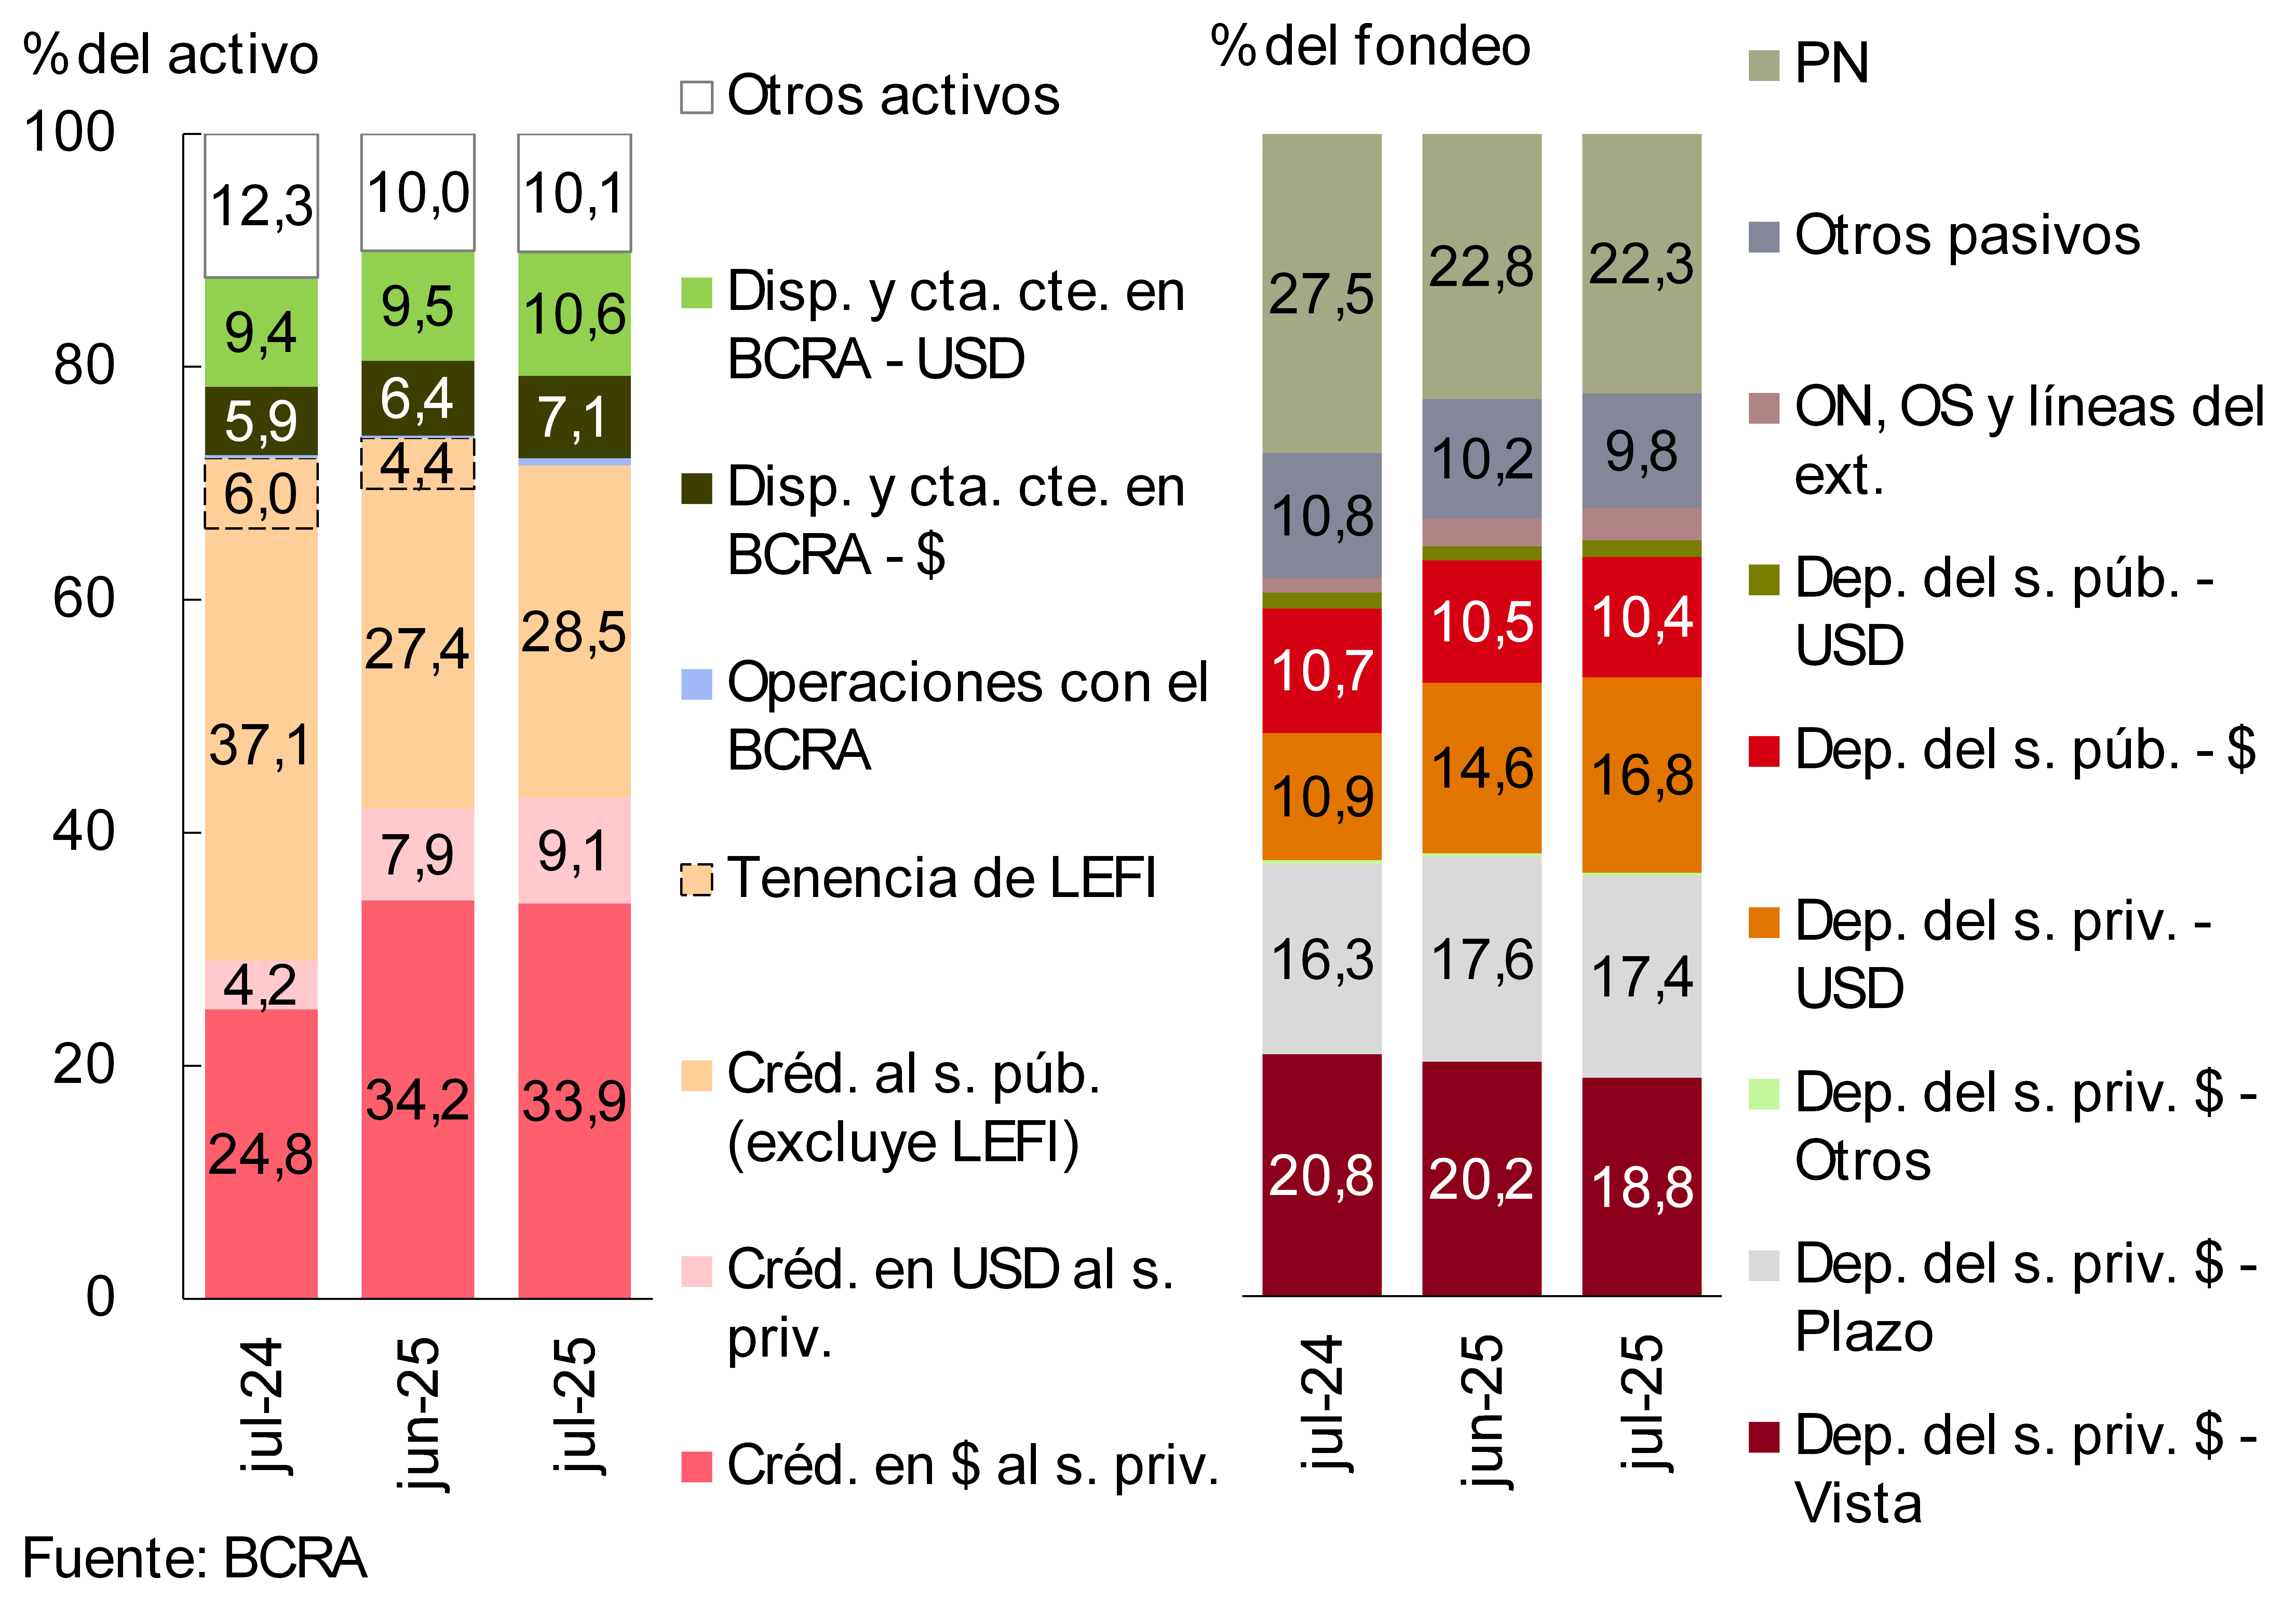
The share of credit to the private sector in the total assets of all financial institutions increased in the month (0.9 p.p., to 43%), while financing to the public sector fell (-3.3 p.p., to 28.5%; see Figure 6). This dynamic continued to widen the gap between the two concepts, to 14.5 p.p. of the assets of the financial system. During the period, the relative weight of current accounts at the BCRA in foreign currency and pesos also increased. In terms of funding, between the end of the month, the share of foreign currency deposits in the private sector grew, while demand deposits in pesos in the same sector decreased in their relevance in the total (see Graph 6).
The estimated difference between assets and liabilities denominated in foreign currency reached 5.7% of the regulatory capital of the financial system in the period (0.5 p.p. compared to June and -8.5 p.p. y.o.y.). On the other hand, the spread between assets and liabilities with a CER adjustment clause (or agreed in UVA) stood at 89.1% of the sector’s regulatory capital, with a monthly increase of 1.4 p.p., although 18.1 p.p. below the level of a year ago (in line with the lower holding of public securities with a CER clause in the institutions’ portfolio).
III. Portfolio quality
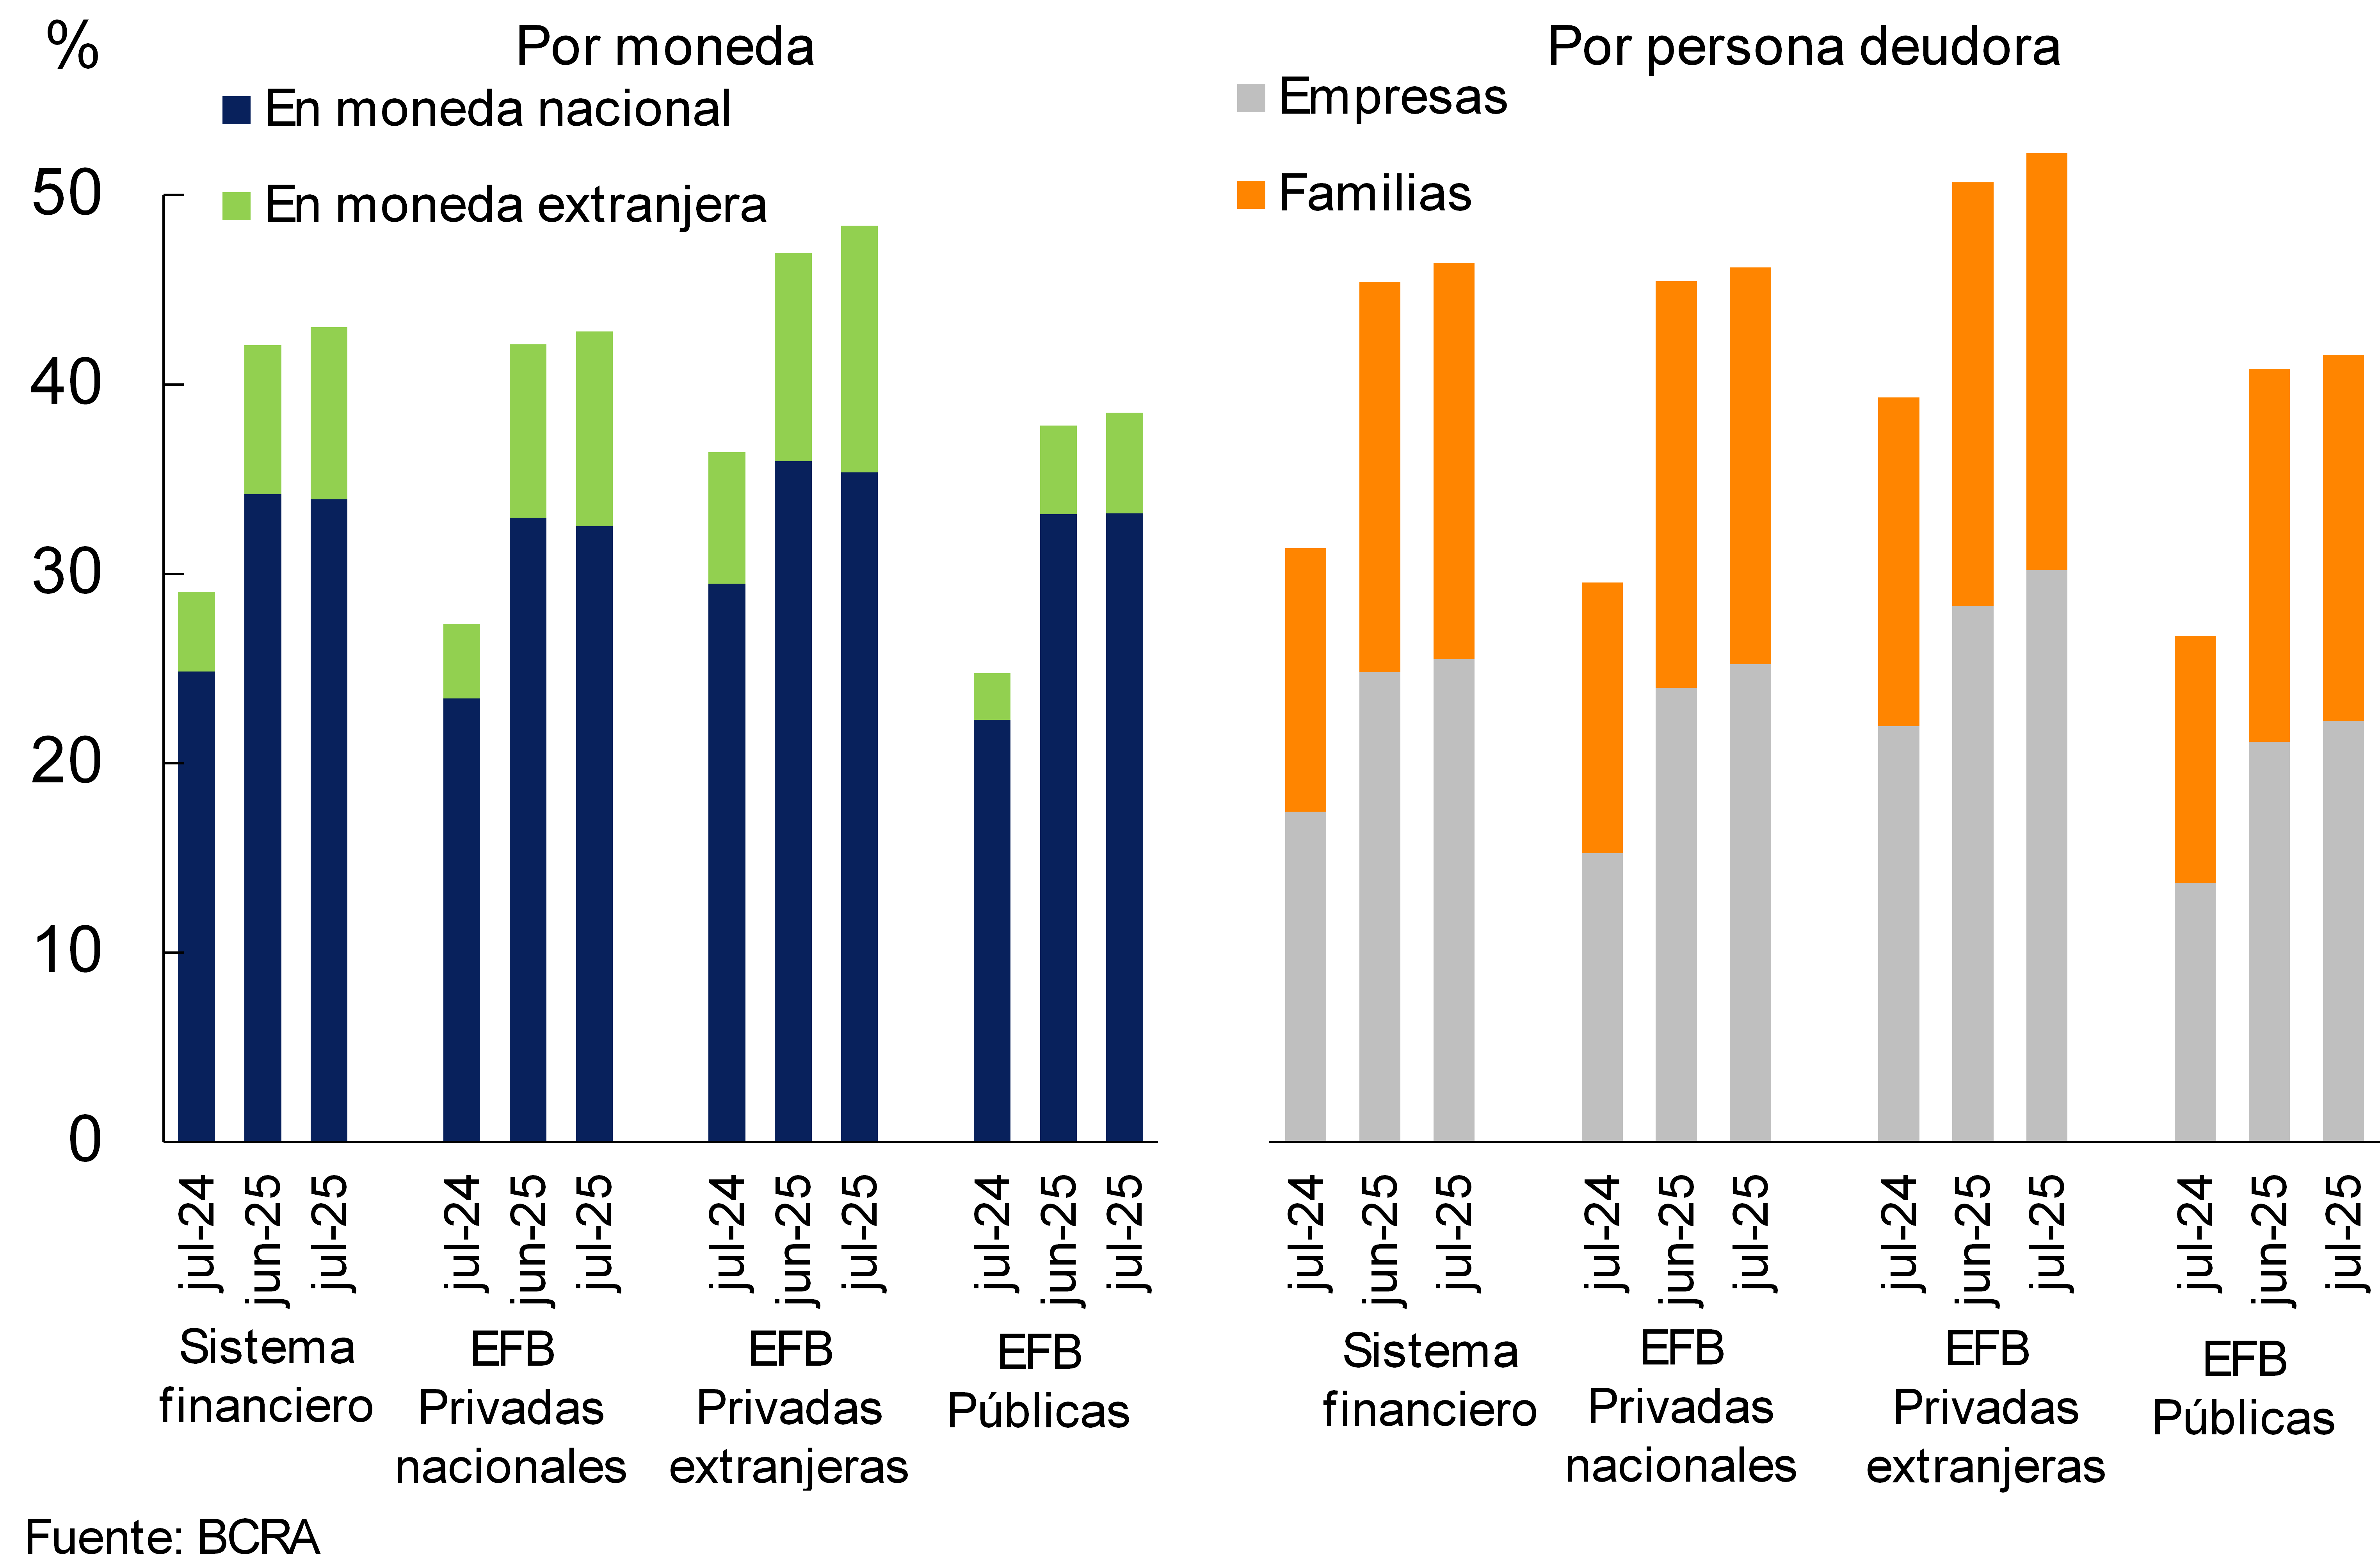
In July, the financial system continued to gradually increase its credit exposure to companies (totaling 23.6% of assets, 0.7 p.p. more than in June) and to households (representing 19.4% of assets, increasing 0.3 p.p. in the month). When distinguishing by currency, in July the credit exposure to the private sector in pesos stood at 33.9% (-0.3 p.p. monthly), while the ratio in foreign currency reached 9.1% (1.2 p.p. monthly). In year-on-year terms, the balance of credit to the private sector accumulated an increase of 14 p.p. in assets (9.1 p.p. for the segment in pesos and 4.9 p.p. for items in foreign currency; see Figure 7).
Figure 7 | Balance of credit to the private sector in terms of assets
Financial system
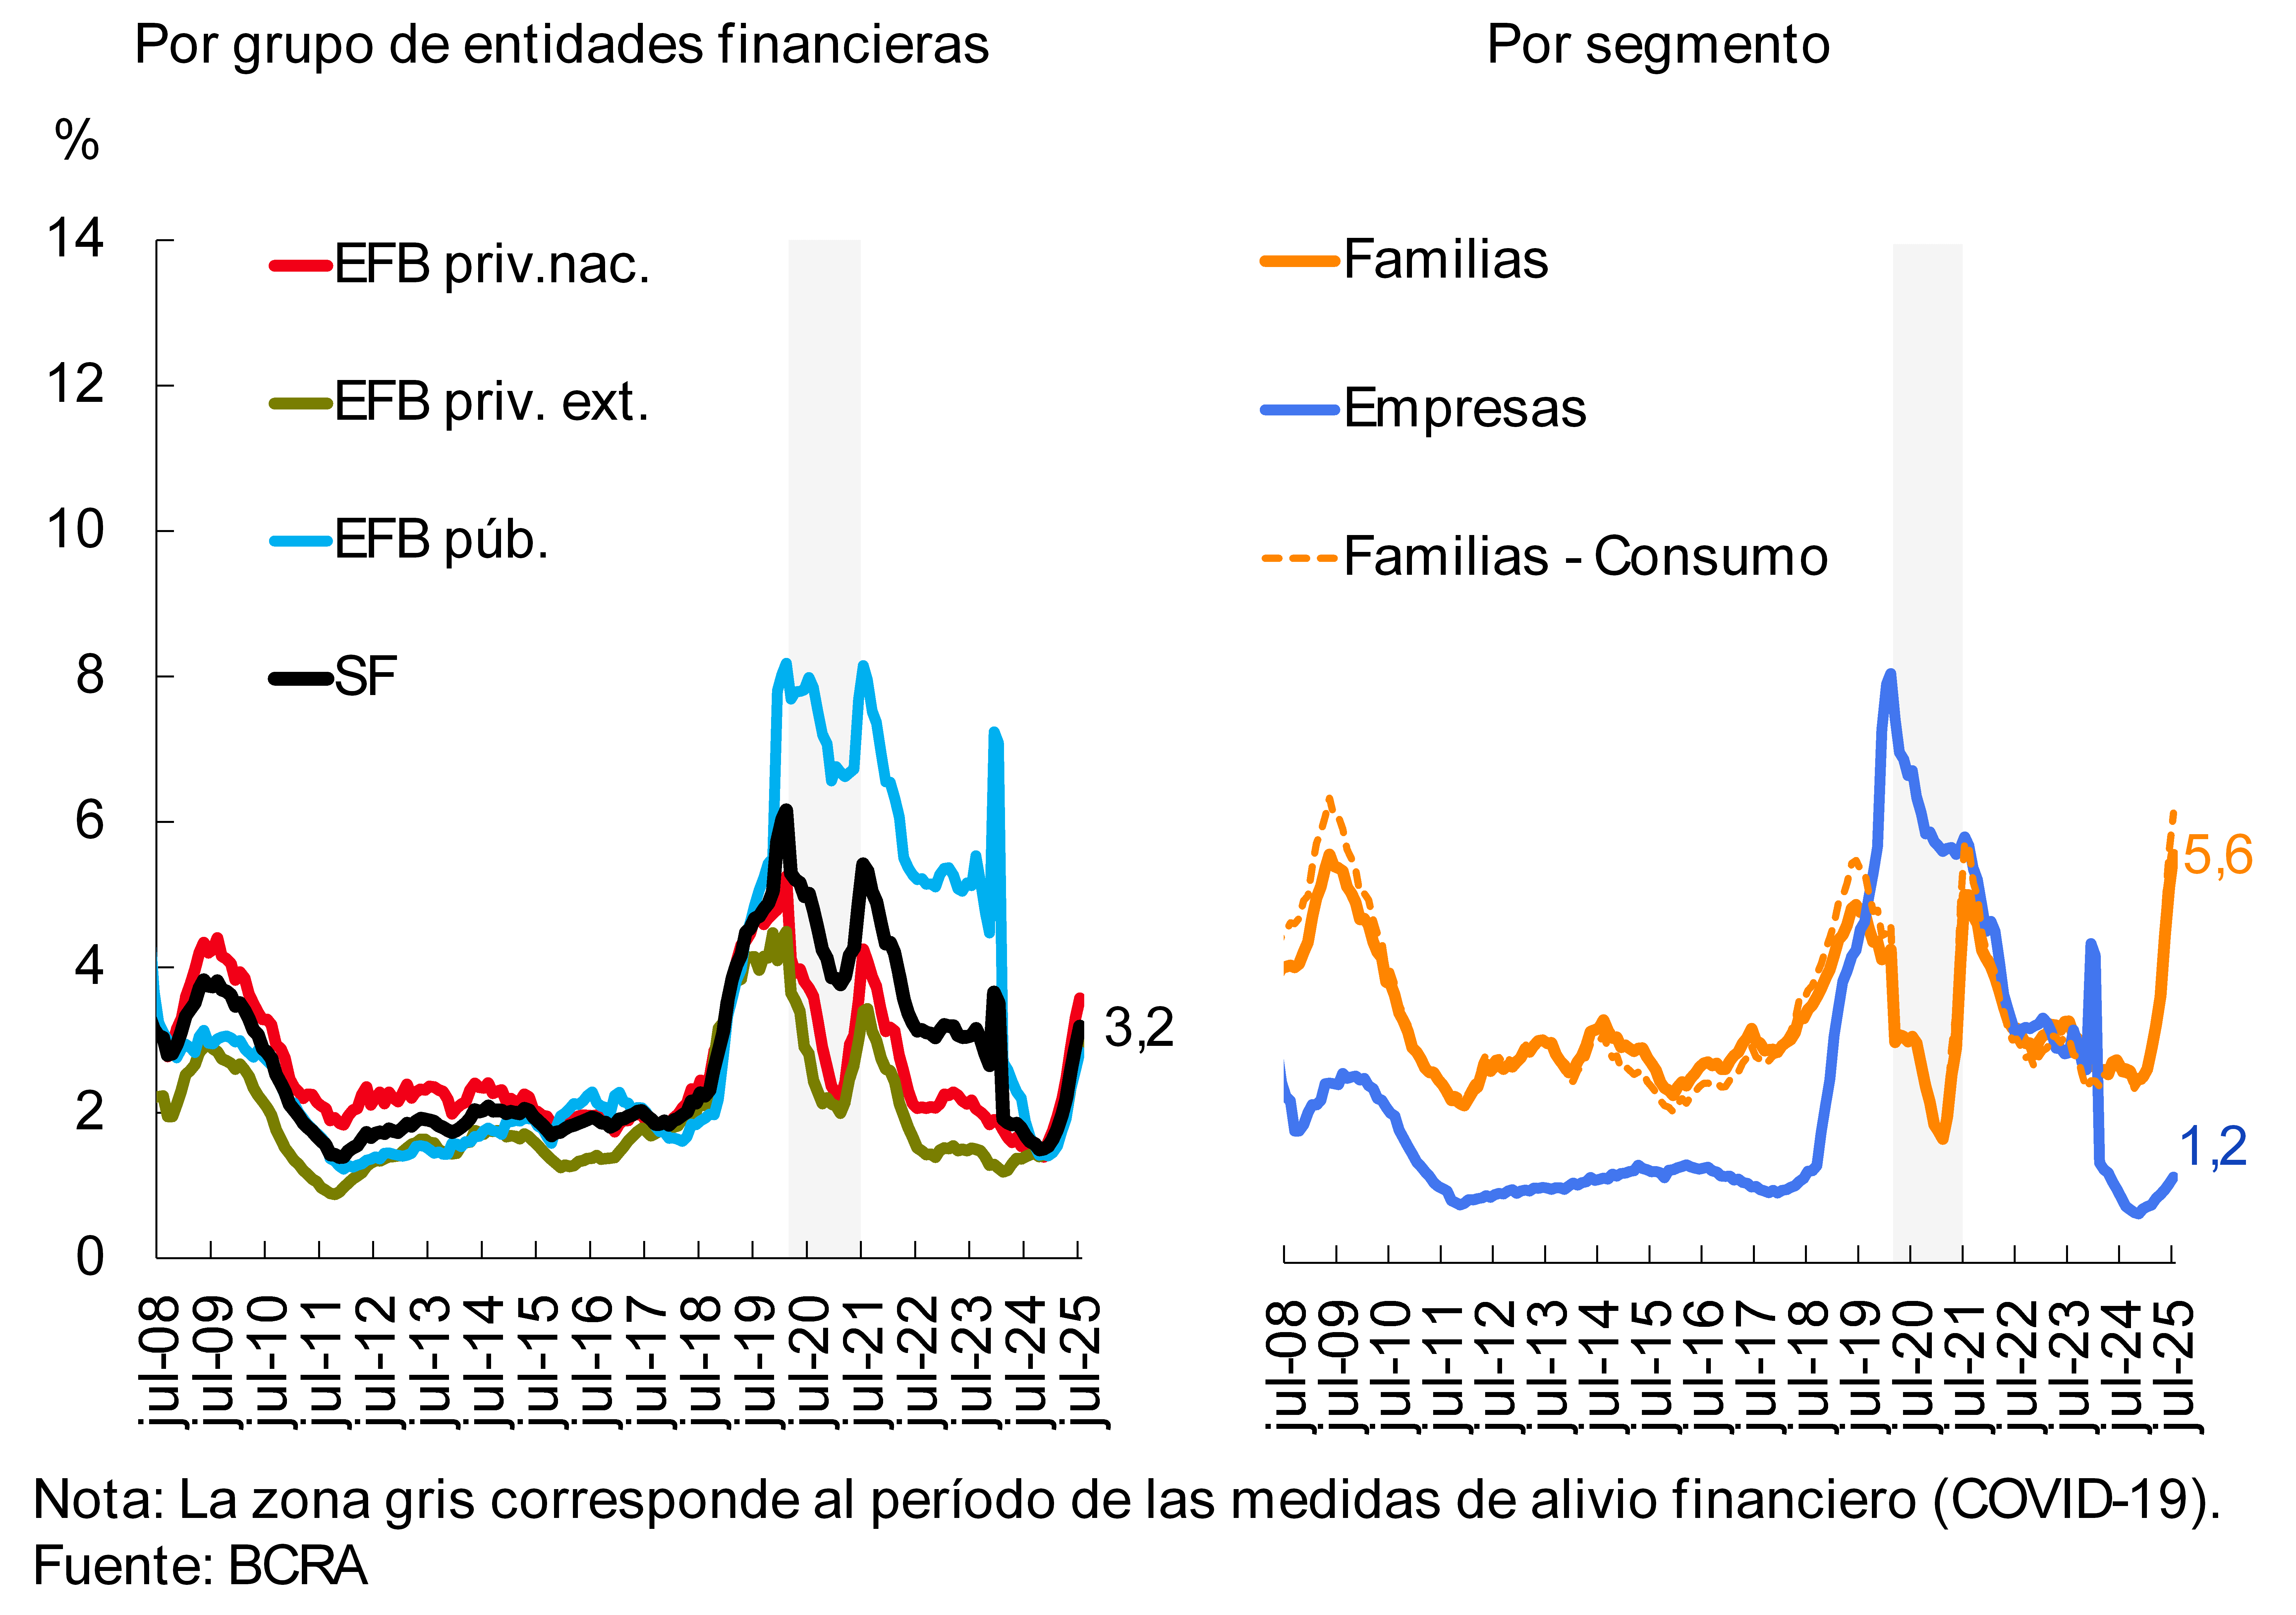
In July, the non-performing ratio of credit to the private sector stood at 3.2% at the systemic level, 0.3 p.p. more than last month (see Chart 8). The NPL indicator for loans to households totaled 5.6% in the month, while the irregularity ratio for financing to companies stood at 1.2% in July.
Chart 8: Private sector credit irregularity ratio
In the period, the total forecast balance of all financial institutions represented 115% of the balance of financing in an irregular situation (-4.2 p.p. compared to June) and 3.7% of the balance of the total portfolio to the private sector (0.2 p.p. in the month).
IV. Liquidity and solvency
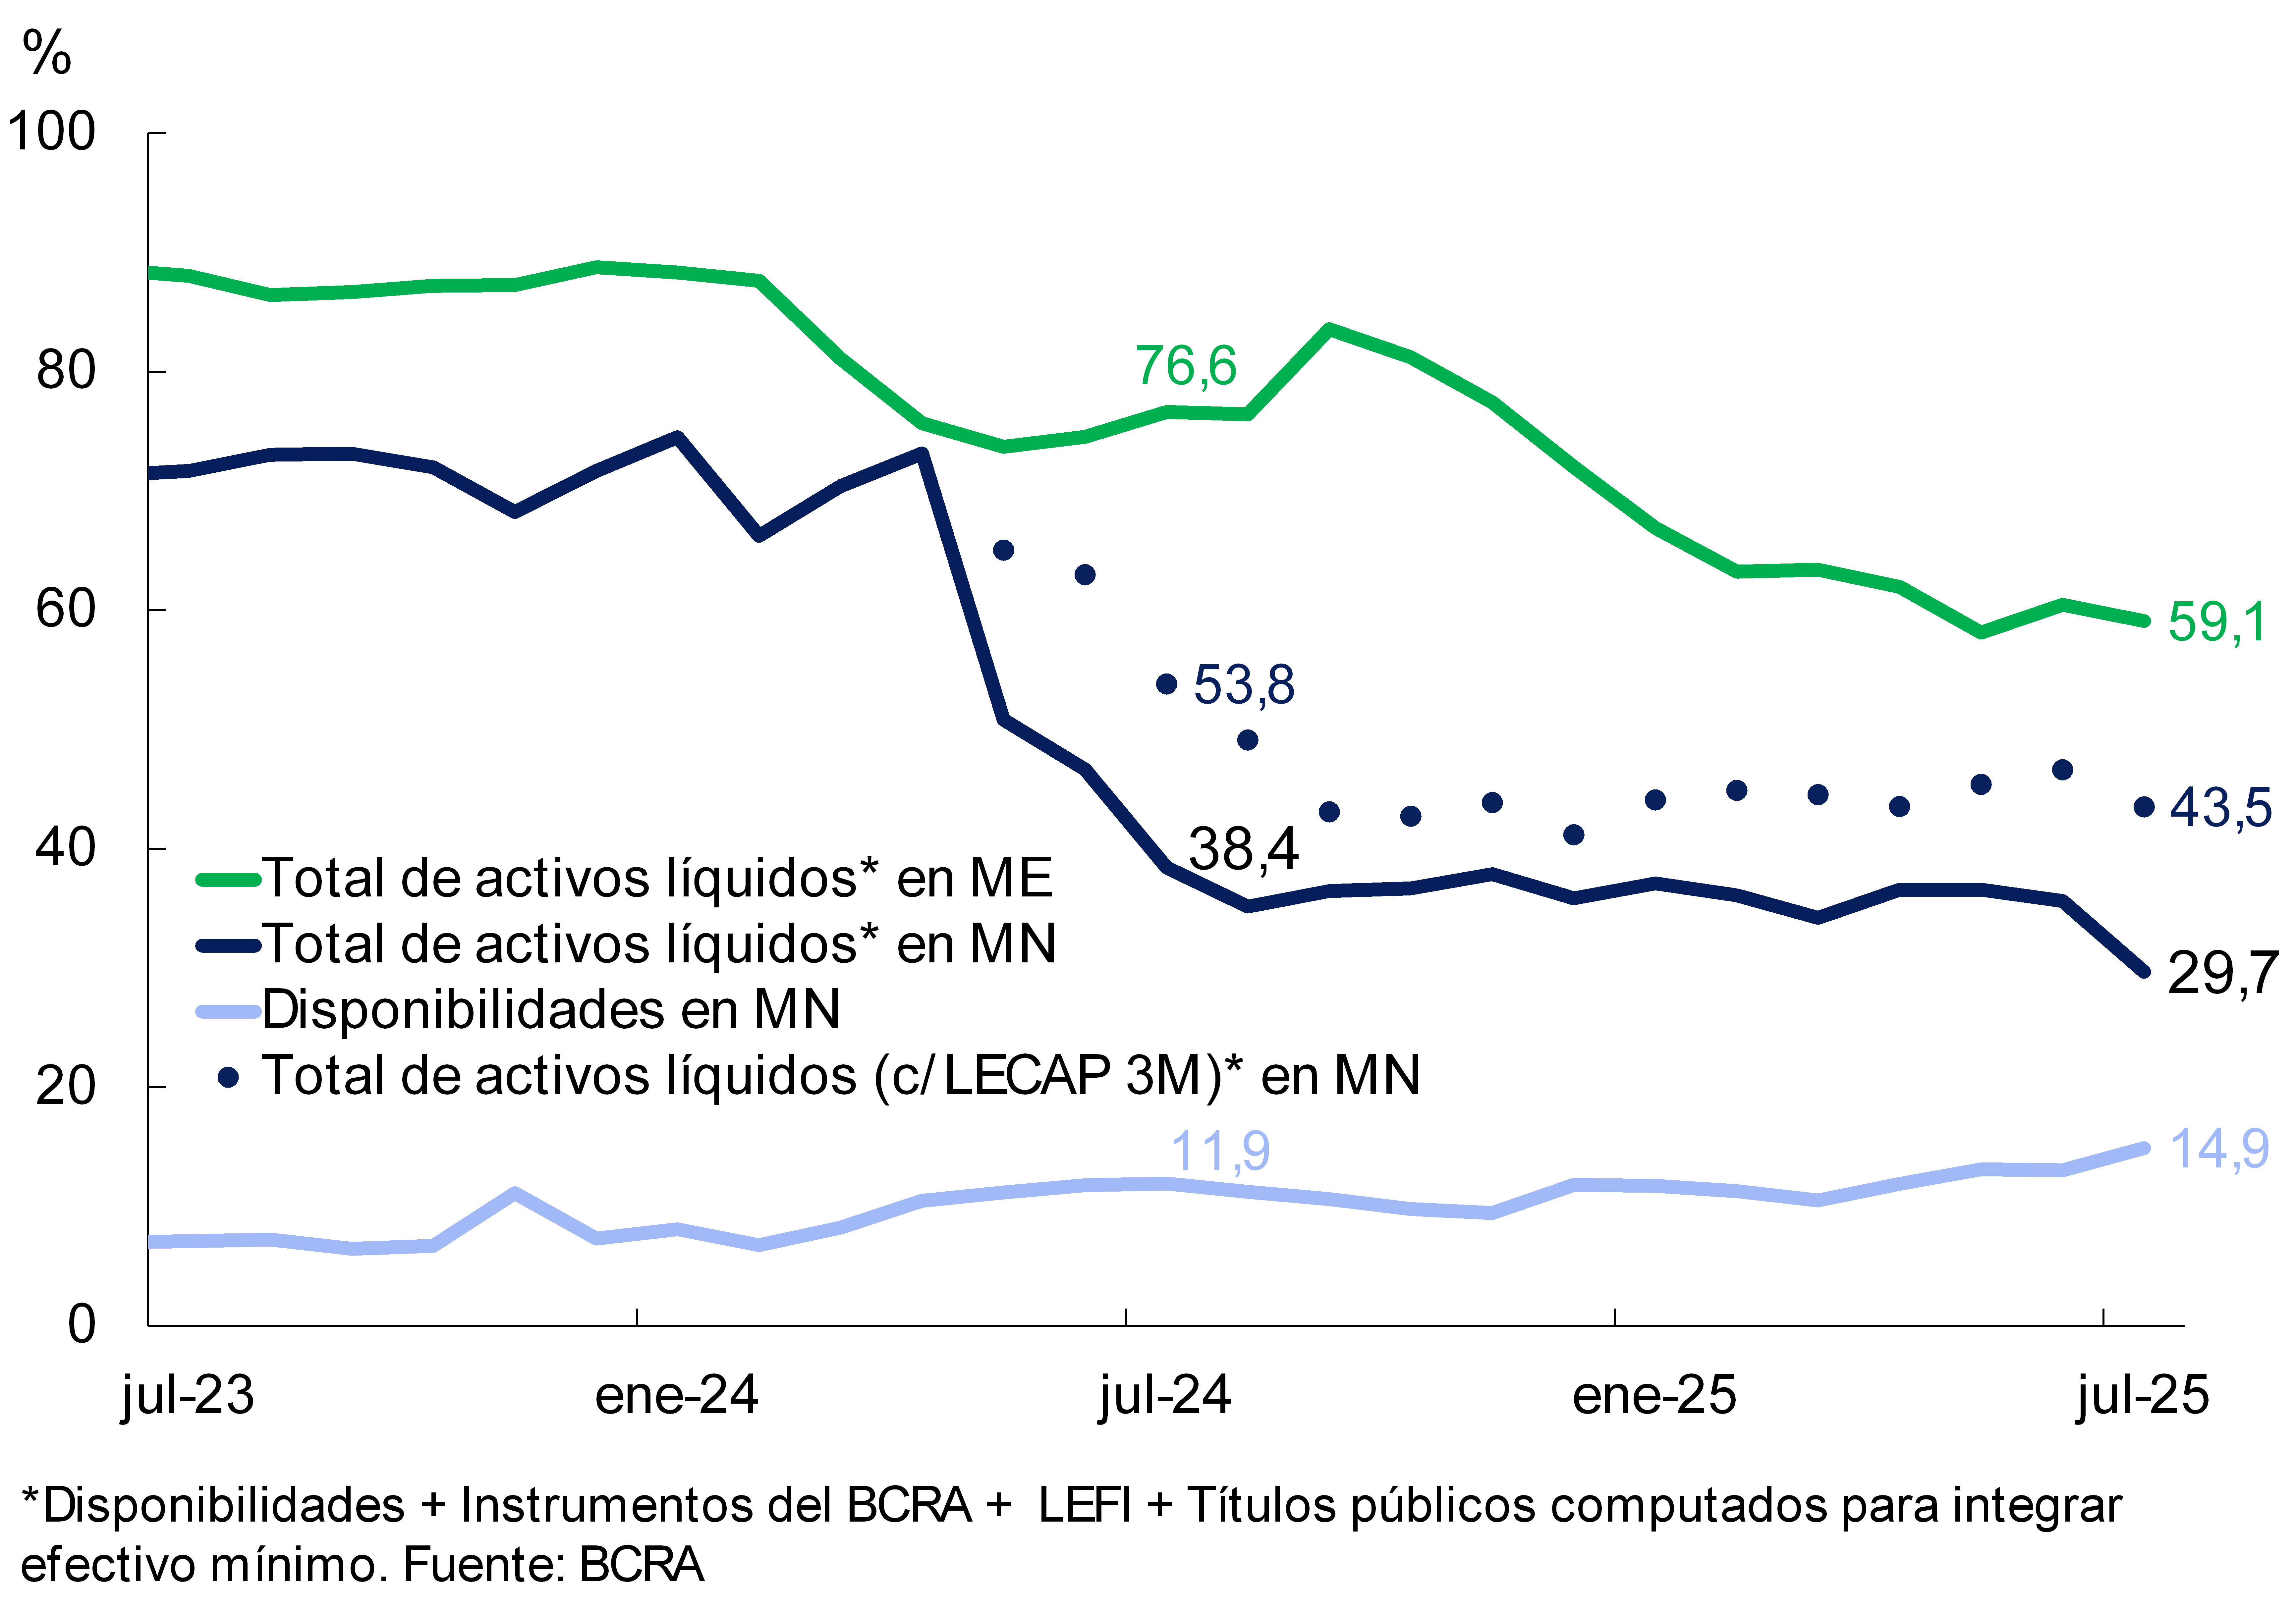
The systemic indicator of liquidity in national currency, which considers only availabilities, increased 1.9 p.p. of deposits in pesos in July, to 14.9% (+3 p.p. y.o.y.; see Figure 9). The broad liquidity ratio in pesos stood at 43.5% of deposits in the same denomination in the month, down 3.1 p.p. compared to the value of June (-10.3 p.p. y.o.y.), mainly due to the effect of the maturity of the LEFIs. On the other hand, liquidity in foreign currency decreased by 1.3 p.p. to represent 59.1% of these deposits (-17.5 p.p. y.o.y.).
Figure 9 | Liquidity
indicators As a % of deposits in each denomination
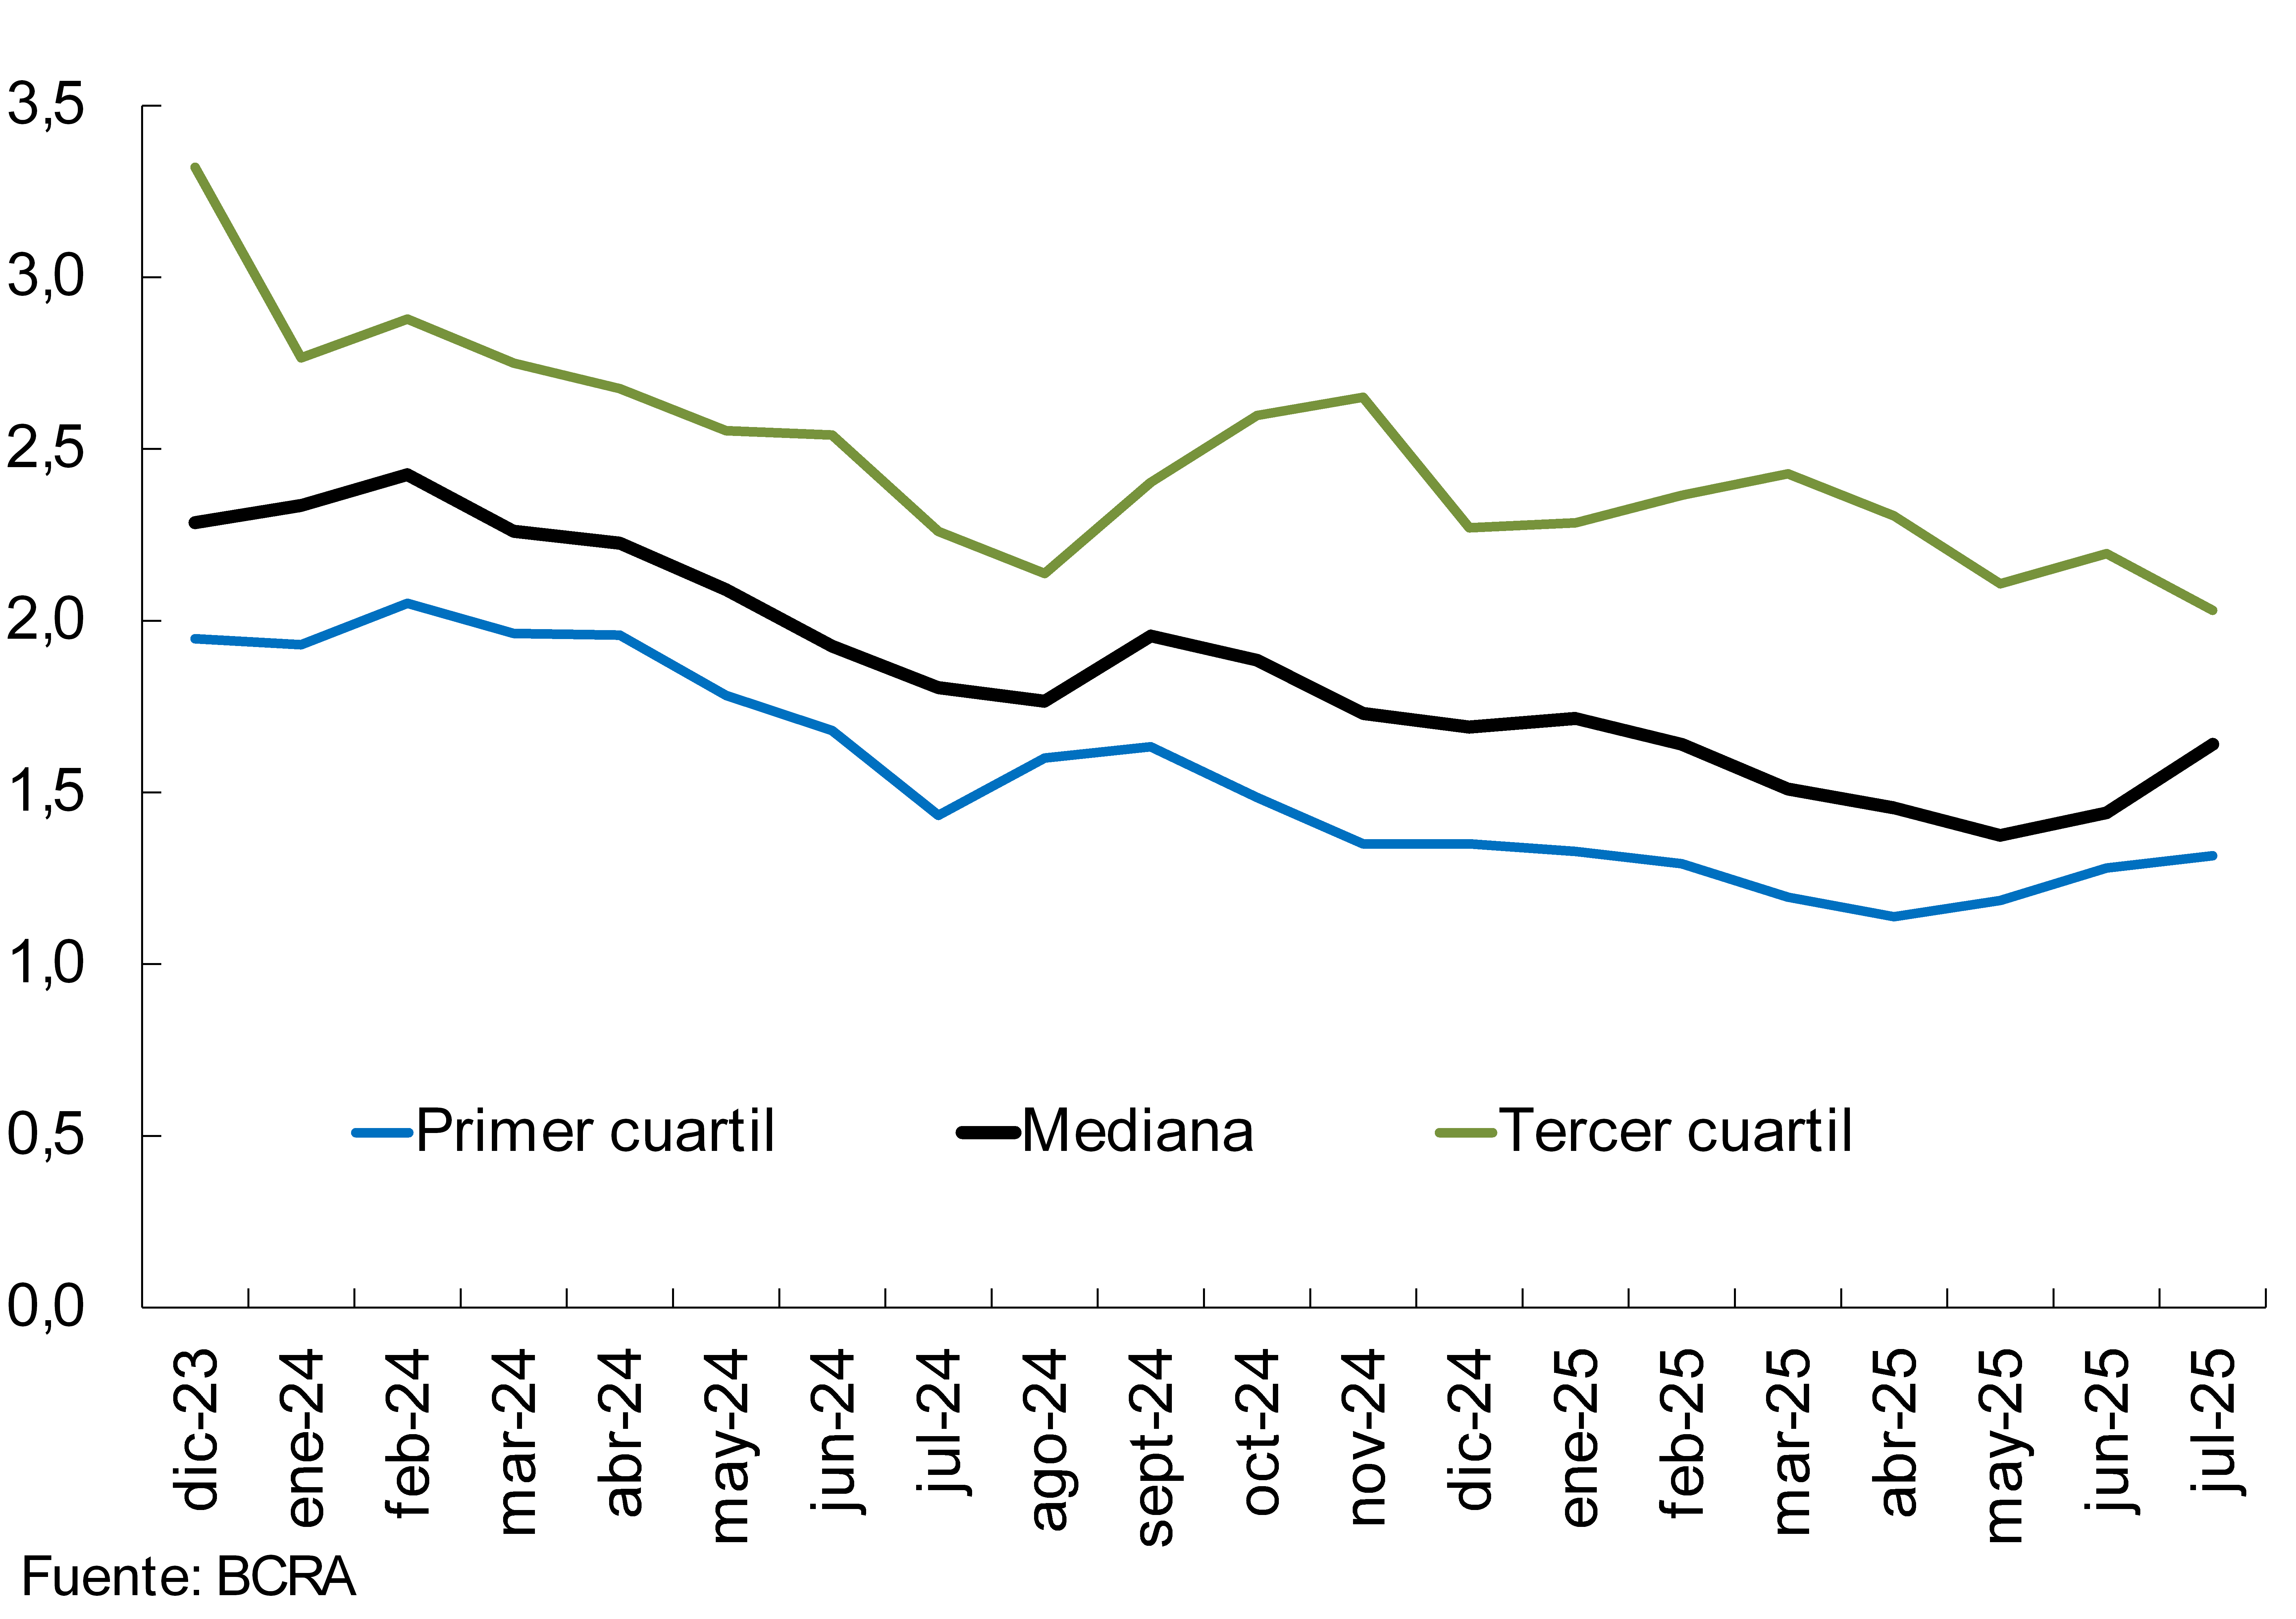
In July, the liquidity coverage ratio (LCR), which is part of the Basel Committee’s recommendations, was slightly increased for the aggregate of local financial institutions obliged to verify it (Group A). The median LCR reached 1.6 for Group A in the month (see Chart 10), increasing 0.2 compared to the June level.
Figure 10 | Liquidity coverage ratio (LCR)
Group A financial institutions – In $+ME
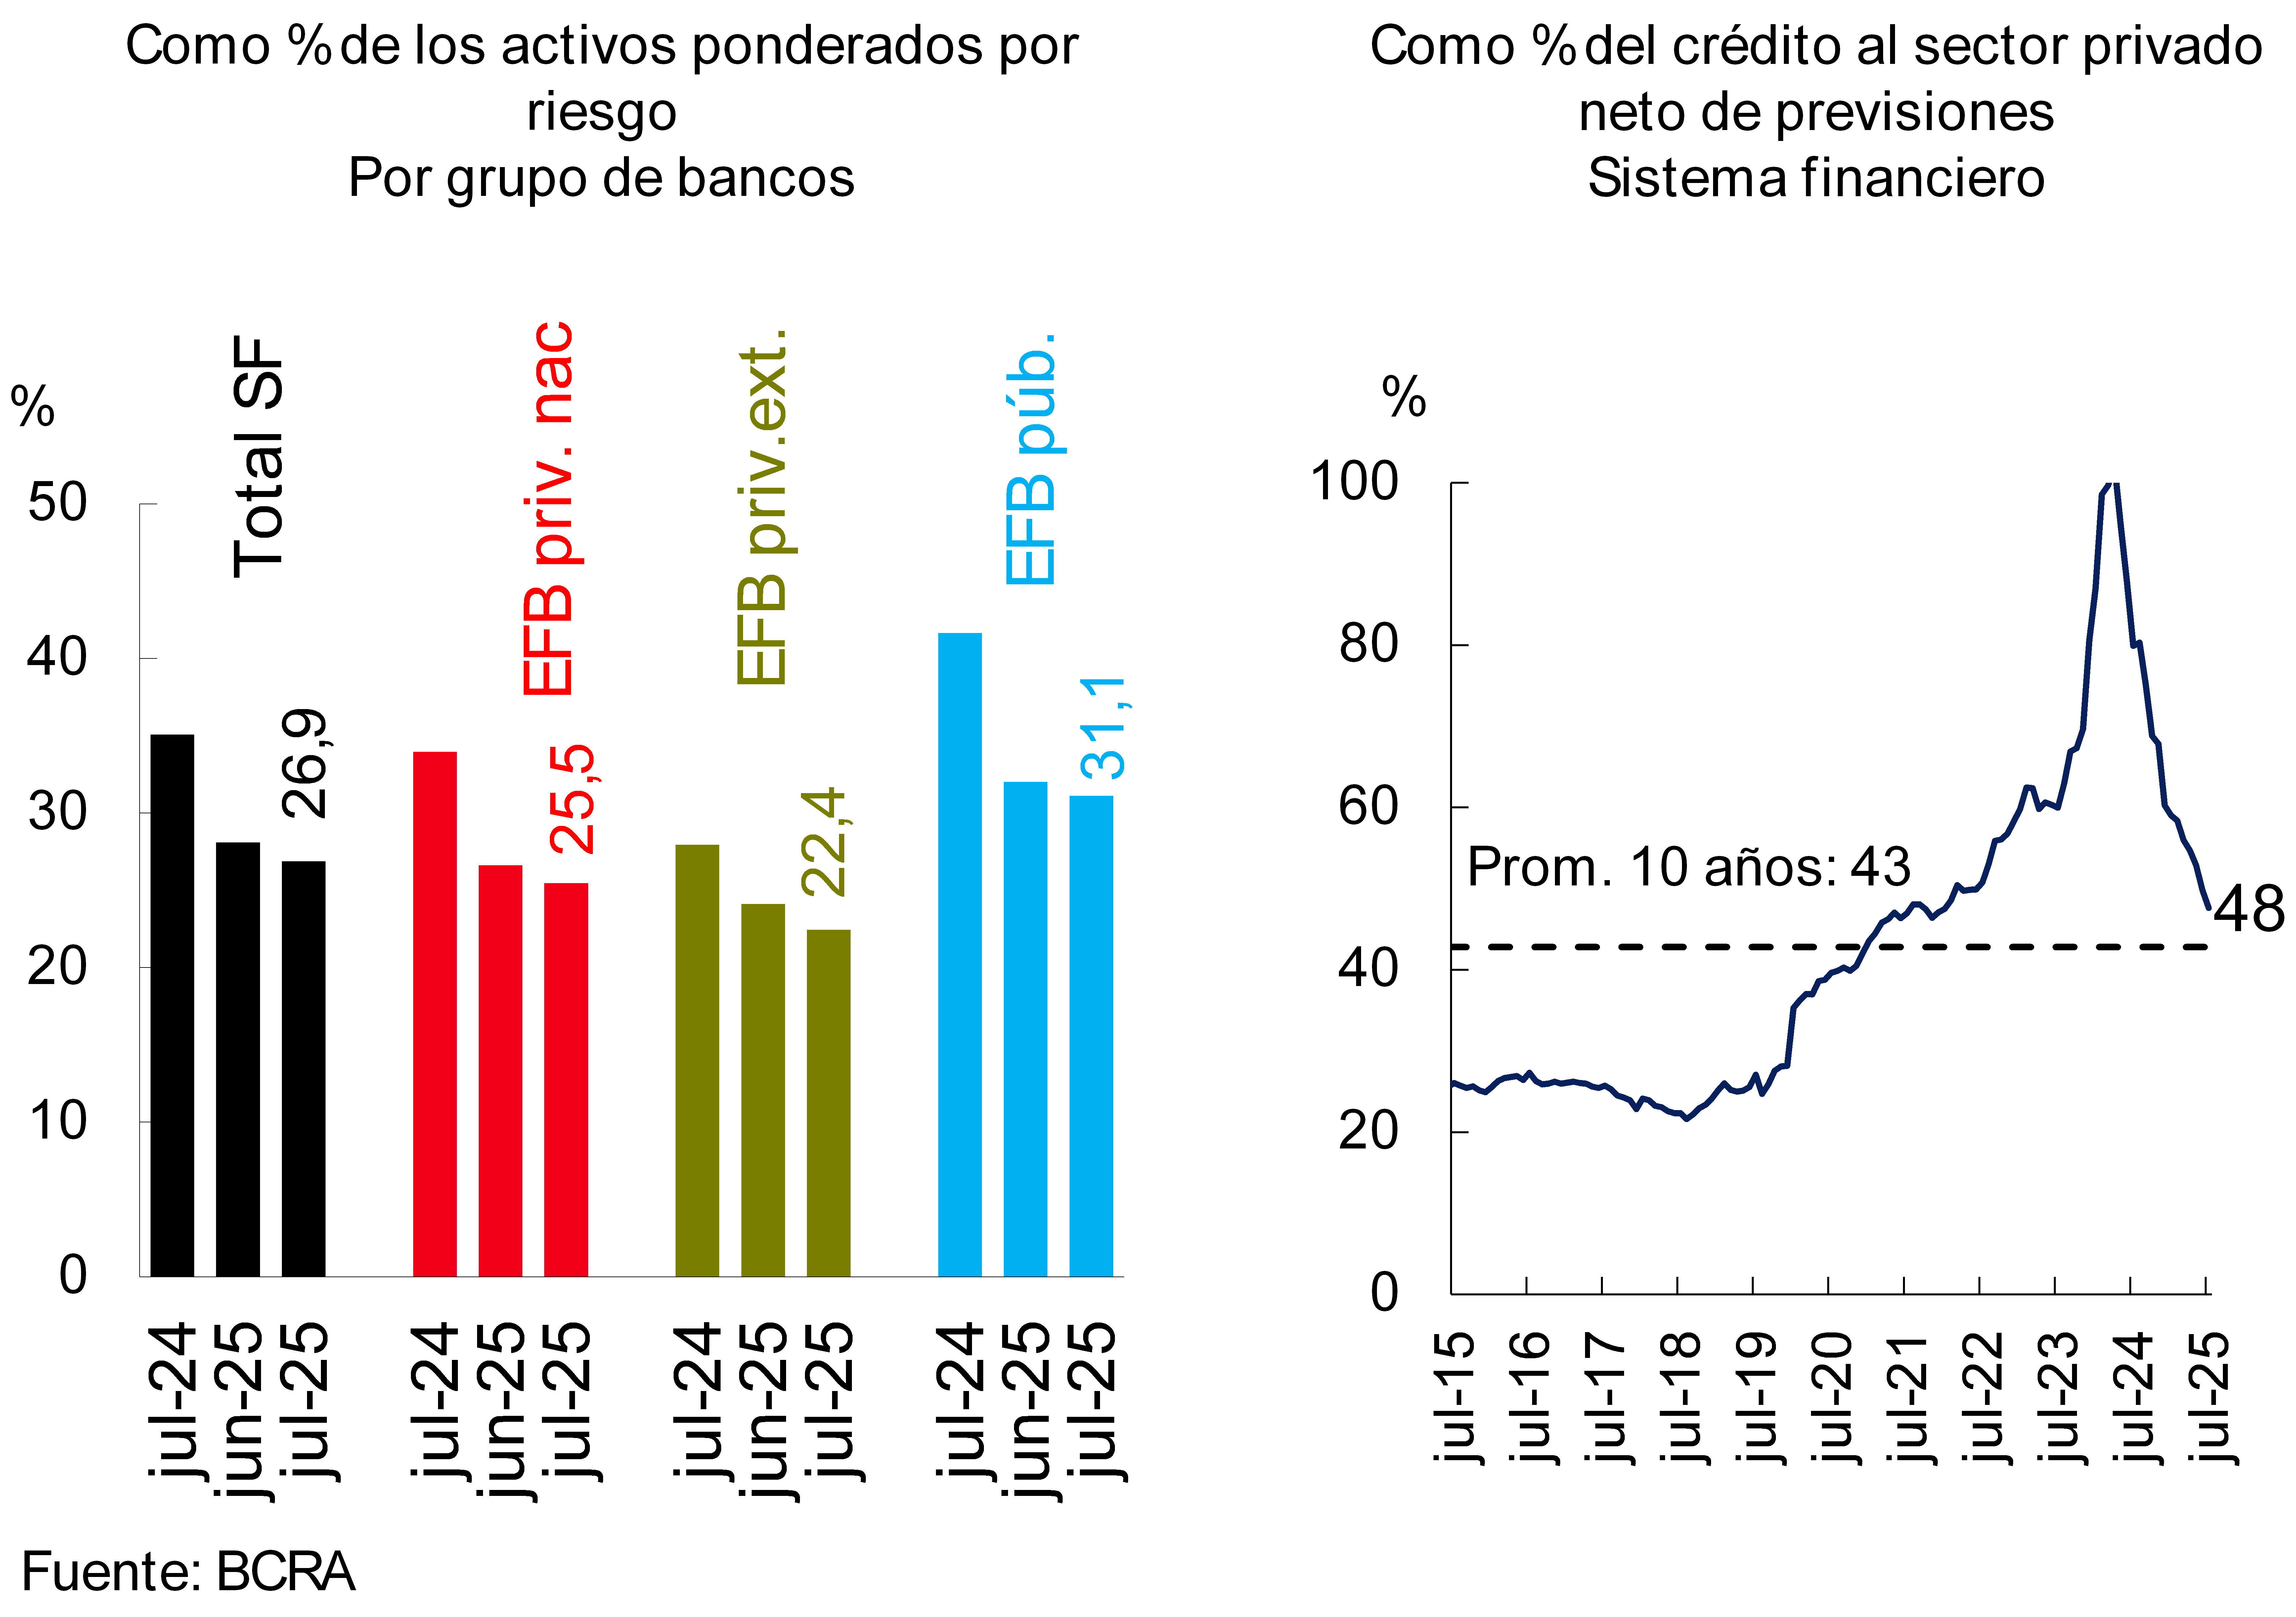
The solvency indicators of the financial system remained at high levels. In July, the integration of regulatory capital (RPC) of the financial system totaled 26.9% of risk-weighted assets (RWA), reducing 1.2 p.p. between the end of the month (see Chart 11). This monthly performance was widespread among groups of financial institutions and occurred in a context in which the PRC did not show significant changes compared to June (-0.6% in real terms), while RWAs increased (3.8% in real terms) based on the dynamics of credit to the private sector. Capital integration in terms of the balance of credit to the private sector net of forecasts represented 47.6% (-2.2 p.p. in the month; higher than the average of the last 10 years of 42.8%). For its part, the capital position (RPC minus minimum regulatory requirement) reached 232% of the regulatory requirement for all entities (-15.5 p.p. monthly; exceeding the average of the last 10 years of 179%).
Graph 11 : Integration of capital
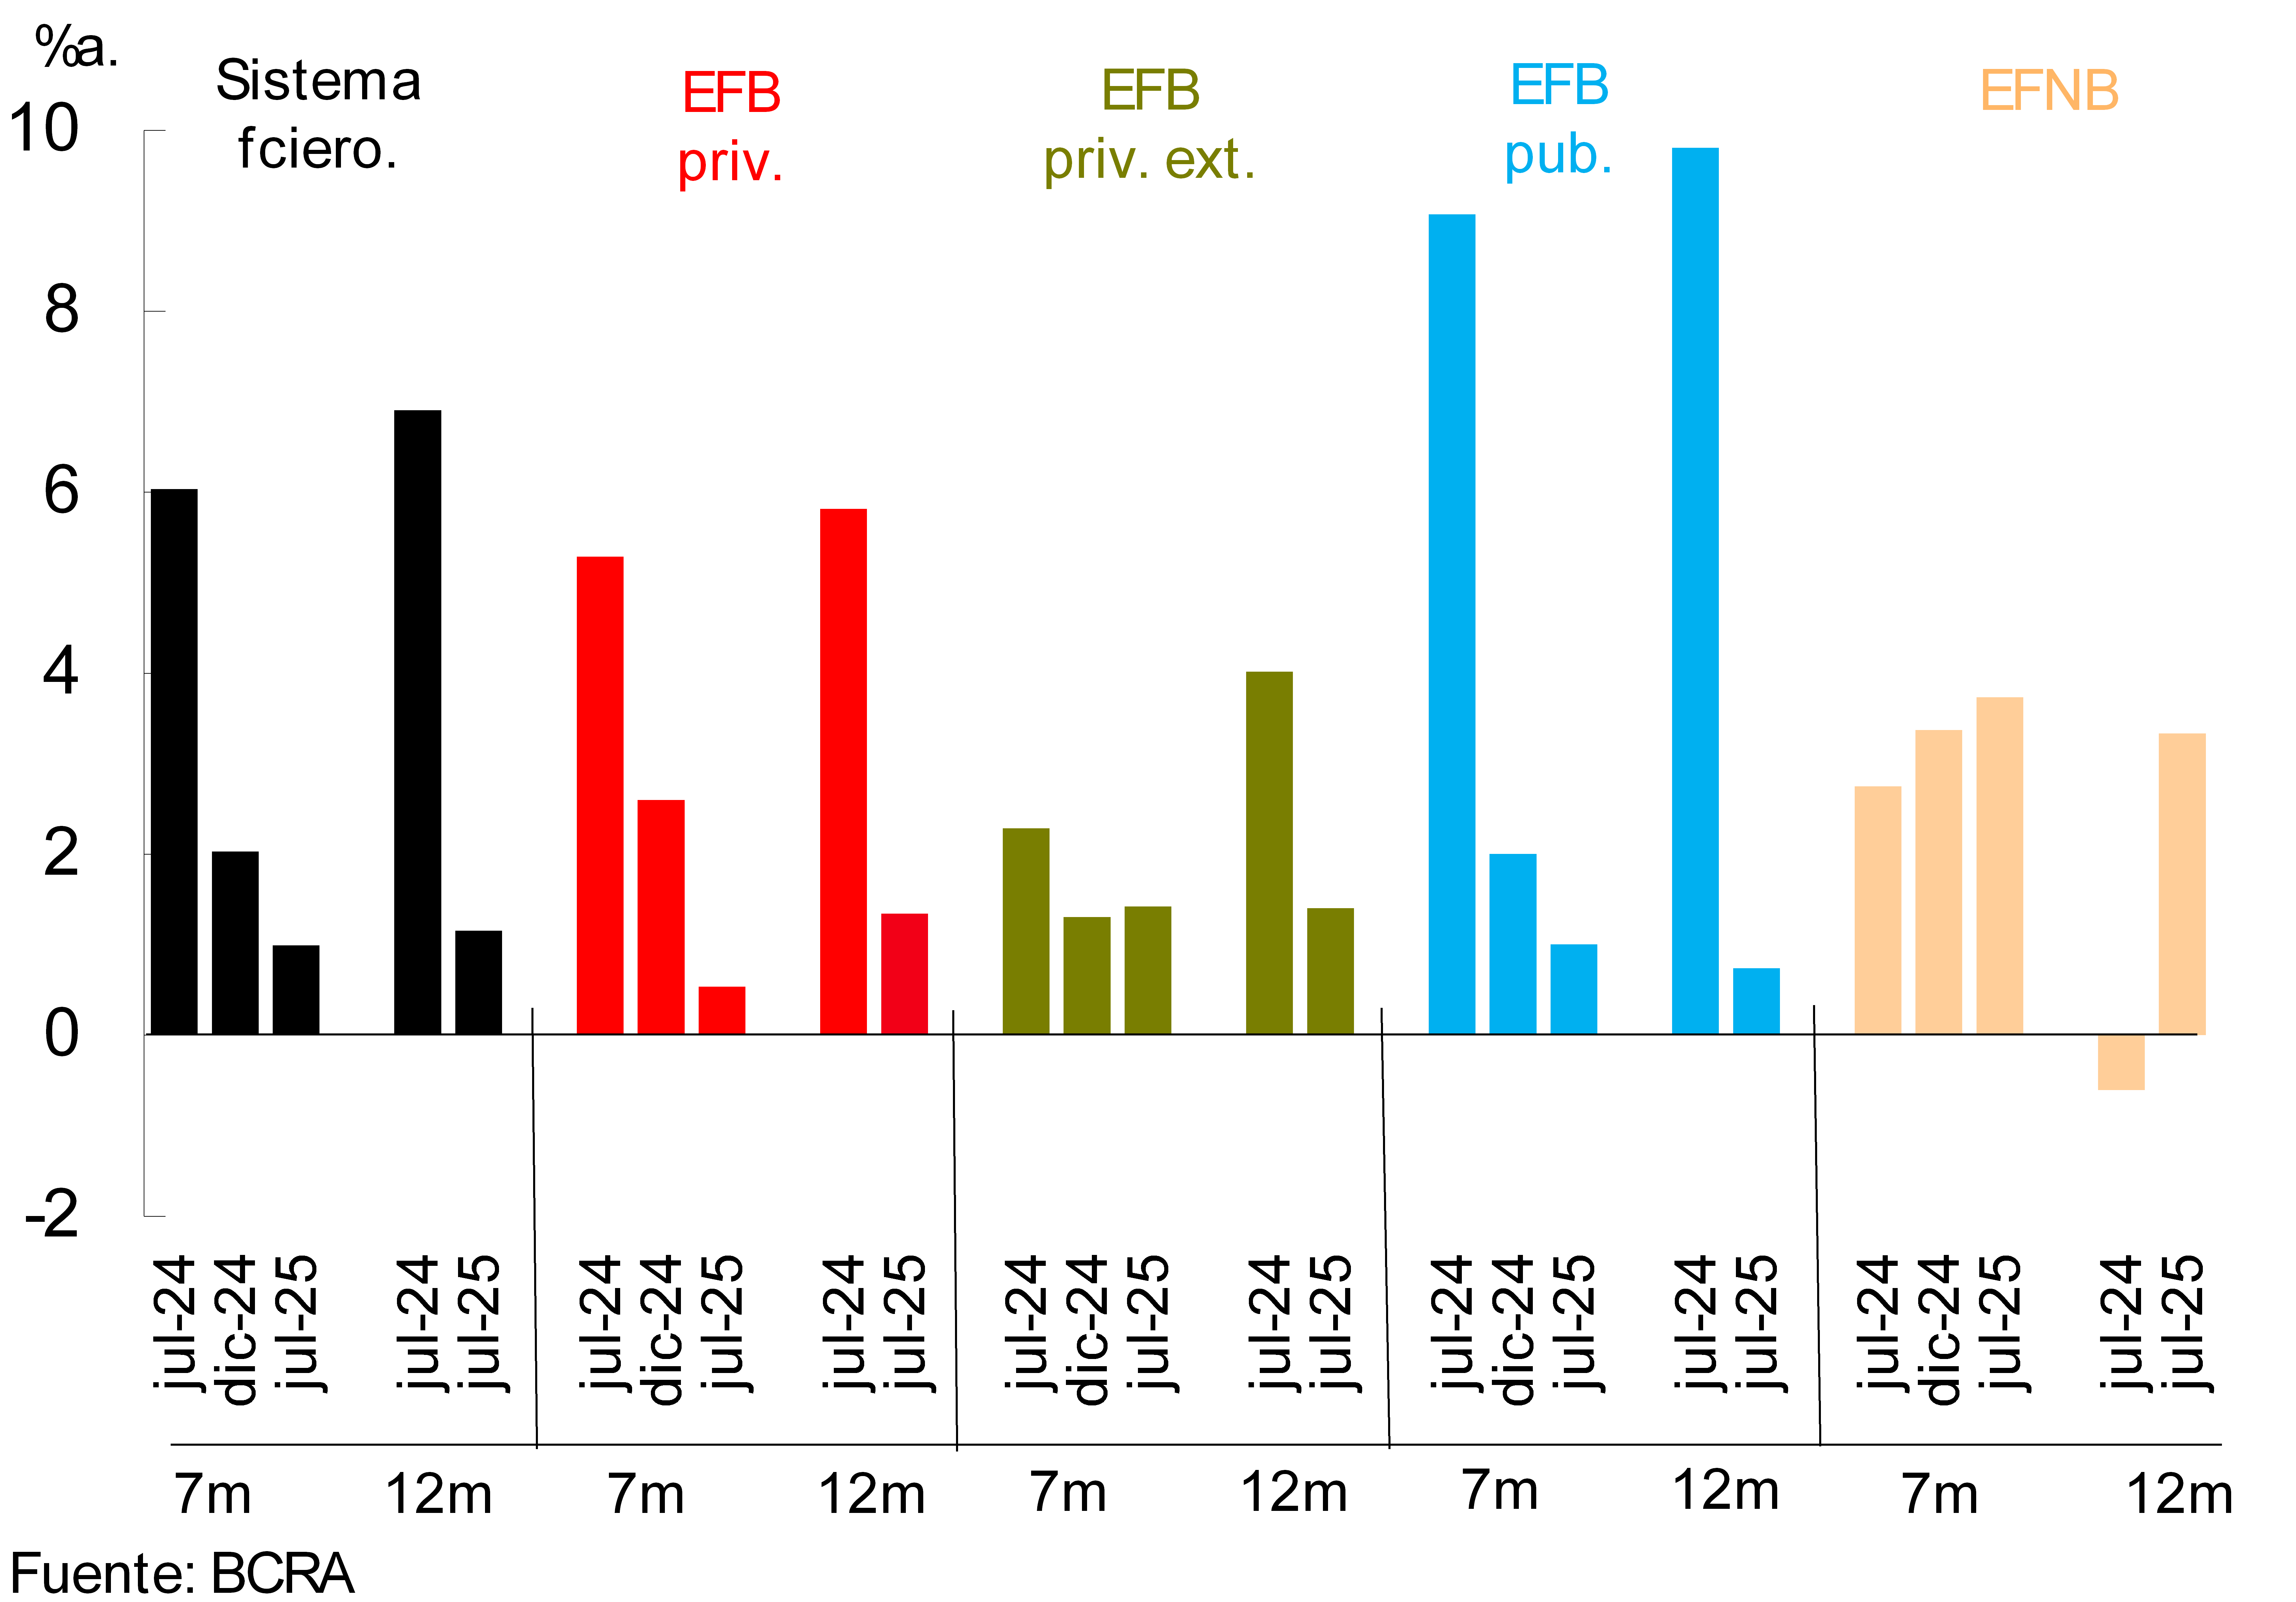
In the accumulated of the last 7 months to July, the total comprehensive profit in homogeneous currency of the set of financial institutions was equivalent to 1% annualized (a) of assets (ROA) and 4.2% y. of net worth (ROE), levels that are below those observed a year ago (see Chart 12). This performance was mainly explained by a reduction in the comprehensive and real financial margin (lower results from securities and premiums for passes), an effect that was partly offset by a decrease in administrative and tax expenses. In the 12-month cumulative to July, the sector accumulated an ROA of 1.2% (ROE of 4.7%), 5.8 p.p. less than the level of a year ago (-23.9 p.p. y.o.y. in ROE).
Figure 12 | 7 and 12 months
cumulative ROA By financial institution group
V. Payment system
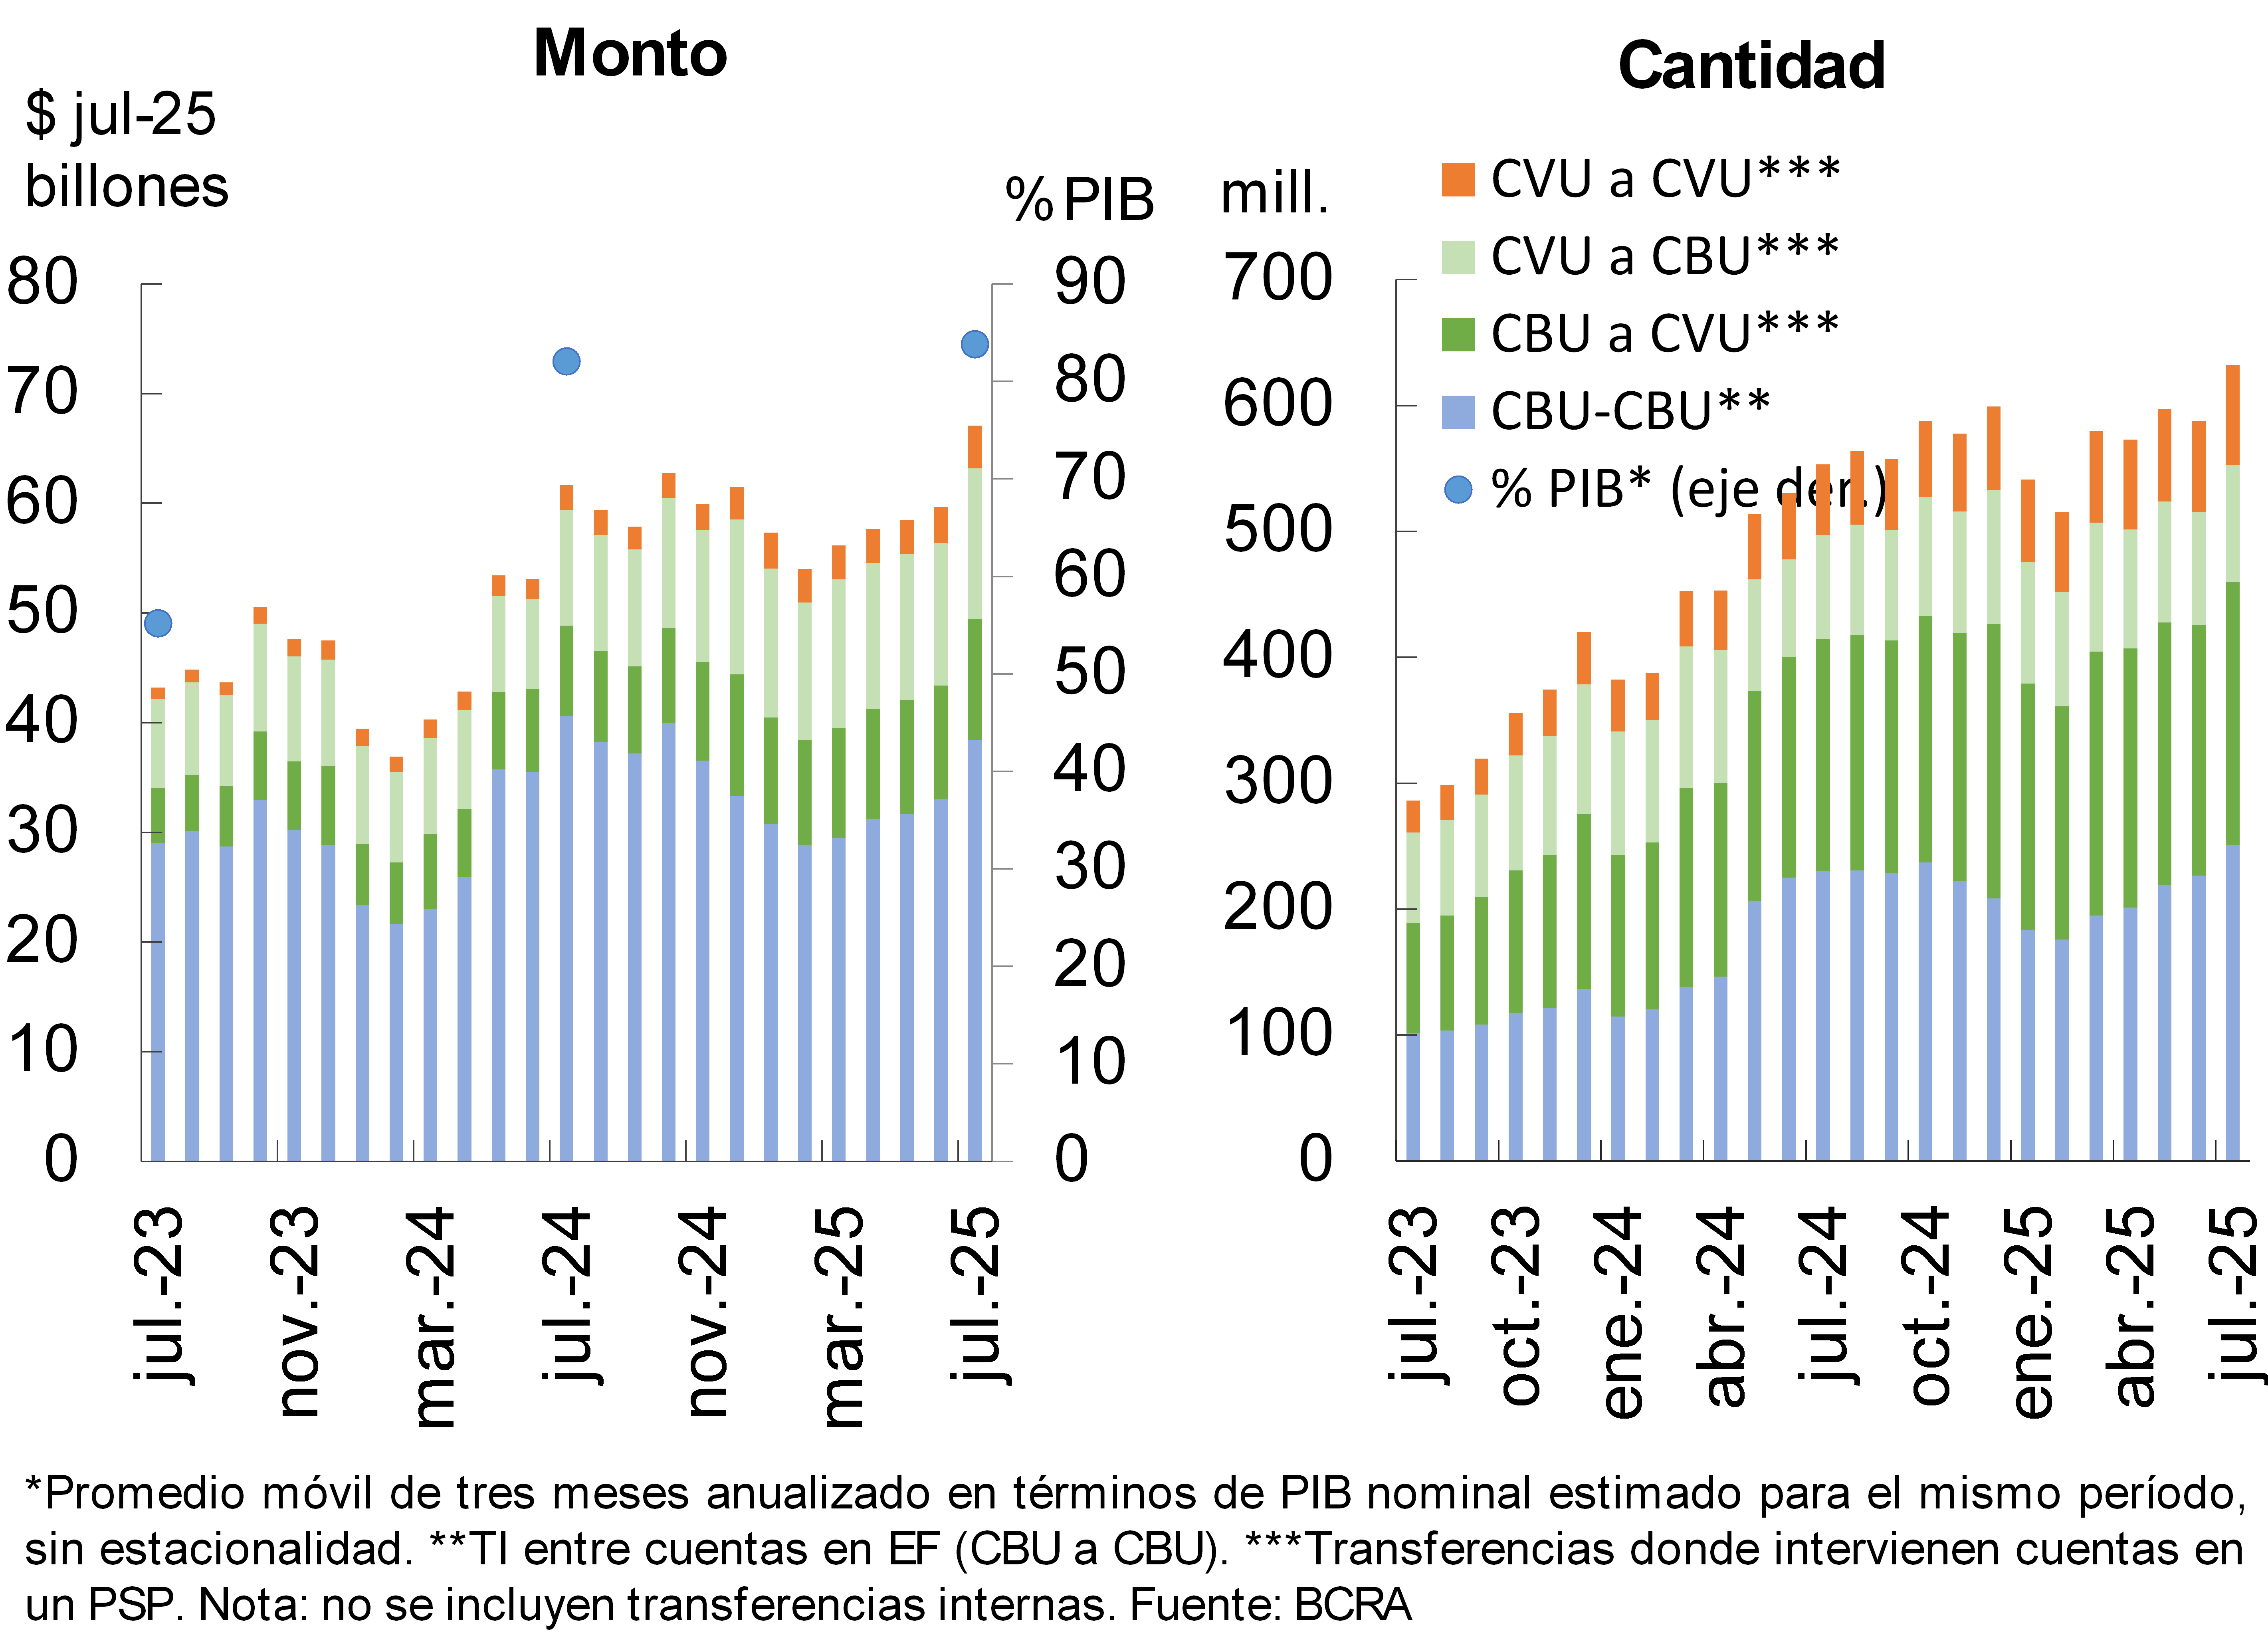
In the month, immediate transfers (TI) increased in the context of seasonal factors, accumulating a year-on-year growth of 8.7% in real amounts and 14.3% in quantities (see Chart 13)11. When disaggregated by type of account, the dynamism of the TIs in which a CVU intervenes (in real amounts) was highlighted: 68% y.o.y. between two CVUs, 30.2% y.o.y. from CVUs to CBUs and 34.4% y.o.y. from CBUs to CVUs11. On the other hand, TIs between two CBUs from different entities showed a decrease (-5.4% y.o.y. in real amounts)11. It is estimated that the amount traded in IT in the last three months to July (annualized) reached 83.8% of GDP (+1.7 p.p. y.o.y.)Question 12.
Chart 13 – Immediate Transfers (IT)
In the month, payments with interoperable transfers (PCT) via QR code grew, accumulating an increase of 53.8% YoY in real amounts and 39.7% YoY in amounts13. From low levels, the weight of PCTs in the economy is estimated to have increased slightly in the last year, reaching 1.7% of GDP13.
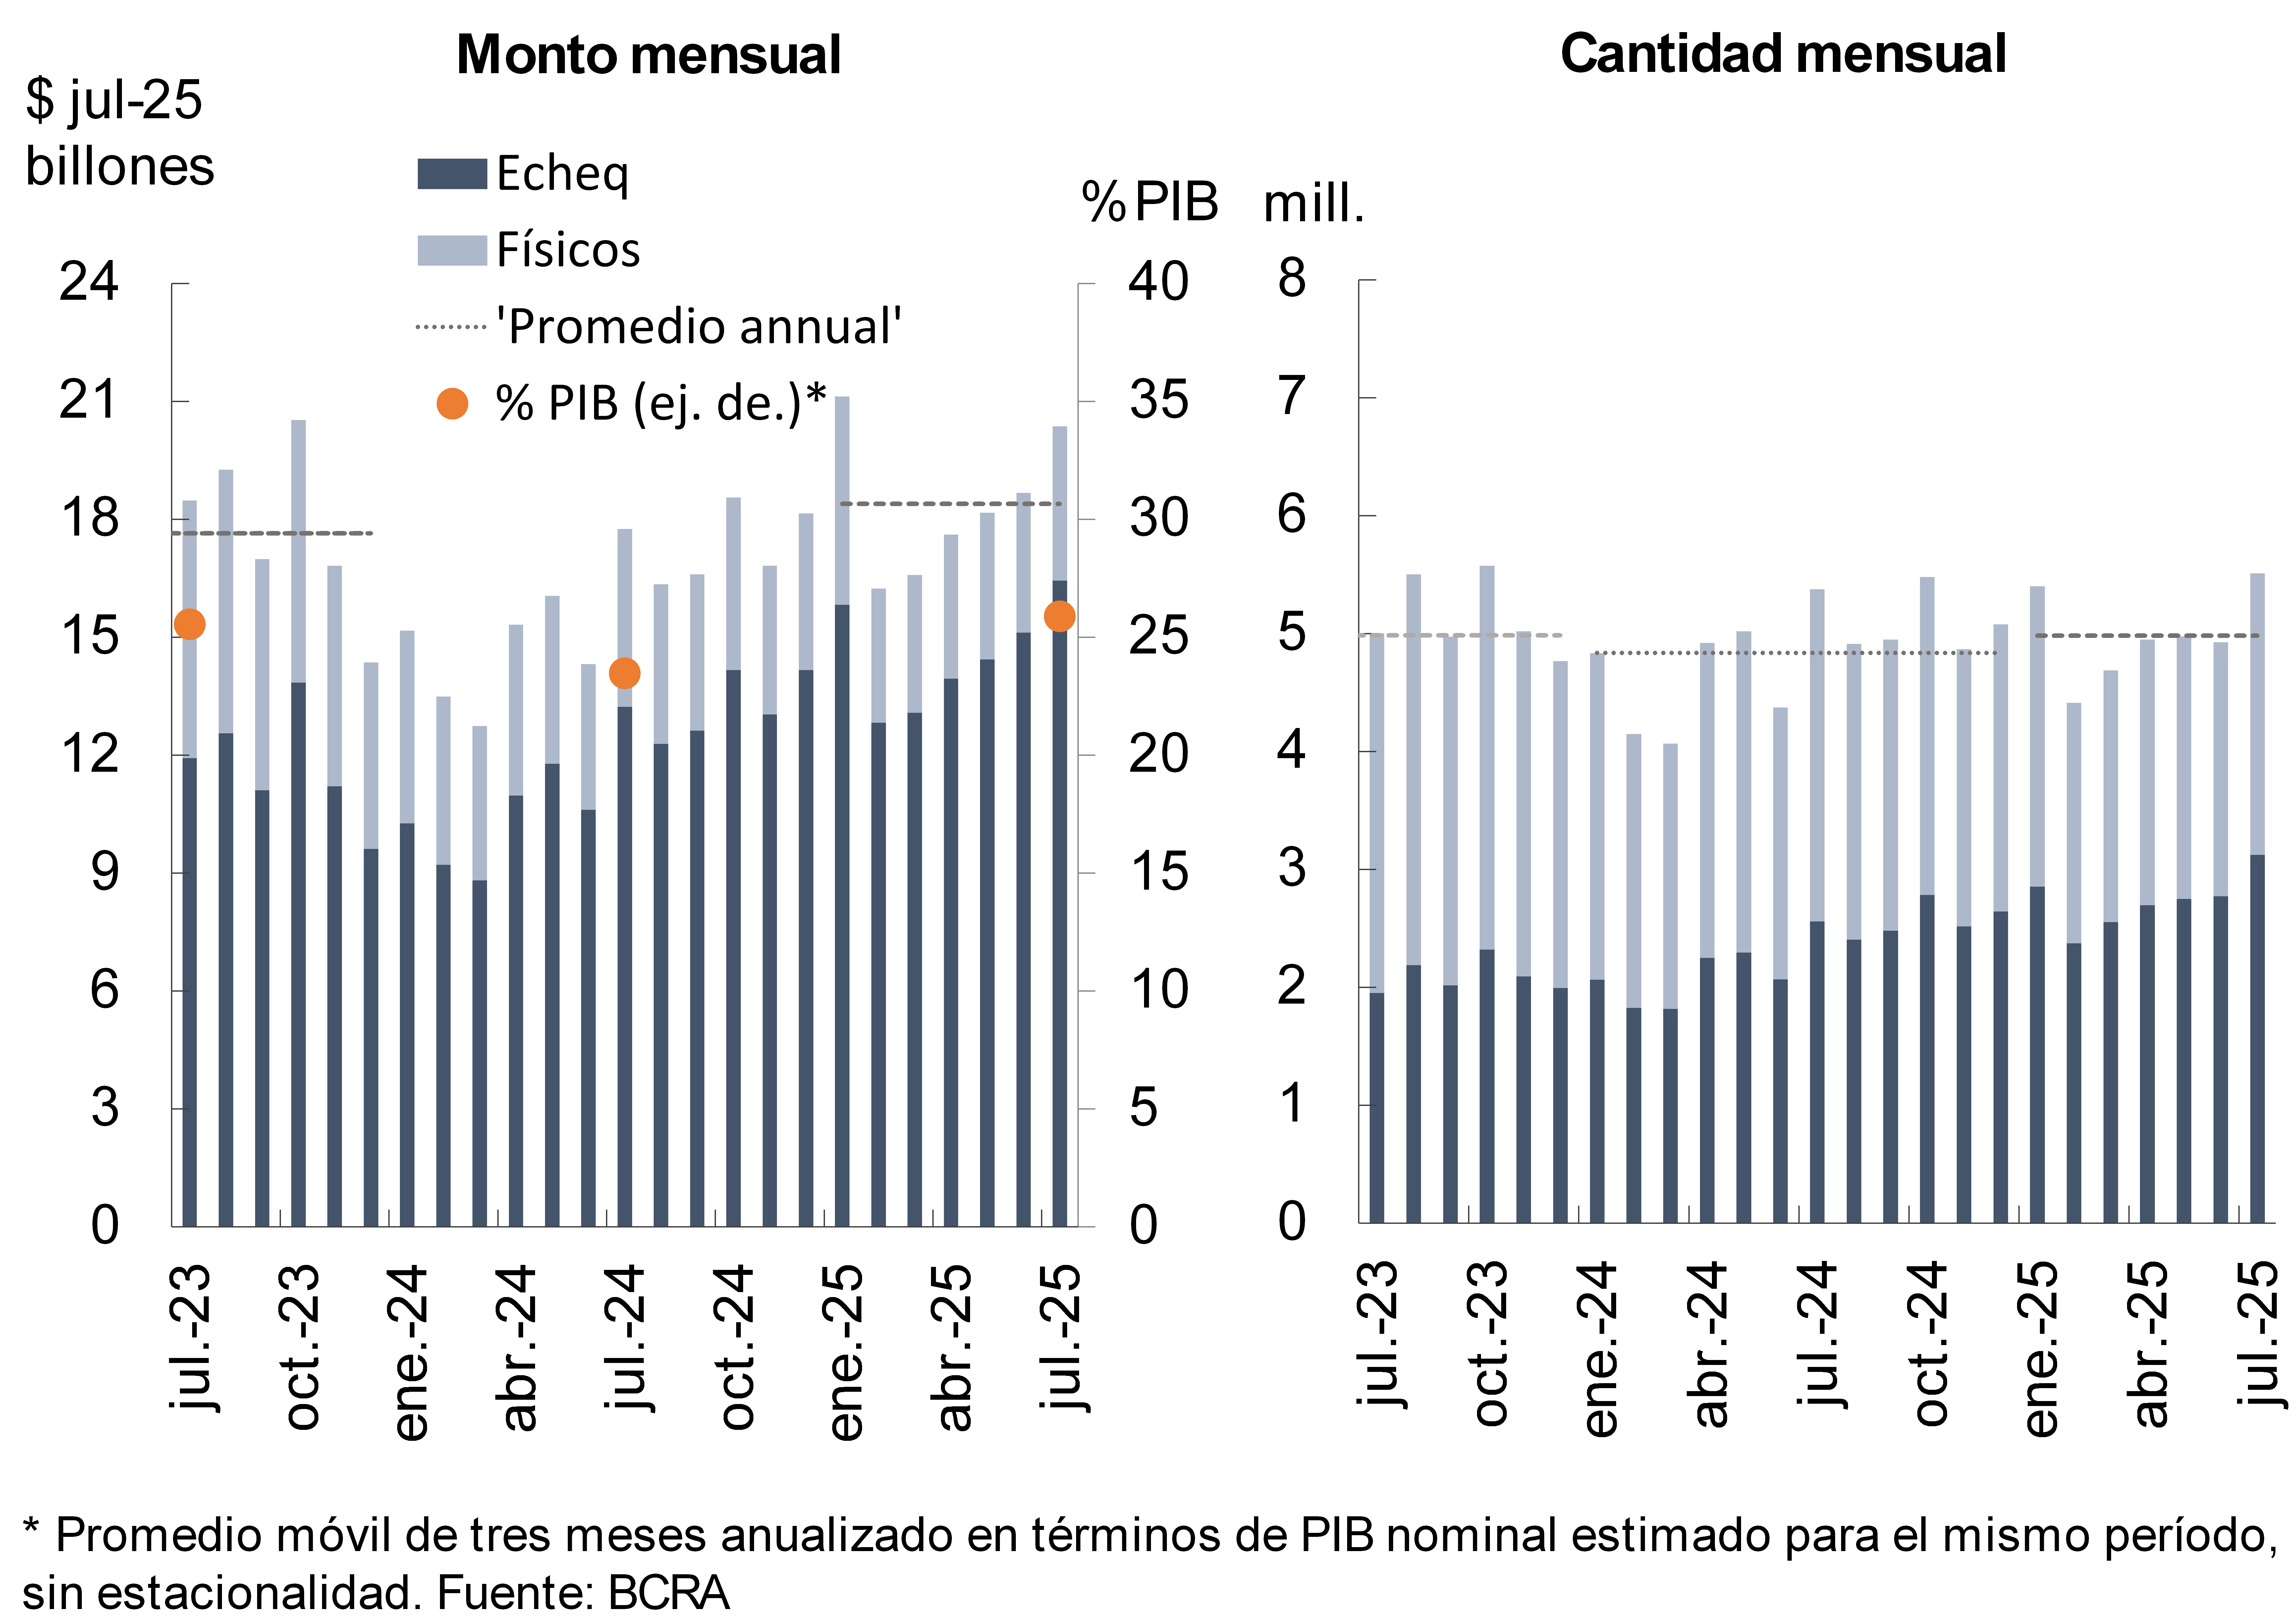
In July, check clearing increased, partly associated with seasonal factors, accumulating a year-on-year growth of 2.5% in quantities and 14.7% in real terms in amounts (see Chart 14)14. ECHEQs continue to gain relevance: as of July, they represented 56.7% of the total amount compensated (+9 p.p. y.a.) and 80.7% of the amounts (+6.2 p.p. y.a.)14. It is estimated that, as a whole, the value of cleared checks was equivalent to 25.9% of GDP (+2.4 p.p. compared to July 2024)14.
Graph 14 : Check clearing
In July, the ratio of rejected checks due to lack of funds over the total compensated stood at 1.41% in amounts and 1.11% in amounts. These ratios increased compared to June (+0.05 p.p. in quantities and +0.06 p.p. in amounts), remaining above the average for year14.
References
1 The Fiscal Liquidity Bills (LEFI) matured on 07/17/25. As of 07/10/25, the BCRA stopped offering financial institutions the possibility of subscribing to LEFI. For more details, see Press Release of 09/06/25.
2 Part of the monthly increase in the real credit balance was explained by the restatement in pesos of the balance corresponding to the segment in foreign currency, within the framework of the increase in the nominal exchange rate $/USD (13.2% in the month).
3 Financing to companies includes those granted to legal entities and commercial financing granted to individuals. On the other hand, loans to families are considered to be those granted to individuals, unless they are for commercial purposes.
4 See footnote 2.
5 This monthly performance was partly influenced by the increase in the nominal exchange rate (see footnote 1).
6 Changes in exposure to the public sector were mainly associated with the maturity of LEFIs (see footnote 1).
7 Including off-balance sheet foreign currency purchase and sale operations.
8 It considers availabilities (cash and current account at the BCRA), the balance of the types of public securities that the entities compute as integration of Minimum Cash and the holdings of LECAP maturing in the next 3 months (until mid-2024 it incorporated BCRA instruments and until June 2025 it considered the fiscal liquidity bills -LEFI-).
9 See footnote 1.
10 Performance in the period reflected the effect of the regulatory readjustment. For more details, see the regulatory annex of July 2025.
11 In year-on-year terms, the amount of IT among CVUs increased 41.8%, while those exclusively among CBUs grew 8.9%. On the other hand, CBU to CVU operations increased 13.3% YoY, while CVU to CBU operations showed an increase of 12.6% YoY.
12 In July, the average value of IT was $106,129.
13 In July, the average value of PCTs through QR codes was $19,508.
14 In July, the average amount of cleared checks was $3.7 million (physical format: $1.65 million; ECHEQs: $5.3 million).
Share on


