I. Financial intermediation activity
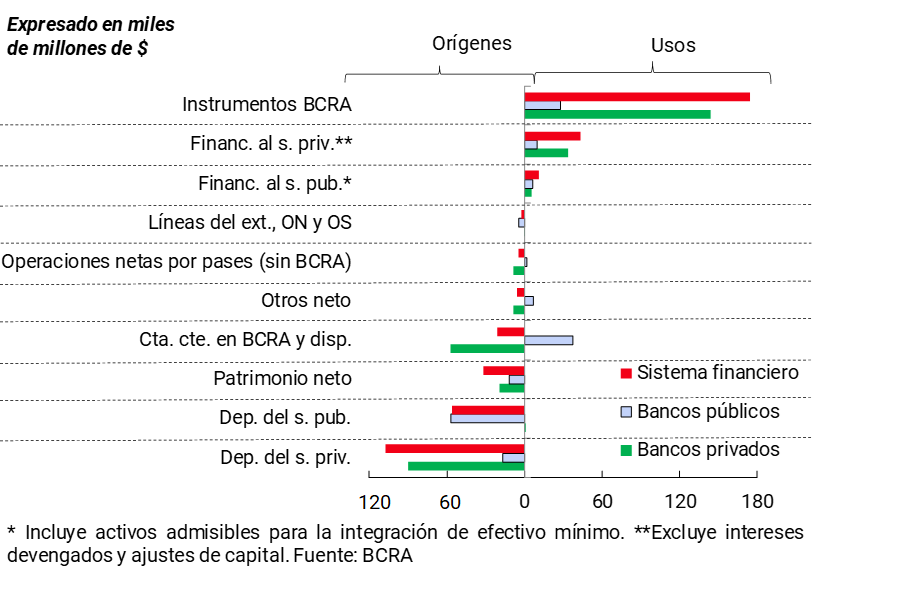
According to the estimated cash flow for July,1 the financial system obtained resources mainly through the increase in the balance of private sector deposits (see Graph 1). To a lesser extent, the increase in public sector deposits was another relevant source of funding for banks in the month. These resources were mainly applied to the increase in the balance of LELIQ and, secondarily, to the nominal increase in loans to the private sector.
Graph 1 | Jul-19 Cash Flow Estimate
In this context, bank assets grew 1% in real terms in the month, verifying a similar relative performance by group of banks. On the other hand, in year-on-year terms (i.a.), assets fell by 7.1% in real terms, a variation mainly explained by public banks.
In July, assets and liabilities denominated in foreign currency slightly increased their weighting on the bank balance sheet. As of July, foreign currency assets accounted for 29.8% of the total (see Chart 2), 0.5 p.p. and 5.3 p.p. more than in June of this year and July 2018, respectively. On the liabilities side, items denominated in foreign currency accounted for 29.2% of total funding (liabilities and equity), exceeding 0.7 p.p. and 5.4 p.p. the levels of the previous month and the same period of the previous year, respectively. On the other hand, considering forward purchase and sale transactions of foreign currency without delivery of underlying – classified off-balance sheet – the spread between assets and liabilities in foreign currency in terms of regulatory capital increased 5.3 p.p. compared to June to 9.9% for the aggregate of banks. However, the level of this indicator was 1.2 p.p. lower than that observed in July 2018.
Graph 2 | Foreign Currency Assets and Liabilities
Financial system

It should be recalled that, given the macroprudential regulation of the BCRA, financial intermediation in national currency is separate from that originating in foreign currency. Funding through deposits in foreign currency can only be applied to debtors who demonstrate income in that denomination, while the remaining resources must remain liquid. 2 Thus, as of July, about 58% of total deposits in foreign currency (from the private sector and the public sector) were offset by liquid assets in this denomination, while the rest of deposits in foreign currency were mainly applied to loans to tradable sectors.
Considering the operations of the National Payment System, in July the daily average of immediate transfers increased (see Graph 3), both in real values (5.9% compared to June or 11.5% YoY) and in amounts (1.2% in the month or 51.1% YoY). On the other hand, the rejection of checks due to lack of funds in terms of the total compensated had a mixed performance in July compared to June: while it remained stable in terms of the number of operations, it increased slightly considering the values processed (0.1 p.p.). The current weighting of the rejection of checks due to lack of funds over the total compensated was well below the levels of a year ago (-0.5 p.p. for amounts up to 1.2% and -0.3 p.p. up to 1% for traded securities, see Chart 4).
Graph 3 | Immediate Funds Transfers
Daily average
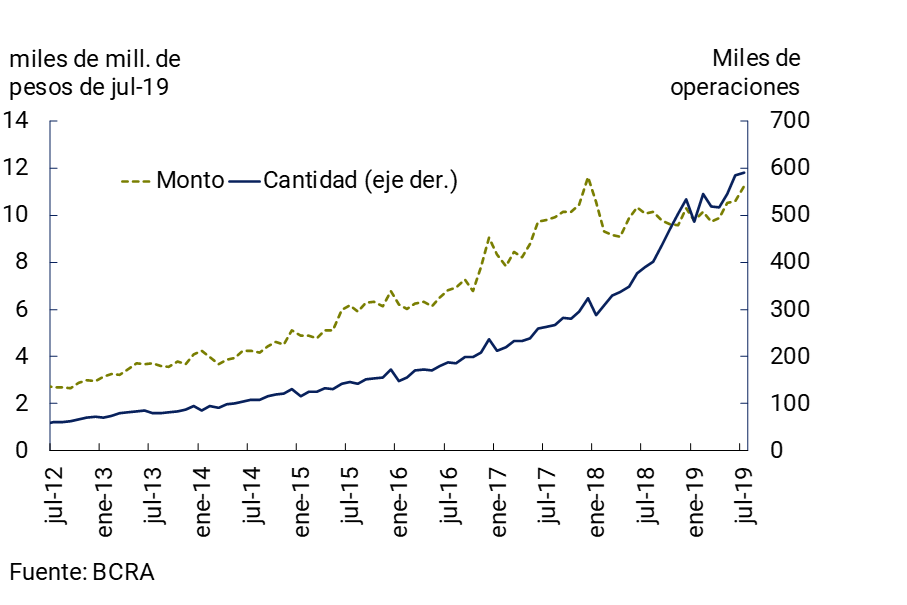
Figure 4 | Check Clearing and Rejection

II. Deposits and liquidity
Private sector deposits in pesos fell 1.7% in real terms (+0.4% nominal) in July. Within this segment, demand balances decreased 5.1% in real terms in the month (-3.1% nominal), while time deposits increased 1.6% in real terms (+3.8% nominal). Given that public sector deposits increased in July, the balance of total deposits in the financial system increased by 1.5% in real terms (+3.7% nominal).
In a year-on-year comparison, private sector deposits in pesos decreased 2% in real terms, with an increase in term deposits (+11.4% y.o.y. in real terms) and a reduction in demand accounts (-13.1% y.o.y. in real terms). Public sector deposits also fell in the last 12 months. In this context, the balance of total deposits decreased by 6.3% YoY in real terms.
In July, total private sector deposits accounted for 61.5% of the total funding (liabilities plus net worth) of the financial system (-0.2 p.p. compared to June and +7.1 p.p. y.o.y.). Within this segment, foreign currency and time deposits in pesos increased their relative importance in funding, while demand accounts in pesos decreased (see Chart 5).
Graph 5 | Total Funding – Financial System

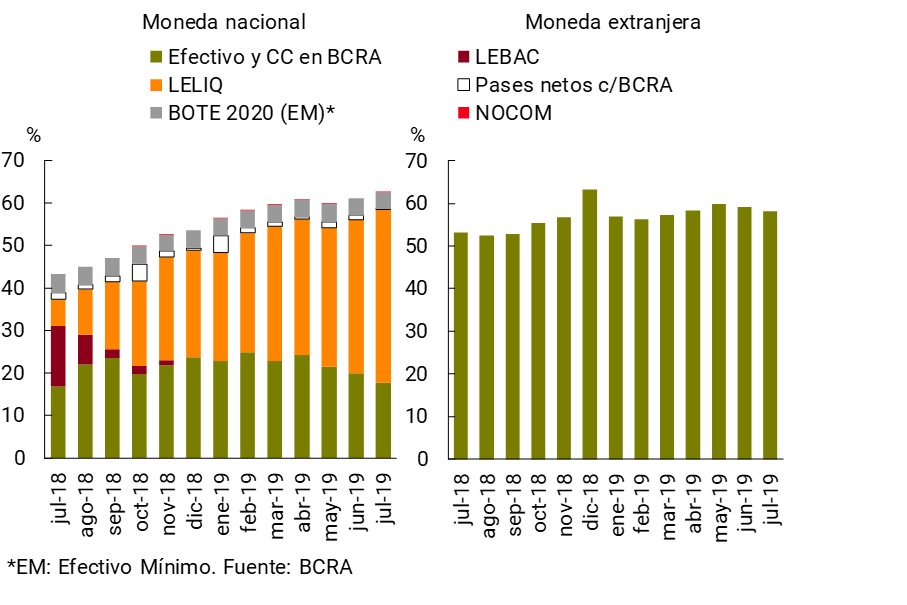
The broad liquidity indicator3 reached 61.1% of total deposits in July (62.5% for items in pesos), 0.6 p.p. above the previous month’s record (+1.4 p.p. for the segment in national currency). During the month, there was an increase in the participation of LELIQs and a fall in current account balances at the BCRA (see Chart 6), partly reflecting the effects of the regulatory changes introduced by the BCRA. 4 In the last 12 months to July, the broad liquidity ratio grew by 15.1 p.p. of deposits (+19.2 p.p. for the indicator in pesos). Liquidity in foreign currency stood at 58.1% of deposits in the same denomination in the period (-1.1 p.p. and +4.9 p.p. in a monthly and year-on-year comparison, respectively).
Graph 6 | Liquidity of the Financial System
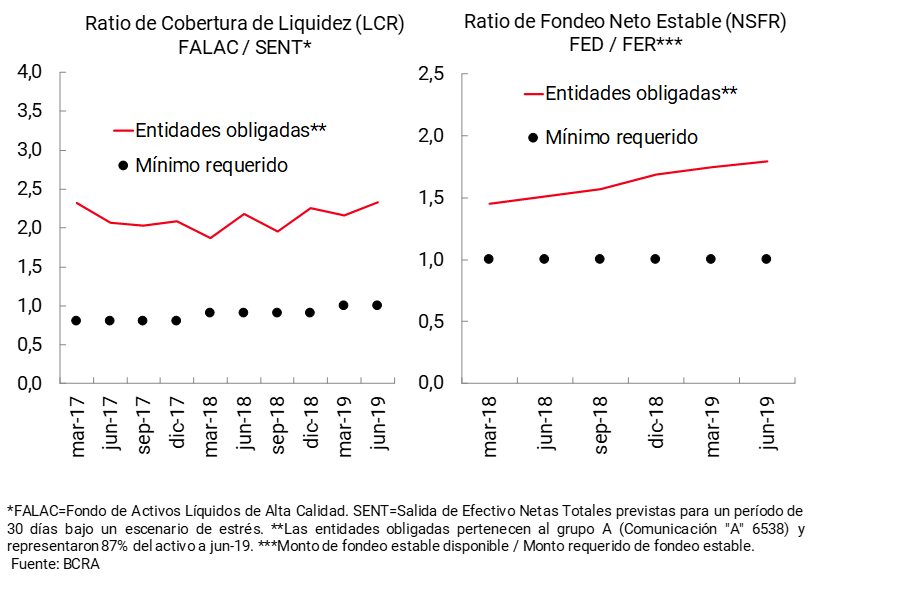
Liquidity indicators arising from international recommendations (according to the Basel Committee) remained high. Considering the latest information available for obligated entities,5 as of June 2019 the Liquidity Coverage Ratio (LCR) stood at 2.3, while the Stable Net Funding Ratio (NSFR) totaled 1.8. These records continued to exceed the minimum required (see Figure 7).
Figure 7 | Basel III Liquidity Indicators
III. Credit and Portfolio Quality
In July, the balance of bank financing in pesos to the private sector decreased by 1.6% in real terms (+0.6% in nominal terms). Within this segment, in the month almost all credit lines showed real falls, with the exception of cards (+0.5% real). 6 Meanwhile, the balance of credit in foreign currency increased 2.5% compared to June (see Chart 8), with greater relative growth in cards.
Figure 8 | Private Sector Credit Balance by Currency*
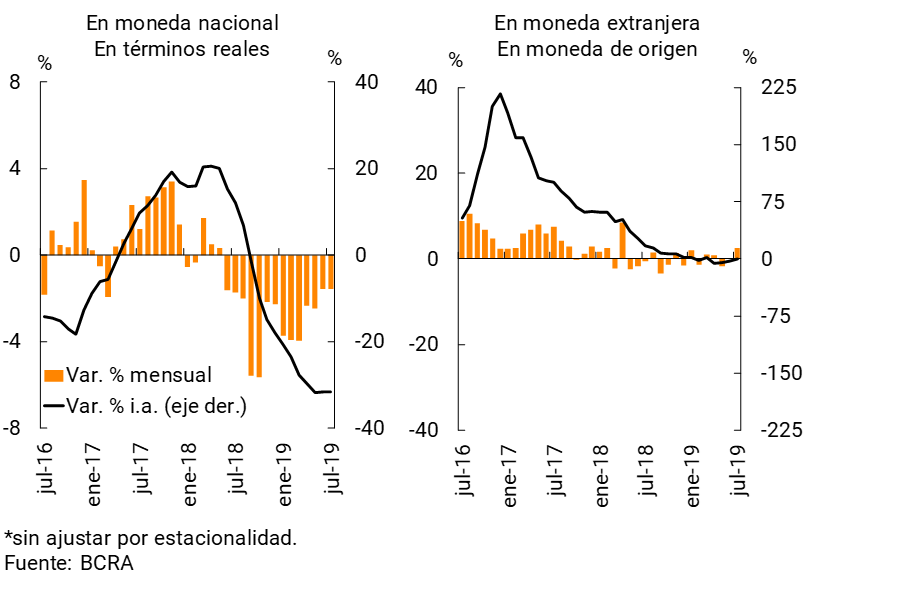
In a year-on-year comparison, credit in national currency to the private sector accumulated a 31.6% real fall in July, while the balance of loans in foreign currency did not show any changes in magnitude in the period (-0.1% y.o.y. in currency of origin).
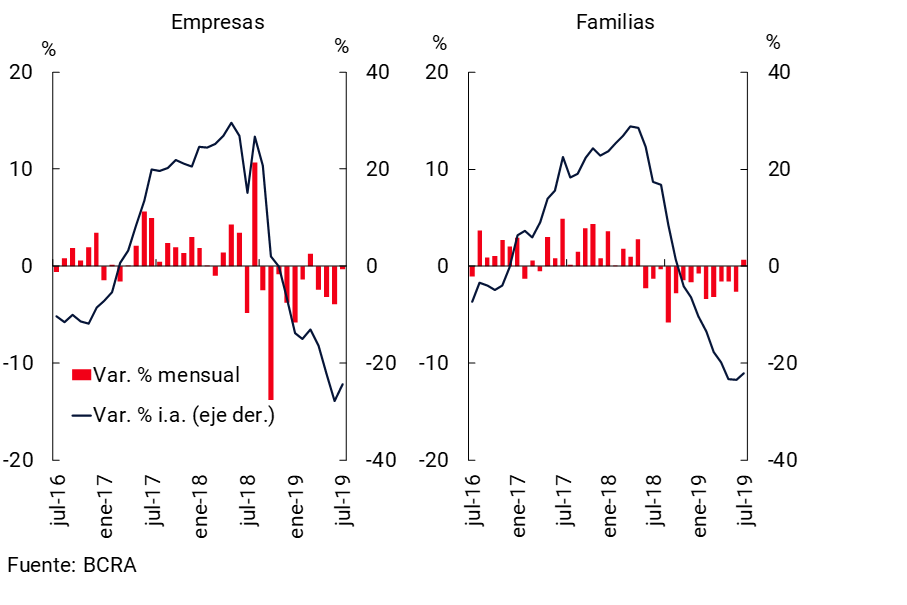
Financing to companies (in domestic and foreign currency) decreased 0.3% in real terms (+1.8% nominal) compared to June, mainly due to the performance of loans to service providers. In year-on-year terms, total loans to companies fell by 24.4% in real terms (see Chart 9). 7 On the other hand, loans to households (in domestic and foreign currency) increased by 0.6% in real terms (+2.8% nominal) in the month. Within this segment, cards showed real increases in the period, while personal and pledge cards decreased. In a year-on-year comparison, loans to households decreased 22.1% in real terms. The weighting of credit to the private sector in the total assets of the aggregate financial system stood at 38.8% in July, down 0.4 p.p. from last month’s value and 8.5 p.p. compared to the previous year’s record.
Figure 9 | Total Credit Balance to the Private Sector
Changes in real terms
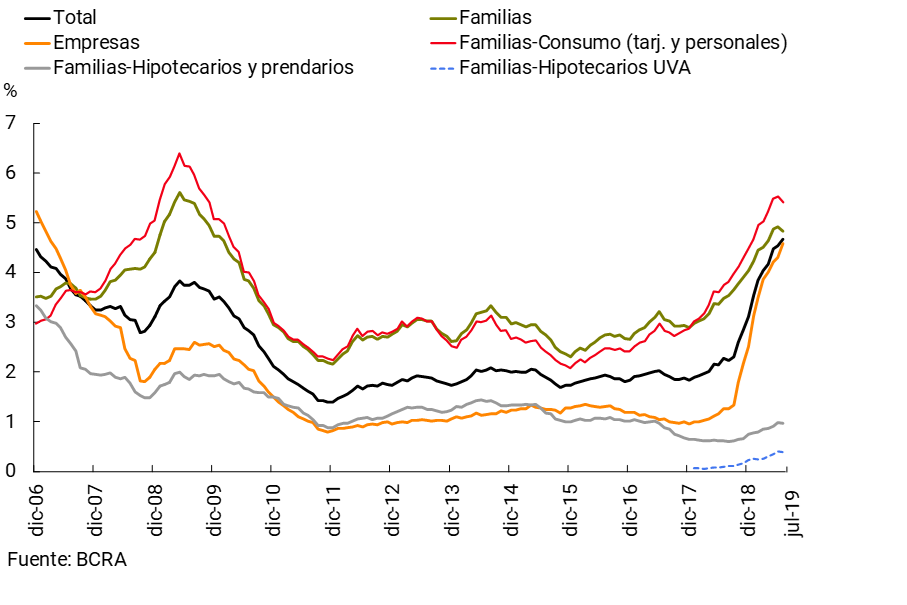
In July, the irregularity of financing to the private sector stood at 4.7% of the total portfolio, increasing 0.1 p.p. in the month and 2.4 p.p. y.o.y. (see Graph 10). The NPL ratio of loans to companies increased by 0.3 p.p. in the period (+3.3 p.p. y.o.y.) to 4.6%, while the non-performing loan coefficient of loans to households decreased by 0.1 p.p. (+1.3 p.p. y.a.), standing at 4.8%. Mortgage loans to families maintained their NPL ratio unchanged in the month: 0.4% for the UVA segment and 0.7% for the rest. 8
Figure 10 | Irregularity of Credit to the Private Sector
Irregular financing / Total financing (%)
In July, the balance of total accounting forecasts (regular and irregular portfolio) represented 98% of loans to the private sector in an irregular situation in the financial system, in line with last month. Meanwhile, the estimated balance of forecasts attributable to the irregular portfolio stood at 76% of said portfolio (see Graph 11), exceeding the minimum required (estimated at 46% of the irregular portfolio). On the other hand, it is estimated that financing in an irregular situation not covered with forecasts attributable to this portfolio stood at 4.3% of the balance of regulatory capital integration (8.9% of excess regulatory capital), 0.4 p.p. lower than the value of the previous month.
Figure 11 | Forecasting of the Financial System

During the period, the exposure of the financial system to the public sector remained at limited levels. Financing to the public sector of the banks as a whole represented 9.4% of total assets in July, in line with last month’s record and 2 p.p. below the level of a year ago. Public banks accounted for most of this exposure and drove the indicator’s year-on-year decline. For its part, the financial system’s exposure to this sector net of the balance of public sector deposits stood at -2.1% of total assets in the month, 4.9 p.p. above the level of a year ago.
IV. Solvency
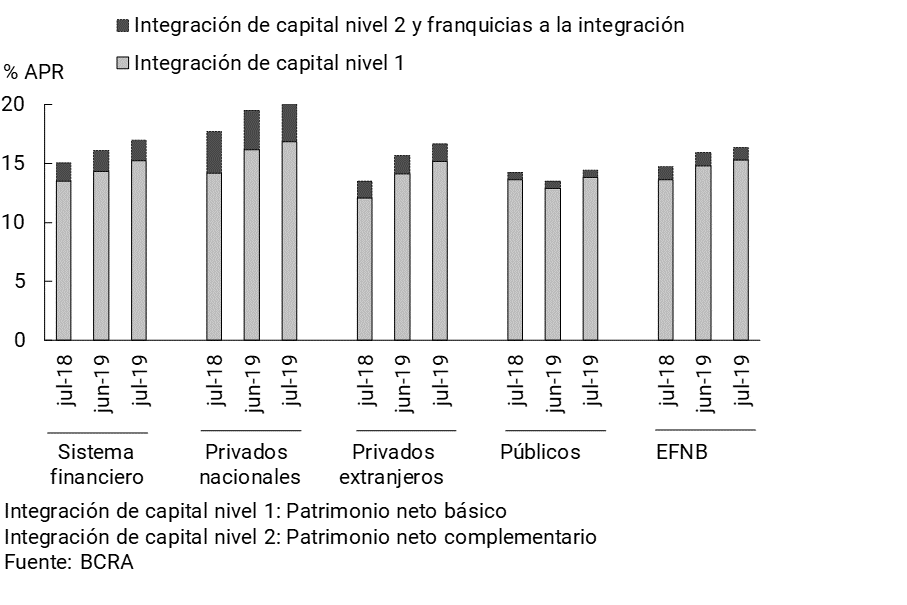
Solvency indicators for the financial system increased in the month. In July, the capital integration (RPC) of the banks as a whole in terms of risk-weighted assets (RWA) grew 0.9 p.p. to 17% (see Chart 12). The concepts that make up Tier 1 capital continue to account for most of the total PRC, totaling 90% at the systemic level. In the month, the ratio between the PRC and the minimum requirement to be integrated stood at 192% for the financial system, 7.3 p.p. more than in June. In a year-on-year comparison, capital integration increased 1.9 p.p. of RWAs and 16.8 p.p. of regulatory requirements.
Figure 12 | Integration of regulatory capital
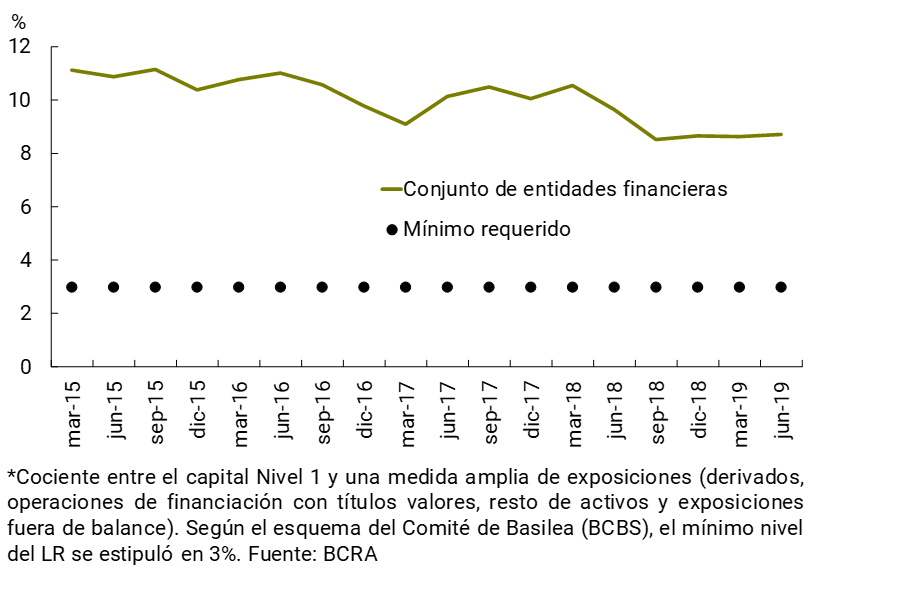
The leverage ratio (tier 1 capital as a percentage of a broad measure of exposures assumed by banks, both on- and off-balance sheet) comfortably exceeded the local minimum requirements. These requirements are in line with international recommendations (according to the Basel Committee). The financial system exhibited leverage of 8.7% as of June – the latest information available – above the regulatory minimum of 3% (see Chart 13).
Figure 13 | Leverage Ratio* (LR)
The monthly nominal profitability of banks was at levels similar to those of June (see Chart 14). ROA totaled 4.6%y. (+0.2 p.p. in the month) and ROE was around 41.4%y. (+0.8 p.p. in the month). In the accumulated of the last 12 months to July, the nominal profits accounted for represented 4.6% of assets and 42.2% of equity.
Figure 14 | Profitability of the Financial System
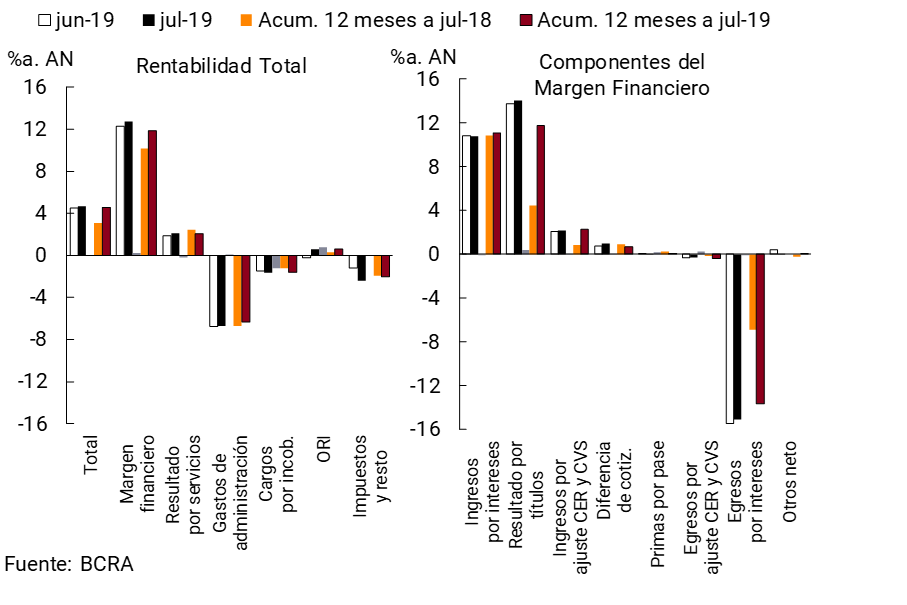
In July, the financial margin reached 12.7% y/a. of assets, 0.5 p.p. more than in the previous month. Lower interest outflows on deposits and higher gains on securities mainly explained the monthly increase in the financial margin. In the last 12 months, the financial margin accumulated a level equivalent to 11.9% of assets, 1.7 p.p. more in a year-on-year comparison.
In July, net income from services in the financial system grew 0.2 p.p. of assets compared to June to 2.1%y. In the cumulative period between August 2018 and July 2019, banks obtained profits for this concept of 2.1% of assets, 0.3 p.p. less than a previous year.
In July, administrative expenses fell slightly (-0.1 p.p. of assets to 6.7%y). The levels of the last few months show some increase in relation to the records of the beginning of the year and the end of 2018. In the accumulated of the last 12 months to July, administrative expenses totaled 6.3% of assets, being 0.4 p.p. lower than in the same period a year ago.
Bad debt charges increased slightly in July for the system as a whole (+0.2 p.p. of assets to 1.6%y), a variation explained by public banks. Thus, in the 7 months of this year and the last 5 months of 2018 these expenditures represented 1.6% of assets, 0.4 p.p. higher in a year-on-year comparison. This increase is in line with the deterioration in the quality of the loan portfolio evidenced in the last year.
In July, banks accrued profits in ORI of 0.5% y/y of assets (0.8 p.p. more than last month). 9 The accumulated cash flow in the last year to July stood at 0.6% of assets (+0.3 p.p. y.o.y.).
References
1 Based on differences in balance sheet balance.
2 See Ordered Text of Credit and Minimum Cash Policy.
3 Availability, integration of minimum cash and BCRA instruments, in national and foreign currency.
4 In July, the BCRA ordered that the integration of reserve requirements in pesos be carried out considering the July-August bimonthly period jointly (see Communication “A” 6719). In addition, it was decided to increase by 3 p.p. the fraction of the reserve requirements that financial institutions are authorized to integrate with LELIQ for fixed-term deposits (see Communication “A” 6738).
5 Financial institutions belonging to Group A according to Communication “A” 6538.
6 Includes principal adjustments and accrued interest.
7 Information extracted from the Central Debtors (national and foreign currency). Loans to residents abroad are not included. Adjustments in principal and accrued interest are considered. Business financing is defined here as that granted to legal entities and commercial financing granted to individuals. On the other hand, loans to families are considered to be those granted to individuals, unless they are for commercial purposes.
8 As of July, out of a total of 102,105 mortgage financing in UVA granted to individuals in the financial system (73% generated by public banks, 16% by national private banks and 11% by foreign private banks), 562 were in an irregular situation.
9 Mainly results from exchange differences and financial instruments accounted for at fair value with changes in ORI.
Share on


