I. Recent measures1
In order to strengthen the control of liquidity in the money market, the BCRA decided to increase the reserve requirements of the relatively larger financial institutions2. In mid-August, the minimum cash requirement rates in pesos applicable to demand deposits and placements of up to 59 days of residual term were increased by 3 percentage points. This increase in demand can only be integrated with pesos. In addition, as of September, the reserve requirements for all deposits in pesos, both demand and time, for these financial institutions were raised again by 5 percentage points3. This last increase may be integrated with pesos, Liquidity Bills (LELIQ) or Notes (NOBAC) of the BCRA. The authorization to integrate this increase with LELIQ or NOBAC reinforces the transmission of the increase in the monetary policy rate (to 60%) to the passive rates of the financial system, and its effect on price dynamics.
At the beginning of August, the BCRA defined the 7-day LELIQ rate as the monetary policy rate. This is intended to focus monetary policy decisions on an instrument whose operational influence is increasing, within the framework of the reduction of the stock of LEBAC promoted by the monetary authority. In this context, in August it was established that financial institutions may not subscribe to Bills of the Central Bank of the Argentine Republic (LEBAC) in pesos for their own portfolio, nor sell these Bills – of their own portfolio – to counterparties that are not financial institutions4. However, banks may continue to use other monetary regulation instruments issued by the BCRA, such as LELIQ or NOBAC.
In order to deepen the availability of information related to credit activity outside the financial system, the scope of the rules on “credit assistance to non-financial credit providers” was recently expanded. Financing will be considered to be granted to natural persons, as well as to legal persons – regardless of whether or not they are users of financial services.
In September, a set of measures was implemented to boost credit mainly to MSMEs6. On the one hand, the operation of assignment of credit instruments without liability for the assignor was facilitated. In addition, the number of borrowers for the allocation of financing through specific evaluation methods ( screening systems and credit scoring models) was expanded, incorporating legal entities not related to the financial institution7. Likewise, the maximum limit that can be granted to MSMEs under this modality was increased. On the other hand, in order to simplify the credit evaluation process of companies, the amount of financing was increased up to which the option of grouping those of a commercial nature with consumer or housing loans is admitted. In addition, domestic (domestic) trade credit insurance – including credit risk insurance “with a public buyer scope” – was incorporated as preferred collateral, with the same requirements as those currently provided for export credit insurance.
After the introduction of the $500, $200 and $20 bills with images of animals native to Argentina, the BCRA recently put into circulation the new $50 bill with the image of the Condor8. In this way, the renewal of working capital continues to be promoted, as well as greater efficiency and reduction in printing costs.
II. Activity
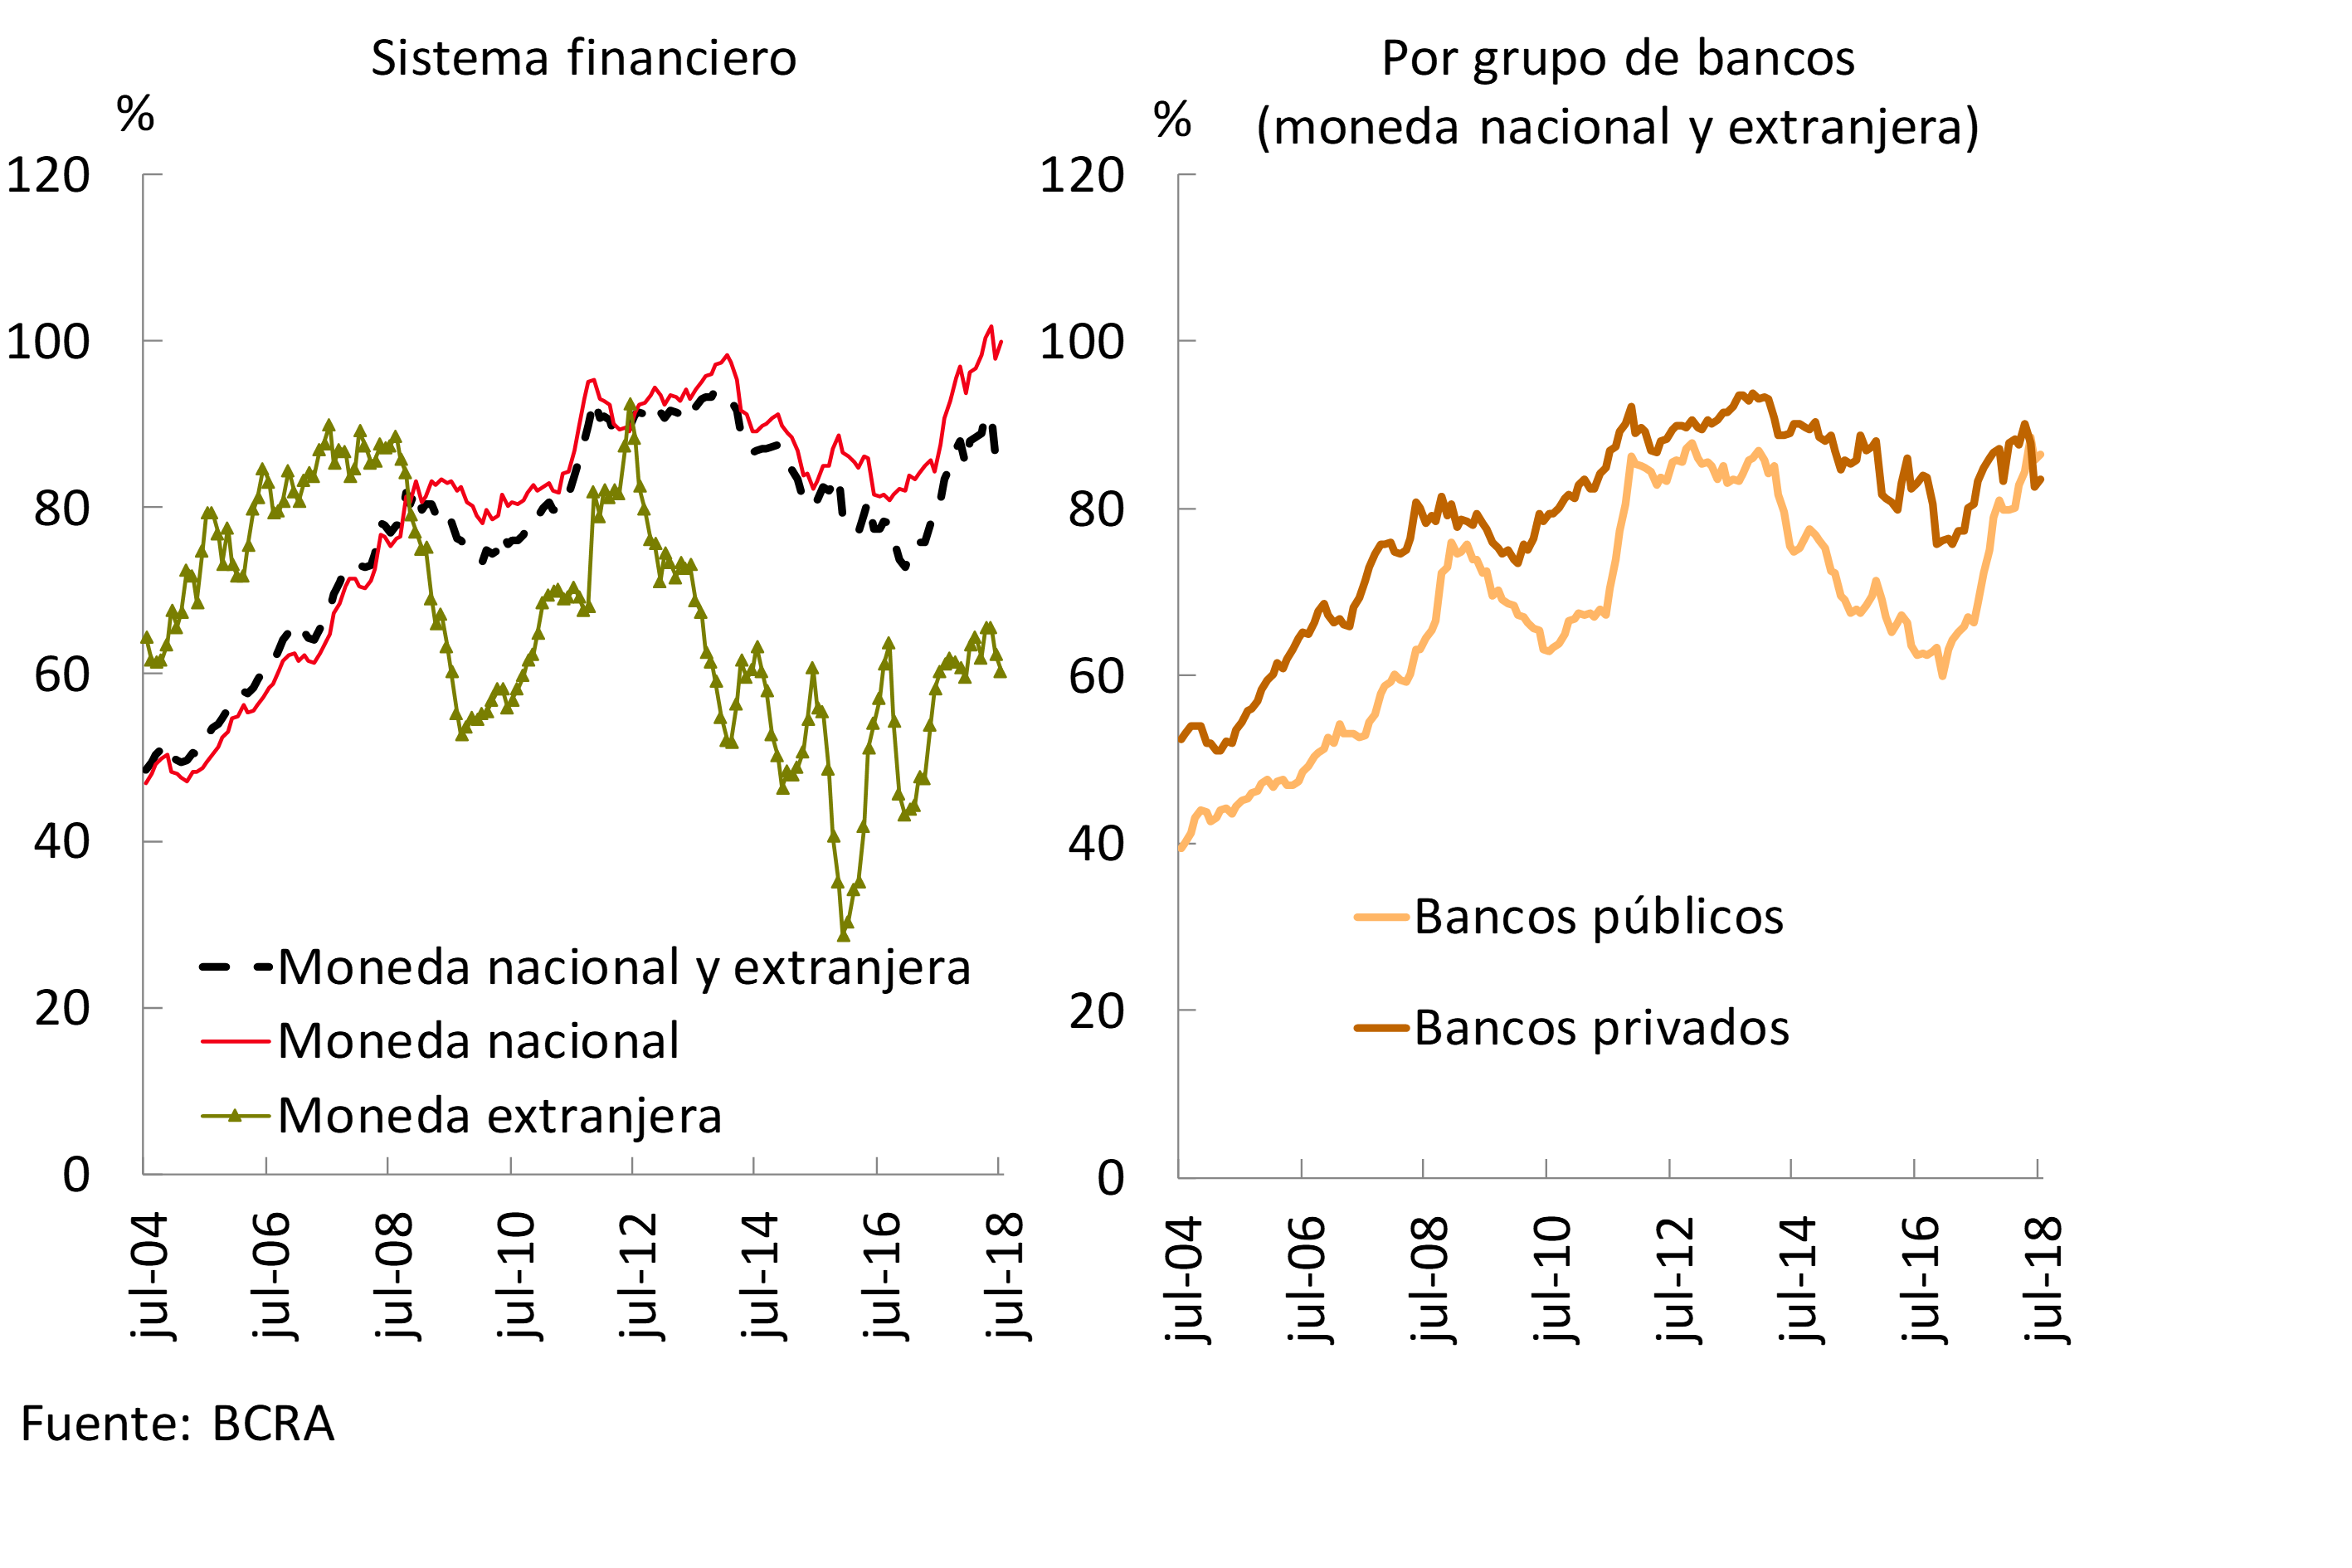
The evolution of banks’ financial intermediation with the private sector continued to be moderate during July. The ratio between loans and deposits in the private sector did not show significant changes in the month, standing at 86% (see Graph 1) and, thus, continued to exceed the level of the same period in 2017. Compared to June, this ratio increased slightly in the peso segment and decreased for foreign currency items. In this context, the net assets of the financial system increased 0.5% in the month (-2.5% in real terms9), and accumulated a year-on-year increase (y.a.) of 53.6% (17.1% adjusting for inflation).
Graph 1 | Loans in Deposit Terms – Balance Sheet Balances – Private Sector
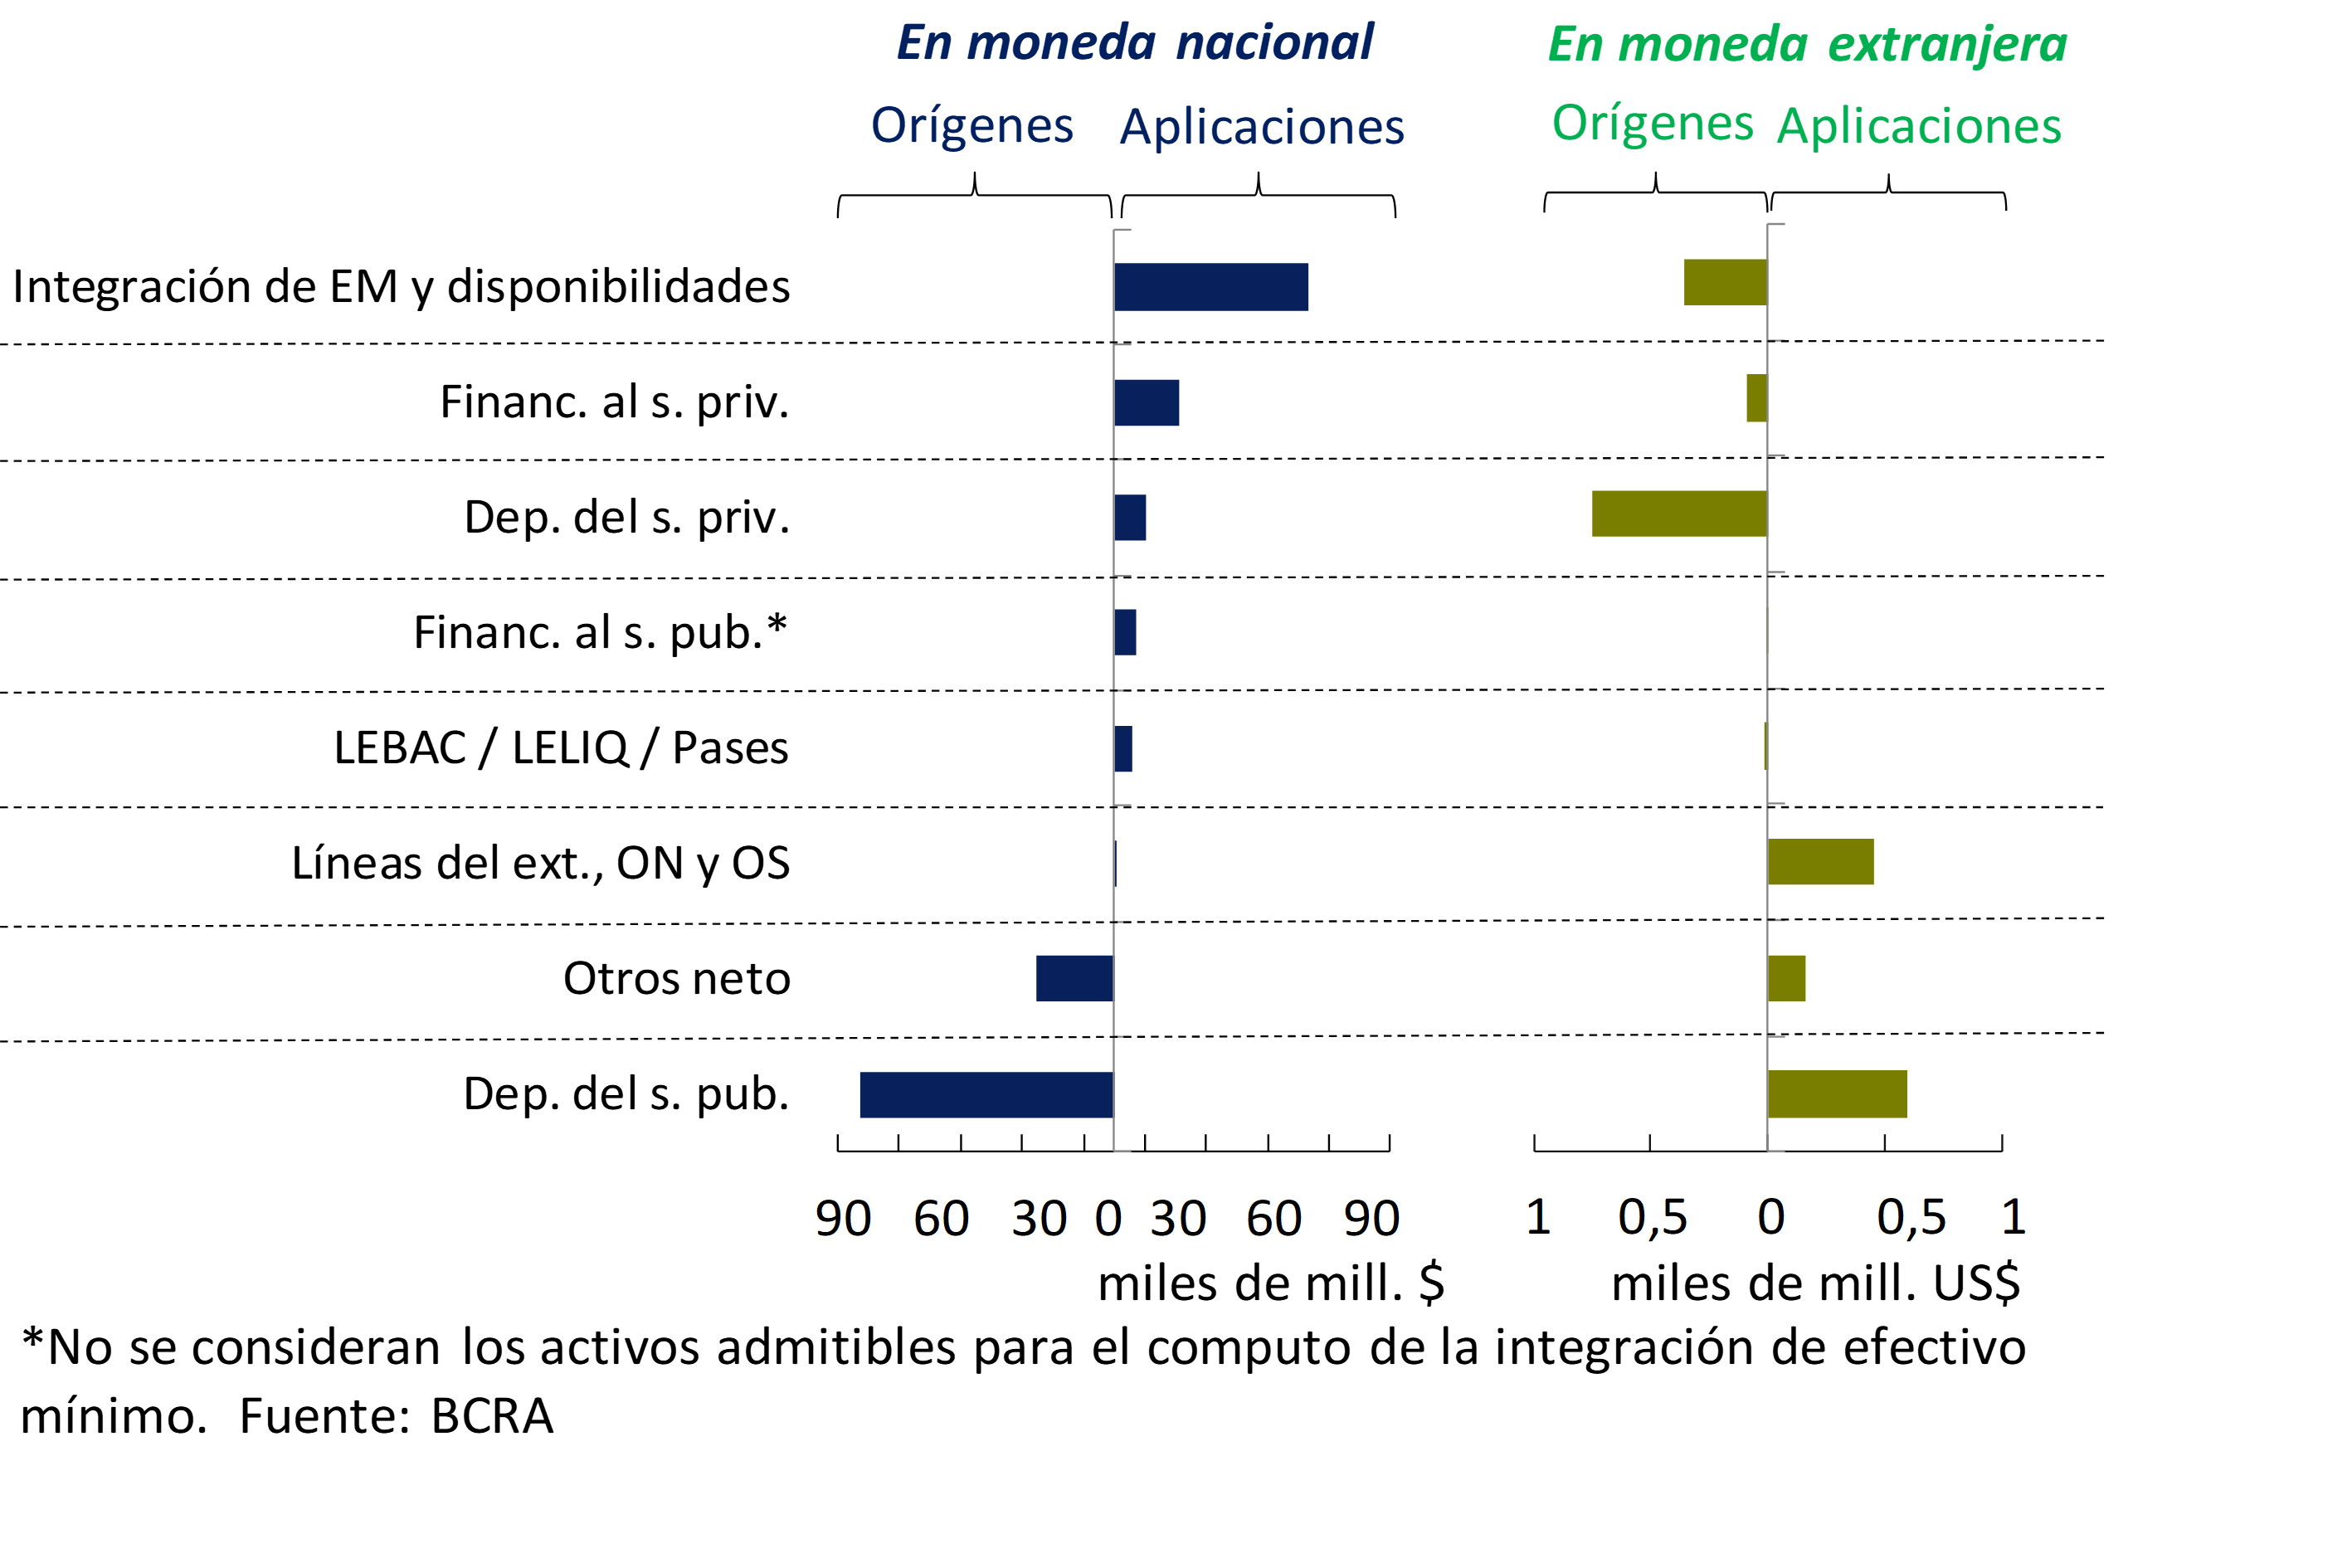
According to the estimated cash flow10 for the banks as a whole, during July in the segment in national currency the increase in public sector deposits ($83,000 million) was the main source of resources (see Graph 2). These funds were mainly used to increase the integration of minimumcash 11 and availabilities ($63,000 million) and, to a lesser extent, to financing the private sector ($21,000 million). On the other hand, considering the items in foreign currency, the most relevant source of resources in July was the increase in private sector deposits, while the main applications were the decreases in public sector deposits (in public banks) and in foreign credit lines (in foreign banks).
Graph 2 | Monthly Cash Flow Estimate – July 2018 – Financial System – By Source Currency
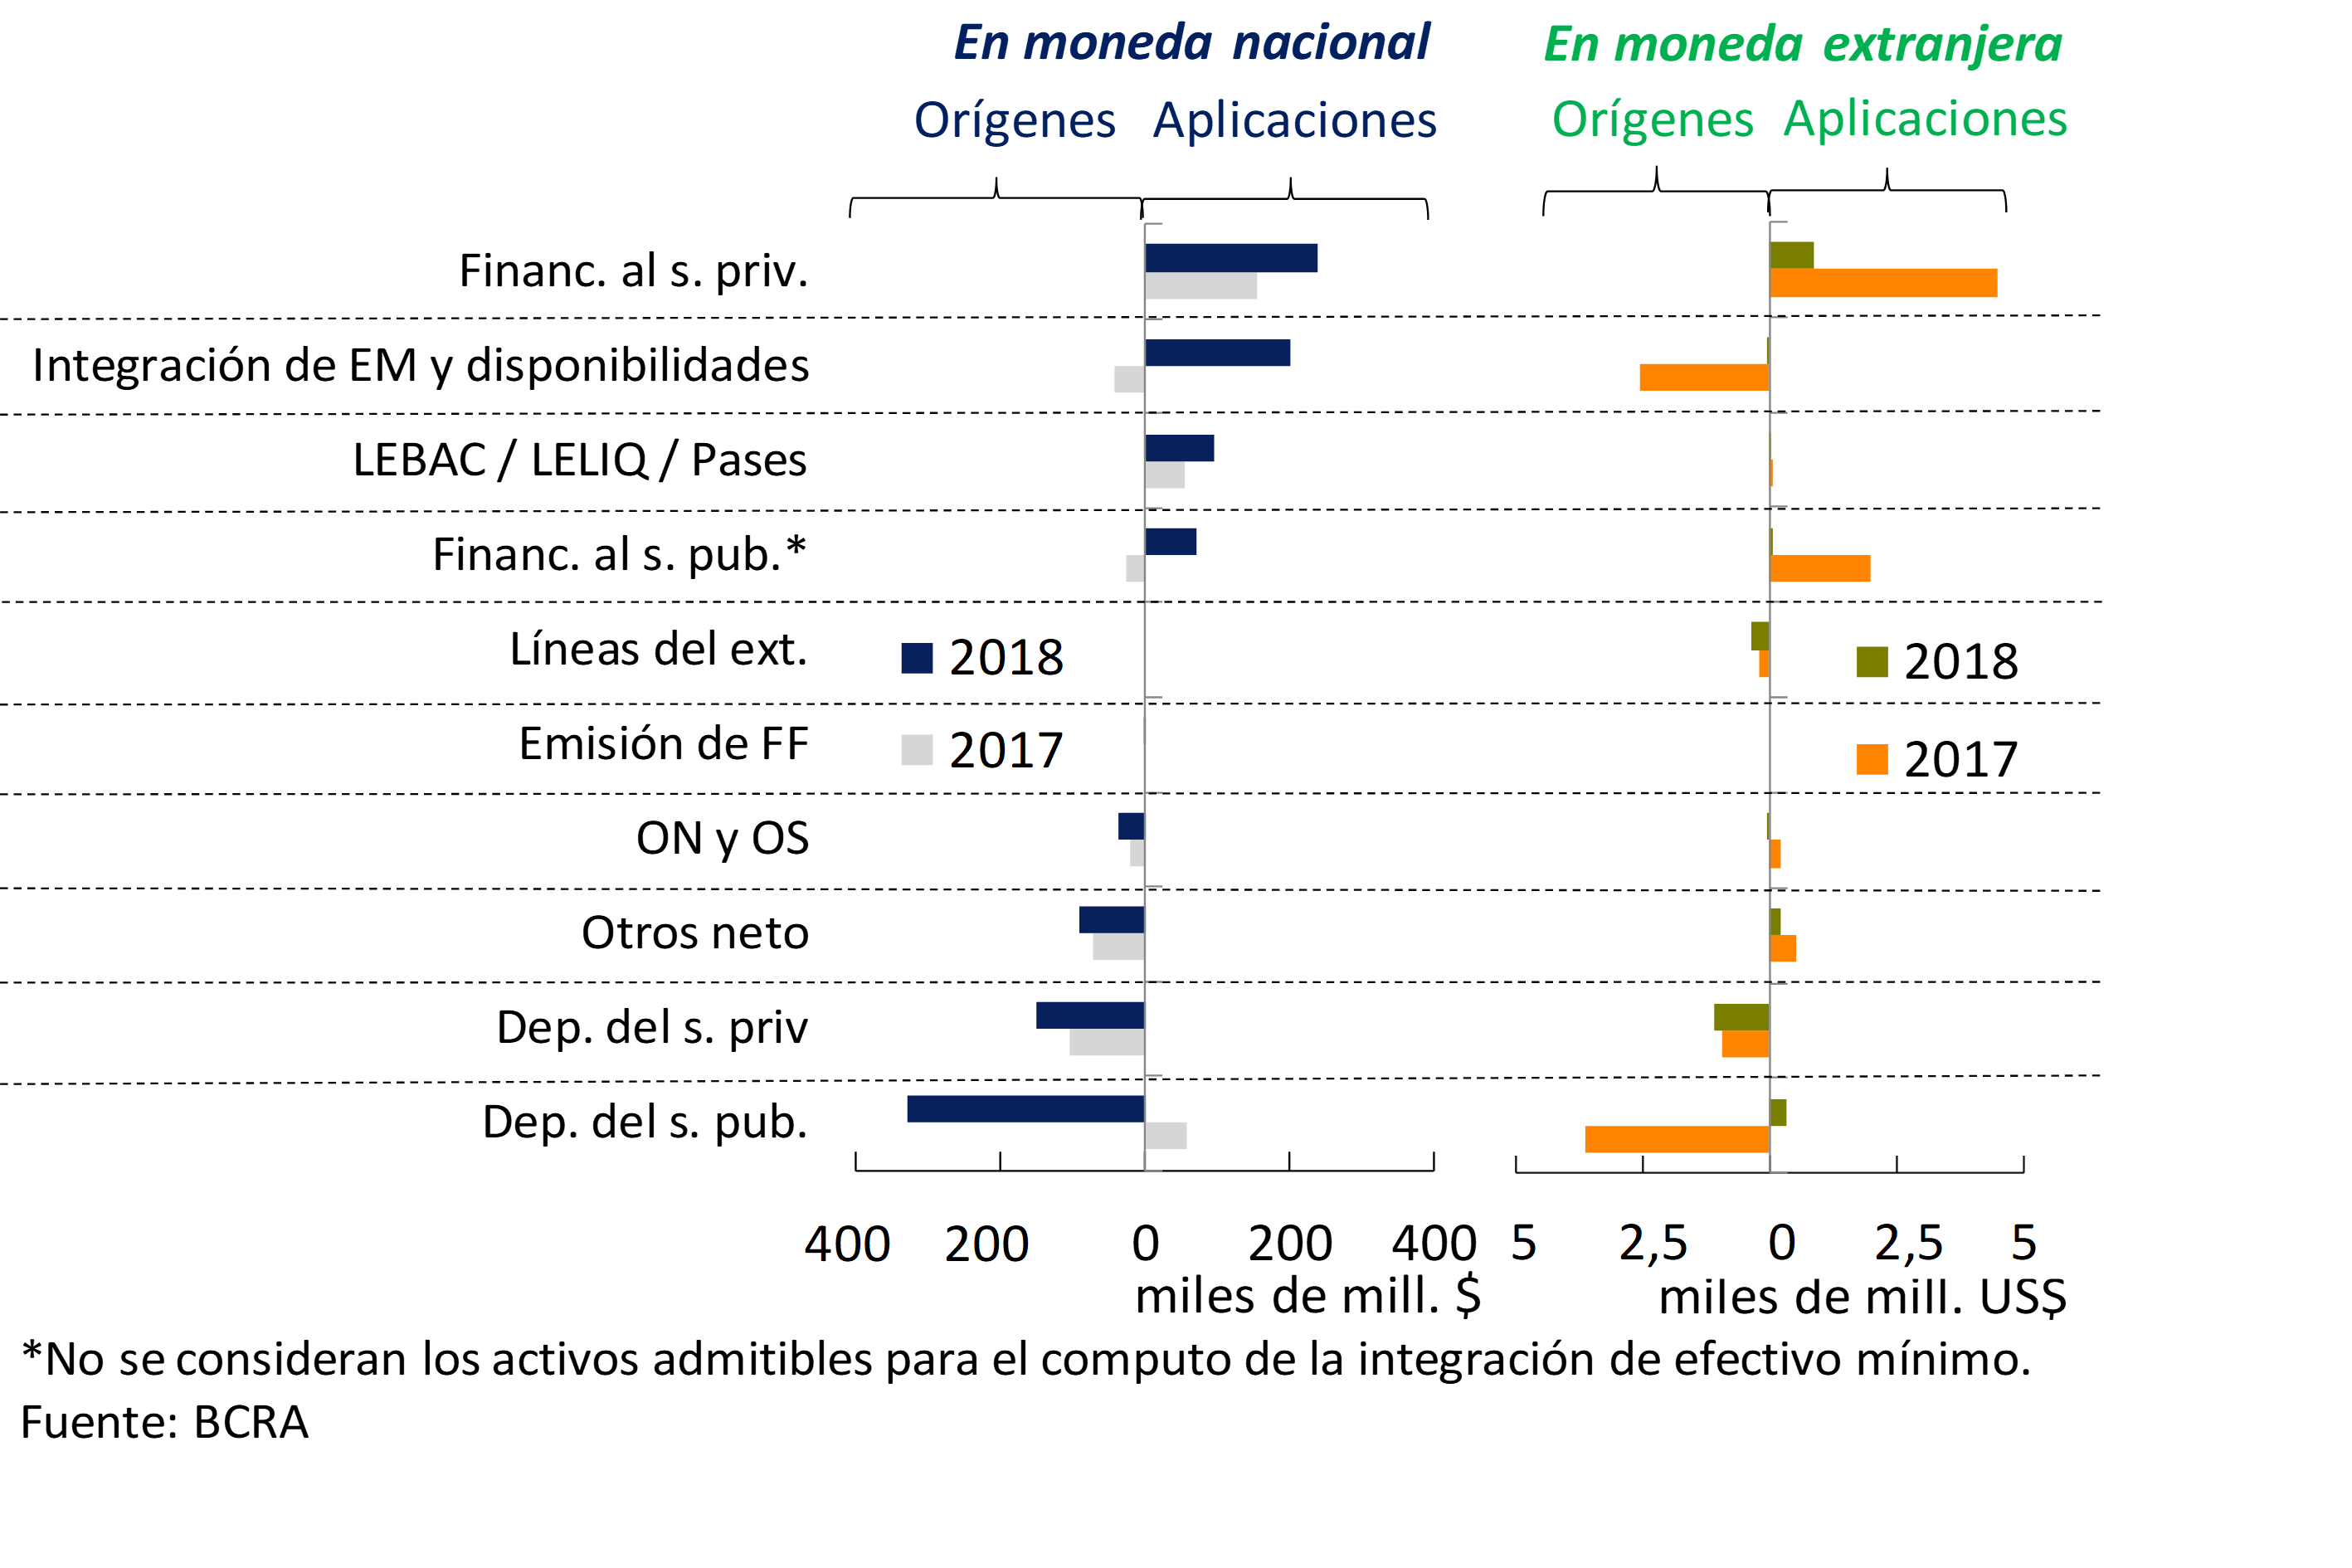
Considering the estimate of the flow of funds for the first seven months of year12, in the segment in pesos, the increase in deposits from the public sector ($330,000 million) and the private sector ($150,000 million) among the sources of resources stood out (see Graph 3). These funds were mainly used to increase credit to the private sector ($241,000 million) and to increase the integration of minimum cash and availabilities ($201,000 million). For its part, so far this year, the increase in private sector deposits was the most prominent source of funds in foreign currency, being channeled mainly to the increase in credit to the private sector in this denomination.
Graph 3 | Estimated Cash Flow – Cumulative Seven Months – Financial System – By Currency of Origin
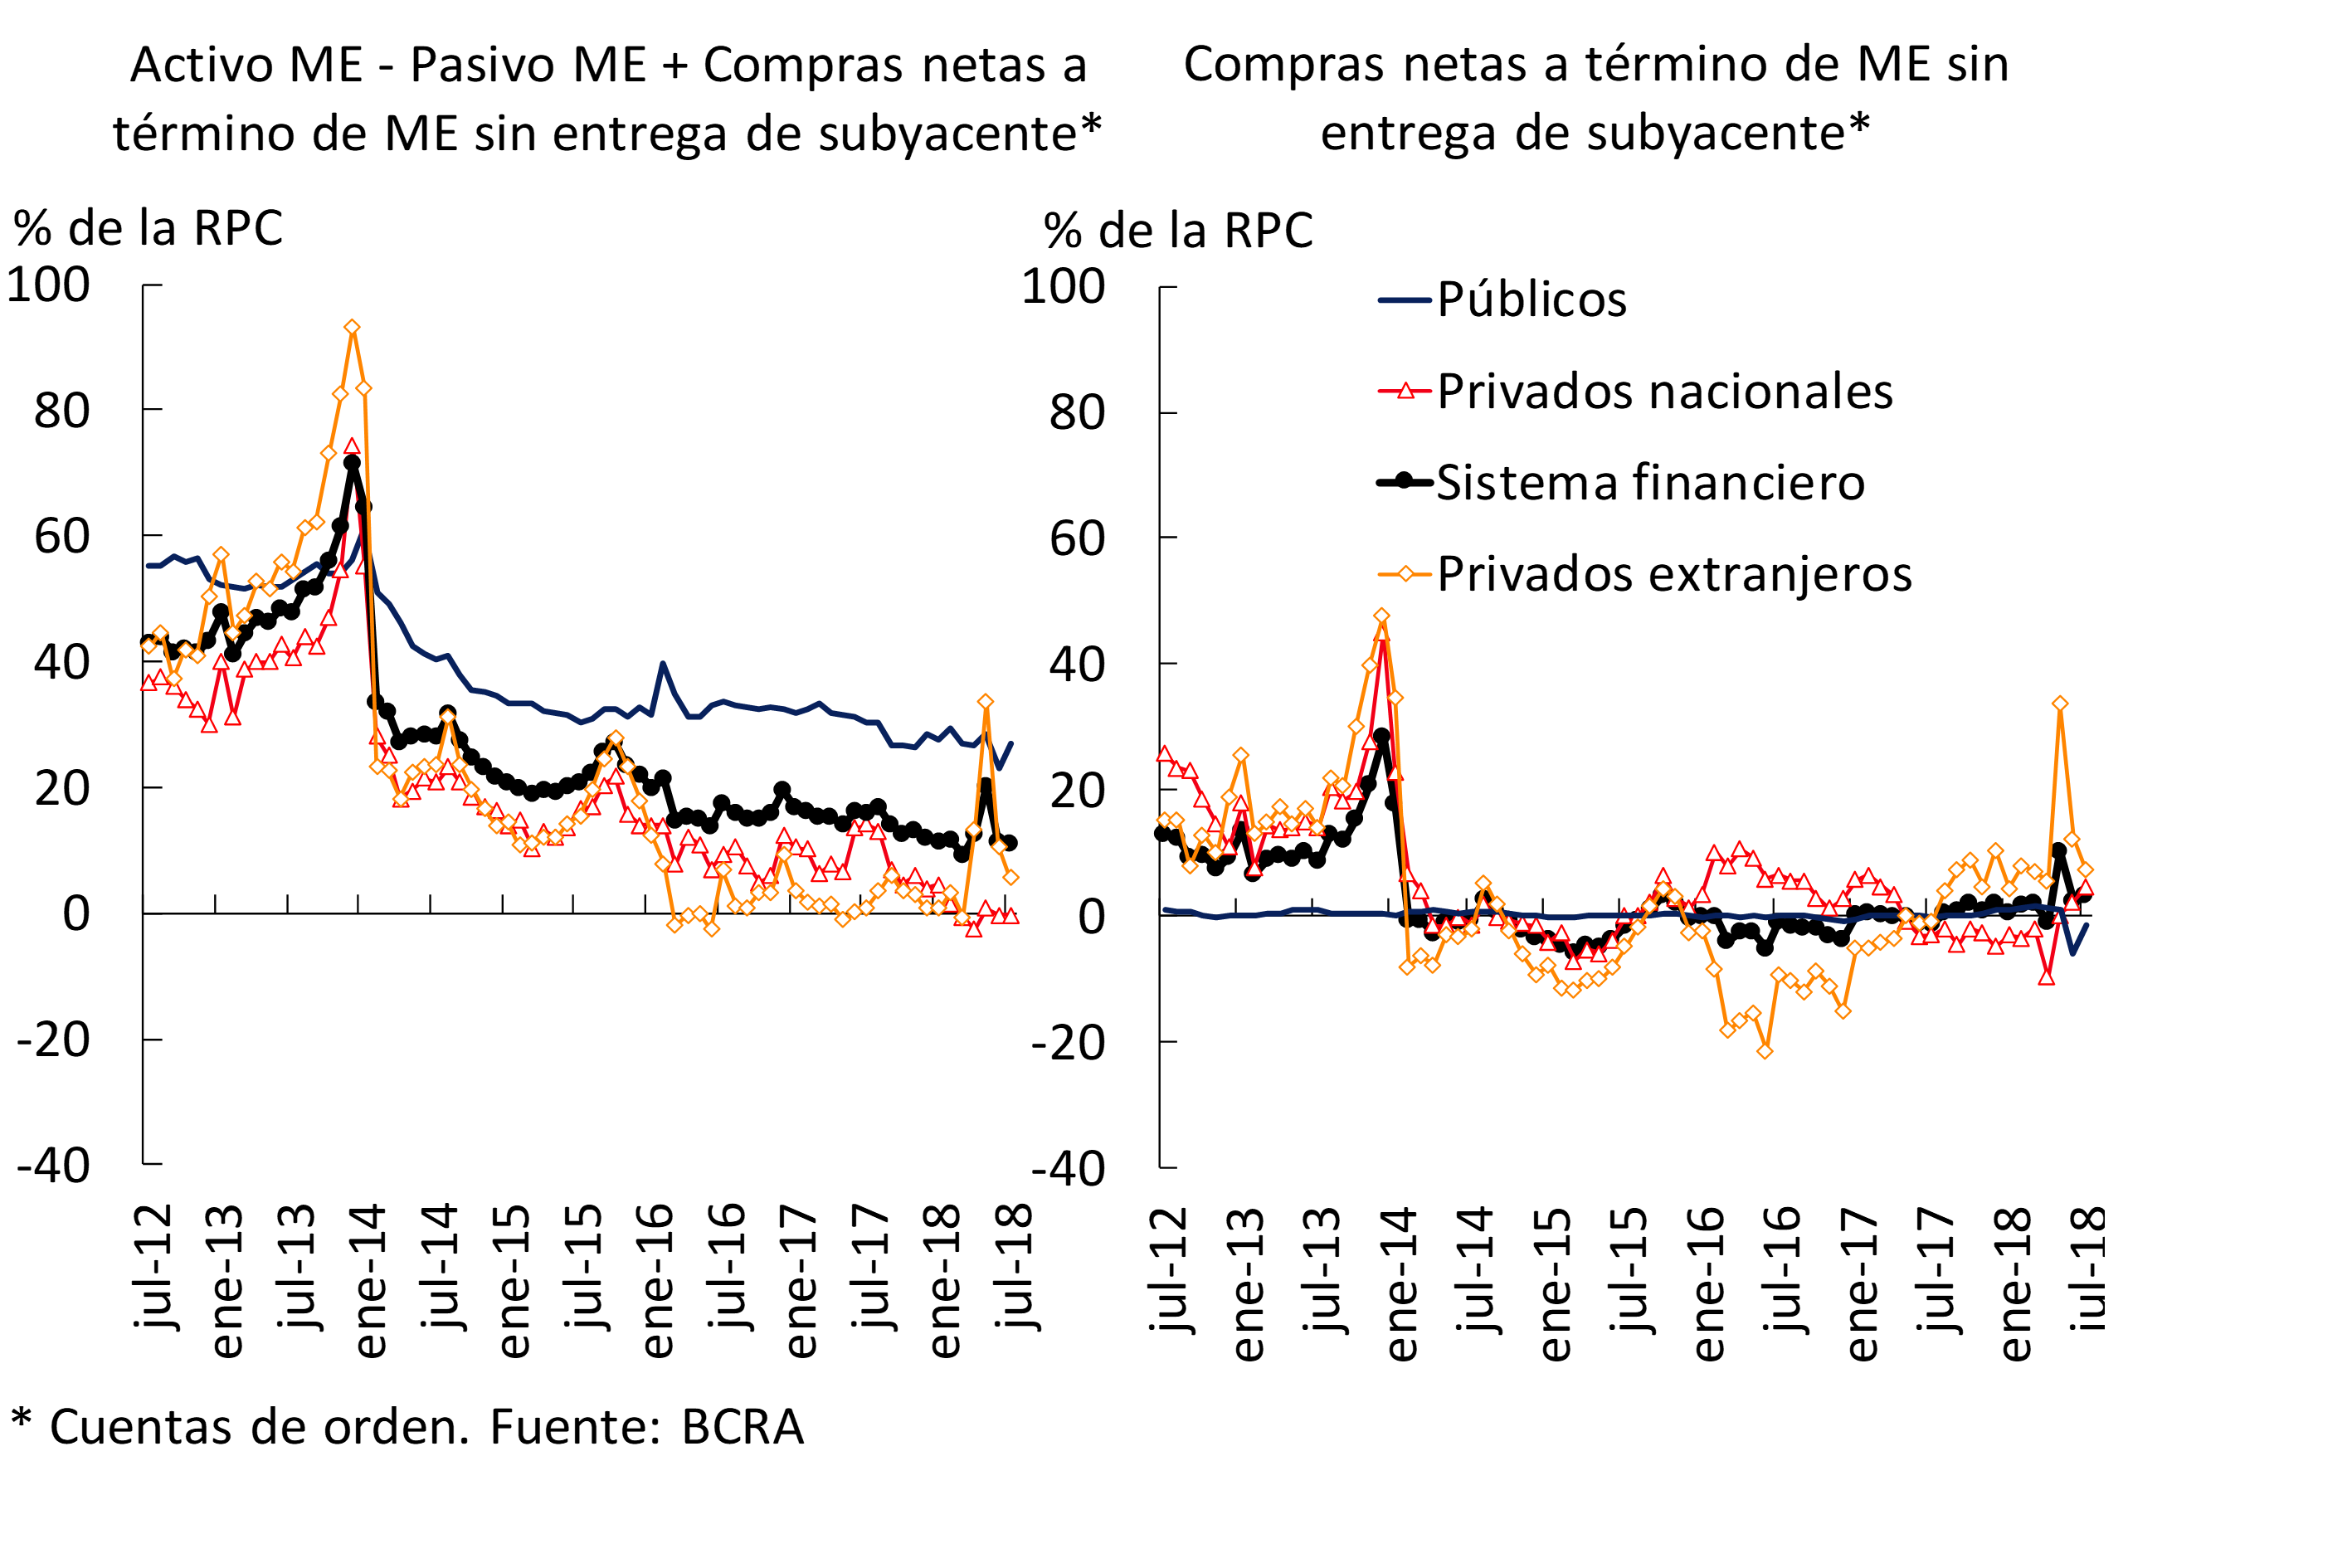
In July, the mismatch of foreign currencyassets 13 of the aggregate financial system fell slightly to 11% of the Computable Patrimonial Liability (CPR) (see Graph 4). This reduction was mainly evident in foreign private banks, due to lower net purchases of foreign currency (without delivery of underlying). In this context, it should be considered that items denominated in foreign currency maintained a relatively low importance within the aggregate balance sheet of the financial system (see Chart 5). As of July, assets in foreign currency represented 24.5% of the sector’s total assets and funding in this denomination accounted for 23.7% of the total. Among assets in foreign currency, liquidity (42.9% of the total) and loans to tradable sectors (42.5% of the total) stand out. On the foreign currency funding side, private sector deposits account for most of the total (57.2% in the case of household placements and 15.8% for companies). In this context, total deposits in foreign currency with liquid assets in this denomination are still high coverage (above 50%, see Deposits and Liquidity Section).
Figure 4 | Foreign Currency Mismatch by Bank Group
Graph 5 | Dollarization of the Balance Sheet of the Financial System – July 2018

On the other hand, the mismatch of balance sheet items that adjust for the evolution of the CER increased slightly in the month, totaling 46.4% of the PRC. Public banks mainly explain this equity mismatch.
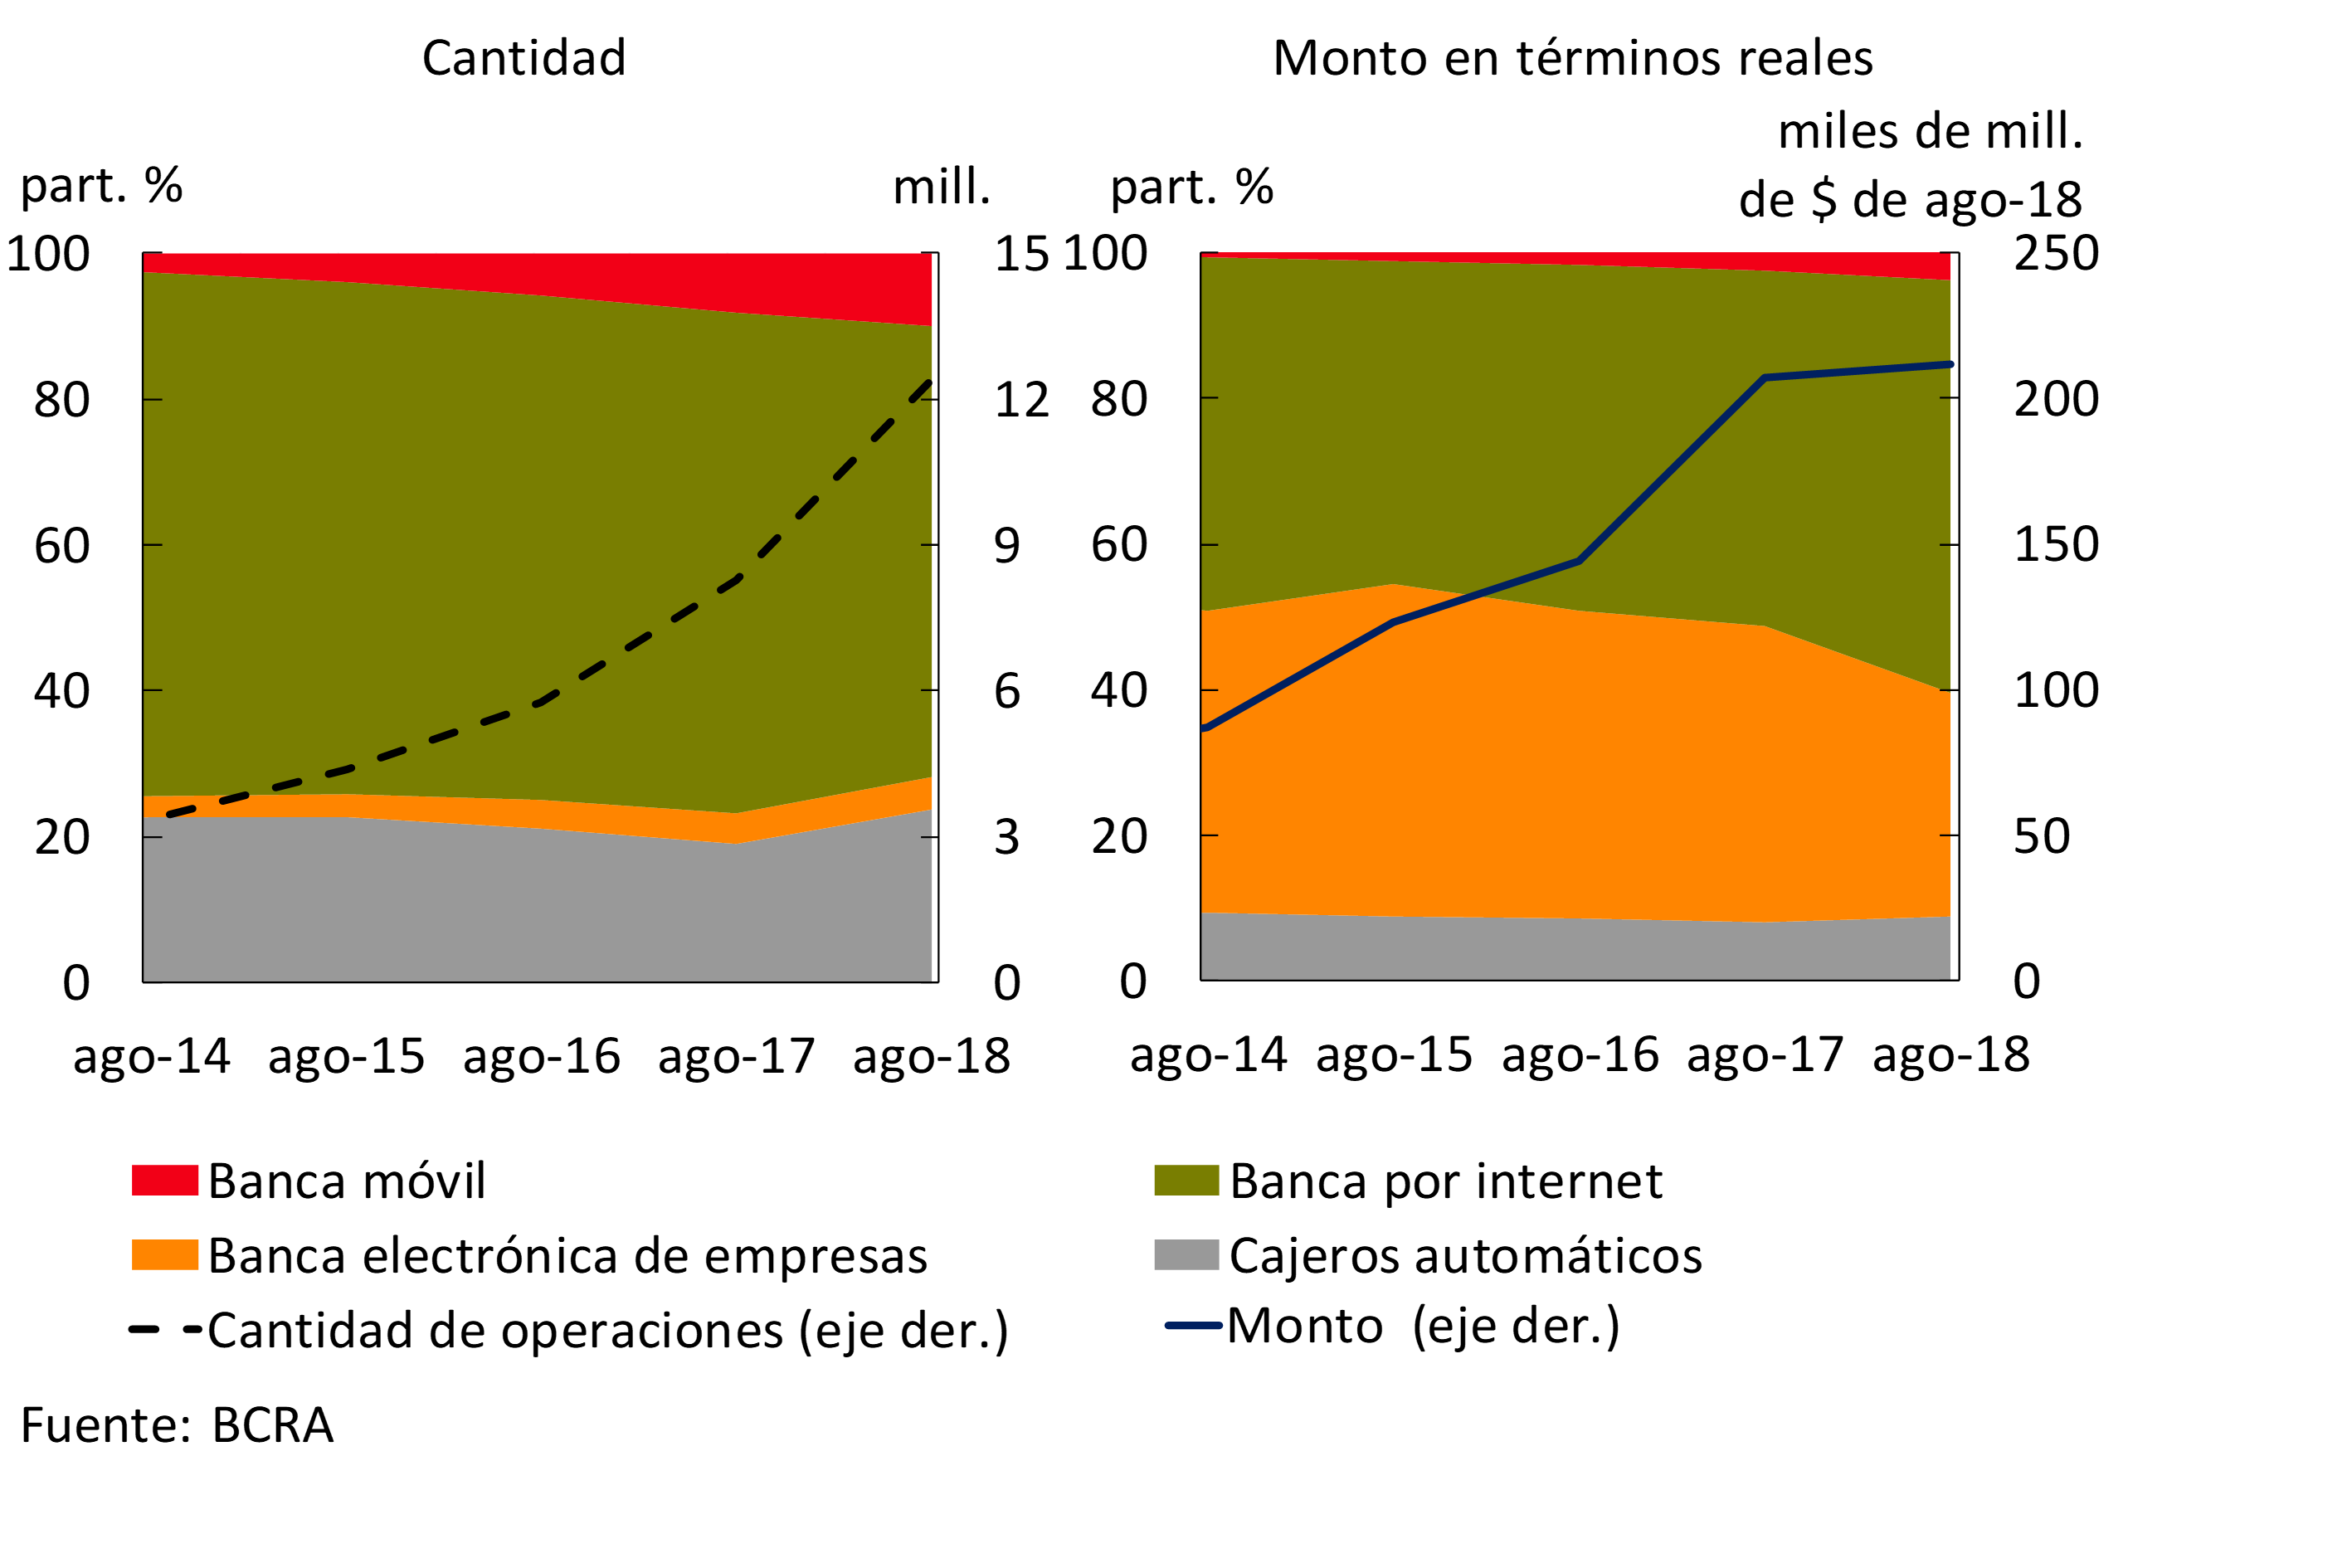
Considering the operation of the National Payment System, in August transfers between third parties continued to increase, mainly in the segment of those made through instant crediting. In the last twelve months, the number of immediate transfers made grew 50% YoY, while the value traded increased 2.2% YoY in real terms. Among the channels in which these transfers are made, the amount made via mobile banking gradually continues to gain relevance – while those corresponding to internet banking fall – although they still only represent 10% of the total (see Graph 6). In terms of the amounts operated in this type of transfers, they are mostly made through internet banking and business banking.
Graph 6 | Immediate Channel Transfers of Funds
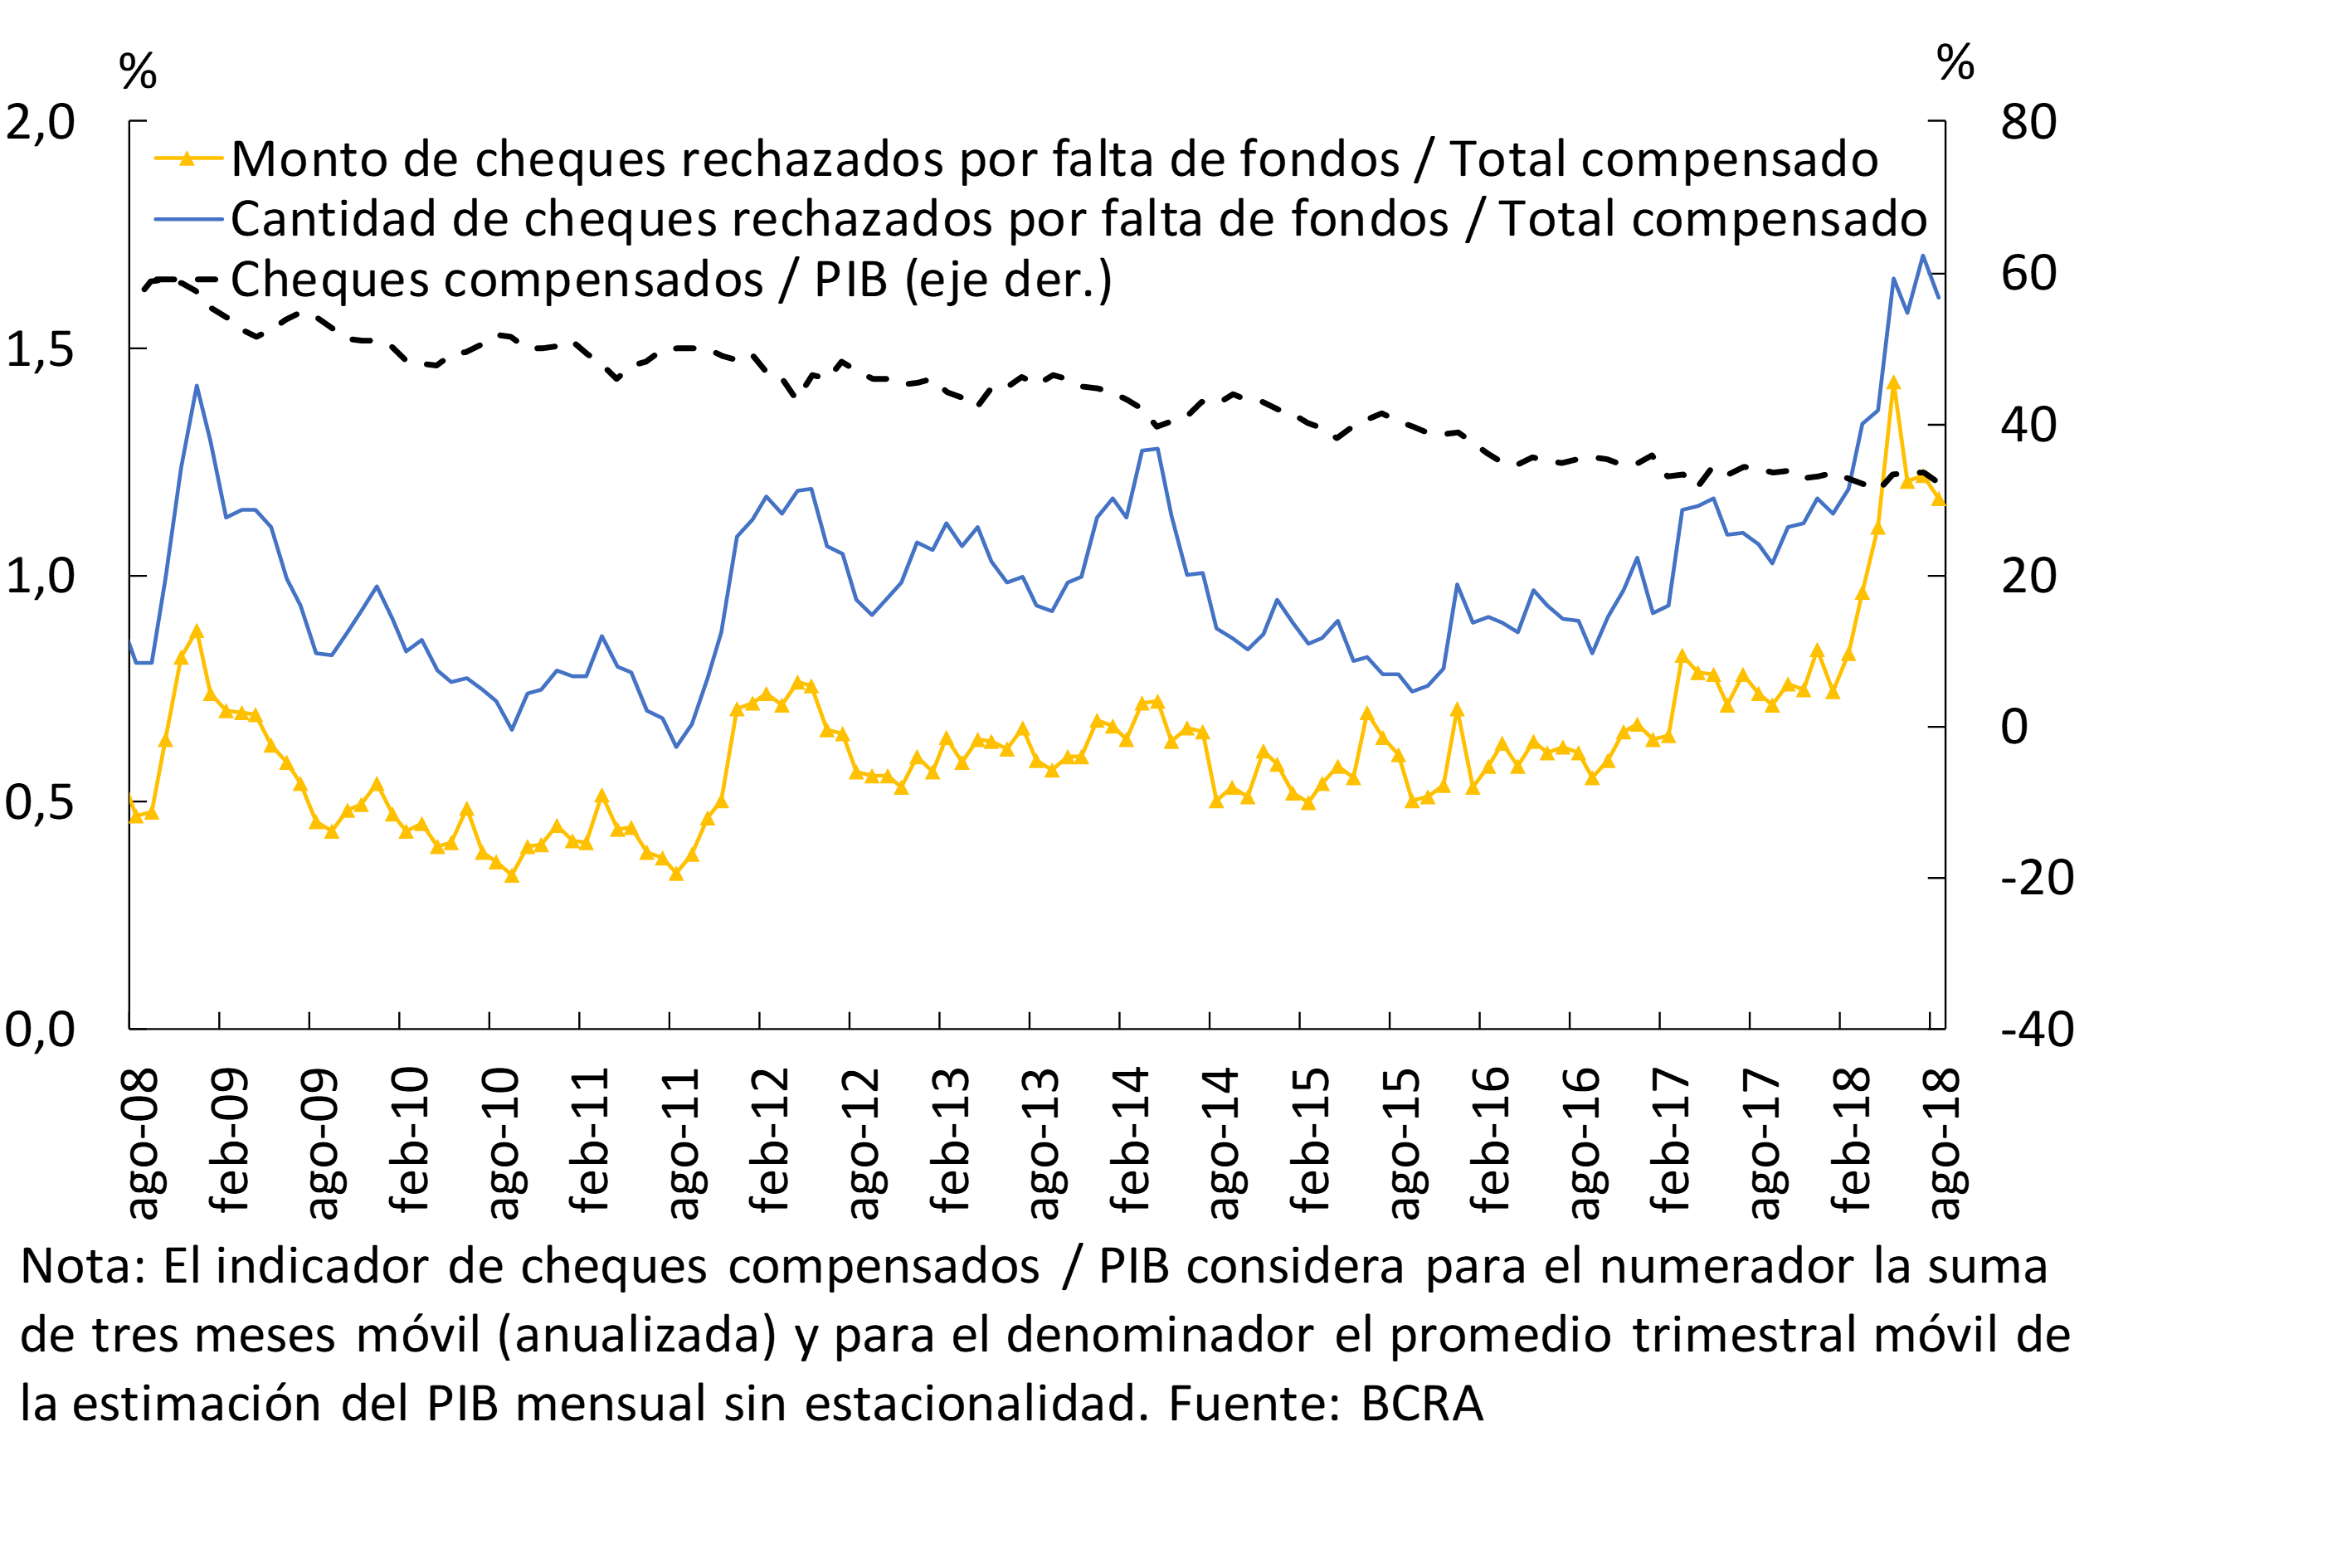
The volume of cleared checks continued to decline. The amount and number of checks issued by clearing house decreased in August – the latest information available – both compared to last month and year-on-year. Thus, the amount of documents cleared was equivalent to 32% of GDP, almost 2 p.p. lower than in the same period of 2017 and 24 p.p. below the level of 10 years ago (see Graph 7). In this context, the rejection of checks due to lack of funds in terms of the total compensated was slightly reduced compared to July levels.
Figure 7 | Cleared and Bounced Checks
III. Deposits and liquidity
In July, the balance of total deposits in national currency increased slightly in real terms (+0.3%), driven by public sector deposits, which grew 9.8% adjusting for inflation14. In turn, private sector deposits in pesos fell 3.6% in real terms in the period, with a monthly decrease in demand balances (-7.7% in real terms) that more than offset the increase in time placements (+1.3% adjusting for inflation). For their part, total deposits arranged in foreign currency increased 0.5% in July – in currency of origin – driven by private sector placements, which increased 2.8%.
Considering the last twelve months, total deposits in pesos grew 11.3% adjusting for inflation (see Chart 8), a dynamic driven by public sector placements. Meanwhile, private sector deposits in local currency fell slightly in a year-on-year comparison (-1.8% real y.o.y.). On the other hand, total placements in foreign currency increased 6.8% year-on-year – in source currency – with an increase of 17.4% y.o.y. in those of the private sector.
Figure 8 | Total Private Sector Deposits – Var. A.I. of the balance in real terms

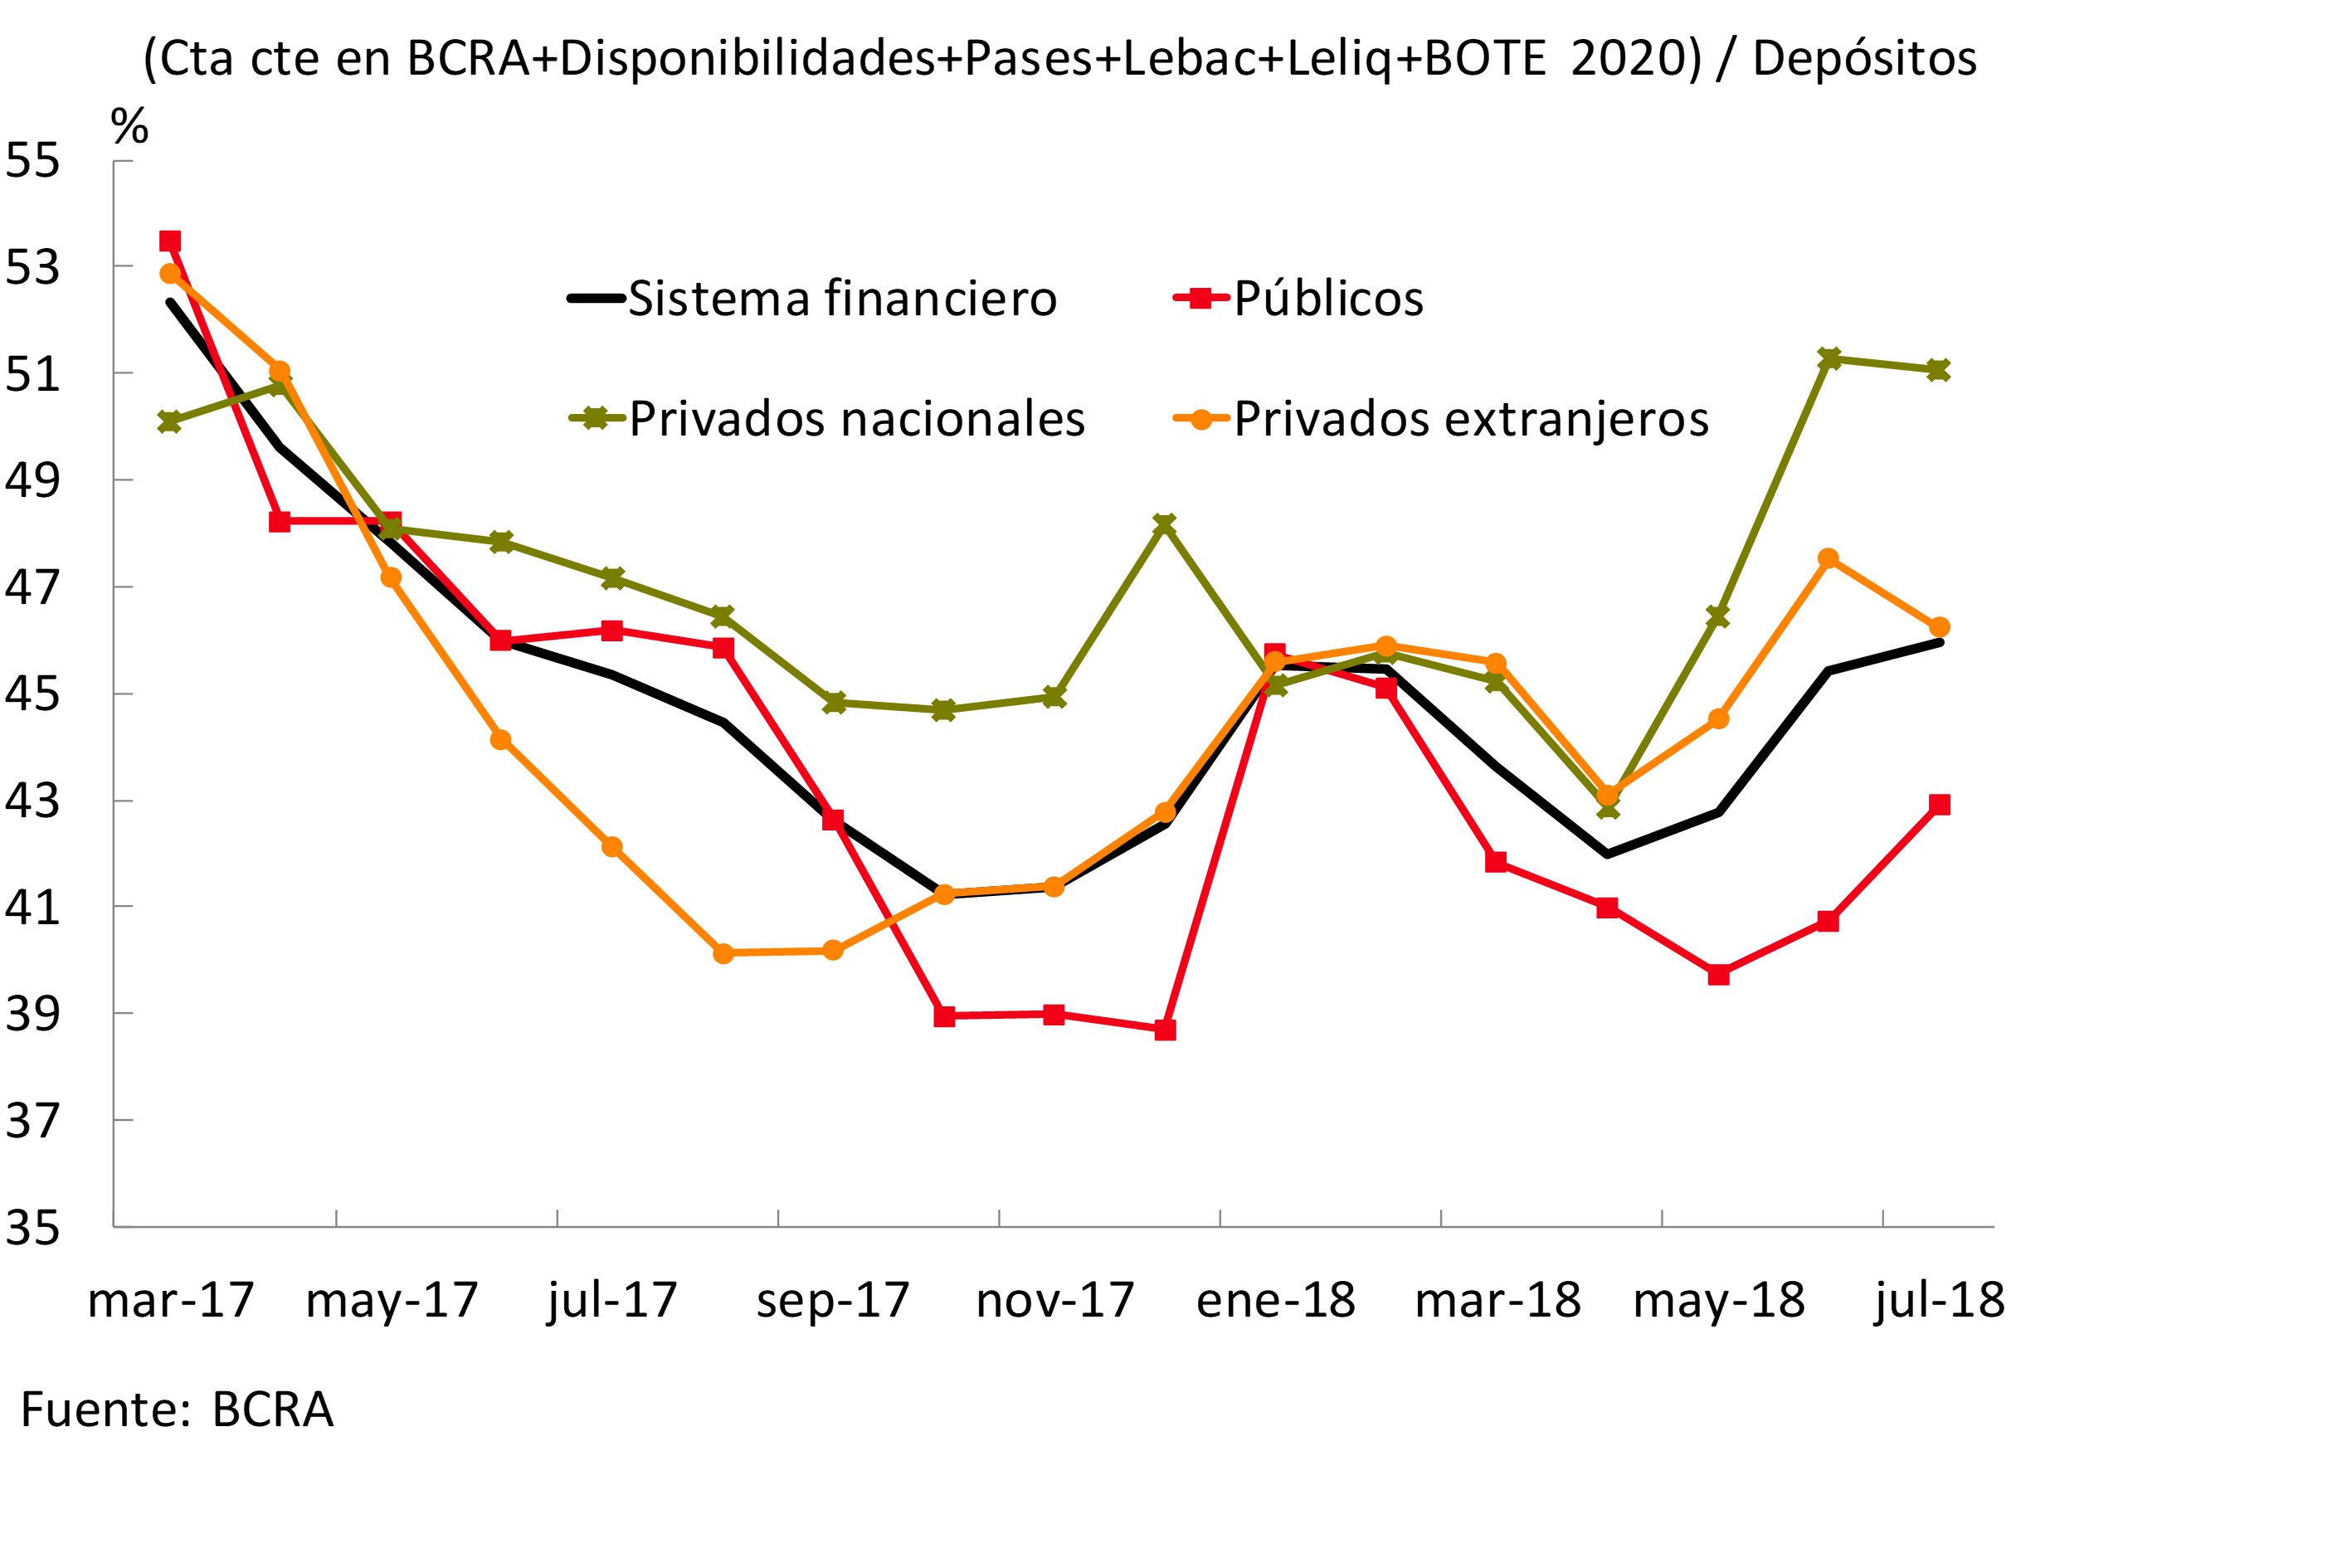
In July, two reserve requirement increases came into effect, one of which can be integrated through National Fixed-Rate Treasury Bonds due in 2020 (BOTE 2020). In this context, the ample liquidity of all financial institutions – integration of minimum cash, BCRA instruments and availabilities, in domestic and foreign currency – represented 46% of total deposits in July (43.3% in peso items), increasing 0.5 p.p. (1.5 p.p. for the segment in national currency) compared to last month (see Chart 9). The increase in liquidity was explained by the higher holdings of LELIQ and BOTE 202015, and led by public banks. On the other hand, the strictest liquidity indicator – which includes only the integration of minimum cash and availabilities, in domestic and foreign currency – fell 0.7 p.p. of deposits in the month to around 26.5% (53.2% when considering only items in foreign currency). In the last twelve months, bank liquidity did not show any variations in magnitude: it increased 0.6 p.p. of deposits for the broad indicator and decreased 0.3 p.p. of deposits for the strict indicator.
Figure 9 | Liquidity by Banking Group
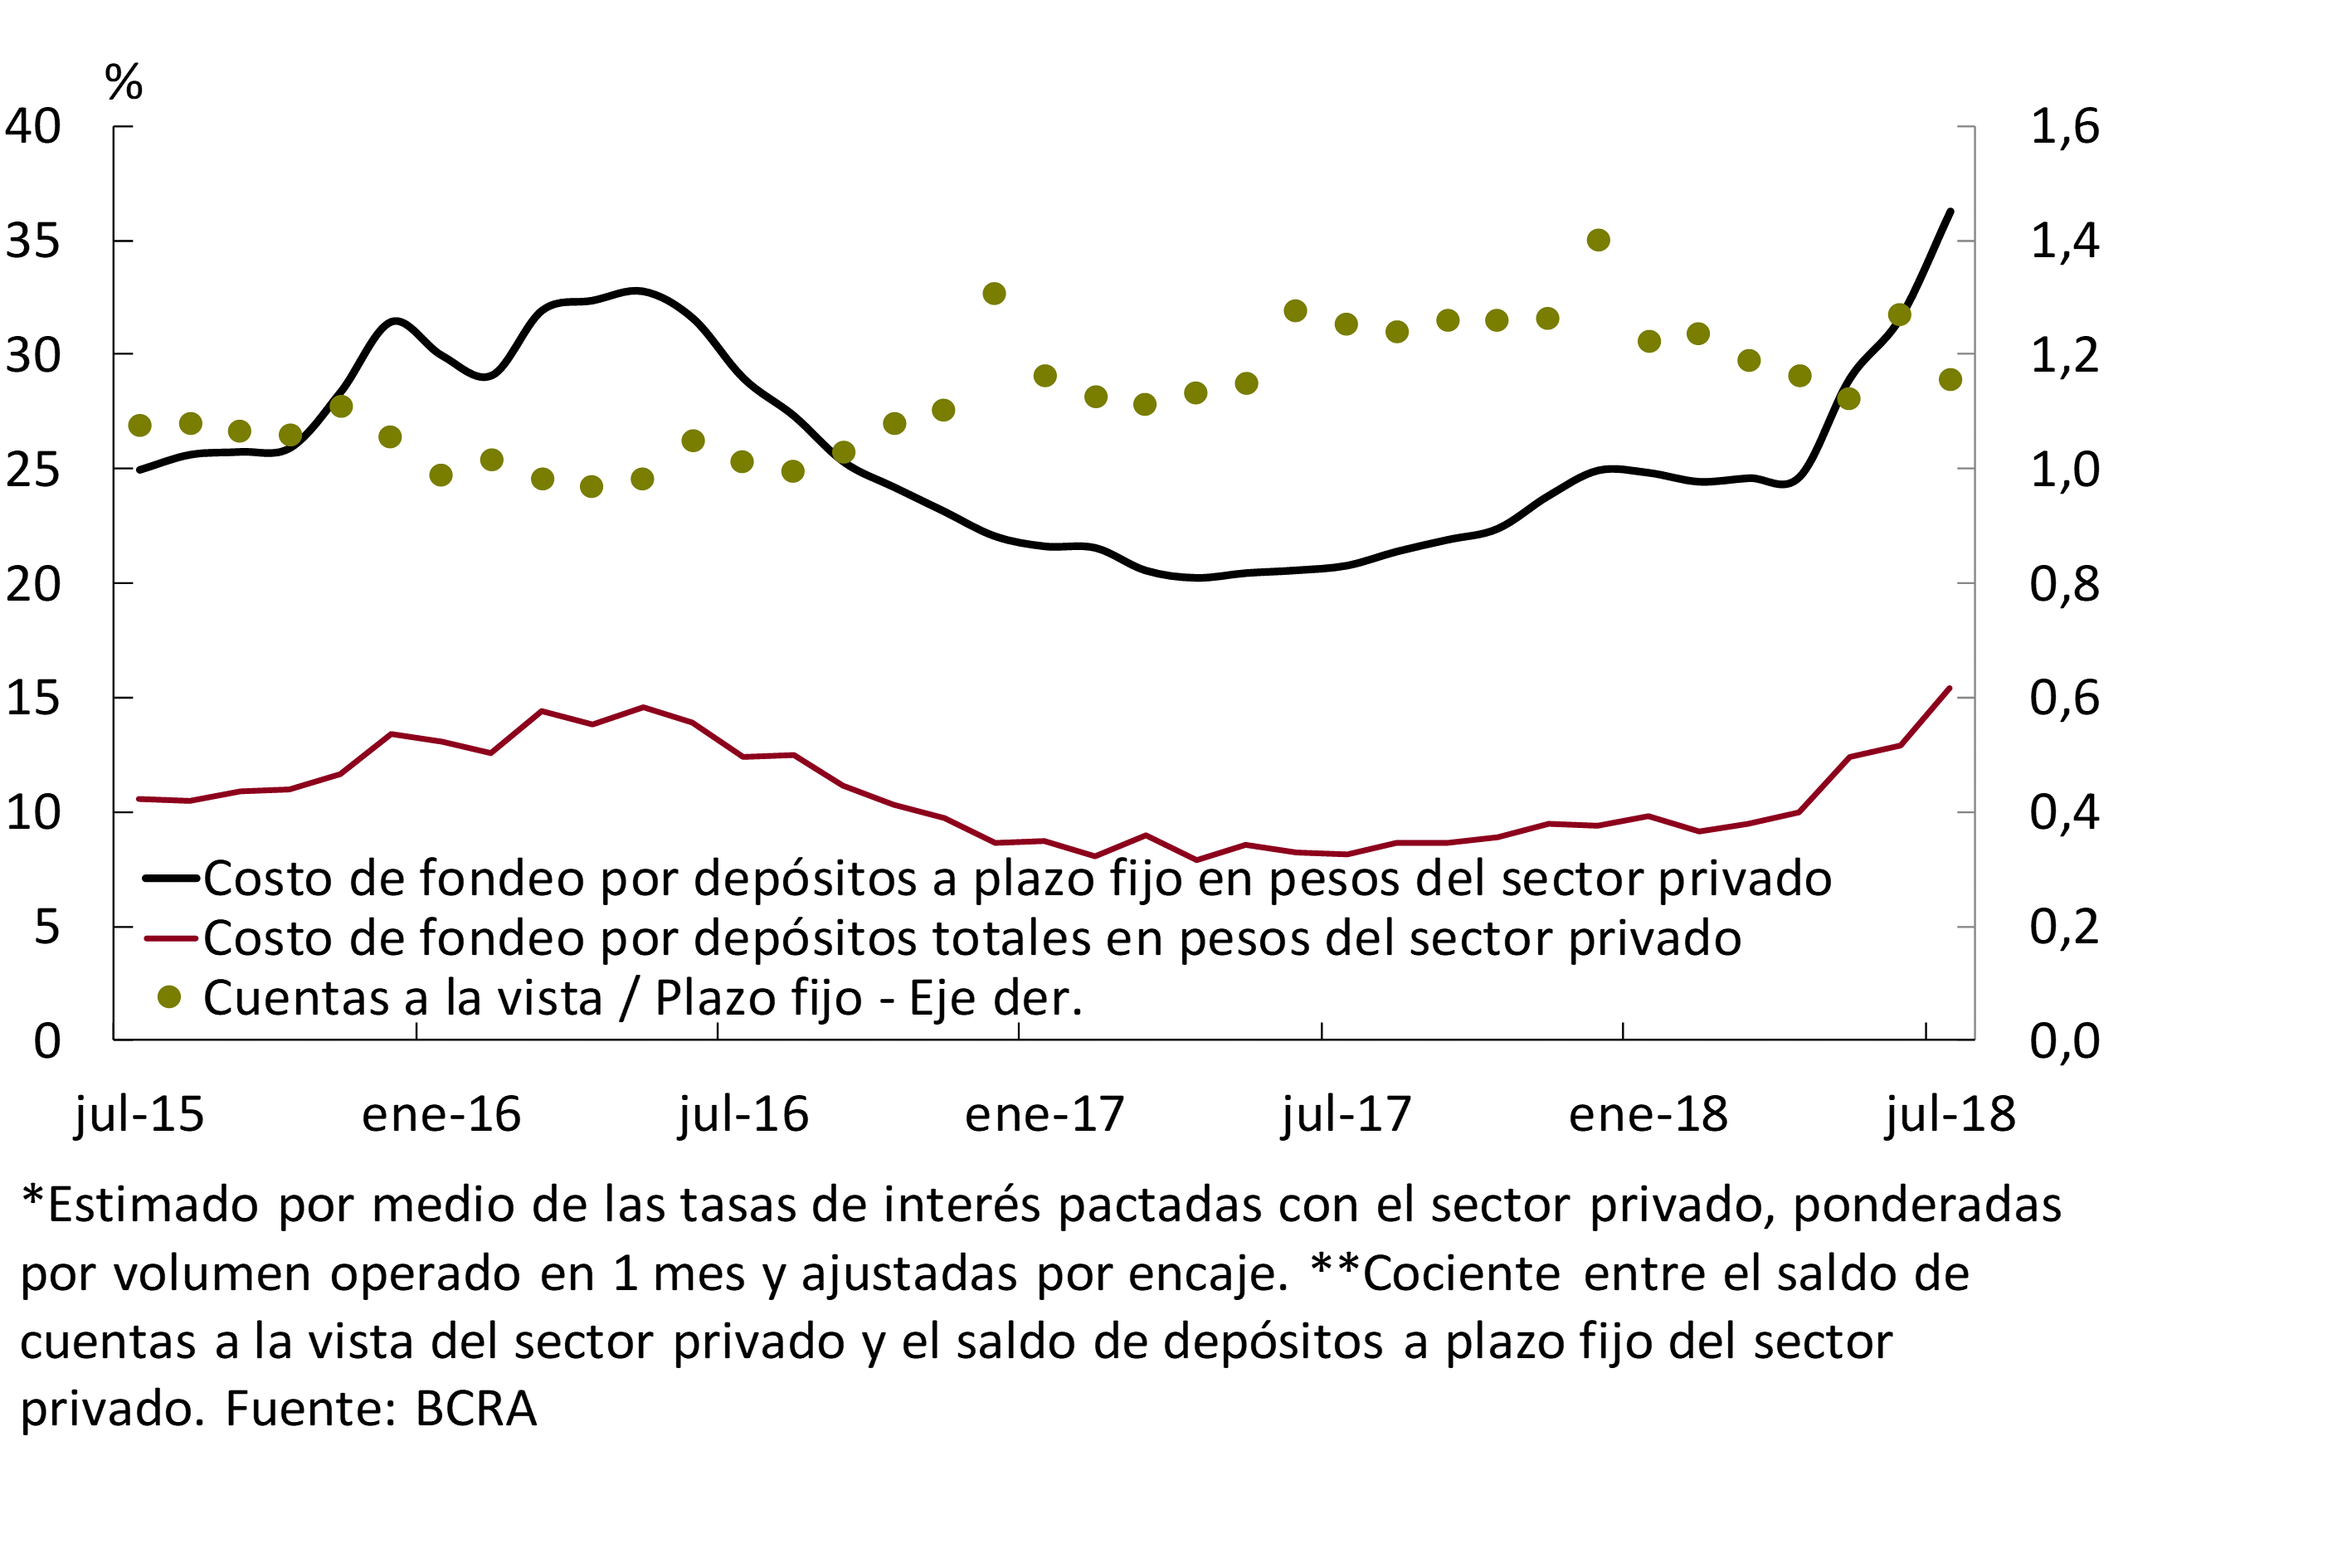
In line with the trajectory of the interest rate of the instruments that banks operate with the BCRA and within the framework of the increase in interest-bearing reserve requirements, the interest rate that banks offered to the private sector for fixed-term deposits in pesos increased by 4.1 p.p. in July. In this context, and given the greater weighting of term placements in total private sector deposits in pesos, the estimated cost of funding for private sector deposits in national currency increased compared to June (see Chart 10).
Figure 10 | Estimated Funding Cost for Private Sector Deposits in Pesos* and Ratio between Demand and Time Deposits**
IV. Financing
In July, the balance of bank credit in pesos to the private sector decreased 1.7% in real terms compared to the previous month (+1.3% nominal). This fall was widespread among all groups of financial institutions and in almost all credit lines (except for advances). For its part, the balance of loans in foreign currency remained unchanged in magnitude in the month (-0.5%16). Within this segment, there were decreases in the balance of documents, which were offset by increases in the rest of the lines. Thus, in the month the total balance (both in national and foreign currency) of financing to the private sector expressed in pesos fell 3.3% in real terms.
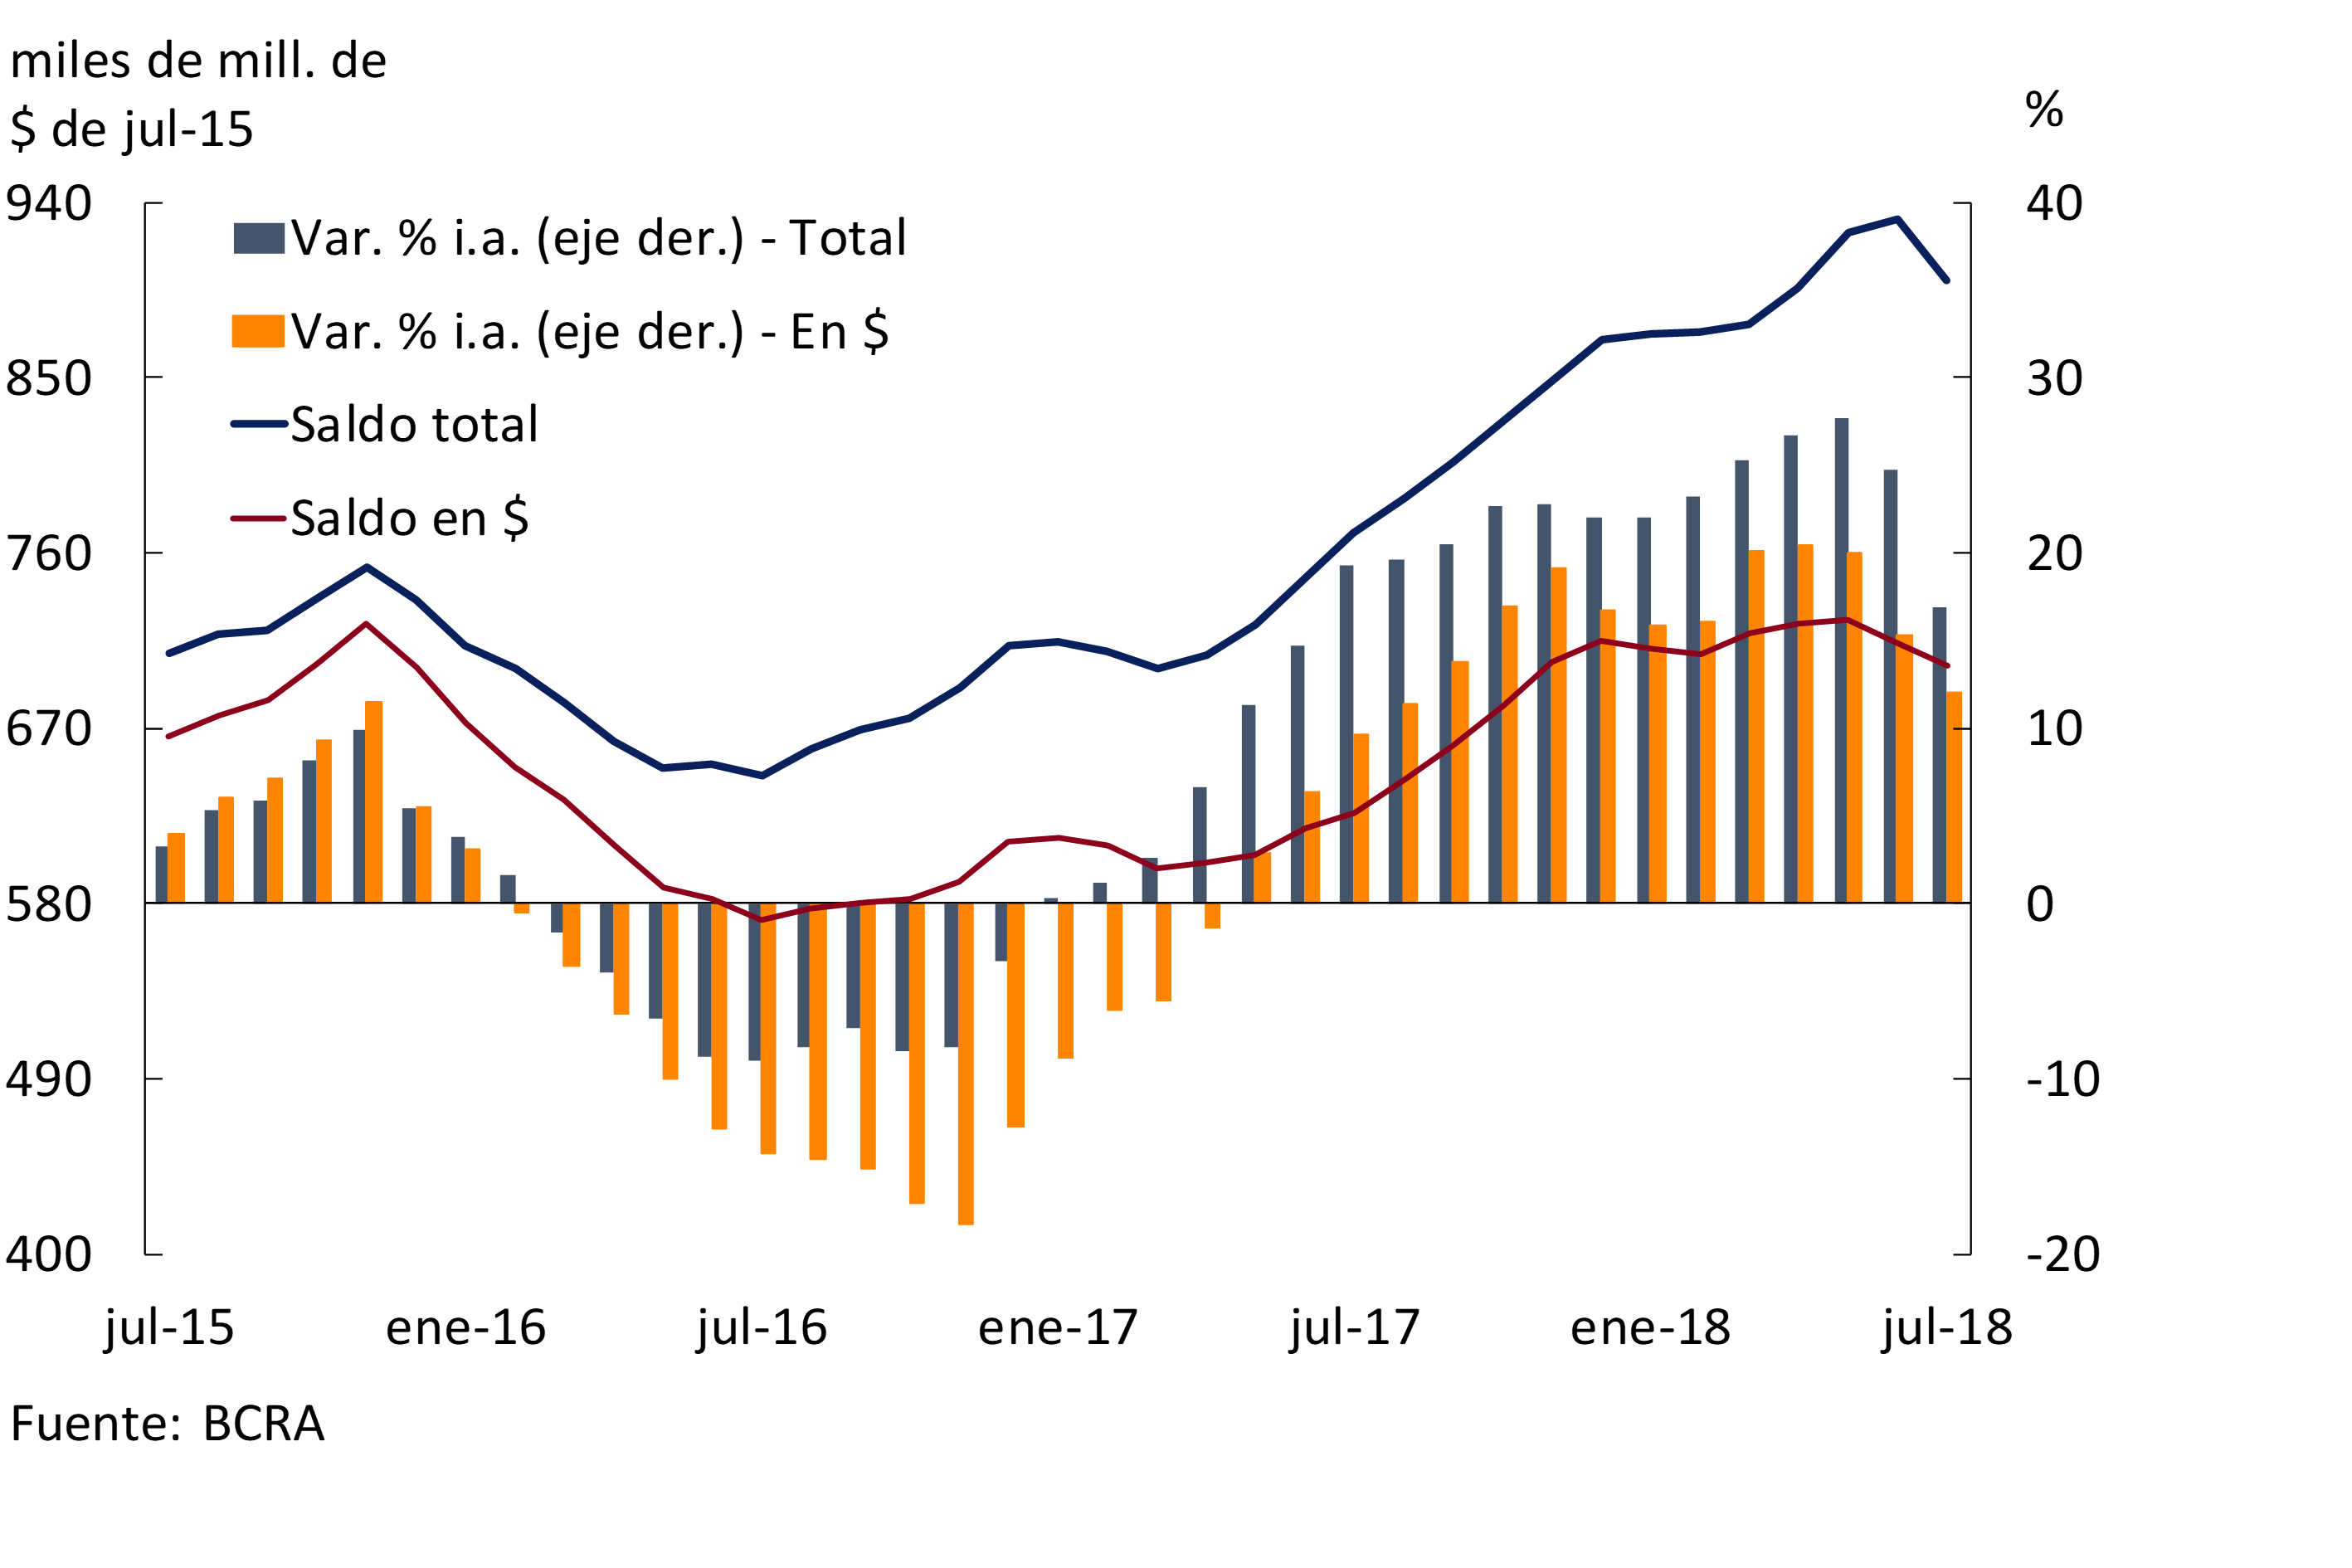
Compared to July 2017, credit in pesos to companies and households accumulated an increase of 12% when adjusted for inflation (see Graph 11). Mortgage loans continued to show the highest relative real year-on-year increase. On the other hand, financing in foreign currency accumulated a 17.4% YoY.17 increase, driven mainly by documents. Thus, in the period, the balance of total financing (in domestic and foreign currency) to the private sector accumulated a growth of 16.9% YoY when adjusted for inflation.
Figure 11 | Total Credit Balance to the Private Sector in Real Terms
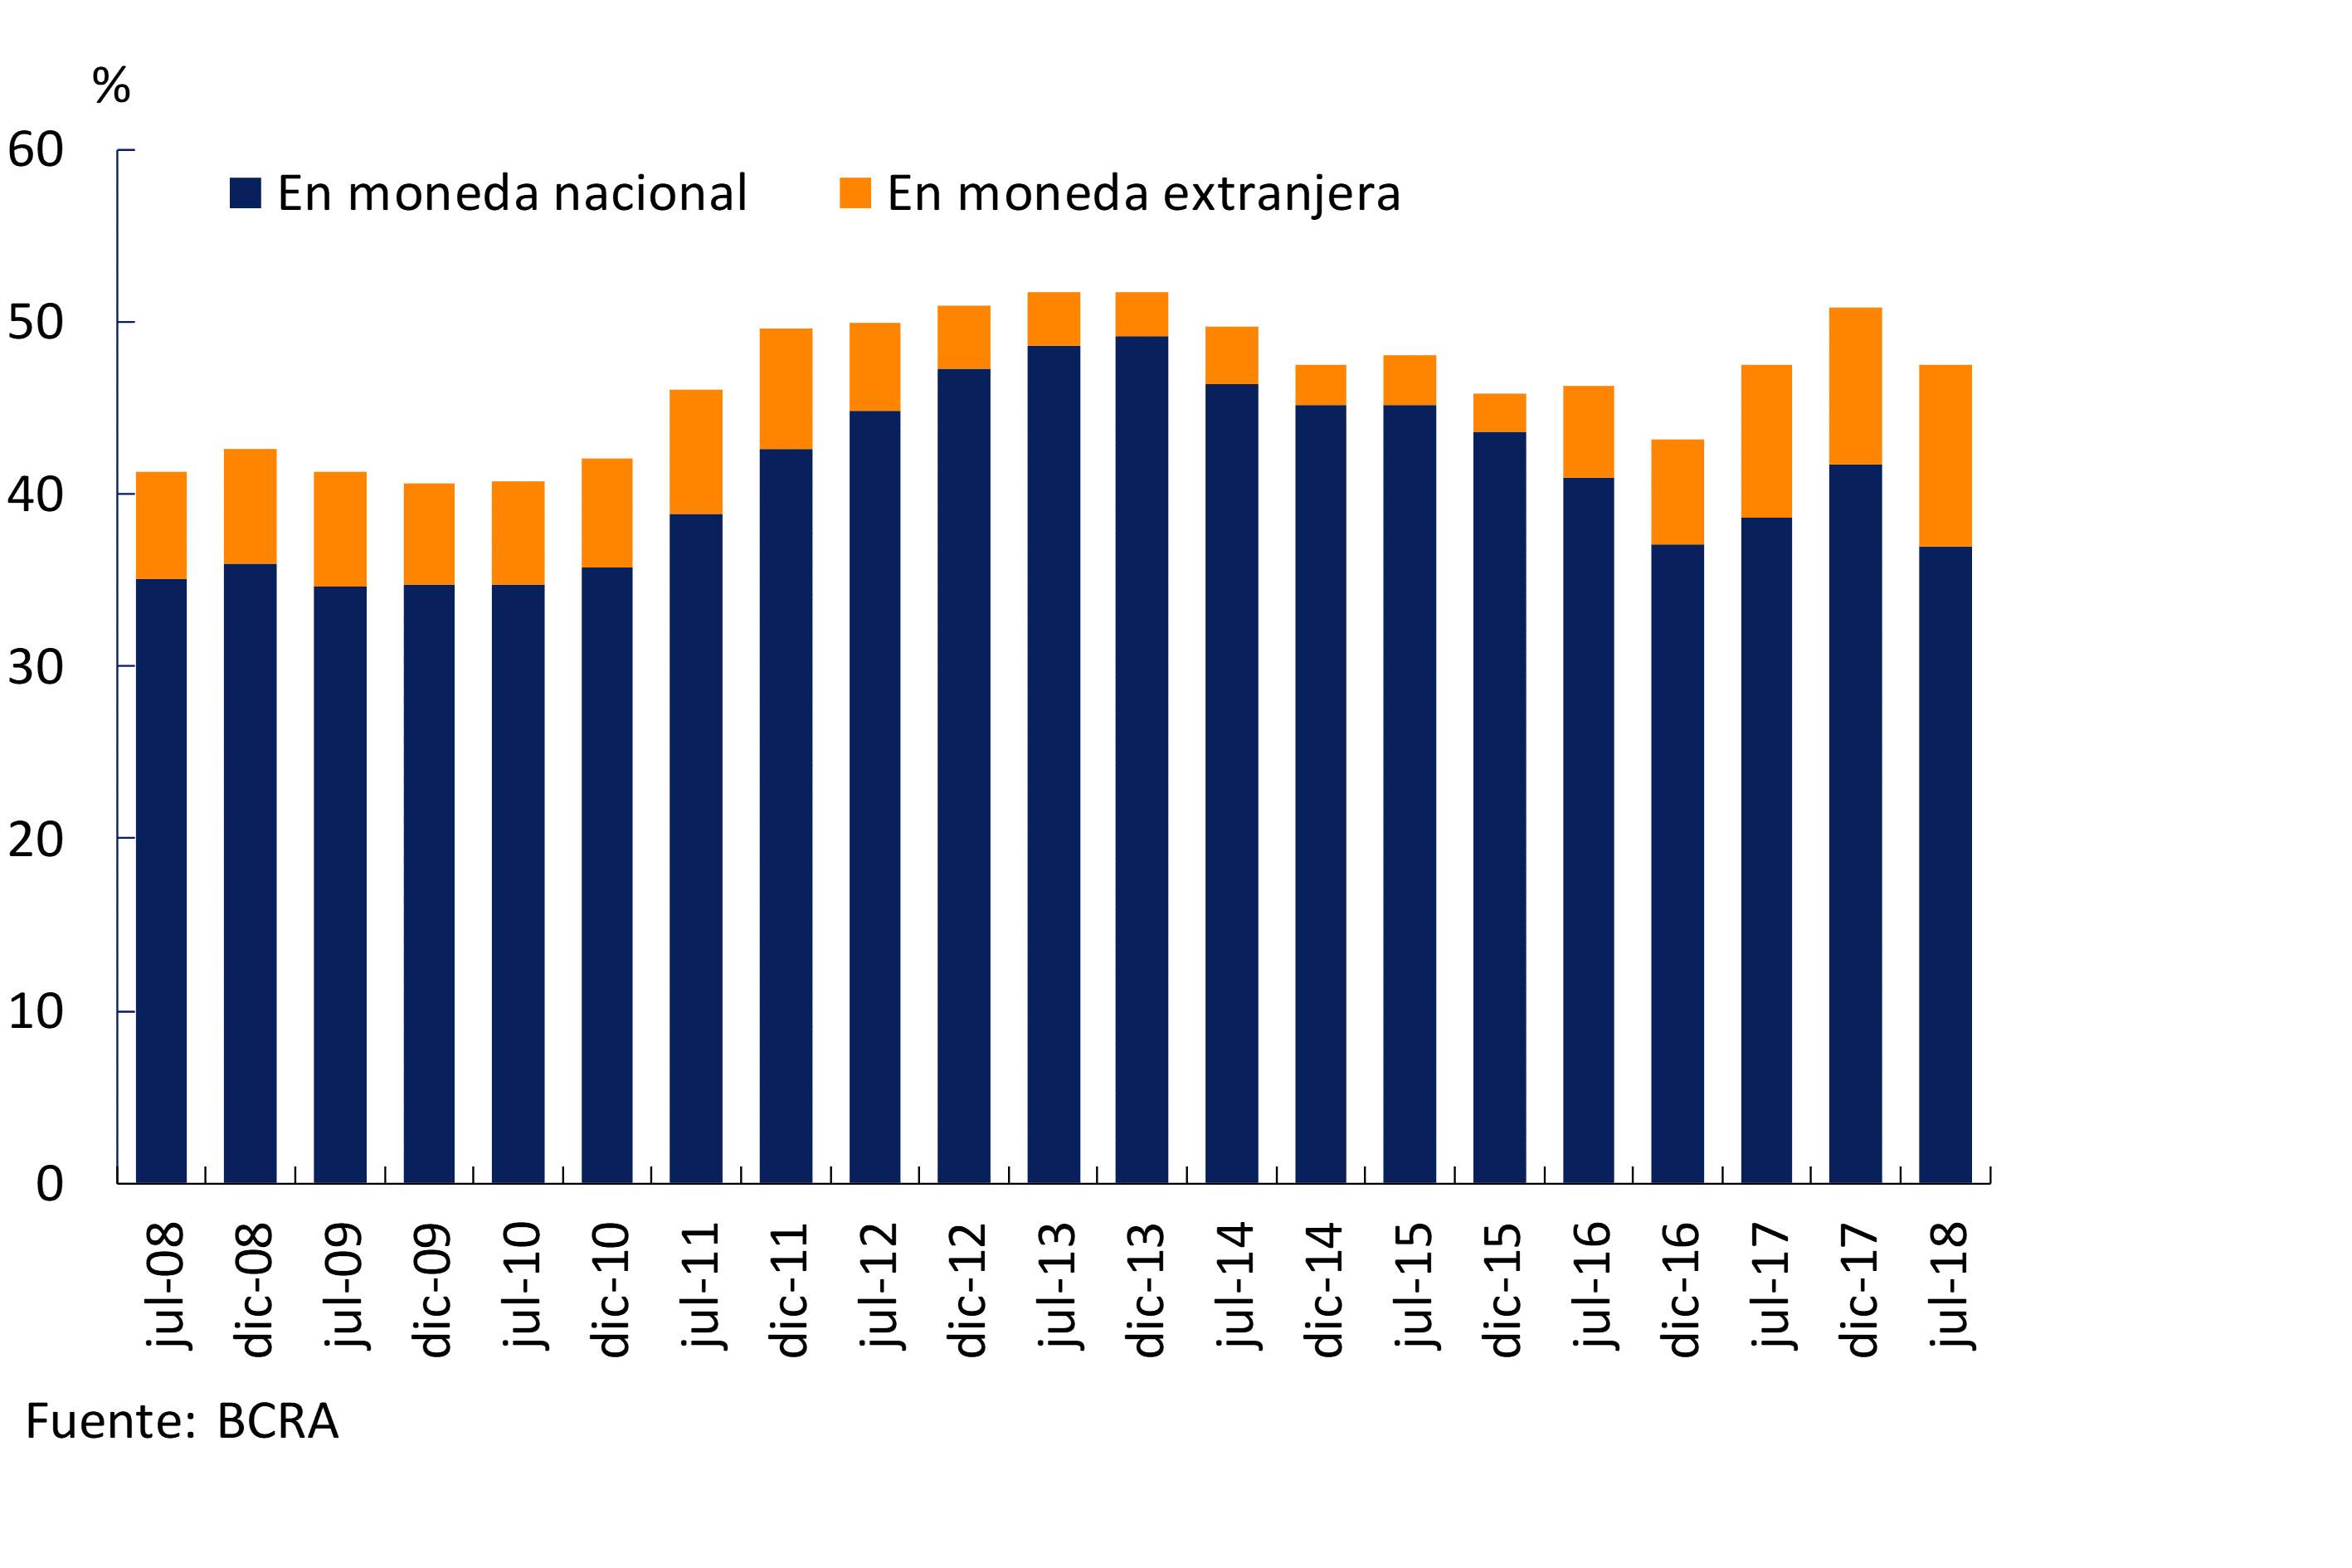
In this context, so far this year, loans to the private sector showed a slight reduction in their share of the total assets of the financial system (see Chart 12). In July, the total credit balance to companies and households represented 47.4% of net assets, 3.3 p.p. below the value at the end of 2017 and in line with the record of a year ago. However, this level is above the average of the last ten years.
Figure 12 |Total Credit Balance to the Private Sector – In terms of net assets
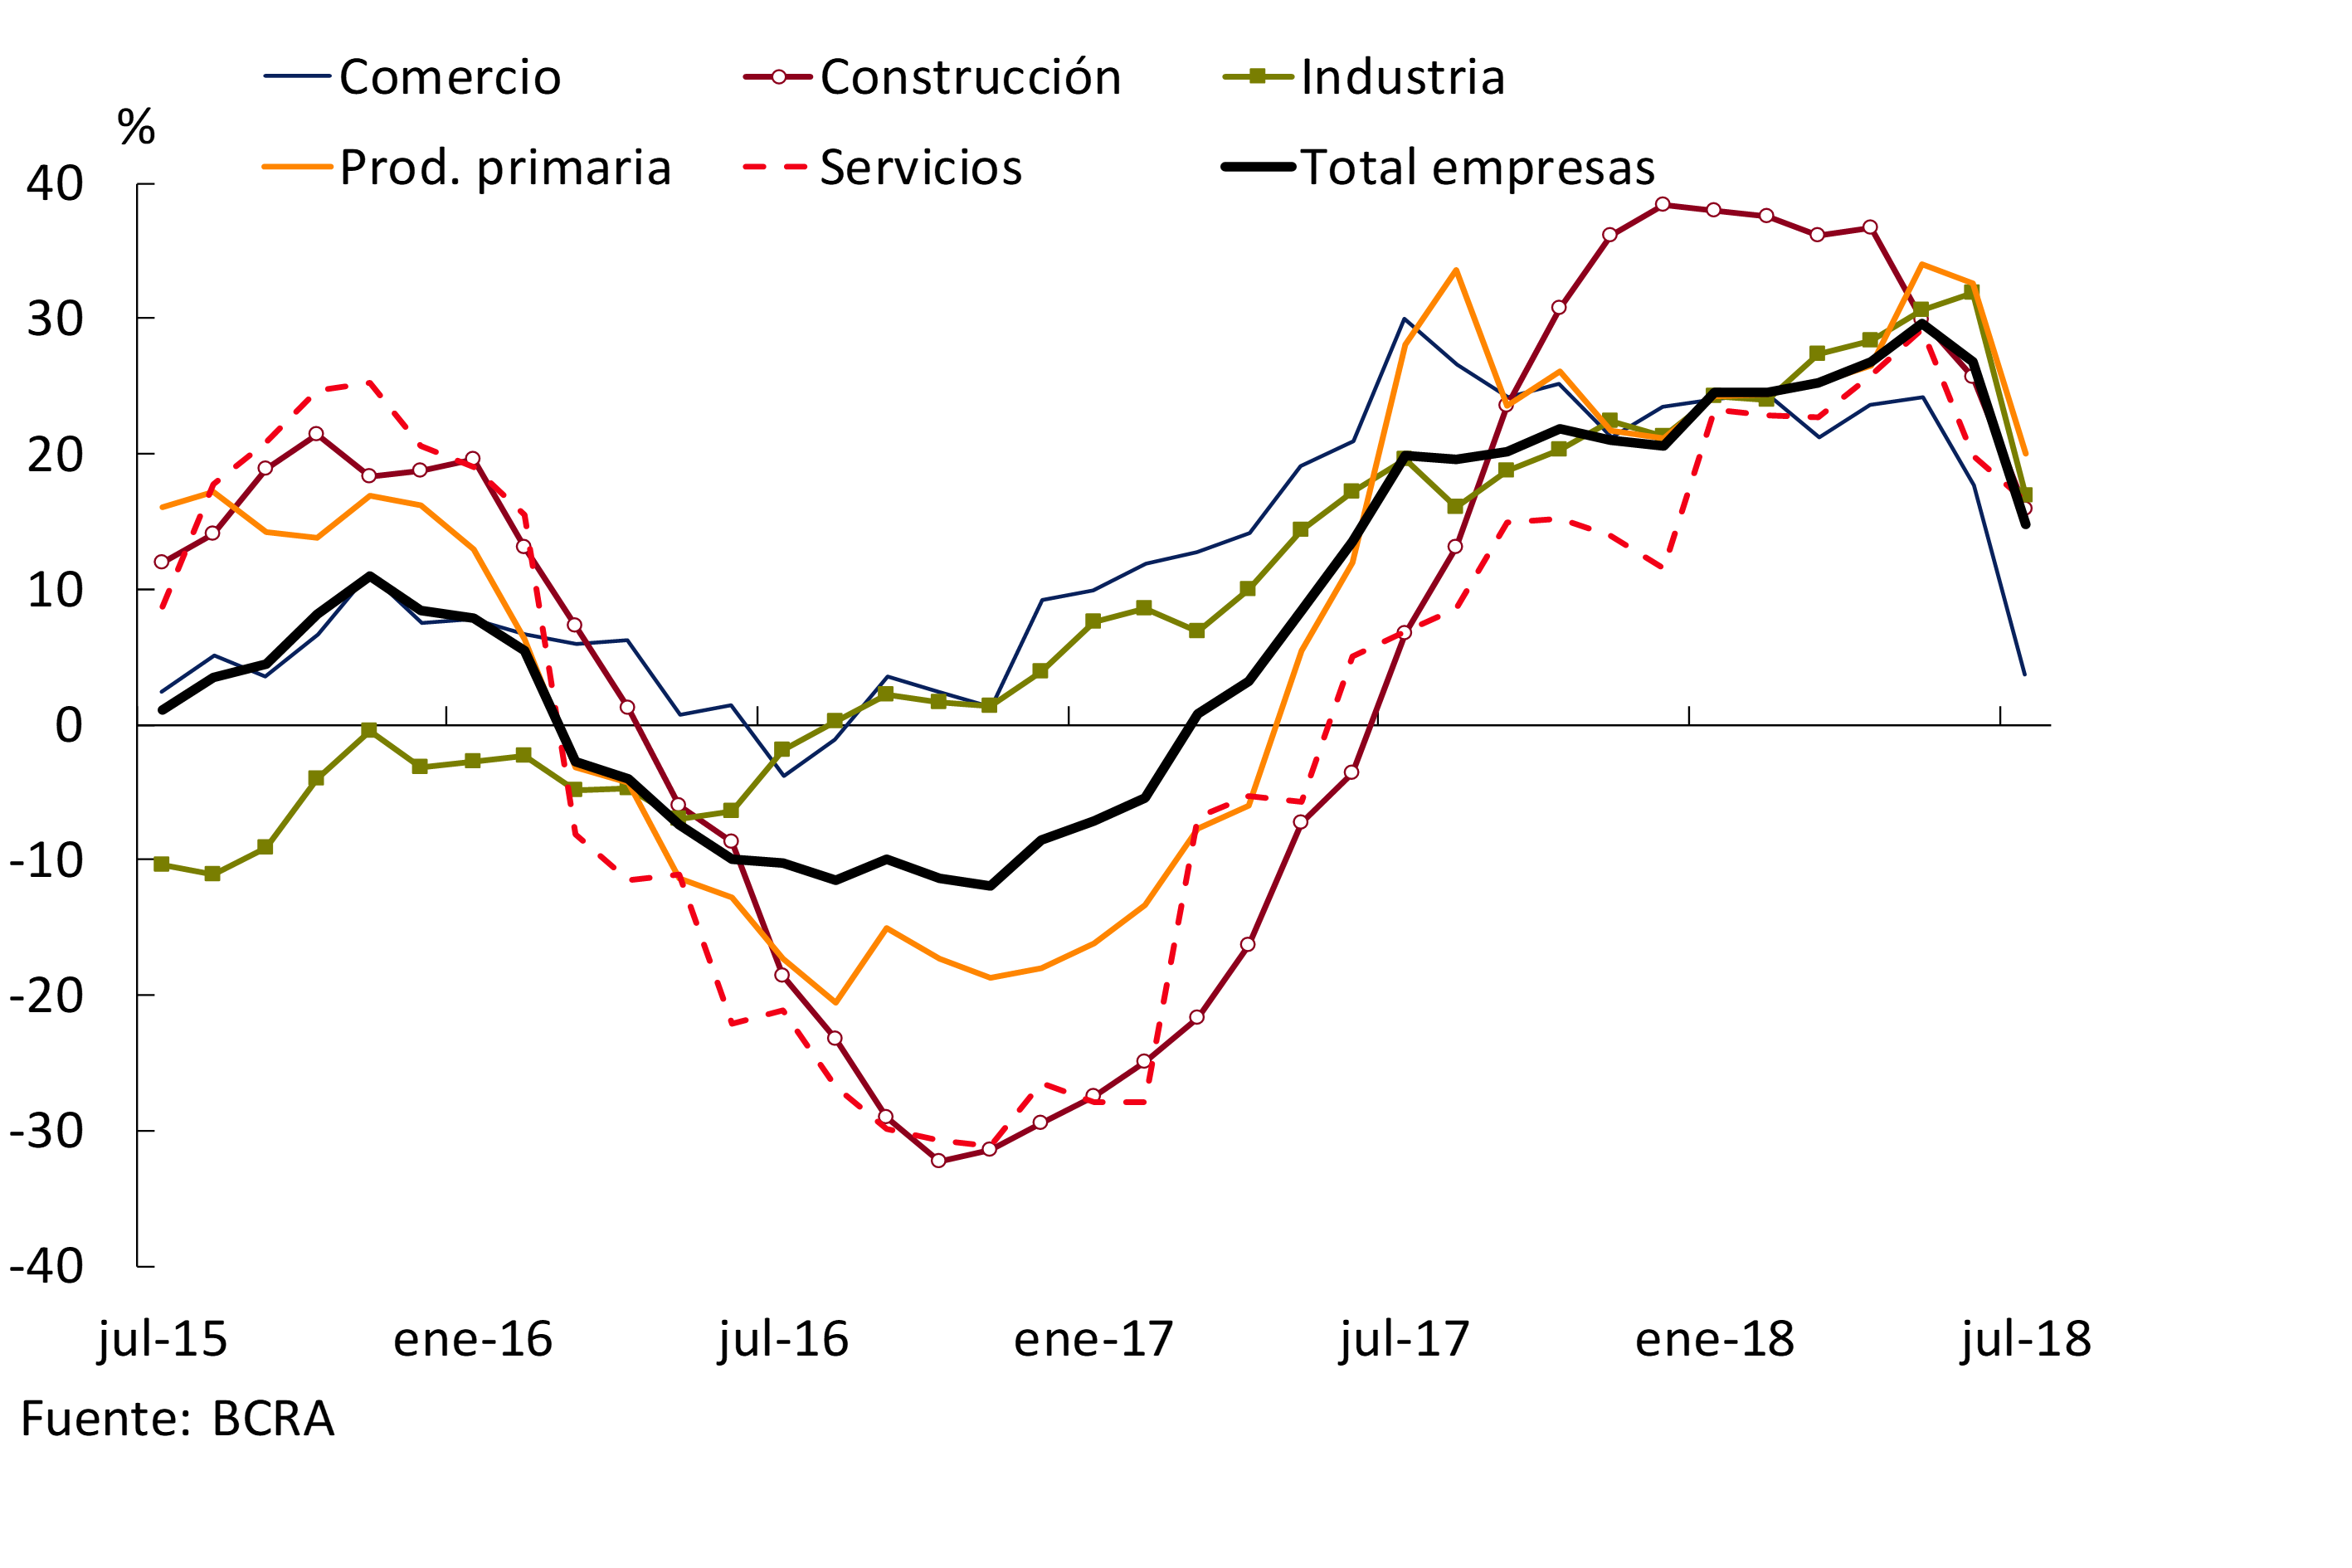
In July, the total credit balance to companies18 fell by 5% when adjusted for inflation compared to June. The monthly fall was widespread among the different economic sectors (mainly the decrease in commercial loans) and in all groups of financial institutions. In a year-on-year comparison, financing to firms increased 14.7% in real terms, below the levels of previous months (see Chart 13). The year-on-year performance was mainly led by public banks, followed by domestic private banks.
Figure 13 | Total Credit Balance to Companies – Real Year-on-Year % Change
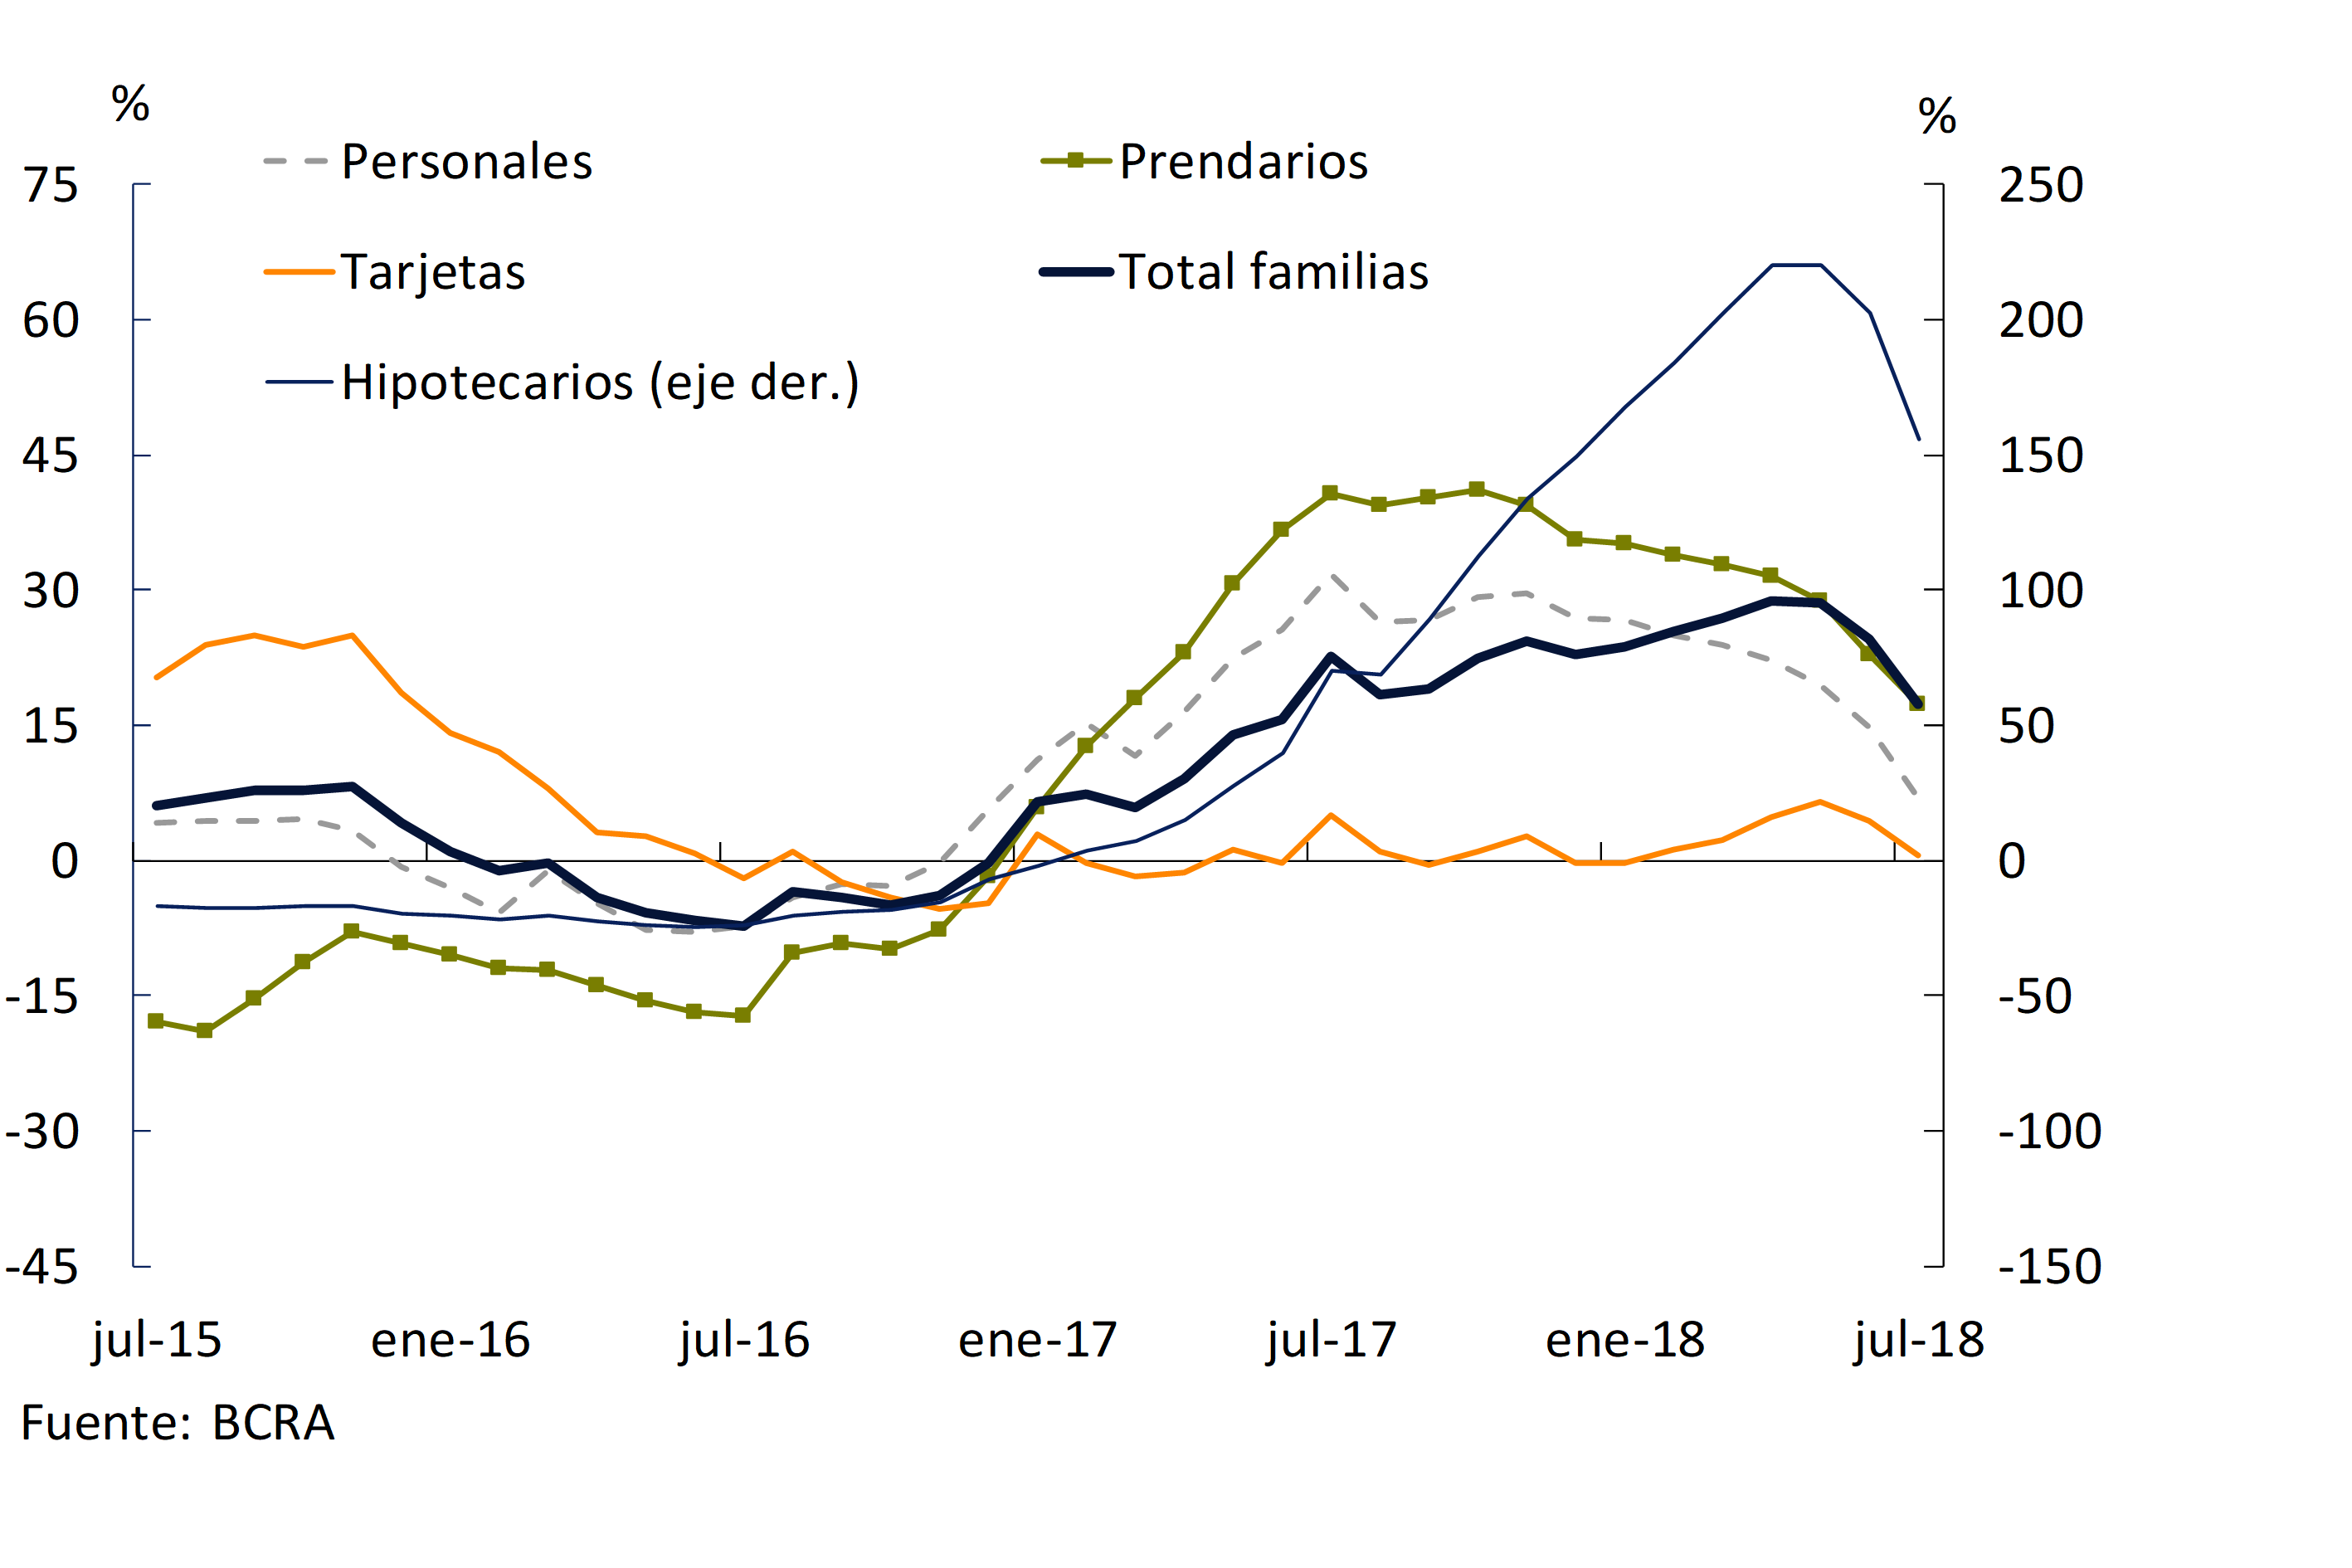
The balance of loans to households on the balance sheets of all financial institutions decreased by 1.3% when adjusted for inflation in July. Disaggregated by lines, the balance of mortgage loans showed increases in real terms in period19, while the rest of the credit assistance registered slight falls. In year-on-year terms, the balance of financing to households increased by 17.3% y.o.y. in real terms (see Chart 14), mainly explained by the performance of public banks. Mortgage lines continued to show the greatest relative year-on-year dynamism among loans to households.
Figure 14 | Total Credit Balance to Households – Real Year-on-Year % Change
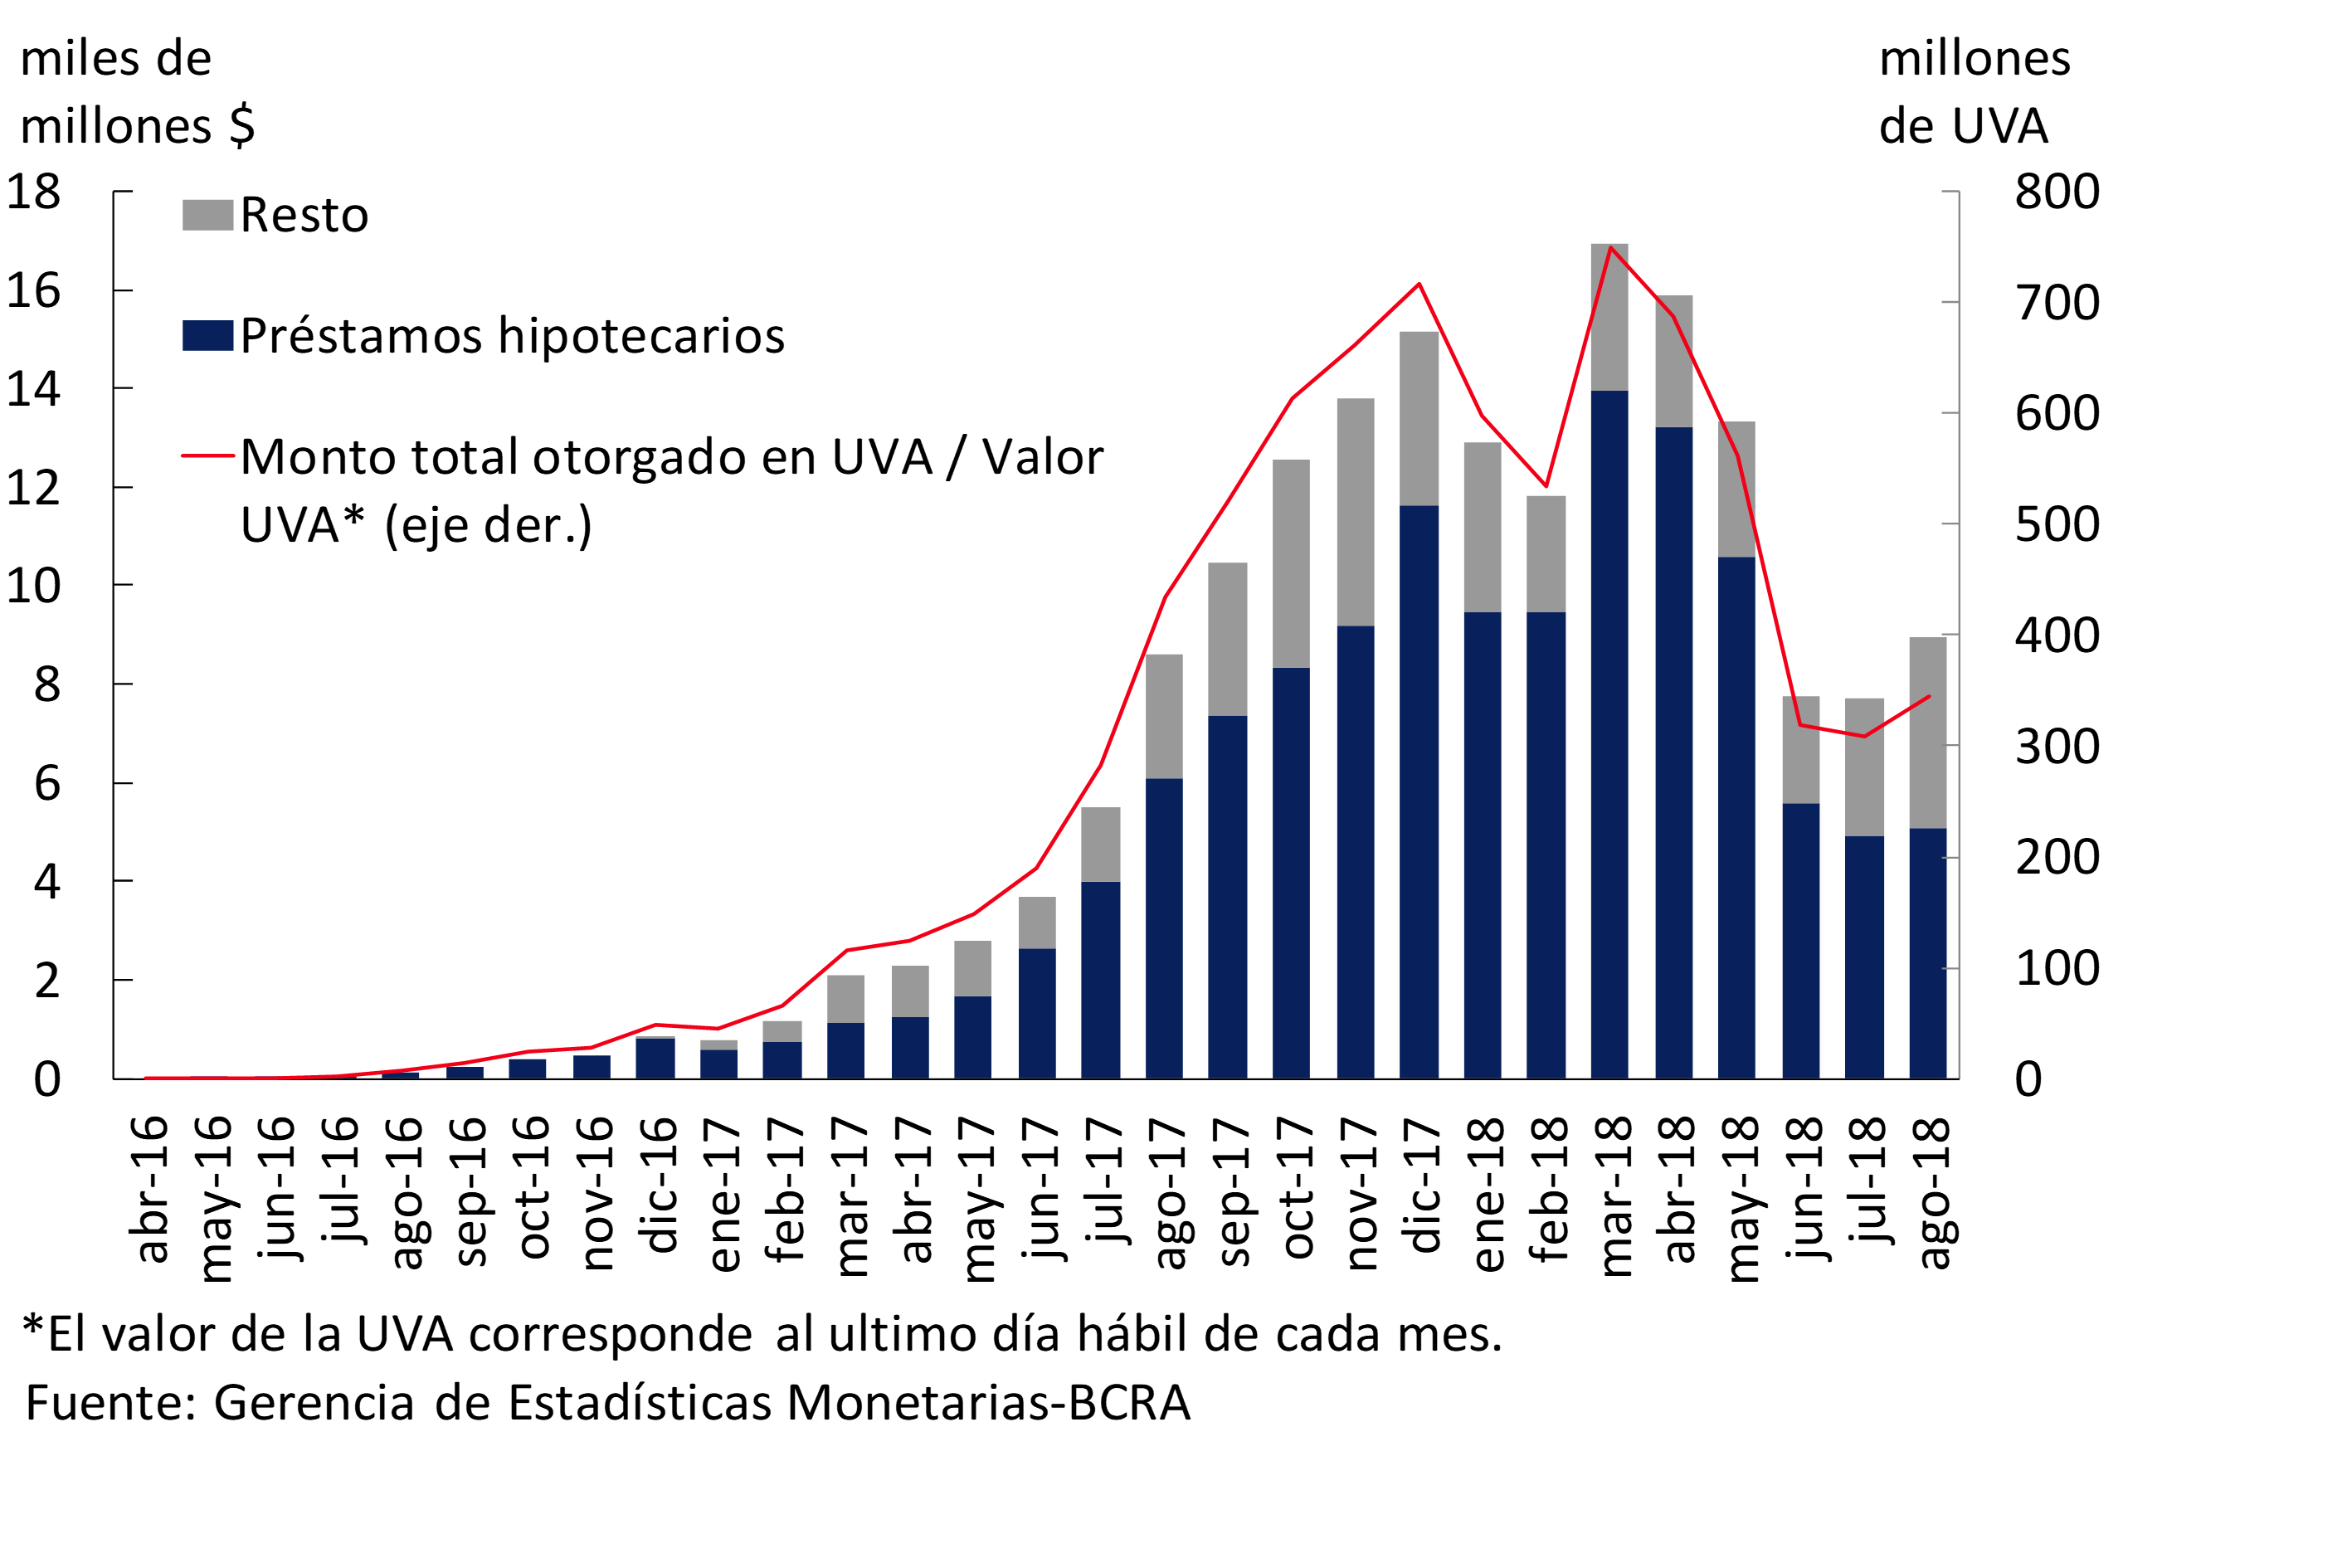
In August, the financial system channeled more than $8,900 million (345 million UVA20) to UVA-denominated loans to the private sector, slightly exceeding the levels of the previous two months (an increase that was also reflected in the expression of the amounts in UVA, see Graph 15). In particular, 57% of the total amount granted was allocated to mortgage loans, while 31% to personal loans, 11% to pledges and the rest to documents, advances and other loans. In this context, in July the balance of UVA loans to the private sector reached a total of $195,787 million21, 74% of which corresponded to mortgage loans.
Figure 15 | UVA Financing – Amounts Granted
Nominal interest rates operated in national currency with the private sector22 showed an increase in July. On the other hand, the average interest rates operated in UVA increased in personal and pledge loans, while in mortgages they remained unchanged in magnitude.
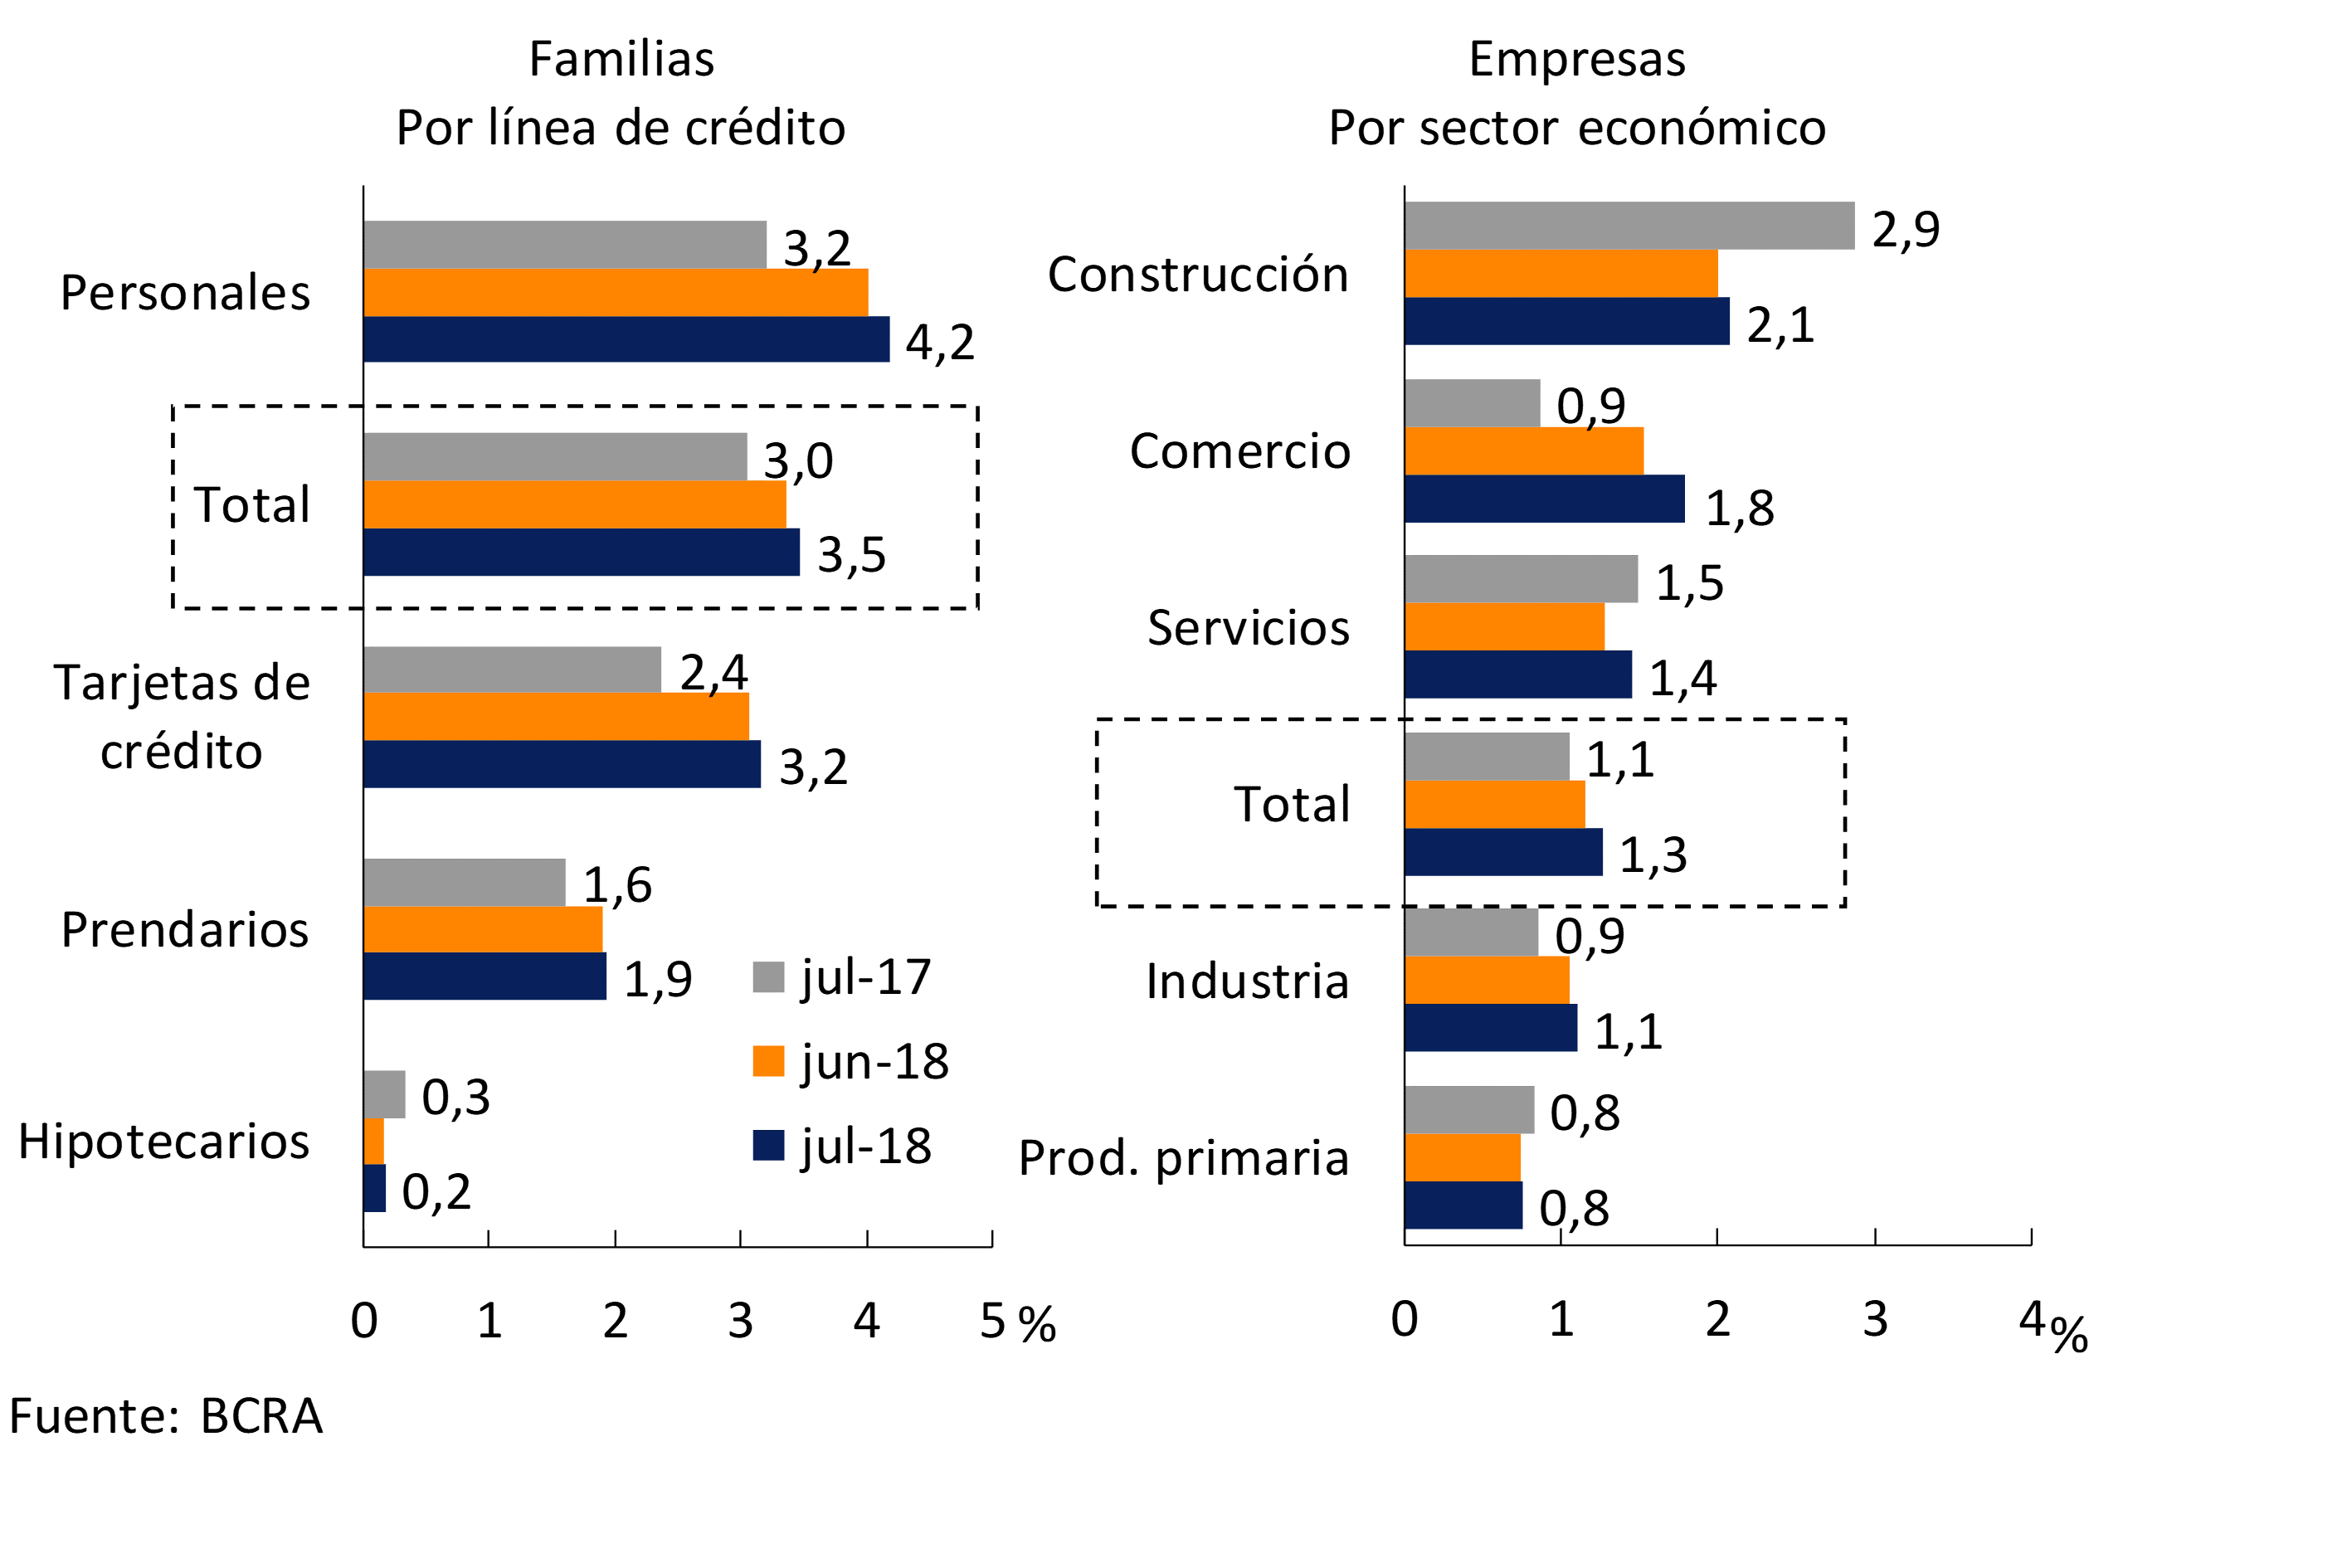
The level of non-performing loans in loans to the private sector was relatively low, both in historical terms and in relation to other economies in the region. In July, the non-performing ratio of credit to the private sector reached 2.3% (see Chart 16), slightly above last month’s level and the level evidenced a year ago. The NPL ratio of loans to households stood at 3.5% in the period, slightly exceeding last month’s value, mainly due to the performance of consumer lines (see Chart 17). Meanwhile, the irregularity of mortgage loans to households remained around 0.2%, being one of the lowest levels in a historical comparison. For its part, in the period, the irregularity of loans to companies stood at 1.3% of the total portfolio. The accounting forecasts of all financial institutions represented 124% of the private sector’s portfolio in an irregular situation in July.
Figure 16 | Irregularity Ratio (IR) of Credit to the Private Sector* and Forecasting
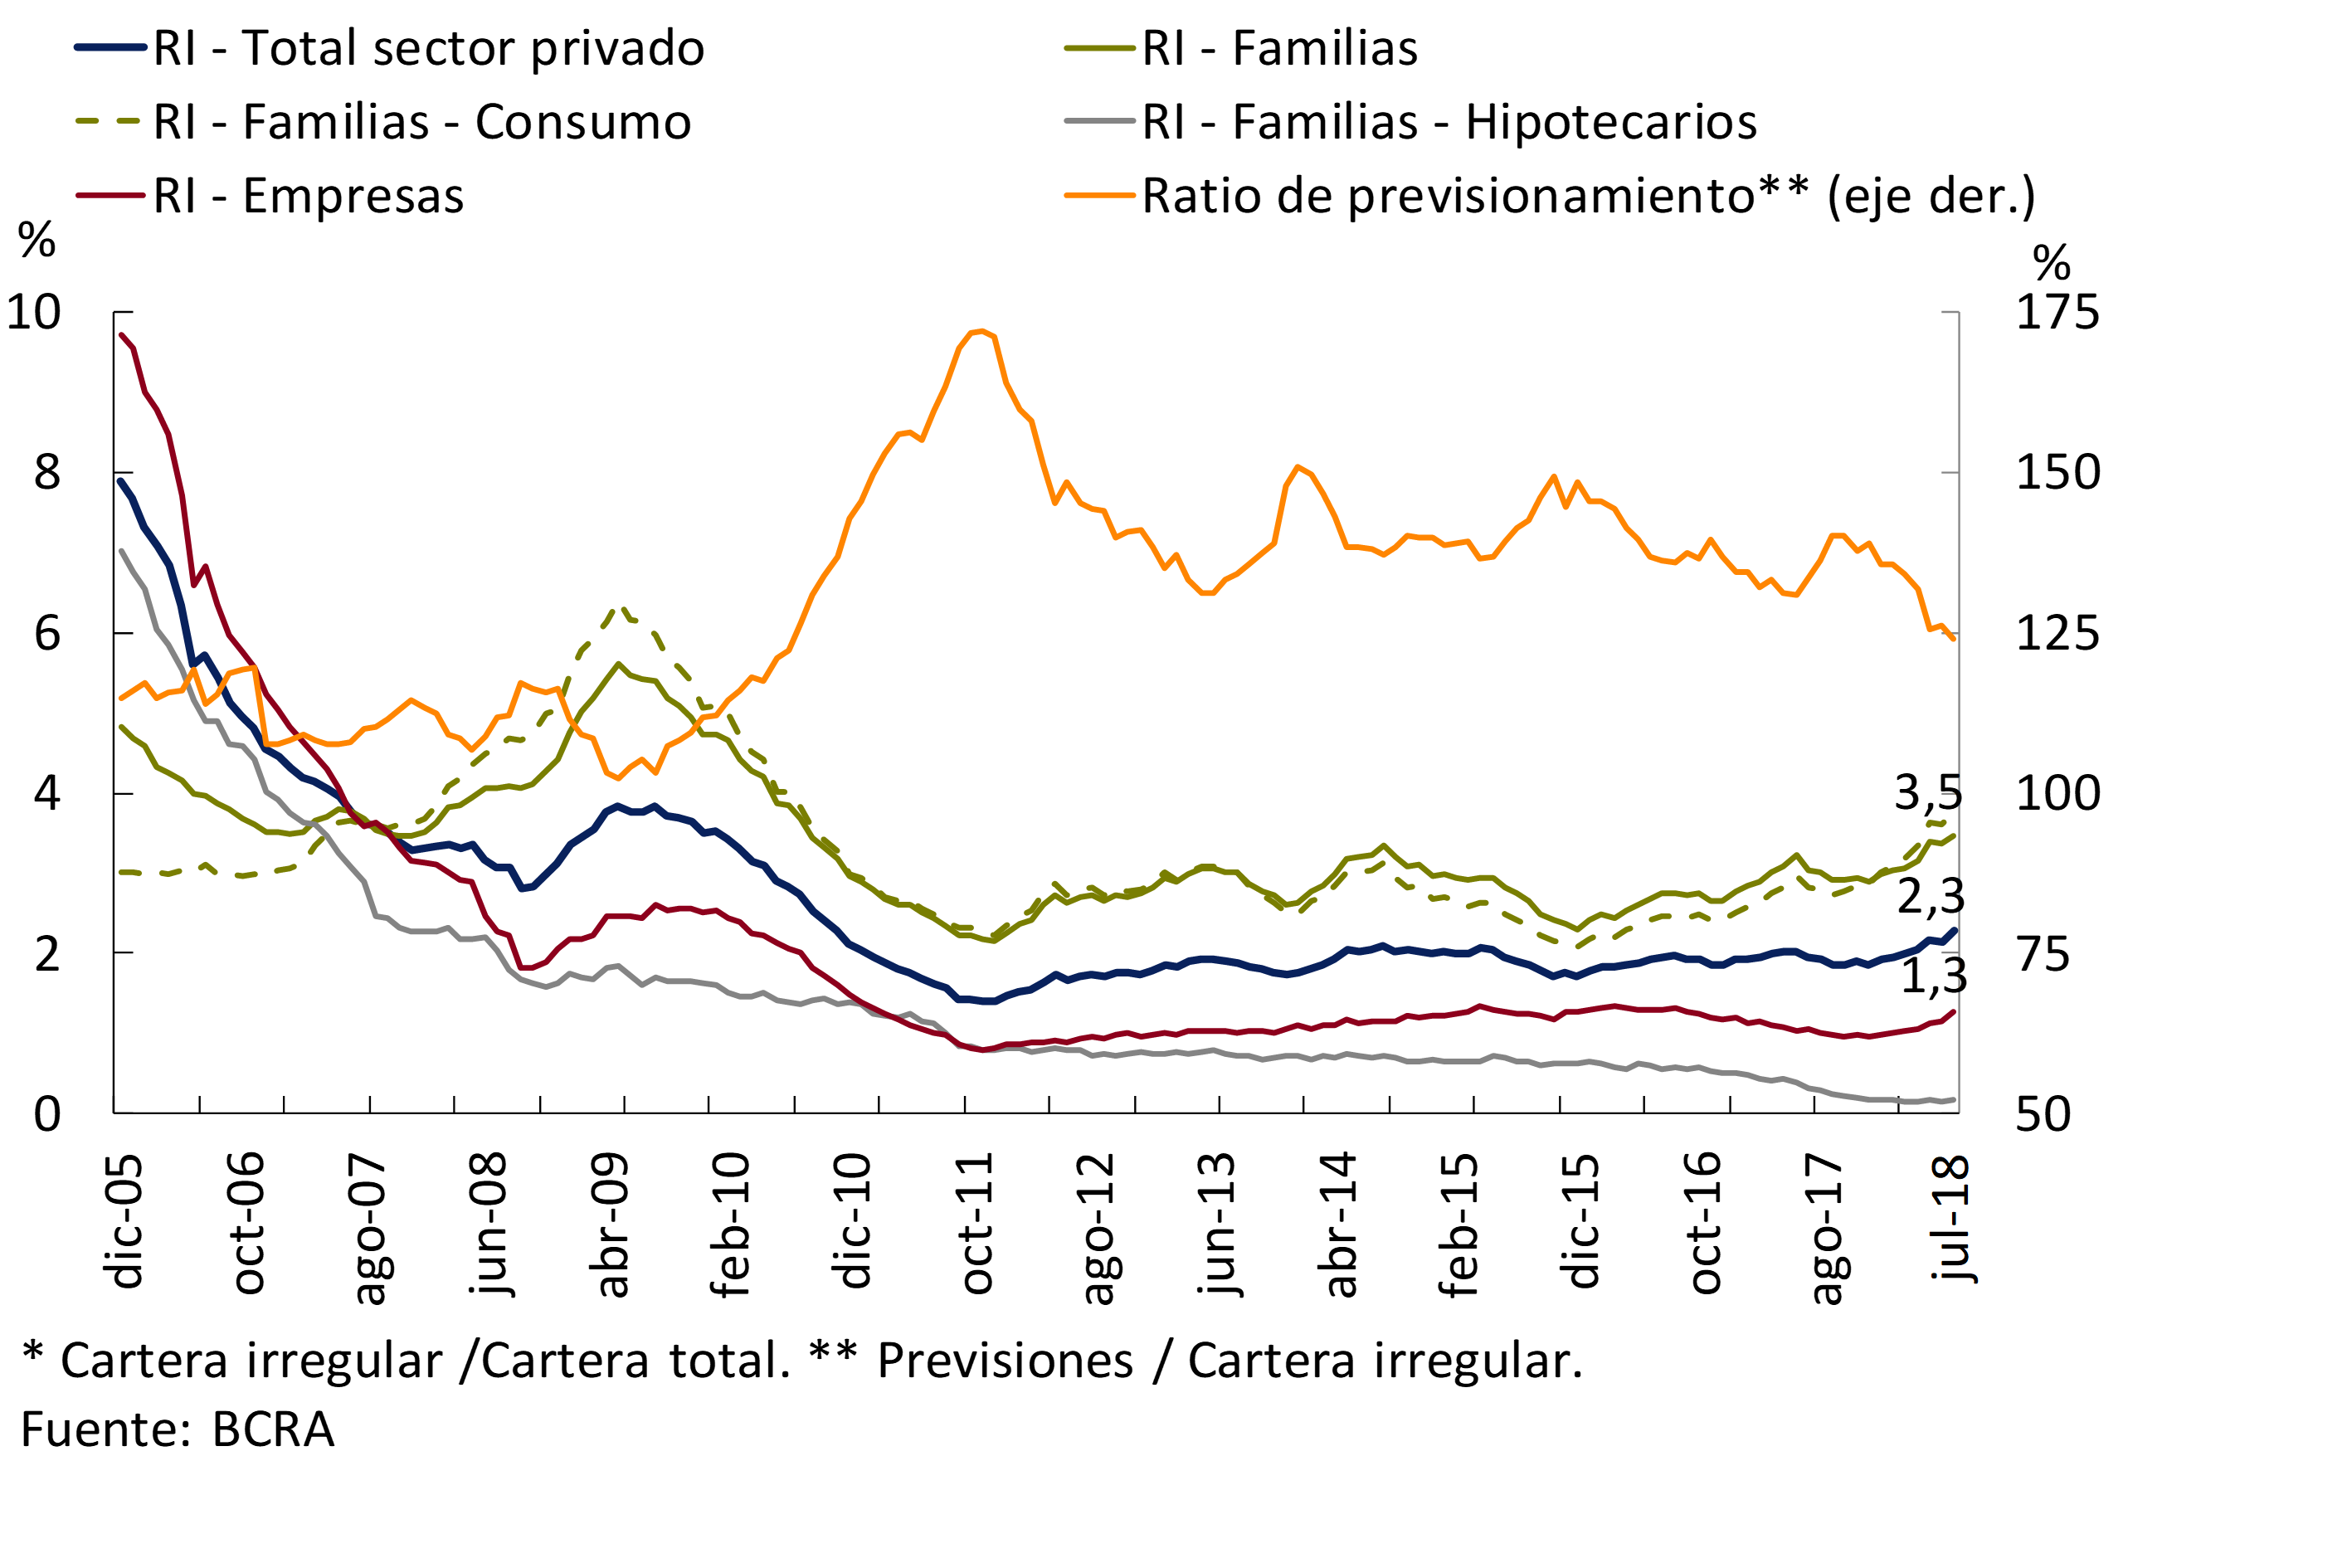
Figure 17 | Irregularity of Credit to the Private Sector – Irregular portfolio / Total financing (%)
V. Solvency
At the beginning of the second half of 2018, the local banks as a whole continued to have relatively high levels of solvency. In July, the regulatory integration of capital for the aggregate financial system totaled 15.1% of risk-weighted assets (RWA). 90% of the integrated capital corresponded to the capital of the highest relative quality to deal with eventual losses (Level 1) (see Graph 18). In this context, all financial institutions continued to register excess capital in relation to the minimum required by prudential regulation. The aggregate capital position reached 76% of the minimum regulatory requirement as of July.
Figure 18 | Integration and Excess Regulatory Capital (Position)

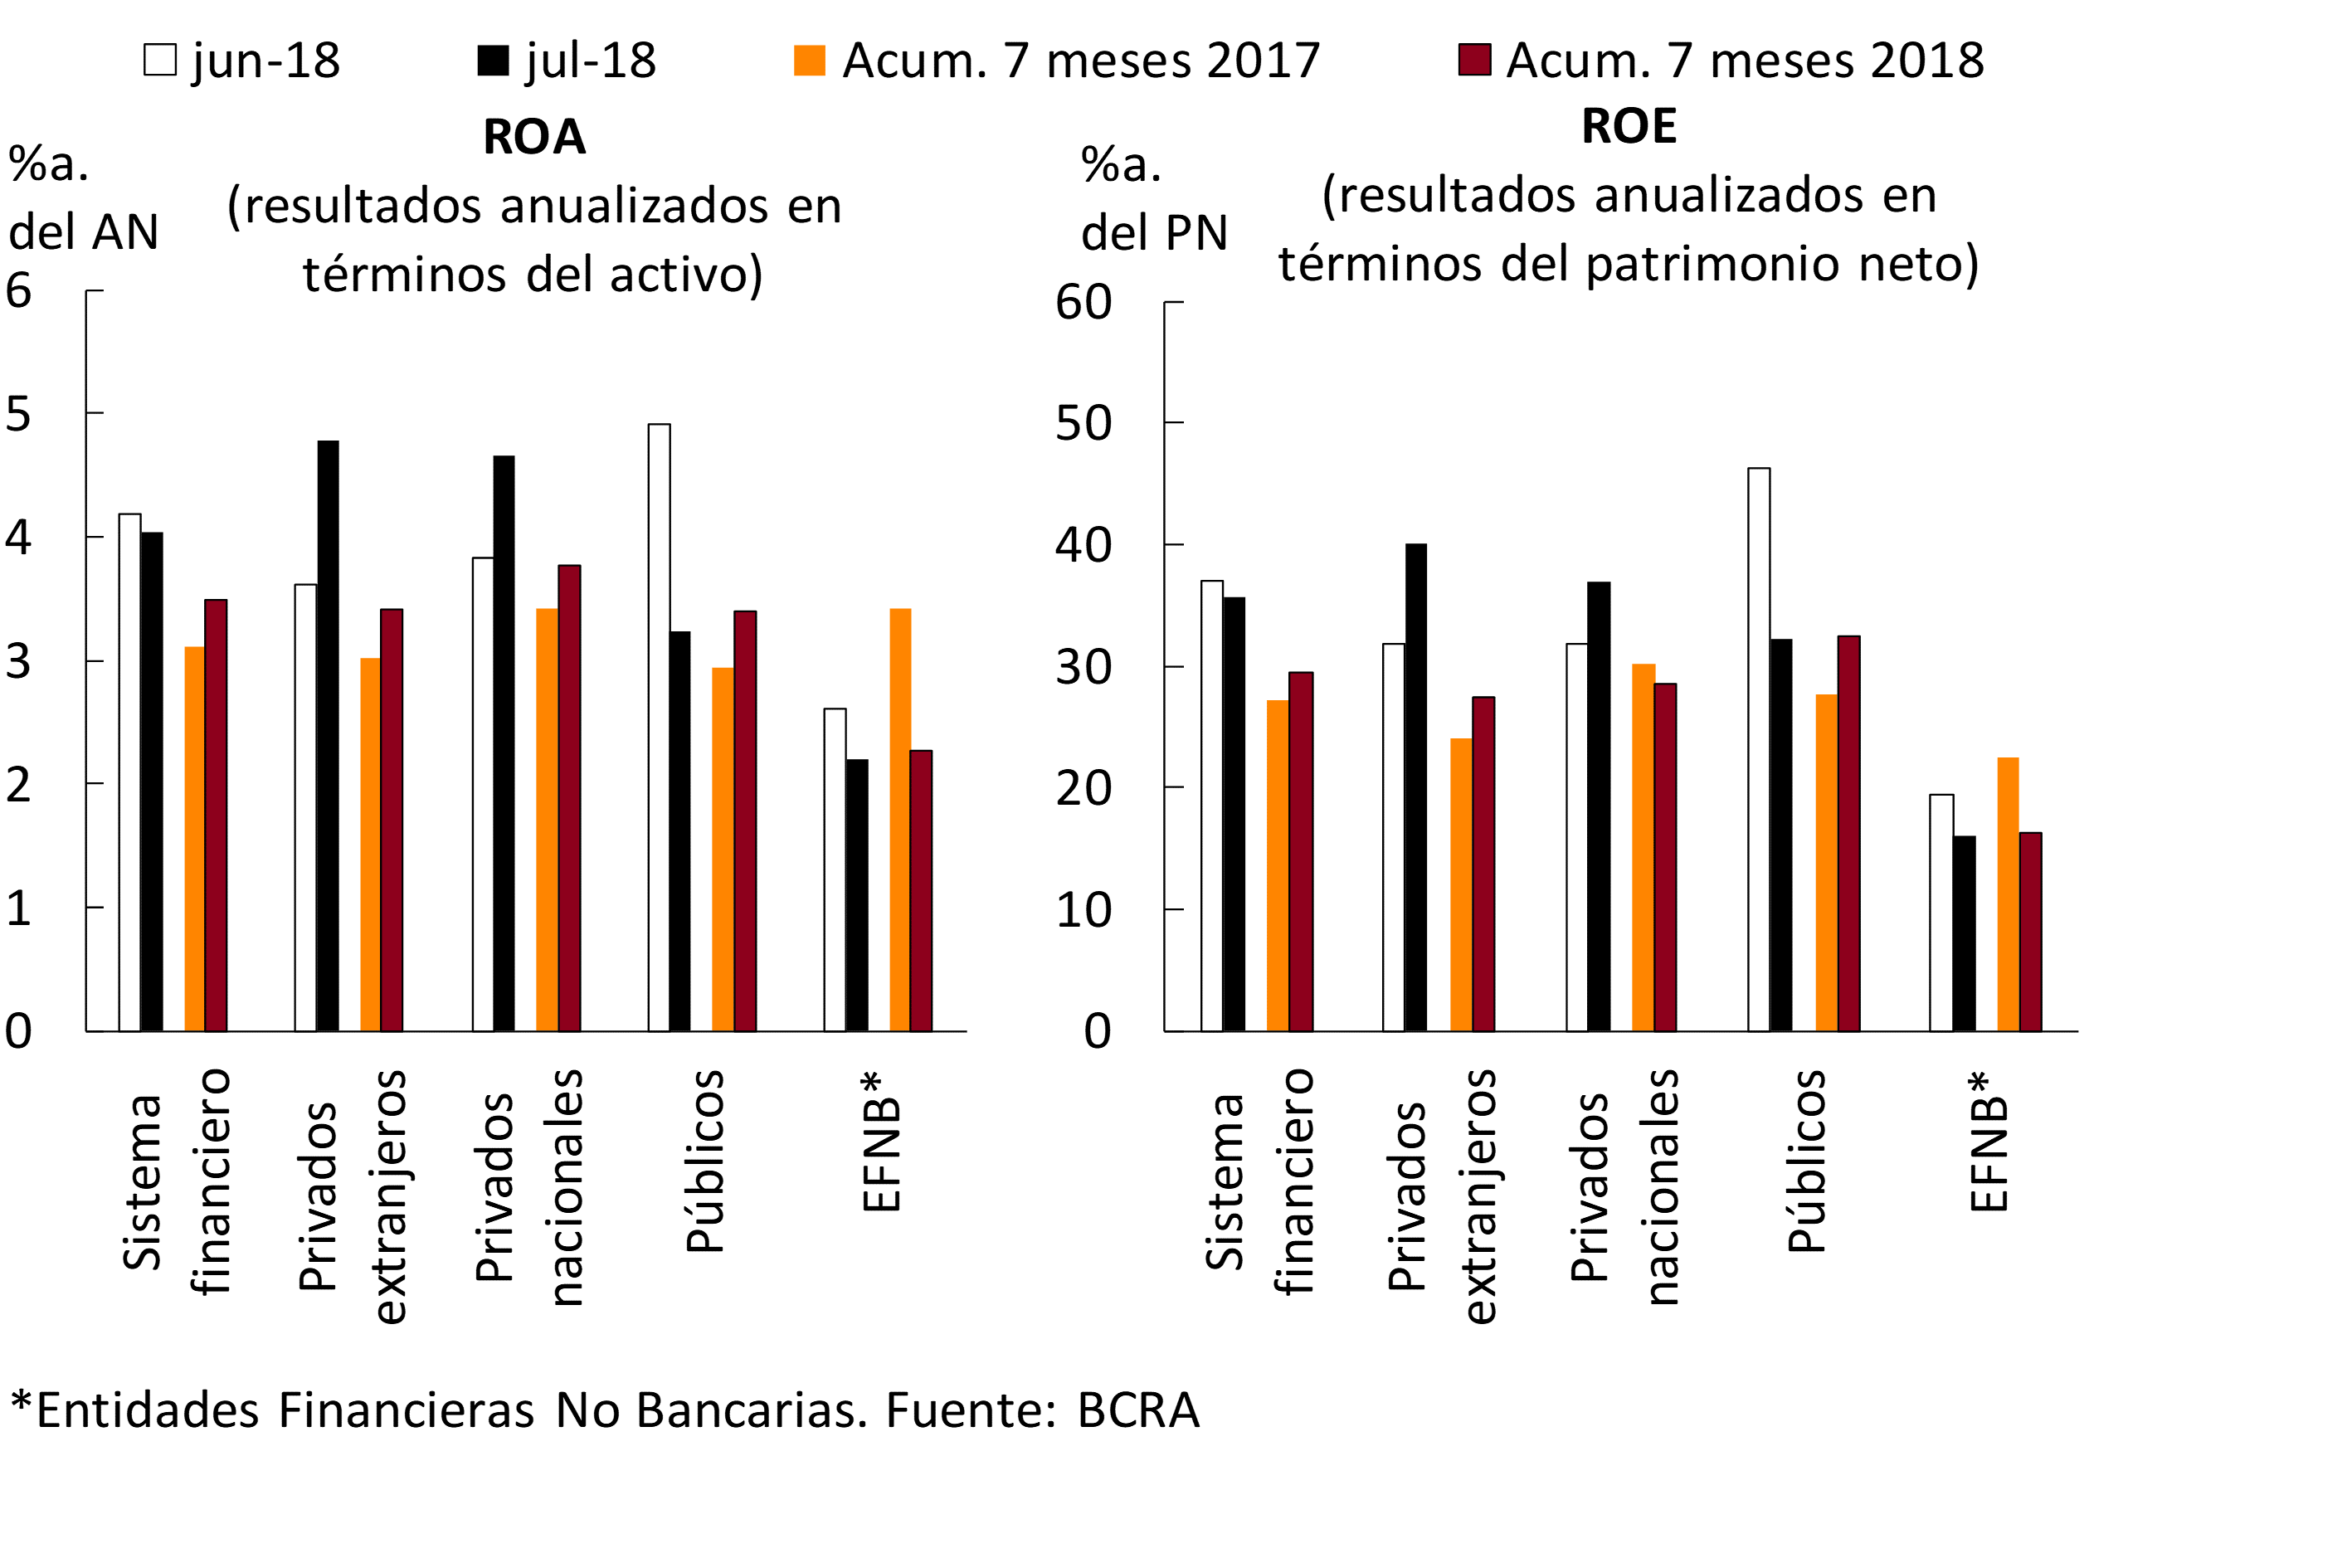
In July, the results accrued by the financial system were equivalent to 4% annualized (yr.) of assets (35.6% yr. of net worth (ROE). The monthly profitability indicators (ROA and ROE) were slightly lower than those of June, although they remain at relatively high levels compared to what has been evidenced in the last two years. In the month, public banks reduced their profits (up to 3.2% of assets), while private banks increased their profits (up to 4.7% of assets). In the seven-month cumulative of 2018, the ROA of the financial system was 3.5%y. (ROE of 29.4%y.y., see Chart 19), increasing 0.4 p.p. y.o.y. (+2.2 p.p. y.o.y.).
Figure 19 | Income Statement by Financial Institution Group
In July, the financial margin of the banks as a whole represented 9.8% y/y of assets, falling 0.9 p.p. compared to last month (see Chart 20). This reduction was mainly explained by higher interest expenses, an effect partially offset by the increase in interest income, earnings from share price differences and results from securities. In the first seven months of 2018, the financial margin totaled 10.5% of assets, in line with the level of the same period in 2017. In this year-on-year comparison, the higher gains accrued by securities, income from CER adjustments, interest income and exchange rate differences were offset by the increase in interest and CER expenses and by the reduction in pass premiums.
Figure 20 | Components of the Income Table – Financial System
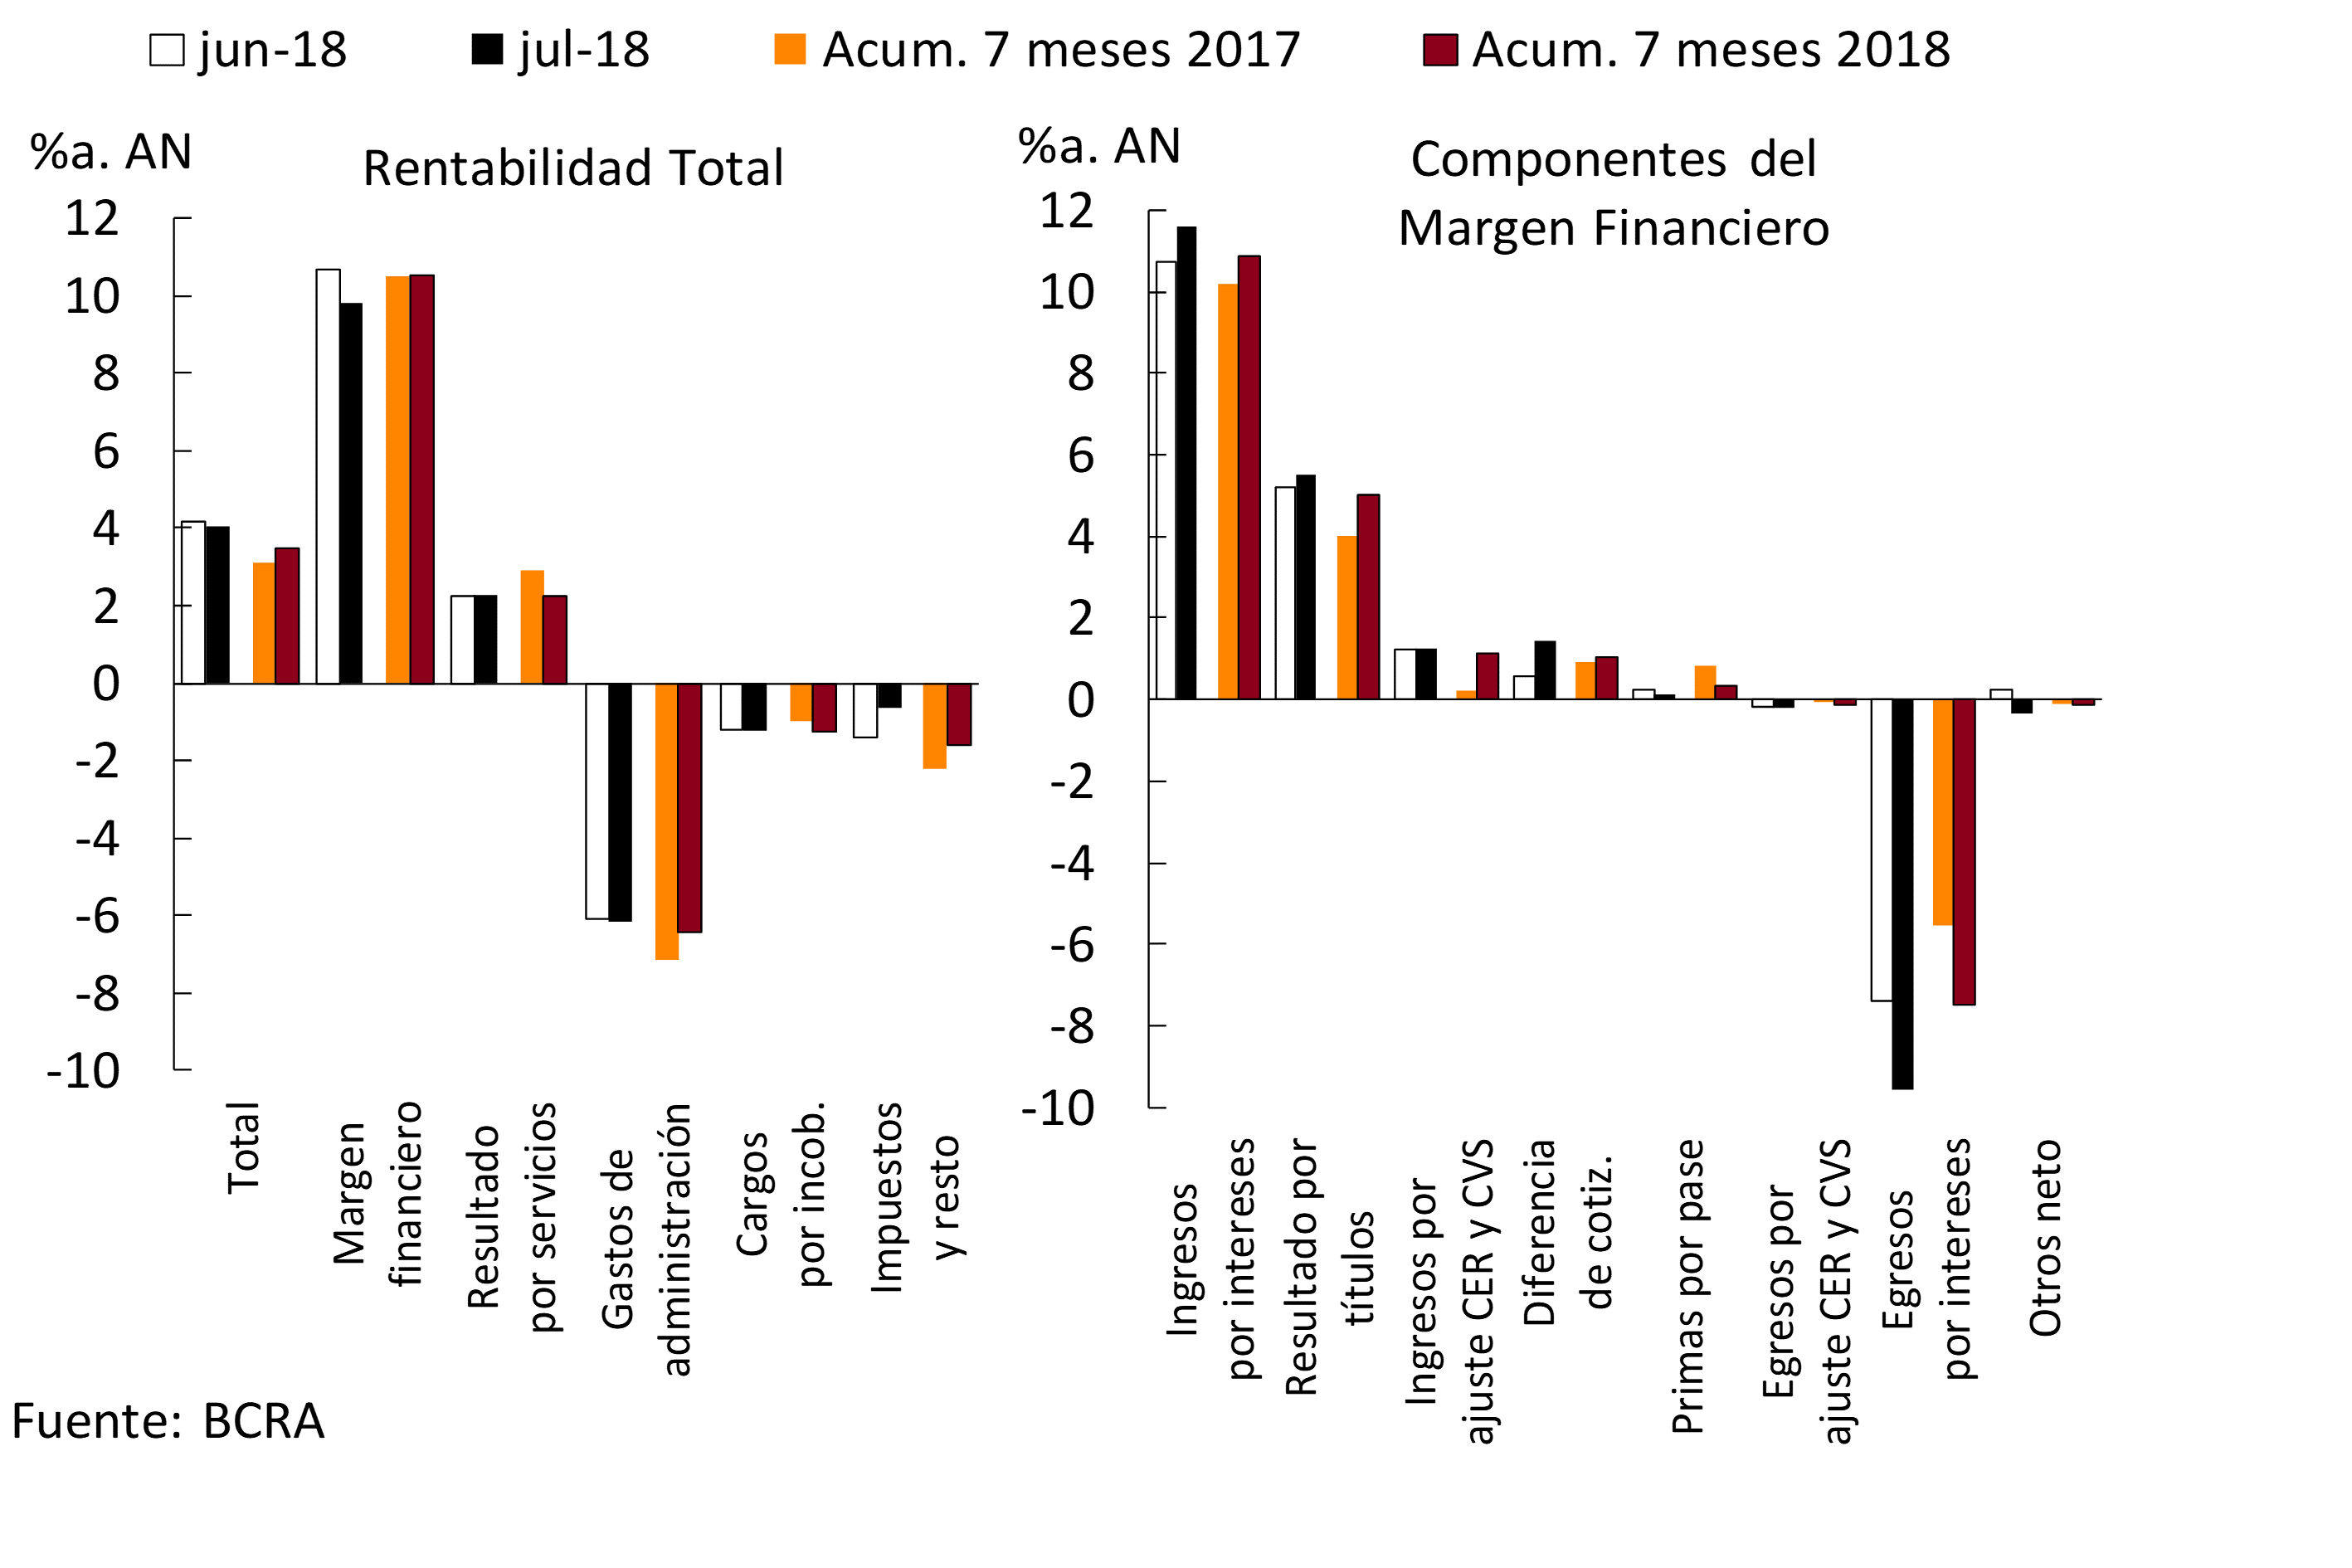
Net income from services for banks as a whole accounted for 2.3% y/y of assets in July, slightly increasing compared to last month. In the accumulated seven months of the year, these net income reached 2.2% of assets, falling 0.7 p.p. in a year-on-year comparison (see Chart 20).
In the month, bad debt charges totaled 1.2% y/y. of assets, with no significant changes compared to June (see Chart 20). In the cumulative period between January and July 2018, uncollectibility charges stood at 1.3% y/y. of assets, 0.3 p.p. higher in a year-on-year comparison. In July, administrative expenses of the financial system totaled 6.2% of assets, slightly higher than those of the previous month. Year-to-date, administrative expenses accounted for 6.4% of assets, down 0.7 p.p. year-on-year.
Regulations
Summary of the main regulations of the month, implemented by the BCRA, related to financial intermediation activity. The date of publication of the standard is taken as a reference.
Communication A6532 – 02/07/18
The rules on “Minimum cash” are modified, providing for an increase in the minimum cash requirement rates in pesos applicable to demand and term placements. It is indicated that this increase cannot be integrated with “National Treasury Bonds in pesos at a fixed rate due November 2020”.
Communication A6540 – 19/07/18
The rules on “Value transporters” are modified, providing that the land transport of valuables must be carried out with armored vehicles with certain levels of ballistic resistance, in accordance with the provisions of the standard of the National Agency of Controlled Materials (ANMAC). It is also established that the personnel who carry out the transfer must wear ballistic protection vests with certain protection parameters.
Communication A6541 – 19/07/18
The ordered texts of the rules on “Interest rates in credit operations” and “Communication by electronic means for the care of the environment” are adapted, establishing that the size of the Total Financial Cost (TFC) in its presentation in the documents must be at least twice the size used for the other information included in the document. On the other hand, it is established that the annual effective rate will be expressed as a percentage with at least one decimal place.
References
1 Reference is made to those measures of relevance to the financial system that were adopted since the date of publication of the previous Report on Banks.
2 Entities belonging to Group “A”. This group is made up of those entities in which the amount of their assets is greater than or equal to 1% of the total assets of the financial system (see Communication A6475 and Communication A6538). Communication A6550 and Press Release of 16/08/18.
3 Communication A6556 and Press Release of 30/08/18.
7 Until Communication A6558, such operations were limited to MSMEs and individuals not related to the financial institution.
8 Communication A6549 and Press Release of 16/08/18.
9 Throughout the Report, the series are deflated using a consumer price index (CPI). As of 2017, the CPI for national coverage prepared by INDEC is taken into account (in July 2018 it presented a monthly variation of 3.1% and 31.2% year-on-year). Until December 2016, the index calculated from the CPIs of the City of Buenos Aires, San Luis and Córdoba weighted according to the National Household Expenditure Survey corresponding to the period 2004-2005 is being worked on.
10 Based on balance sheet balance.
11 In July, bank reserve requirements were increased and part of them was allowed to be integrated with National Treasury Bonds (for more details, see the Deposits and Liquidity section of this Report).
12 Idem, note 11.
13 In this report, the foreign currency (EM) mismatch is defined as EM assets minus EM liabilities plus net forward purchases of EM without delivery of underlying (off-balance sheet items). This indicator is used for analytical purposes and not in regulatory terms.
14 This monthly increase occurred within the framework of debt placements and the sale of dollars in the sector during the period.
15 At the end of July, the total balance of BOTES was equivalent to 3.3% of total deposits in the financial system and 4.5% when considering deposits in pesos.
16 In currency of origin.
17 In currency of origin.
18 Information extracted from the Central Debtors (includes both national and foreign currency). Loans to residents abroad are not included. Business financing is defined here as that granted to legal entities and commercial financing granted to individuals. On the other hand, loans to families are considered to be those granted to individuals, unless they are for commercial purposes.
19 This increase is partly explained by the capital adjustment of existing loans.
20The value of the UVA is that corresponding to the last working day of July.
21 Includes capital and adjustment of capital for the evolution of the CER.
22 It includes operations at a fixed and repacable interest rate.
Glossary
%a.: annualized percentage.
% YoY: Year-on-year percentage.
Liquid assets: availabilities (integration of “minimum cash” in current accounts at the BCRA and in special guarantee accounts and other concepts, mainly cash in banks and correspondent offices) plus the net credit balance for transfer operations of financial institutions against the BCRA using LEBAC and NOBAC.
Consolidated assets and liabilities: those arising from deducting transactions between entities in the system.
Net Assets (NA): Assets and liabilities are net of accounting duplications for pass-through, forward and spot transactions to be settled.
APR: Total Risk Weighted Assets.
BCBS: Basel Committee on Banking Supervision (BCBS).
Irregular portfolio: portfolio in situation 3 to 6, in accordance with the “Classification of Debtors” regime.
Credit to the public sector: Position in public securities (without LEBAC or NOBAC) + Loans to the public sector + Compensation to be received + Debt securities and Certificates of participation in financial trusts (with underlying public securities) + Miscellaneous credits to the public sector.
Credit to the private sector: loans to the non-financial private sector including accrued interest and CER and CVS adjustment and leasing.
Contribution differences: Results from the monthly update of assets and liabilities in foreign currency. The item also includes the results originated by the purchase and sale of foreign currency, which arise as a difference between the agreed price (net of the direct expenses originated by the operation) and the book value.
Miscellaneous: miscellaneous profits (including, but not limited to, gains on permanent shares, recovered loans and unaffected provisions) less miscellaneous losses (including, but not limited to, losses on permanent shareholdings, loss on sale or disposal of goods for use and amortization of business keys).
Equity exposure to counterparty risk: irregular portfolio net of provisions in terms of equity.
Administration expenses: includes remunerations, social charges, services and fees, taxes and amortizations.
IEF II-17: BCRA Financial Stability Report.
IPCBA: Consumer Price Index of the City of Buenos Aires.
CSF: Liquidity Coverage Ratio (LCR).
LEBAC and NOBAC: bills and notes issued by the BCRA.
LELIQ: BCRA liquidity bills.
LR: Leverage Ratio (LR).
Financial margin: Income minus financial expenses. It includes interest and securities earnings, CER and CVS adjustments, exchange rate differences and other financial results.
Mill.: Million or million, as appropriate.
IFRS: International Financial Reporting Standards.
ON: Negotiable Obligations.
ORI: Other comprehensive results.
OS: Subordinated Obligations.
Other financial results: rental income from financial leases, contribution to the deposit guarantee fund, interest on availabilities, charges for loan depreciation, premiums for the sale of foreign currency and other unidentified items.
PN: Net Worth.
p.p.: percentage points.
SME: Small and Medium Enterprises.
Consolidated profit: Results from permanent holdings in local financial institutions are eliminated. Available since January 2008.
Income from securities: includes results from public securities, temporary shares, negotiable obligations, subordinated obligations, options and other credits for financial intermediation. In the case of public securities, it includes the results accrued in terms of income, differences in share price, exponential increase based on the internal rate of return (IRR) and sales, in addition to the charge for forecasts for the risk of impairment.
Interest income: interest charged minus interest paid for financial intermediation, following the accrual criterion (balance sheet information) and not what is received. It includes interest on loans and deposits of government securities and premiums for passes.
Result for services: commissions charged minus commissions paid. It includes fees related to obligations, credits, securities, guarantees granted, the rental of safe deposit boxes and foreign and exchange operations, excluding in the latter case the results from the purchase and sale of foreign currency, the latter being accounted for in the “Differences in quotation” account. Expenses include commissions paid, contributions to the ISSB, other contributions for income from services and charges accrued from the gross income tax.
ROA: Final result as a percentage of net assets. In the case of referring to accumulated results, the average of the NA for the reference months is considered in the denominator.
SWEE: Final result as a percentage of equity. In the case of referring to accumulated results, the average net worth for the reference months is considered in the denominator.
RPC: Computable Patrimonial Liability. For more details, see Ordered Text “Minimum Capitals of Financial Institutions”.
TNA: Annual nominal rate.
US$: US dollars.
UVA: Unit of Purchasing Value.
ICU: Housing Units.
Share on


