Summary
• At the beginning of 2025, financial intermediation with the private sector continued to grow, a path that began at the end of the first quarter of 2024. In this context, the liquidity and solvency indicators of all financial institutions are gradually being retooled, maintaining high coverage against the risks assumed.
• In January, the real balance of financing in pesos to the private sector grew 2%, with increases in all groups of financial institutions. As a result of this positive evolution, the real balance of credit in pesos to the private sector accumulated an increase of 70.6% year-on-year (y.o.y.). The balance of credit in foreign currency to the private sector increased 13.7% in the month and 219.4% y.o.y. (in currency of origin). When considering all currencies (domestic and foreign) together, the real balance of credit to the private sector increased 3.9% in January, accumulating an expansion of 77.7% YoY.
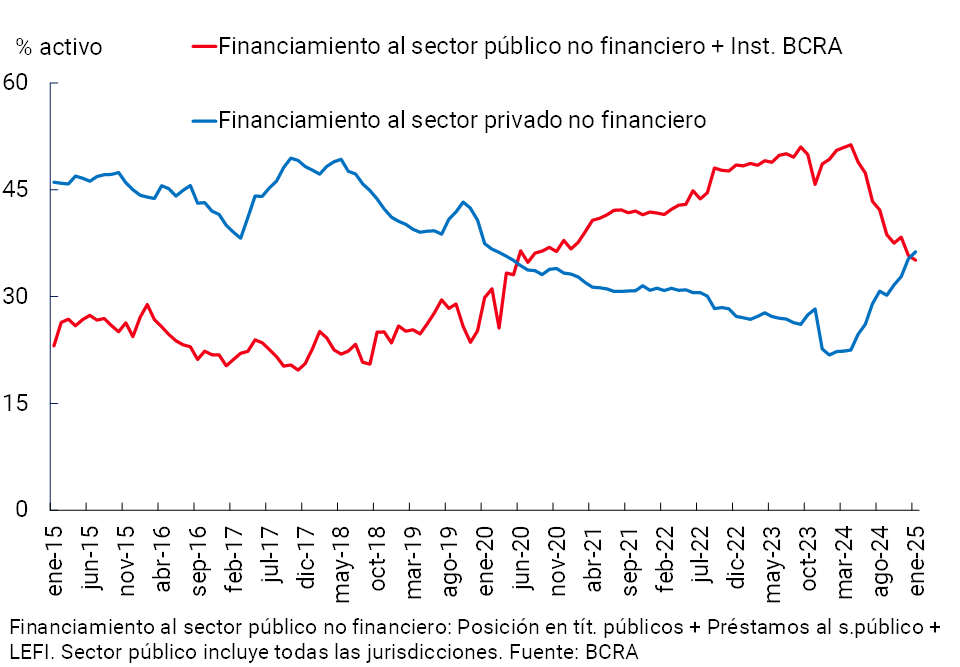
• The relevance of financing to the private sector in the total assets of the financial system continued to increase at the beginning of 2025 (+1 p.p. compared to last December and 14.5 p.p. y.o.y., to 36.3%). This performance was verified because the growth of credit was relatively higher than that of the aggregate balance sheet of the entities. In January, the financial system’s exposure to the private sector exceeded the weighting of total bank financing to the public sector in total assets, a situation that had not been verified since mid-2020.
• The non-performing ratio of credit to the private sector stood at 1.63% in January, increasing slightly in the month. The NPL indicator for financing to households stood at 2.67% (+0.11 p.p. in the month), while for the business segment it remained at around 0.77%. The balance of total forecasts of the financial system represented 162% of the portfolio in an irregular situation and 2.6% of the total credit balance to the private sector.
• The real balance of deposits in pesos in the private sector fell 0.5% in January, mainly due to the performance of demand accounts, partly associated with seasonal factors. For their part, time deposits in pesos of the private sector grew 3.5% in real terms in the period. In a year-on-year comparison, the balance of deposits in pesos of the private sector accumulated an increase of 5.7%, mainly driven by the increase in the time segment.
• In January, the financial system’s broad liquidity in pesos in terms of deposits in the same denomination grew slightly to 37.1%. In the foreign currency segment, from high levels and within the framework of the growth of credit to the private sector, liquidity continued to gradually decrease to 67% of deposits in this segment in the first month of the year.
• Capital integration (RPC) as a percentage of risk-weighted assets (RWA) declined slightly in January at the aggregate level, to 28.9%. The monthly dynamics reflected the effect of an increase of 2.2% in real terms in the PRC and 7.8% in real RWAs, the latter associated with the credit expansion scenario and the regulatory modifications duly ordered by the BCRA on the weights for credit risk requirements, among others (Communication Communication “A” 8067). In the month, the capital position (RPC net of regulatory requirements) of the financial system decreased 22.9 p.p. of the regulatory requirement to 260%.
• The financial system started 2025 earning profits. In the accumulated three months to January, the group of entities obtained a positive result equivalent to 3.7% annualized (a) of assets (ROA) and 15.1% y. of net worth (ROE). At the aggregate level, these indicators were higher than those recorded at the end of 2024, although lower when compared year-on-year. For its part, in the last 12 months to January, the ROA of the financial system amounted to 4.9% (ROE of 18.9%).
I. Financial intermediation activity
At the beginning of 2025, the growth in the financial intermediation activity of all institutions continued to consolidate. According to the main movements of the balance sheet in pesos of the financial system – in homogeneous currency – in January the increase in the balance of public sector deposits and, to a lesser extent, the decrease in availabilities and current accounts in the BCRA were the most relevant sources of funds. These resources were mostly channeled to increase the real balance of credit to the private sector and, to a lesser extent, to the public sector. In relation to the foreign currency segment, in the month the reduction in liquidity and the balance of financing to the public sector1 were the most relevant sources of funding; while the increase in the balance of loans to the private sector was the main application of funds by all entities in the period.
In January, the real balance of financing in pesos to the private sector increased by 2% compared to December2 (see Graph 1), with increases in all groups of financial institutions. In January, there were heterogeneous performances among credit assistance: consumer lines and those with real collateral increased (+4.9% and +2.8% real, respectively), while the commercial segment decreased slightly (-1.9% in real terms), within the framework of seasonal factors. As a result of the positive evolution recorded since the first months of 2024, the balance of financing in pesos to the private sector accumulated a growth of 70.6% in real terms in year-on-year terms.
Graph 1 | Real balance of credit to the private sector in pesos*
Monthly changes

Graph 2 | Financial intermediation with the private sector in foreign
currency In source currency
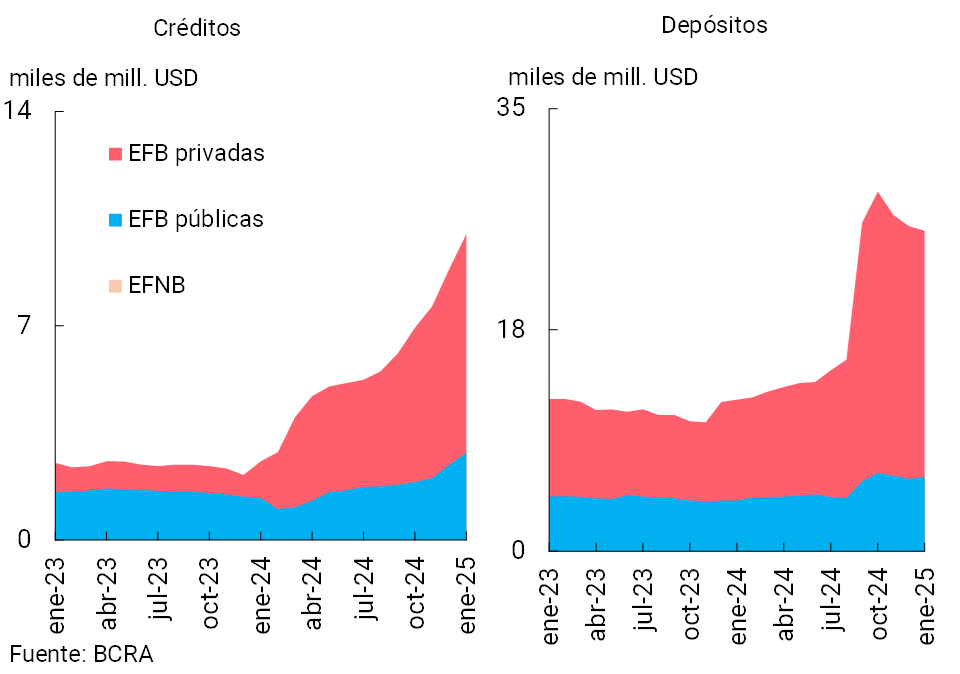
As for the foreign currency segment, at the beginning of 2025 the balance of credit to the private sector increased by 13.7% compared to December 2024 – in the currency of origin – driven mainly by private banks (see Chart 2)3. The performance in the period was explained by pre-financing for exports, documents and, to a lesser extent, cards.
When considering all currencies (domestic and foreign) together, the real balance of credit to the private sector increased by 3.9% in January (+77.7% real YoY). The segment of credit to households increased 4.9% in real terms compared to the previous month, driven mainly by personal loans (see Graph 3). On the other hand, financing to companies grew 2.6% in real terms in the period, with heterogeneous performances among the different economic sectors, highlighting the relative increase in primary production4.
Graph 3 | Real balance of total credit to the private sector*
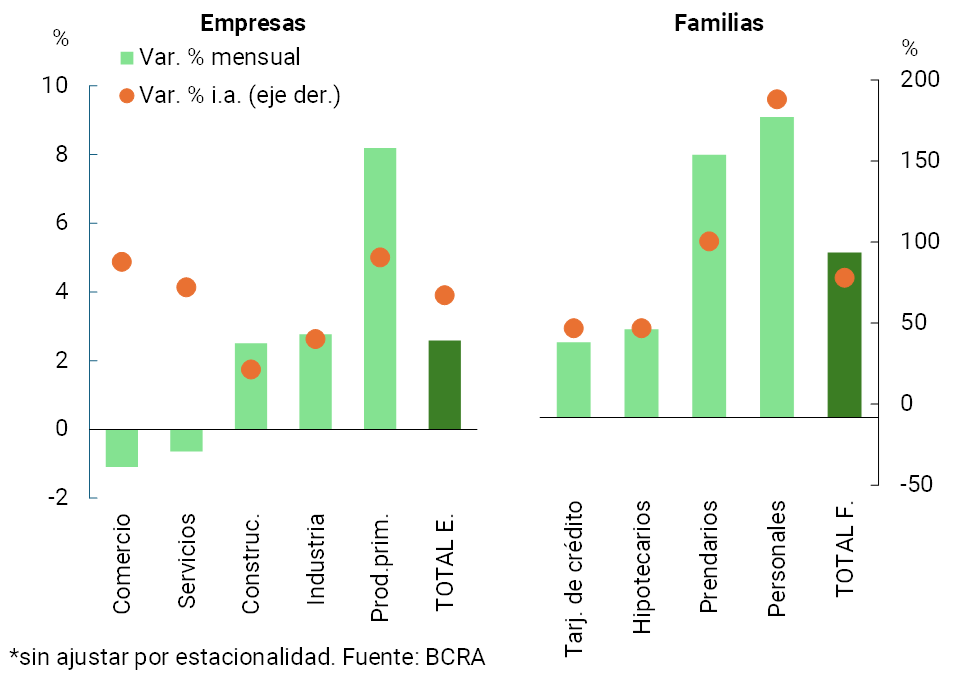
Figure 4 | Estimation of mortgage “registrations” (individuals) – Sistema financiero
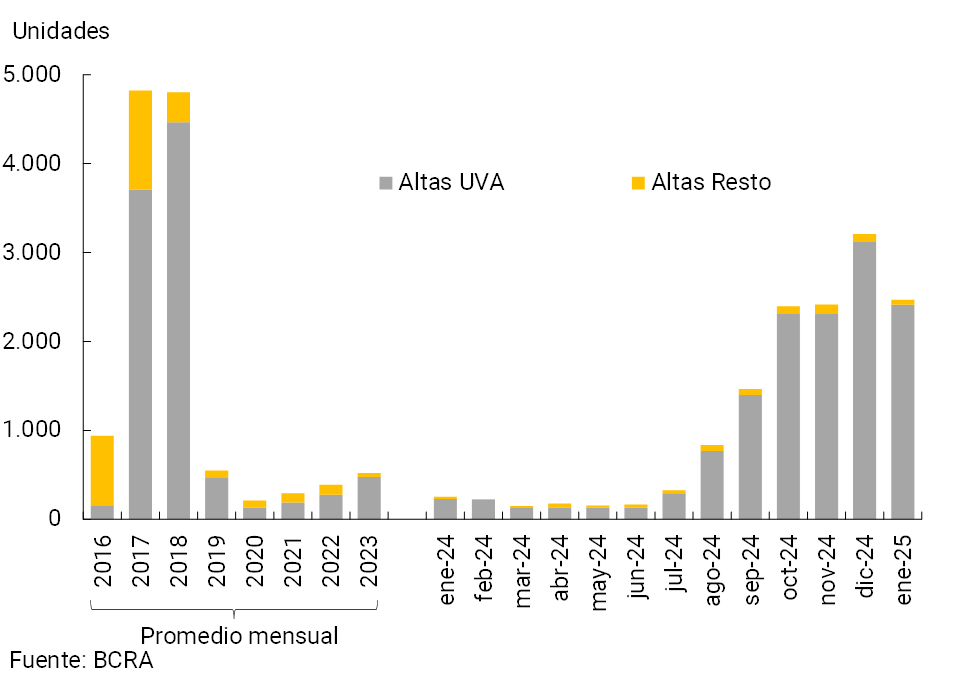
Despite the seasonality of the purchase and sale of real estate characteristic of the beginning of the year, the balance of mortgage credit to the private sector increased by 2.7% in real terms between December and January, accumulating a year-on-year growth of 40.1% in real terms. In the first month of 2025, it is estimated that almost 2,500 new mortgage debtors (registrations of individuals) joined the financial system, well above the monthly average verified in the last 5 years – a monthly average of 392 registrations between 2019 and 2023 – (see Graph 4). From August 2024 (the month in which mortgage registrations begin to increase) to January 2025, approximately 12,800 new mortgage debtors have accumulated.
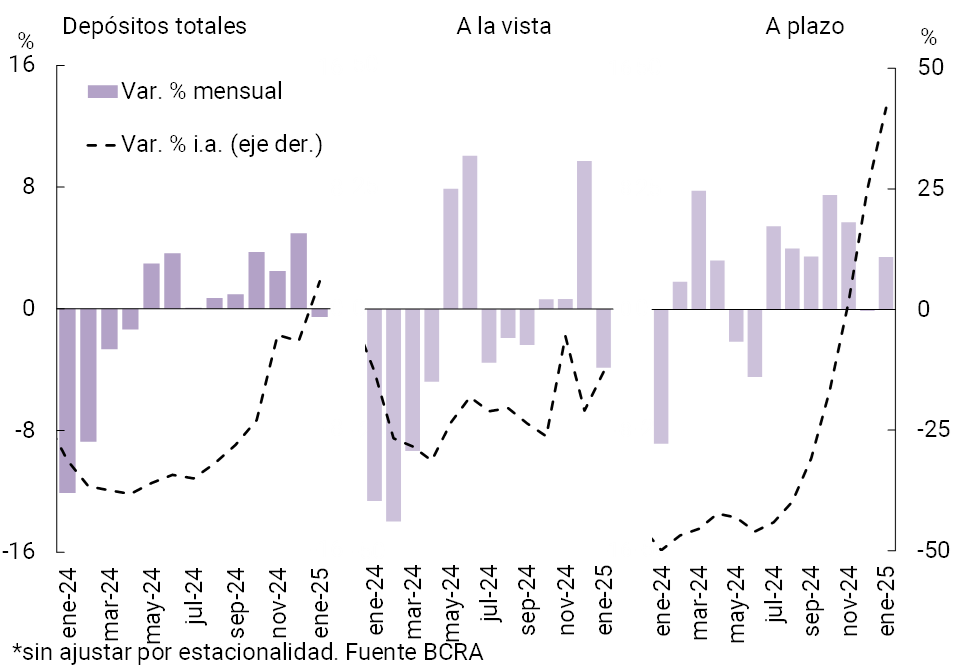
In relation to the funding of the aggregate financial system, the real balance of deposits in pesos of the private sector fell 0.5% in the month; however, the year-on-year increase reached 5.7% (see Graph 5). When distinguishing by type of deposits, in January the demand accounts of the private sector decreased by 3.9% in real terms (-13.1% y.o.y.), partly influenced by seasonal factors. Meanwhile, time deposits grew 3.5% in real terms in the period (+41.8% y.o.y. in real terms)5.
Graph 5 | Real balance of private sector deposits in pesos*
On the side of the segment in foreign currency, in January the balance of private sector deposits decreased 0.7% compared to December (in currency of origin; see Chart 2). The current level of the balance of foreign currency deposits in the private sector continued to be among the highest in recent years (accumulating an increase of 95.4% YoY). In this context, the real balance of total deposits (considering all sectors and currencies) increased 0.8% in the month and 10.3% in year-on-year terms.
II. Evolution and aggregate composition of the balance sheet
In January, the size of the financial system’s balance sheet – measured by total assets – grew 1% in real terms. In the last 12 months, the total assets of the sector accumulated a positive variation of 6.7% at constant prices.
With regard to the composition of the sector’s total assets, at the beginning of the year the share of credit to the private sector increased again, both in pesos and in foreign currency, while the relative weight of financing to the public sector and liquid assets in foreign currency decreased. The relevance of financing to the private sector in the total assets of the financial system exceeded the weighting of credit to the public sector, a situation that had not been verified since mid-20206 (see Chart 6). With respect to the composition of the total funding of the group of entities, in the month the term placements in pesos of the private sector and the deposits of the public sector in the same denomination gained share in the total. For their part, in the first month of the year, demand accounts in pesos and deposits in foreign currency – both arranged by the private sector – decreased their relative weight in total funding.
Graph 6 | Credit to the private sector and the public
sector- As % of assets
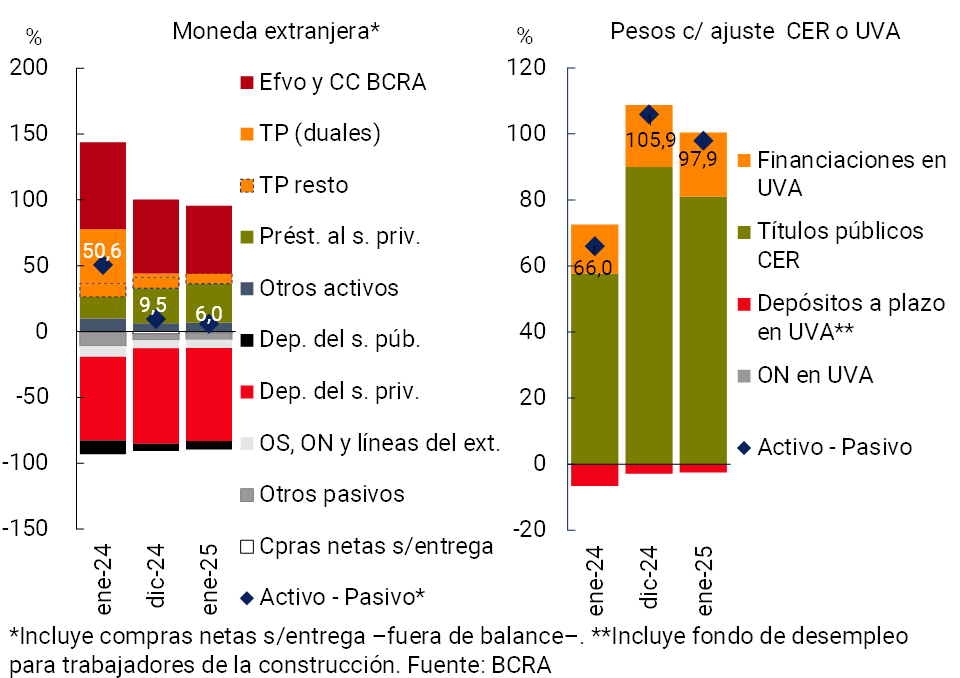
In January, the estimated spread between assets and liabilities denominated in foreign currency in the financial system saw a reduction of 3.5 p.p. in regulatory capital (RPC), standing at 6% (-44.6 p.p. y.o.y., see Chart 7)7. The differential between items in pesos adjustable by CER or agreed in UVA totaled 97.9% of the sector’s PRC in the month, reducing 8 p.p. compared to December (+31.9 p.p. y.o.y.).
Figure 7 | Spread between assets and liabilities
In % of PRC
III. Portfolio quality
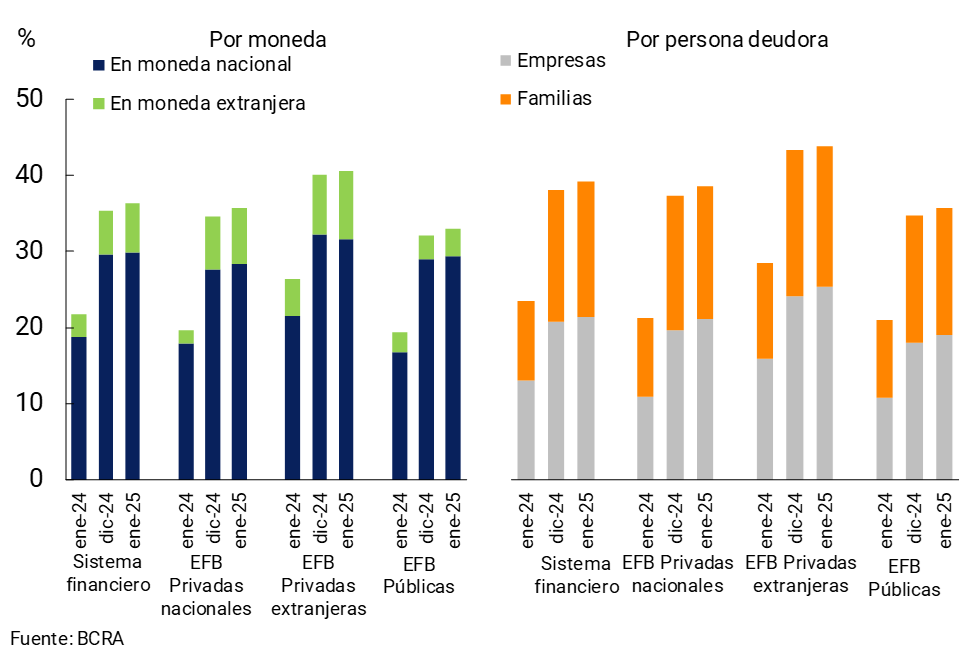
The exposure of all financial institutions to the private sector continued to grow at the beginning of 2025, in a scenario in which the increase in the real balance of credit to the private sector exceeded the real increase in total assets. The financing balance represented 36.3% of total assets in January, 1 p.p. above the record at the end of 2024 (+14.5 p.p. y.o.y.; see Figure 8). The monthly performance was mainly driven by the foreign currency segment, being disseminated among the8 groups of banks.
Figure 8 | Credit balance to the private sector in terms of assets
– By group of financial institutions
In January, the irregularity ratio of credit to the private sector stood at 1.63%, slightly increasing compared to December 2024 (+0.08 p.p. monthly and -1.89 p.p. y.o.y.; see Figure 9). The NPL indicator for financing to households stood at 2.67% in the month (+0.11 p.p. in the month and a similar level in year-on-year terms). For its part, the indicator of irregularity of financing to companies totaled 0.77% in the period (without variations in magnitude in the month and -3.45 p.p. y.o.y.)9.
Figure 9 | Private sector credit irregularity ratio by entity group
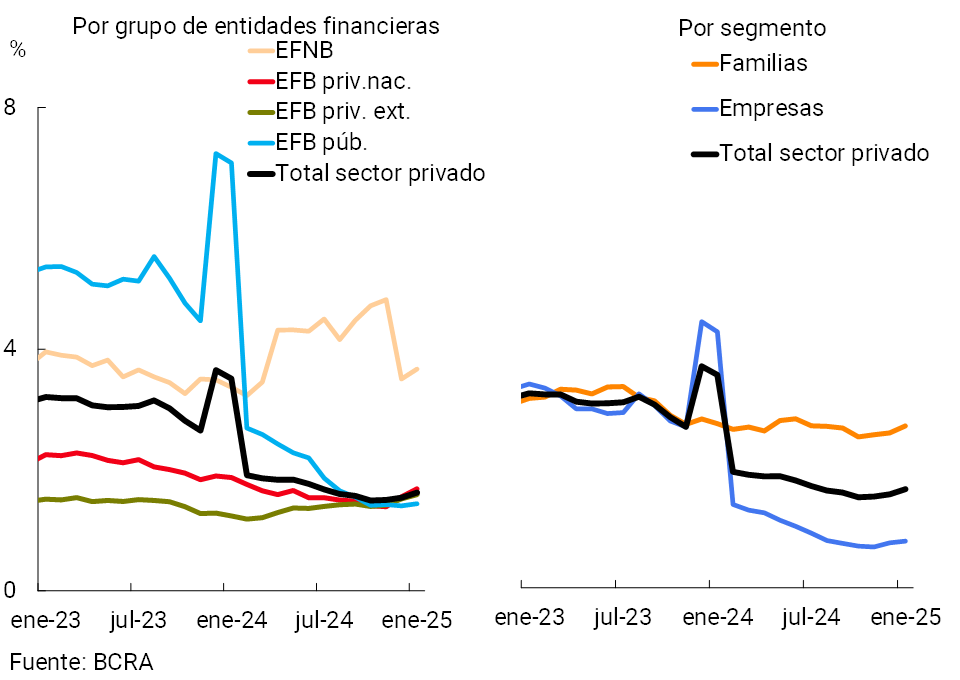
Figure 10 | Financial
system forecasting Total forecasts / Irregular portfolio (%)
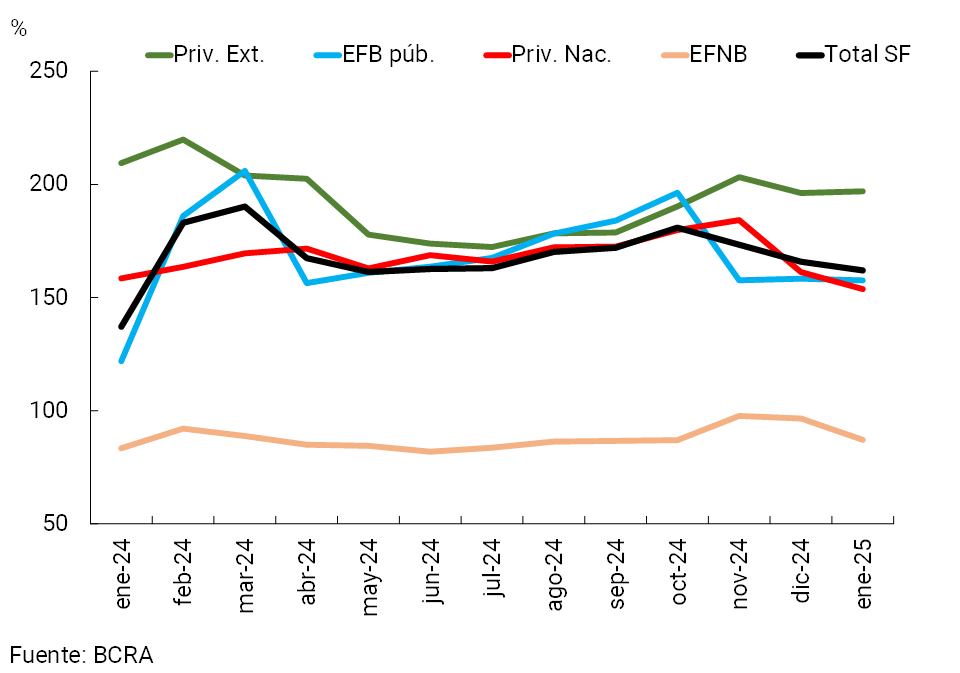
At the beginning of 2025, all financial institutions maintained comfortable levels of forecasting. In January, the balance of total forecasts represented 162% of the portfolio in an irregular situation at the systemic level (-3.8 p.p. monthly and +24.9 p.p. y.o.y., see Graph 10) and 2.6% of the balance of total financing to the private sector (+0.1 p.p. monthly and -2.2 p.p. y.o.y.). The estimated balance of forecasts attributable to the portfolio in an irregular situation reached practically the level of that portfolio (100.1%) for the aggregate of the system (+1.4 p.p. monthly and -8.1 p.p. y.o.y.).
IV. Liquidity and solvency
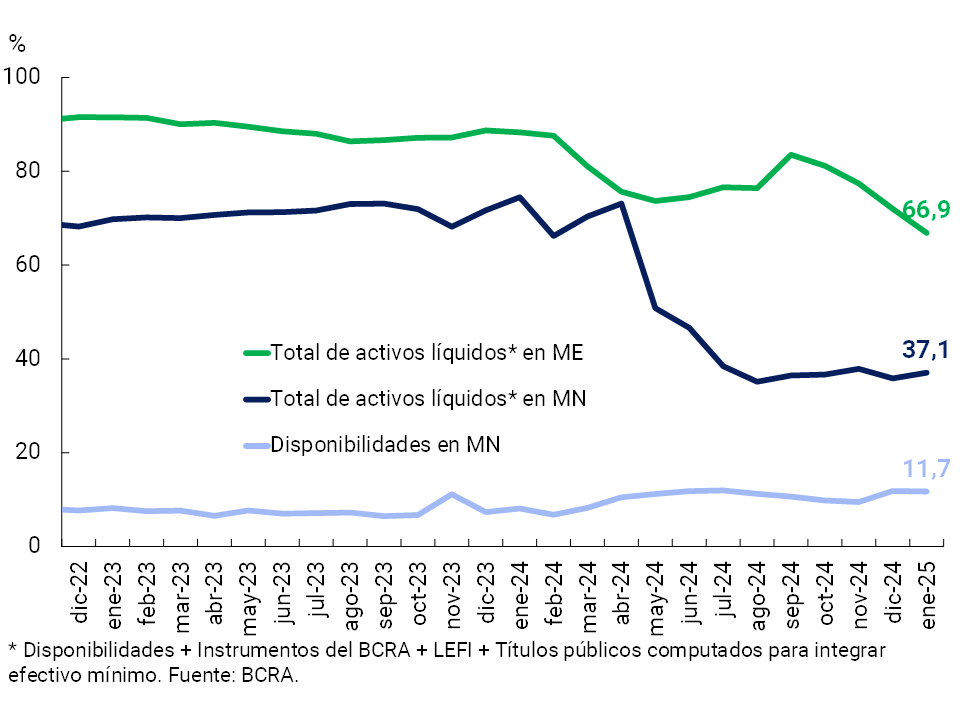
The ratio between liquid assets in national currency in the broadsense10 and deposits in the same denomination for the financial system increased slightly in the month to 37.1% (when considering only availabilities, the indicator remained stable at around 11.7%, see Chart 11)11. Among the liquid assets in pesos, the participation of LEFIs increased in the month, to the detriment of the balance of the current account in the BCRA and the public securities used to integrate minimum cash. In year-on-year terms, the broad indicator of systemic liquidity in pesos fell by 37.4 p.p. (+3.6 p.p. y.o.y. for the limited indicator). In the foreign currency segment, from high levels, the liquidity with which the sector operates continued to gradually decrease within the framework of the increase in credit in this denomination. The systemic liquidity ratio in foreign currency reached 66.9% of deposits in this segment in the first month of the year (-5.1 p.p. monthly and -21.4 p.p. y.o.y.).
Figure 11 | Liquidity
indicators Financial system – As % of deposits in each denomination
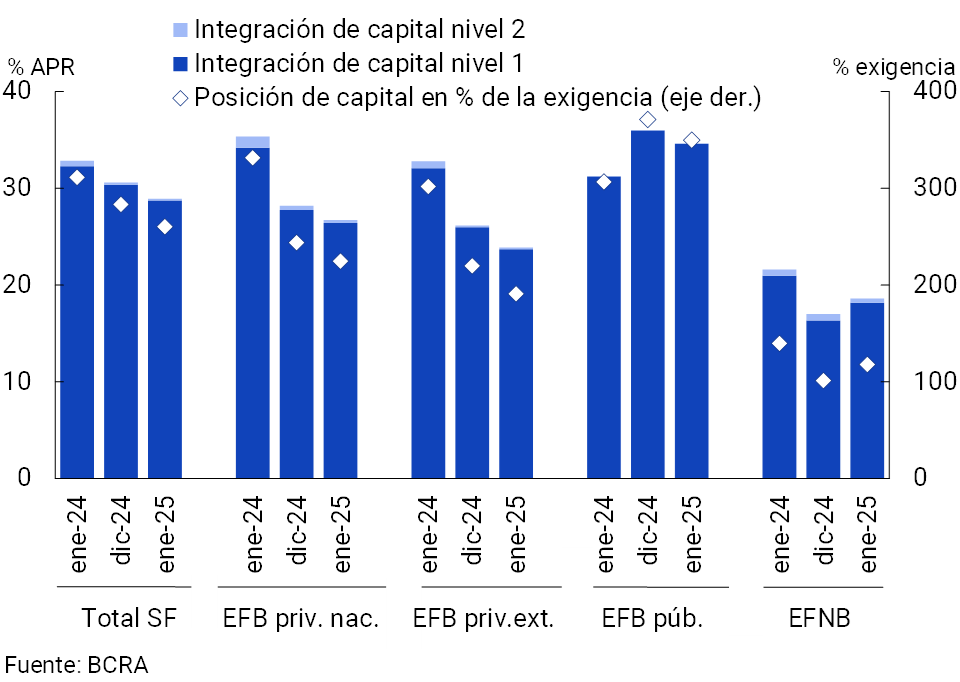
In a context of high aggregate solvency indicators, in January the capital integration (RPC) as a percentage of risk-weighted assets (RWA) fell to 28.9%, a dynamic reflected in all groups of banking entities (see Chart 12). This performance reflects the effect of a monthly increase of 2.2% in real terms in the PRC and 7.8% in real RWAs, the latter associated with the credit expansion scenario and the entry into force of the regulatory changes duly ordered by the BCRA that modified the weights for the credit risk requirement. among others12. Similarly, in the month, the capital position (CPR net of regulatory requirements) of the financial system decreased by 22.9 p.p. of the regulatory requirement to 260%13.
Figure 12 | Capital Integration
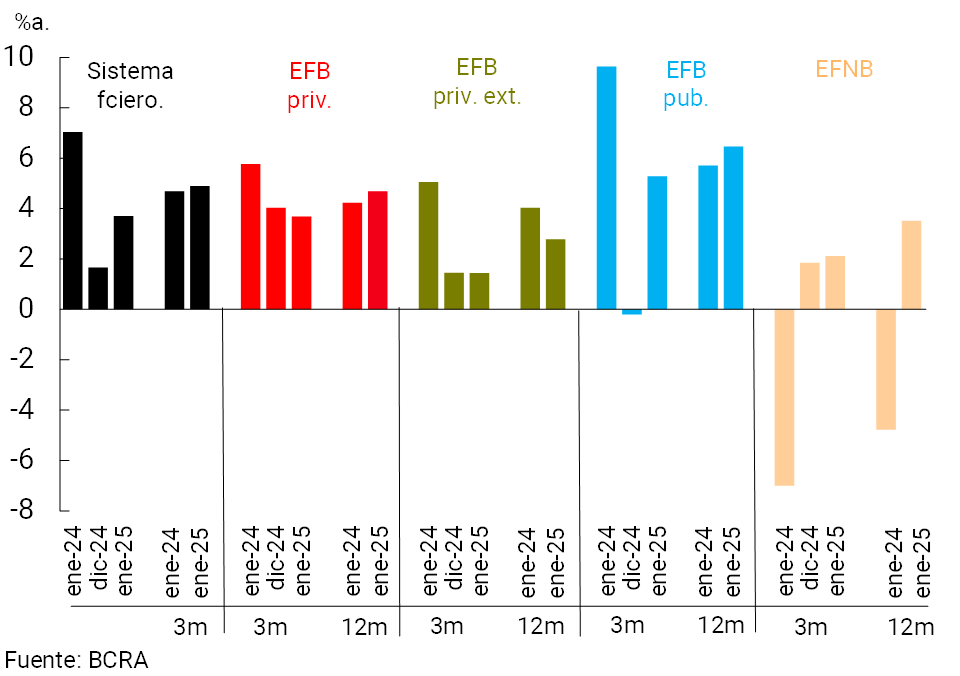
In relation to profitability, the financial system started 2025 accruing profits. In the cumulative period of the three months to January, the group of entities obtained a positive result equivalent to 3.7% annualized (a) of assets (ROA) and 15.1% y. of net worth (ROE)14. At the aggregate level, these indicators were higher than those recorded at the end of 2024, although lower when compared year-on-year (see Graph 13). For its part, in the last 12 months to January, the results of the financial system as a whole amounted to 4.9% of assets (ROE of 18.9%), slightly above the January 2024 record.
Figure 13 | 3 and 12 months
cumulative ROA By financial institution group
V. Payment system
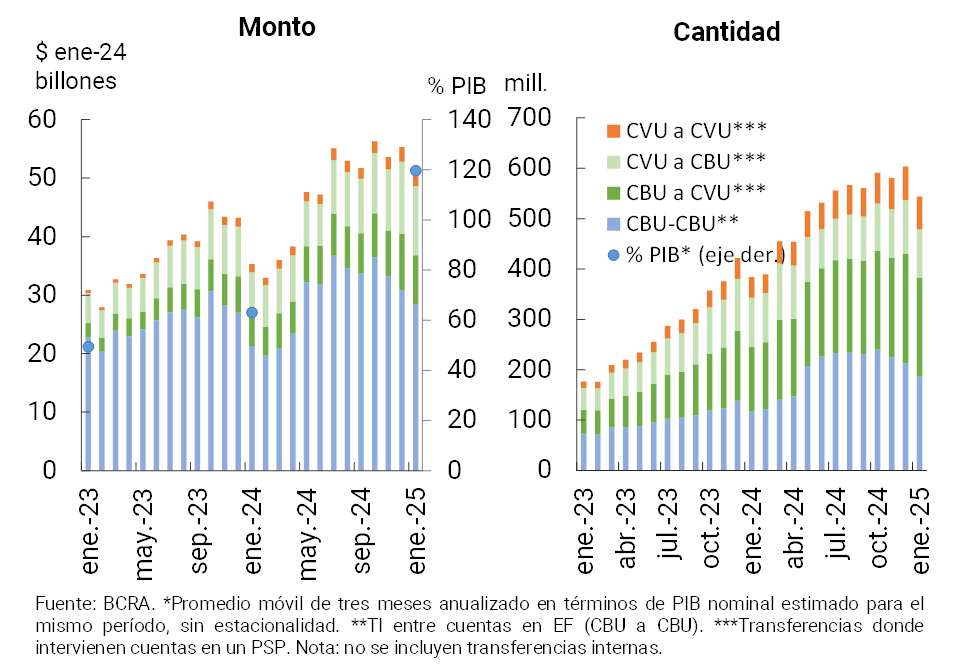
Within the framework of the seasonality typical of the beginning of the year, in January immediate transfers (TI) were reduced compared to the levels of the end of 2024. However, in the last 12 months, IT grew significantly (41.5% in quantity and 45.3% in real amounts, see Chart 14), mainly driven by transactions to and between accounts in payment service providers (CBU to CVU and CVU to CVU)15 16. In the last 12 months, IT continued to gain relevance in the economy, representing approximately 119.6% of GDP (+56.5 p.p. y.o.y.).
Figure 14 | Instant Transfers (TI)
In the month, Payment with Transfer (PCT) operations through QR codes grew 10.3% in quantities and 8.3% in real amounts. In year-on-year terms, these operations accumulated an increase of 86.7% in quantities and 73.4% in real amounts17. It is estimated that PCTs with QR grew 1.2 p.p. of GDP in the last year to total 2.6%.
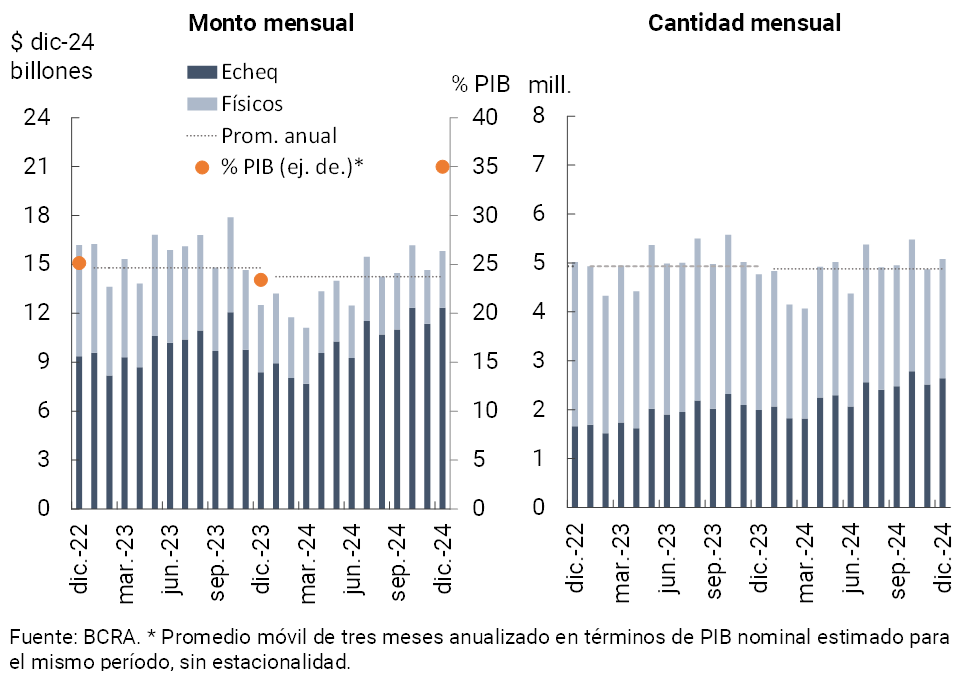
In January, the clearing of checks increased in amounts (6.4%) and in real amounts (16.4%) compared to the previous month (see Graph 15)18. ECHEQs continued to consolidate themselves as the predominant modality, with a growth of 38.2% YoY in quantities and 54.2% YoY in real amounts. Based on this performance, ECHEQs already represent 58.2% of the amount and 74.9% of the total amounts compensated. This advance in the use of ECHEQs contributed to the increase in the weight of cheque clearing in the economy, which in the last three months represented approximately 37.6% of GDP (+15.8 p.p. y.o.y.).
Figure 15 | Check clearing
The ratio of rejection of checks due to lack of funds (measured in terms of the total compensated) showed an increase compared to the previous month both in amounts (+0.13 p.p.) and in real amounts (+0.02 p.p.), to stand at 0.9% and 0.56%, respectively. Both records are slightly above the average observed so far in 2024 and also compared to the same month of the previous year (+0.34 p.p. in quantities and +0.21 p.p. in amounts)
References
1 The decrease in the balance of credit to the public sector in foreign currency was partly associated with the amortization of a space in that denomination (mainly in public financial institutions).
2 Changes in balance sheet (not seasonally adjusted). Includes principal adjustments and accrued interest.
3 In January, the balance of credit to the private sector in foreign currency accumulated an increase of 219.4% YoY—in the currency of origin—.
4 Financing to companies is defined here as that granted to legal entities and commercial financing granted to natural persons. On the other hand, loans to families are considered to be those granted to individuals, unless they are for commercial purposes.
5 The dynamics of time deposits were mainly explained by the time investments of Money Market Mutual Funds.
6 Considering both financing to the non-financial public sector and the BCRA’s instruments.
7 Includes off-balance sheet foreign currency forward purchase and sale transactions. Liabilities include deposits that have variable remuneration depending on the evolution of the exchange rate – associated with the Export Increase Programme – and LEDIV are included in assets.
8 When deducting the balance of forecasts, in January total credit to the private sector stood at 35.3% of assets (+0.9 p.p. monthly and +14.6 p.p. y.o.y.).
9 Complementing the information provided by the irregularity ratio on credit risk, the Estimated Probability of Default (EDP) for credit to the private sector stood at 0.83% (in terms of balances) in January, increasing slightly in the month and in year-on-year terms. In the corporate lending segment, the PDE totaled 0.30%, without significant changes compared to December. For its part, the PDE for credit to families reached 1.49% in the month, slightly above the end of 2024. In terms of quantity, in the period the EDP increased slightly in all segments.
10 It considers availabilities (cash and current account at the BCRA), fiscal liquidity bills (LEFI), and the balance of the types of public securities that the entities compute as integration of Minimum Cash (until mid-2024 it also incorporated BCRA instruments).
11 When additionally considering the holding of LECAP whose residual term is less than 3 months, the broad indicator of liquidity in national currency would amount to 44.1% of deposits in pesos at the systemic level (+2.9 p.p. compared to the end of 2024).
12 See Communication “A” 8067 and Regulatory Developments Jul-24.
13 The capital position in terms of the balance of credit to the private sector (net of forecasts) totaled 42.9% at the systemic level.
14 Includes comprehensive income in homogeneous currency.
15 In year-on-year terms as of January, the amount of IT among CVUs increased 58.2% (105.8% in real amounts), while those among CBUs grew 59.9% (31.7% in real amounts). On the other hand, operations between CBU and CVU increased 52.6% year-on-year (74.2% in real amounts), while those between CVU and CBU showed a slight drop of 1.7% year-on-year, although with an increase of 52.2% in real amounts.
16 In January, the average value of IT was $146,100.
17 In January, the average value of PCTs through QR codes was $16,800.
18 In January, the average amount of the cleared check was $3.4 million ($1.8 million in the physical format and $4.8 million in ECHEQs).
Share on


