I. Recent measures1
In order to continue improving the experience of users of financial services and promoting banking penetration, the BCRA recently provided that automated offices may offer meeting spaces and other goods and services provided by third parties (for example, a cafeteria or bookstore)2.
In order to facilitate the implementation of investment projects and provide liquidity to the instruments, in February the purchase by financial institutions of debt instruments created within the framework of Law 27,328 on Public-Private Partnership Contracts was excluded from the BCRA’s prior authorization process (but not from the limits on financing to the public sector). in which the holder has the right to collect on a flow of funds in charge of the national public sector. In addition, the pledge or assignment as a guarantee of the income from this type of contract was admitted as preferred guarantee “B” 3.
In line with the recommendations of the Basel Committee on Banking Supervision, in February it was established that, within the framework of the Internal Capital Adequacy Assessment Process (ICAAP), financial institutions of relatively smaller size (groups “B” and “C”4) may choose to apply internal models or a simplified methodology. to the extent that they meet certain parameters5.
In February, the deposit guarantee insurance system was modified, which includes demand deposits in which interest rates are agreed upon, up to the level of the average rate for time deposits published by the BCRA. In the case of time deposits and investments, they are included in the insurance system if rates of up to 1.3 times the average rate are agreed, or that rate plus 5 p.p. (the higher of the two)6.
Within the framework of the implementation of the IFRS standards detailed in the following section, the BCRA’s prior authorization for the distribution of profitswas eliminated with effect from 2020 7. In order to avoid duplication in procedures, in line with what has been observed in the member countries of the Basel Committee, entities may distribute profits without the prior authorization of the BCRA, to the extent that they comply with the Basel III “Buffer” and other minimum liquidity and solvency requirements. In 2018 and 2019, entities must add one percentage point to the aforementioned “buffer” if they want to distribute profits without the need for prior authorization from the BCRA.
II. Balance sheets according to International Financial Reporting Standards (IFRS)
Based on the requirement established by the BCRA, since January 2018 the balance sheets of financial institutions must be presented in accordance with International Financial Reporting Standards (IFRS), using criteria that bring accounting closer to economic reality. This decision was adopted as part of Argentina’s commitment as a member of the G20 to converge towards international standards, allowing a harmonious association of the balance sheet data of the entities with the Basel III recommendations8.
The application of IFRS in Argentina resulted in an increase in net equity for most financial institutions. The most significant change occurred in the category of goods for use, mainly from the estimate of the revaluation of real estate. The initial changes due to the application of IFRS were reflected in the balance sheet accounts created for this purpose – new items that make up equity – and whose counterpart is in assets or liabilities. The sum of these new accounts implied an increase of 10.4% in net worth for the aggregate financial system compared to December 20179.
It should be noted, in particular, that the main changes in the narrative of transactions that generated double recording on bank balance sheets were already taken into account in the analysis carried out in the Bank Report. For example, double posting that was performed in pass-through transactions for entities was cleaned up when calculating net assets and liabilities10.
III. Activity
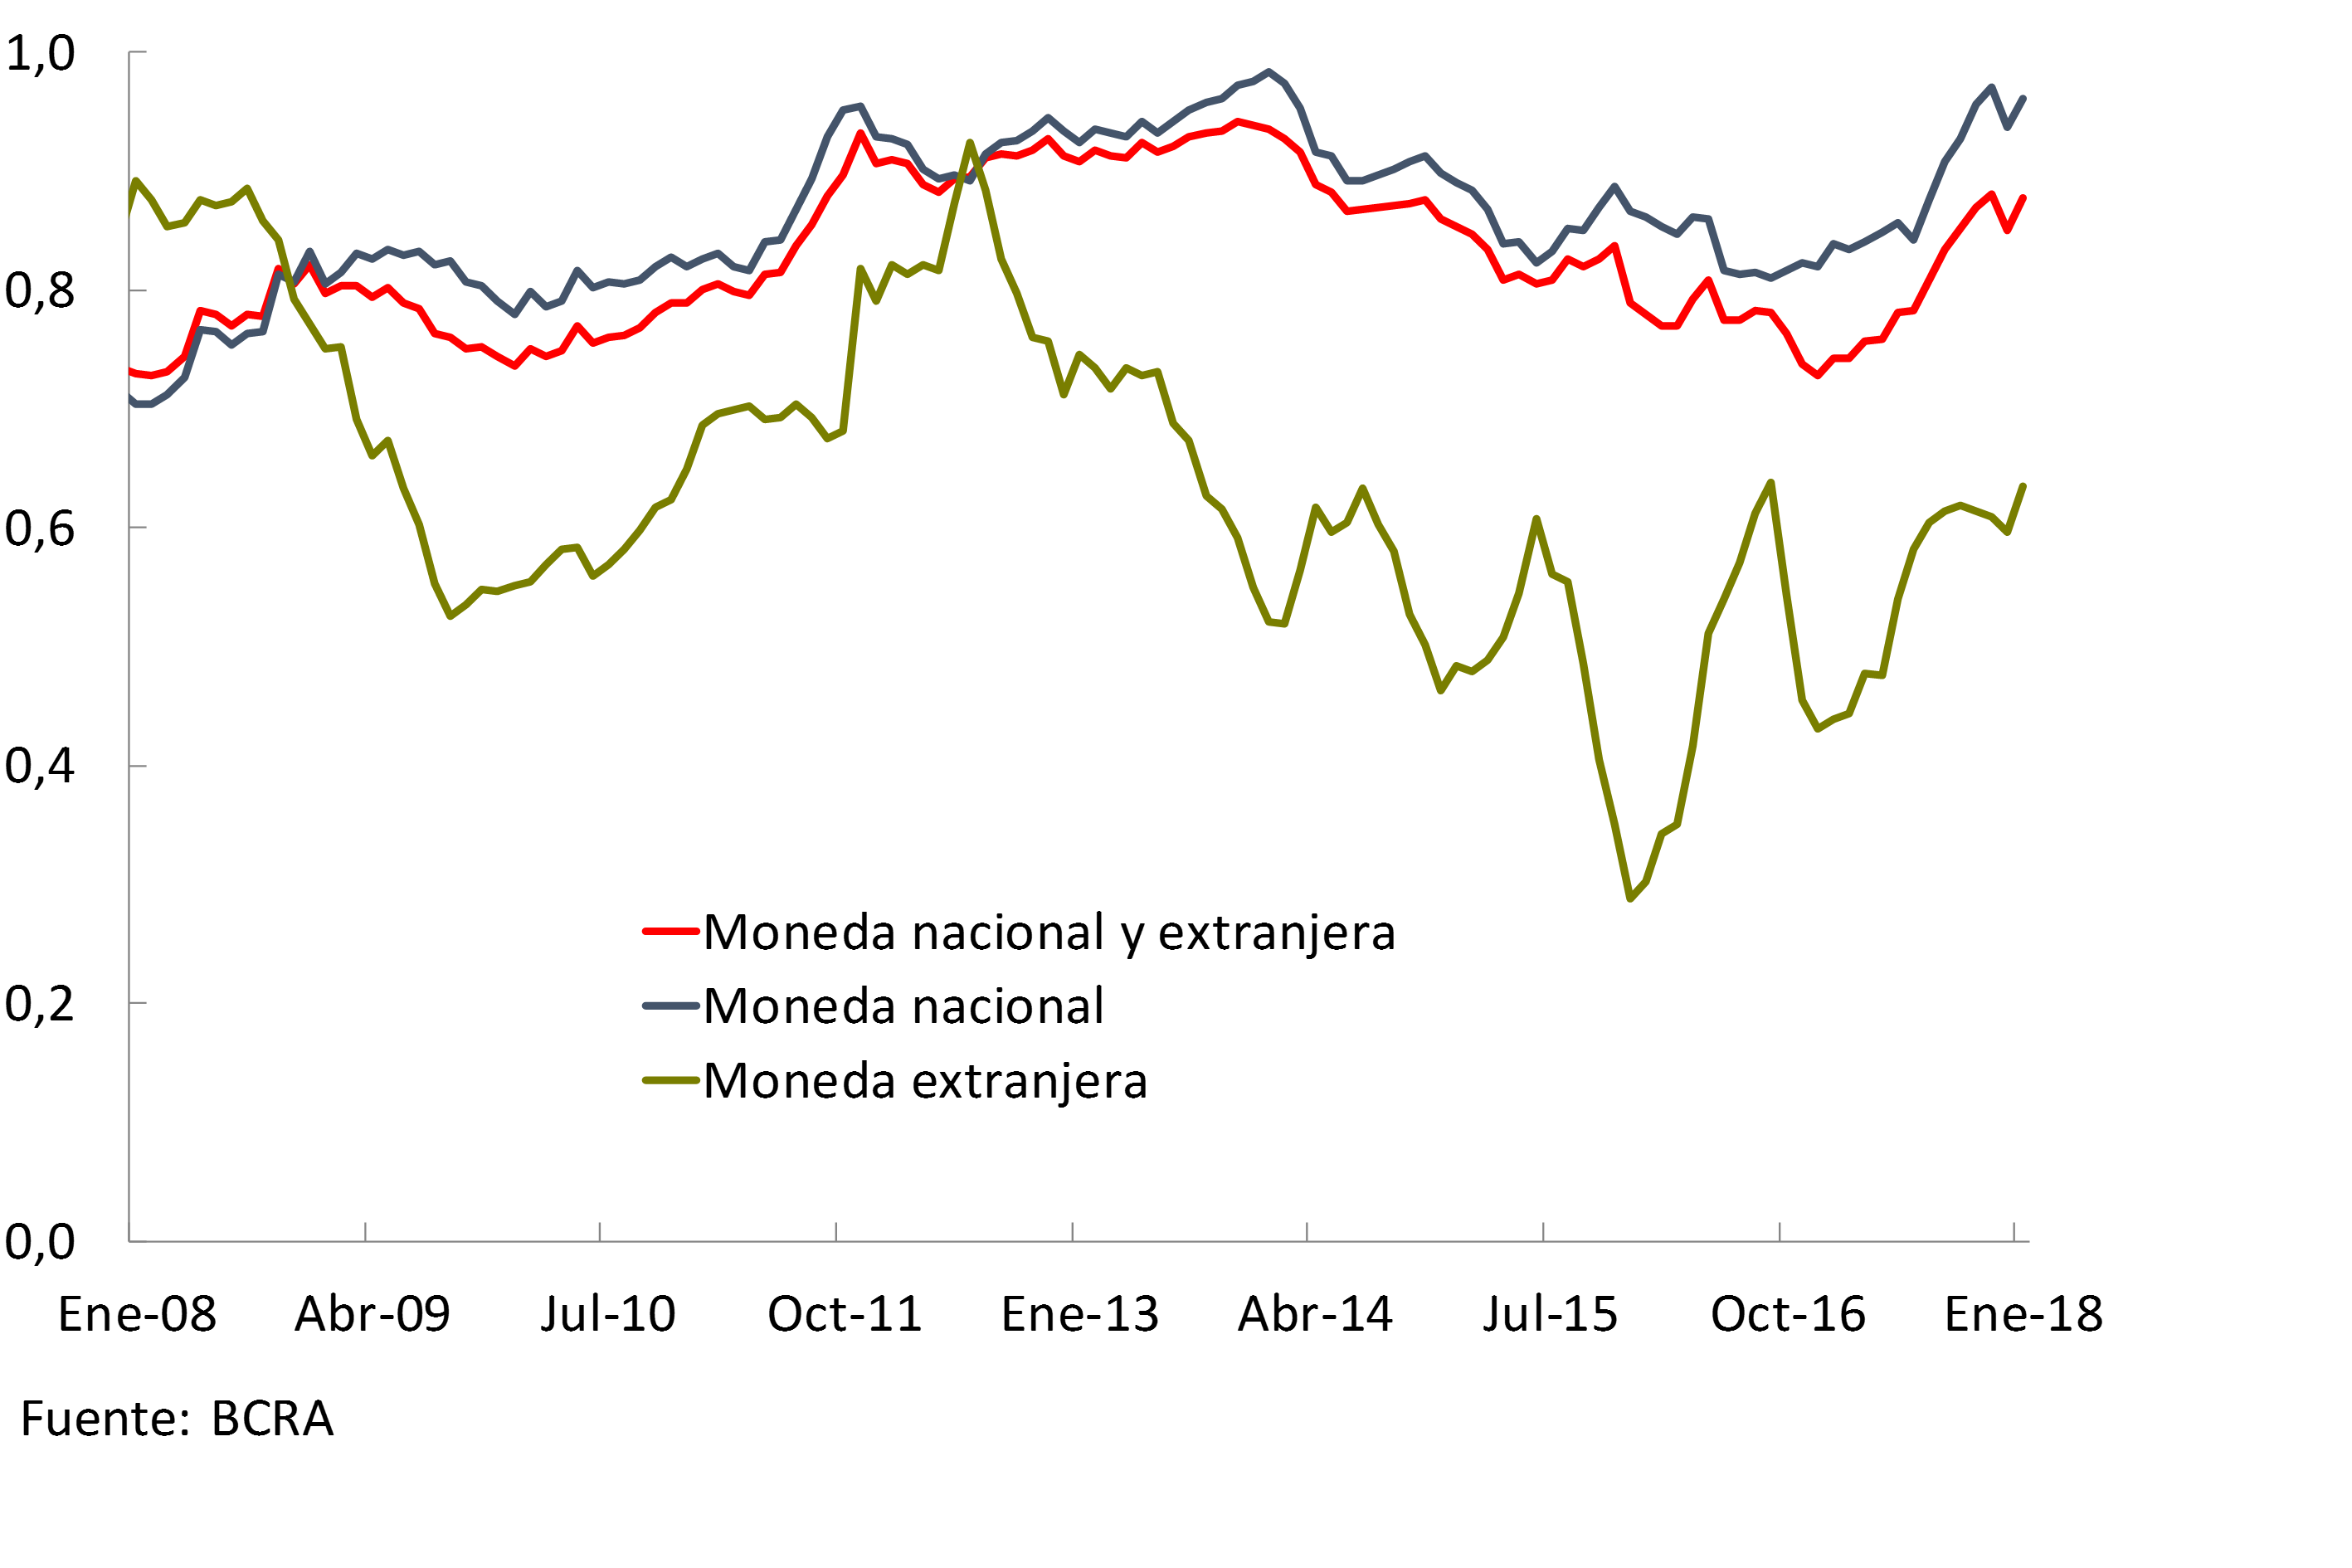
As usual during the summer recess, the growth rate of financial intermediation with the private sector moderated slightly in January. In this context, loans to the private sector had a better relative performance with respect to deposits in this sector, with a further increase in the ratio between these balances (see Graph 1). Loans to the private sector accounted for 88% of deposits in this sector, increasing 3 p.p. compared to last December and 13 p.p. compared to January 2017.
Graph 1 | Loans in Deposit Terms – Balance Sheet Balances of the Financial System – Private Sector
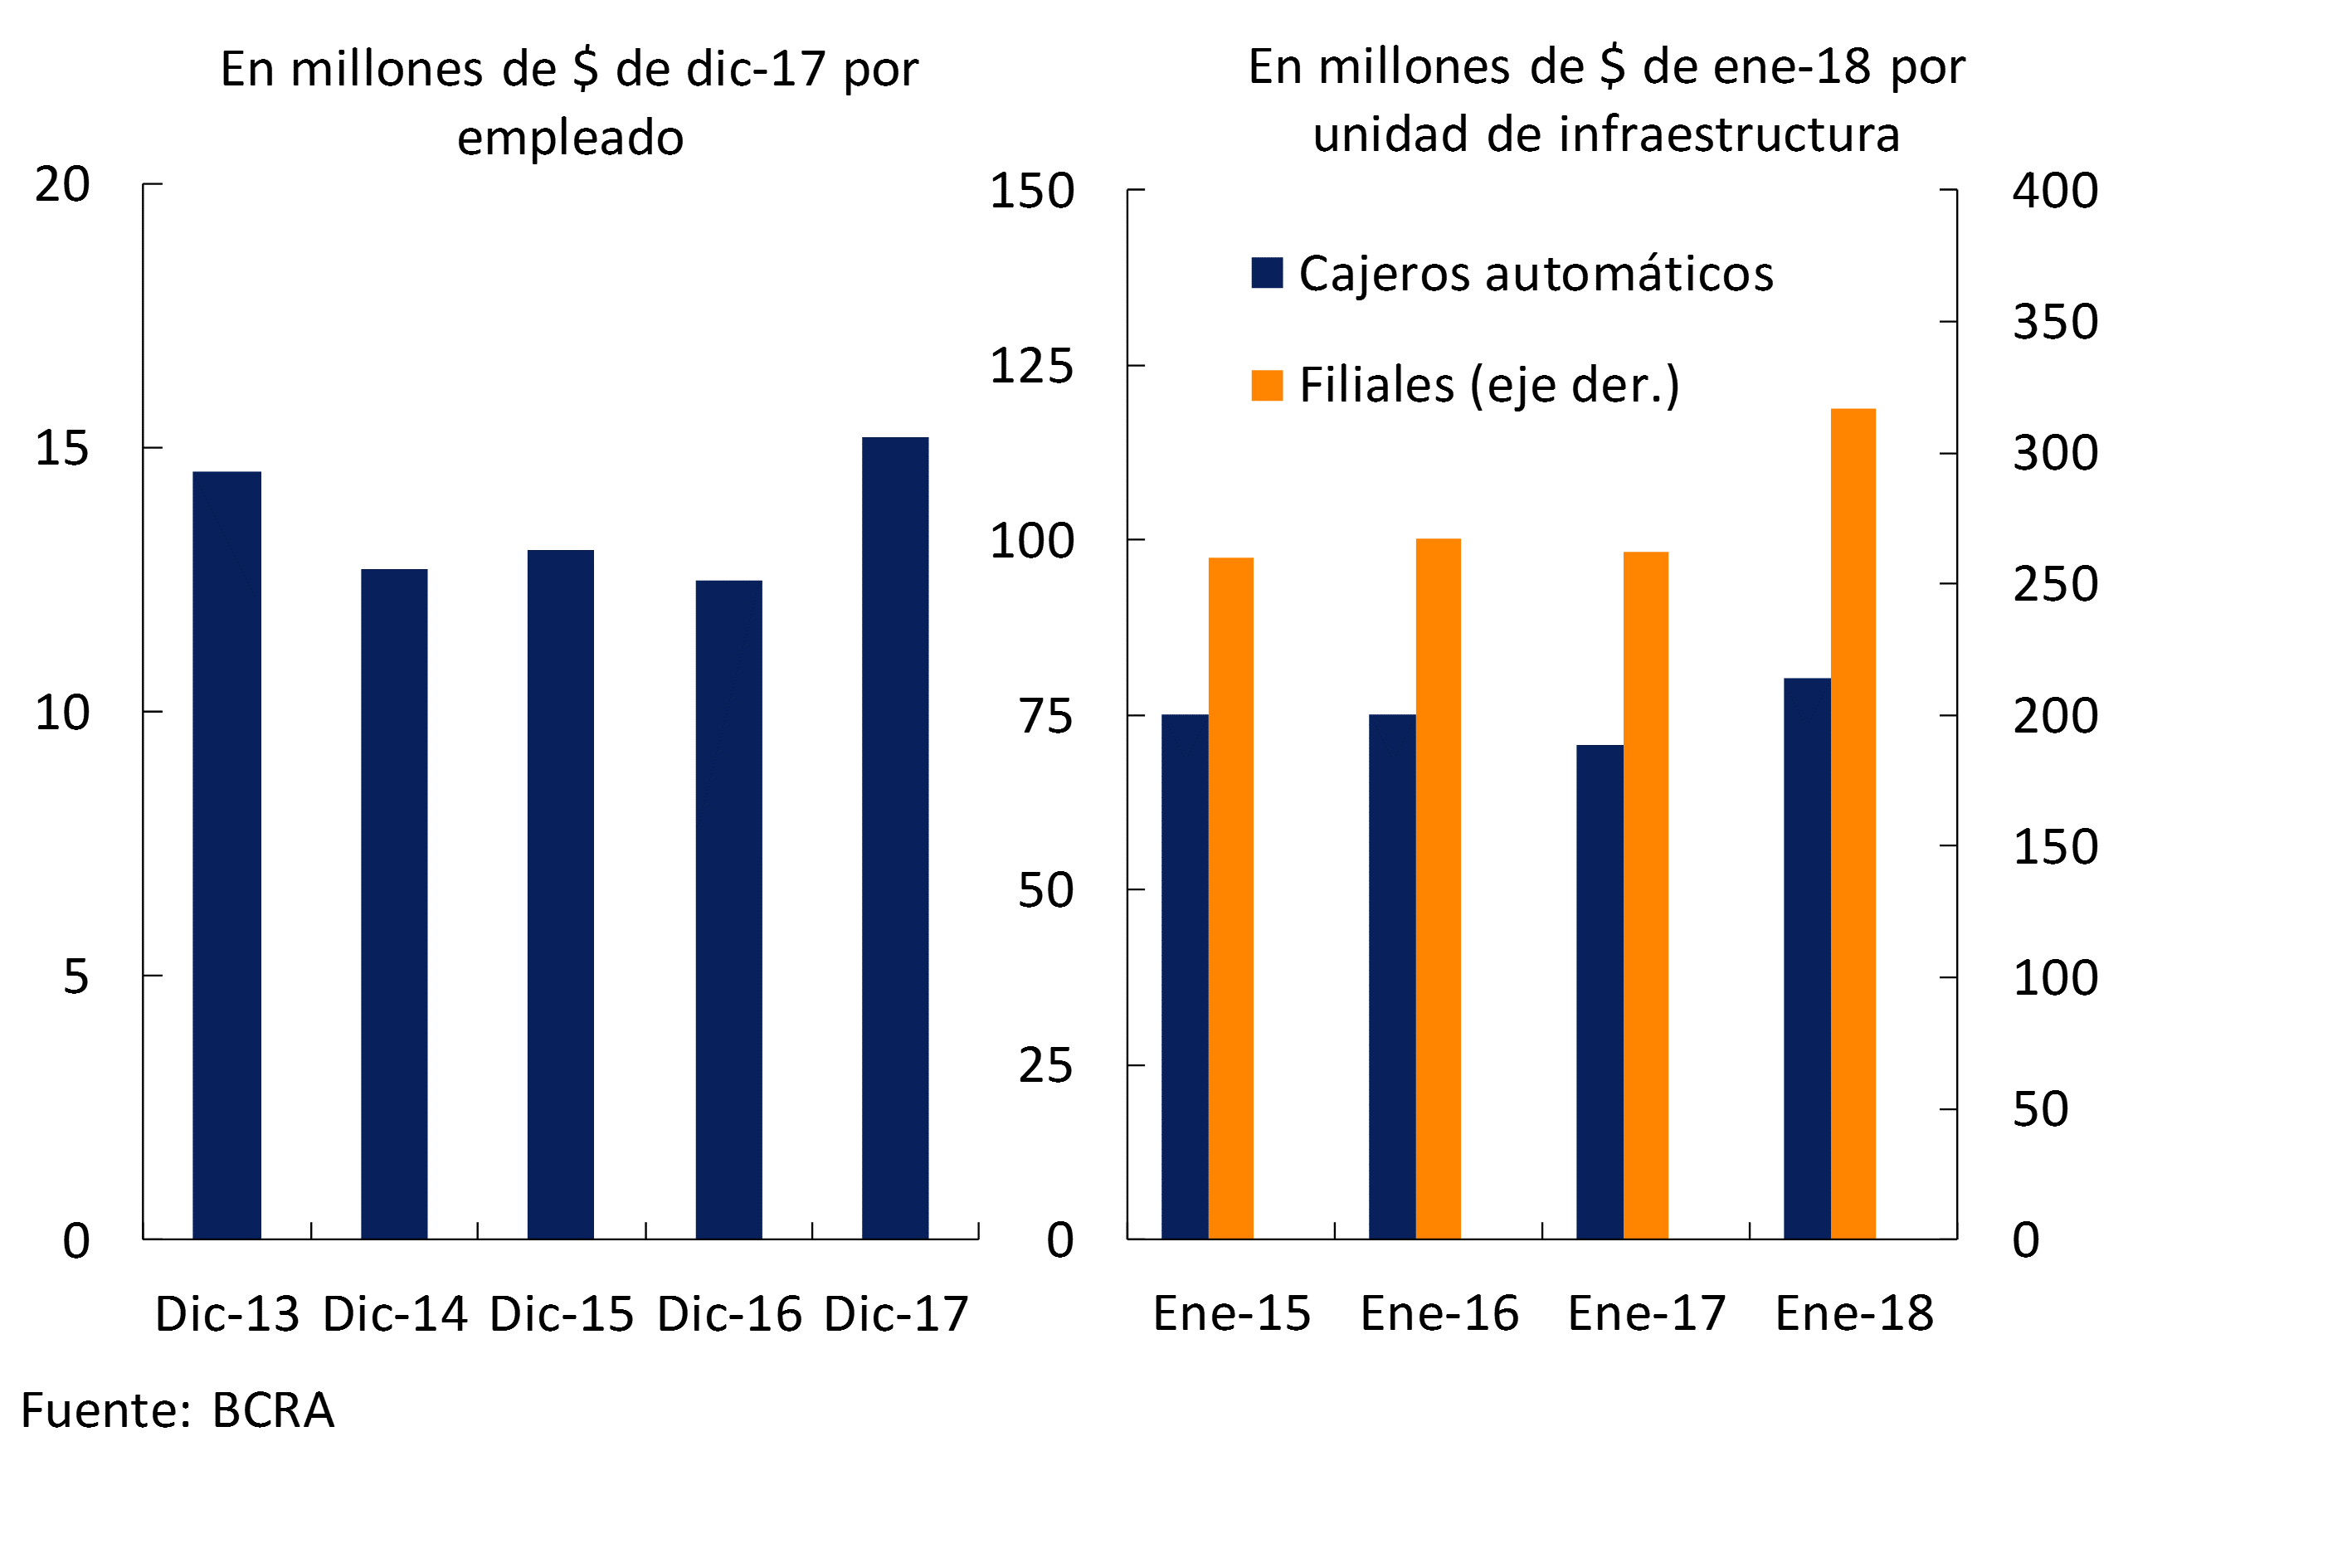
Over the last 12 months, the evolution of the operational infrastructure of the financial system was mainly associated with the expansion of ATMs (+7% YoY), in a context in which subsidiaries and employment did not present major changes. Given the expansion of financial intermediation with the private sector, the ratios between the real balance of credit and employment, branches and ATMs grew in a year-on-year comparison (see Chart 2).
Graph 2 | Lending to the Private Sector in Terms of Staffing and Operational Infrastructure
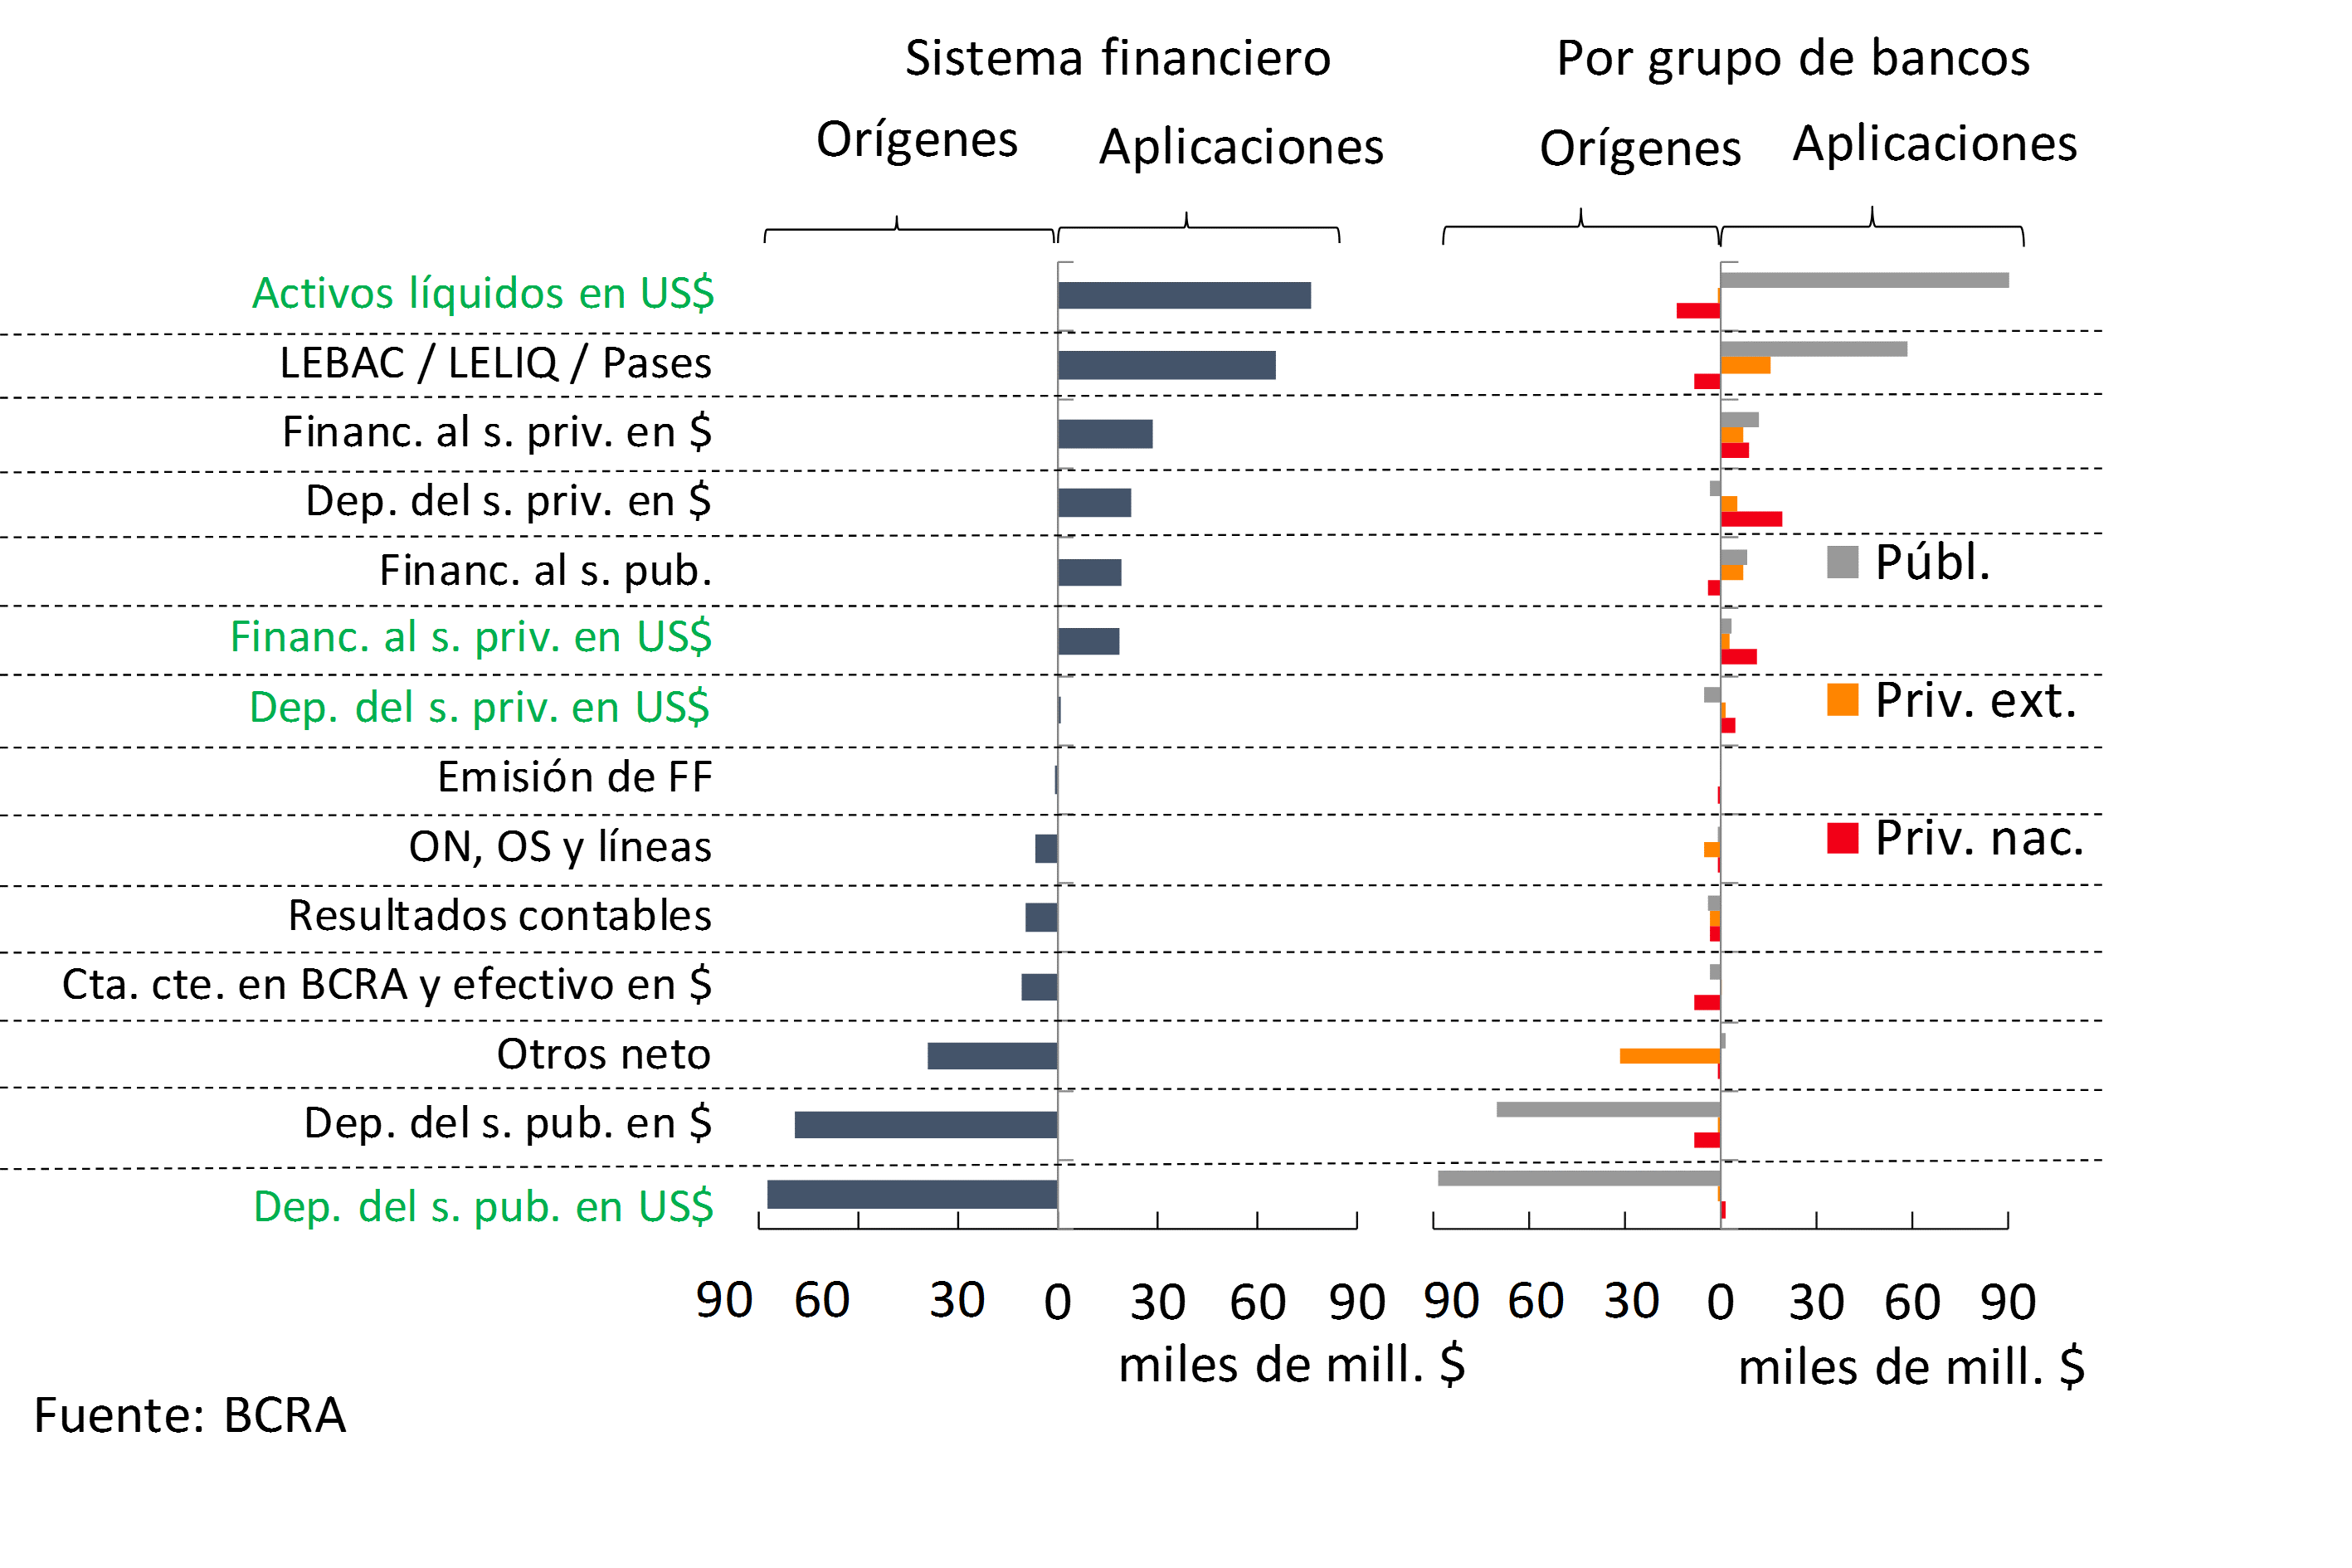
Considering the estimate of the monthly cash flow11 for items in national currency, in January the increase in public sector deposits12 ($78,700 million) was the main source of resources for the financial system (see Graph 3). These funds were mainly applied to the constitution of liquid assets with yields (a set formed by LEBACs, LELIQs and passes with the BCRA, for about $66,000 million13). On the other hand, considering the monthly flow of funds for the segment in foreign currency, the increase in public sector deposits14 was the most relevant source of resources for the month ($87,000 million). This funding was mainly used in the increase of liquid assets in foreign currency ($76,500 million). The main flows of resources in the month, both in domestic and foreign currency, were explained by the performance of public banks.
Graph 3 | Monthly Cash Flow Estimate
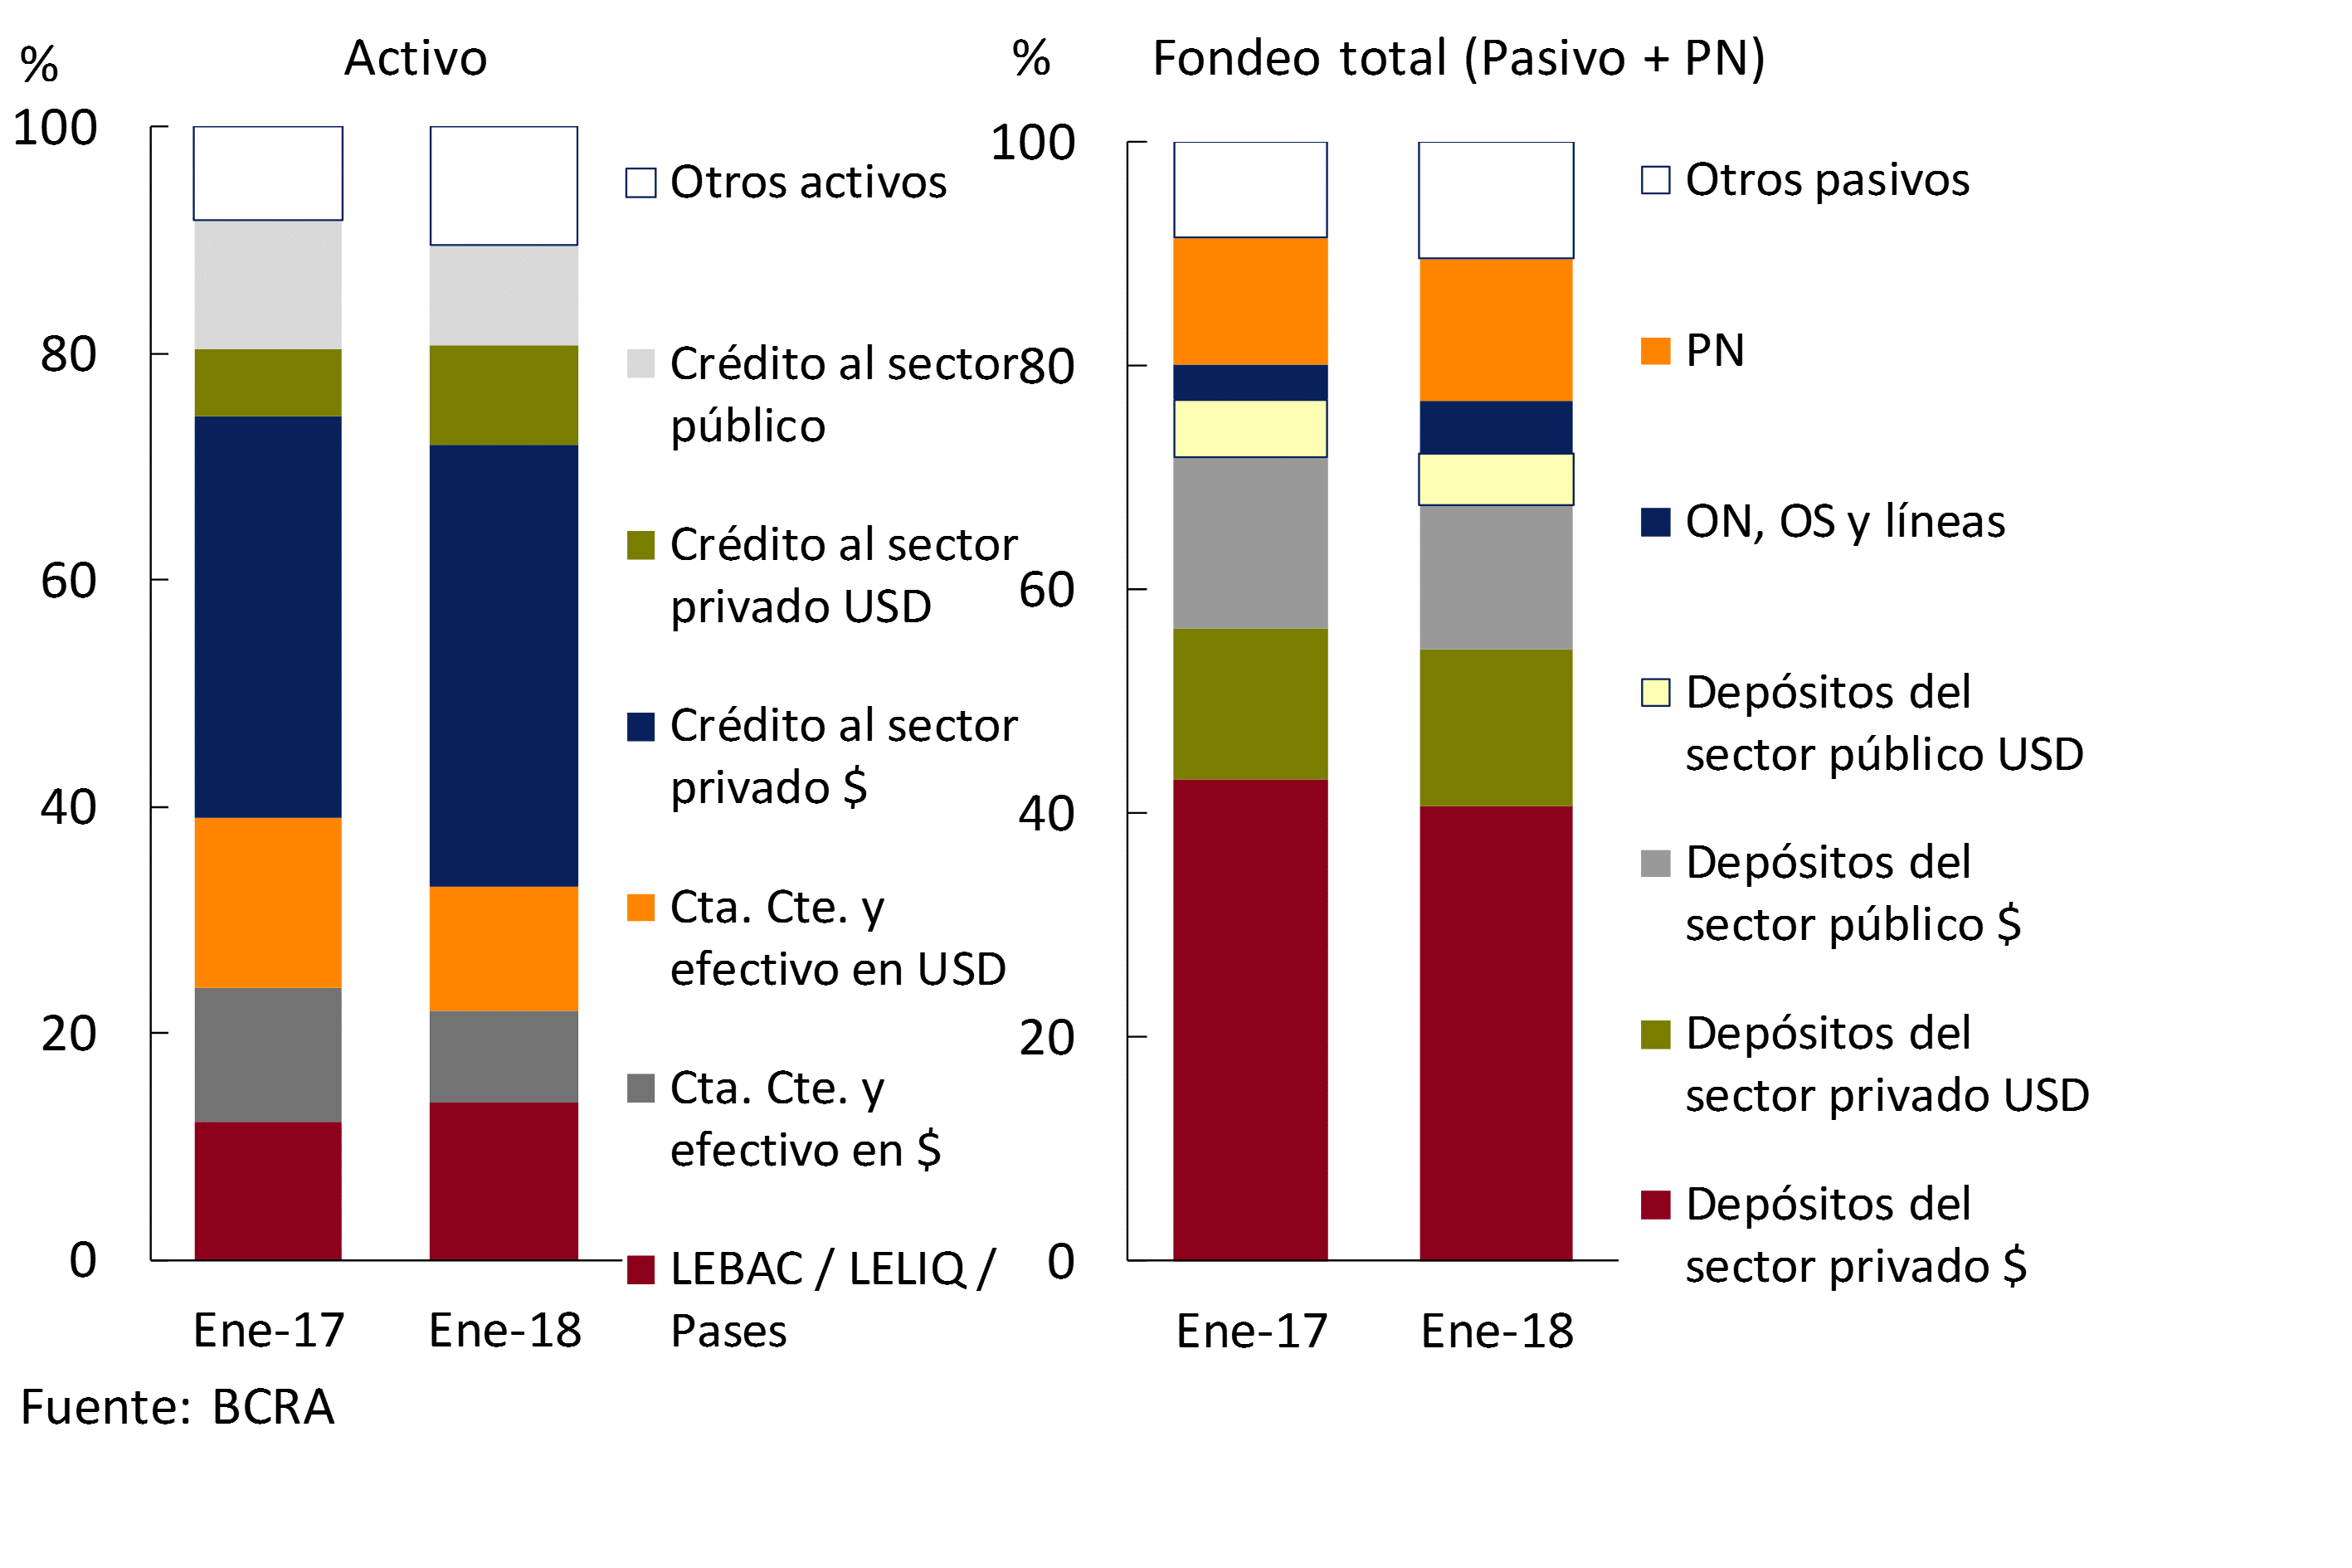
When making a year-on-year comparison of the changes in the composition of assets, credit to the private sector in domestic and foreign currency gained relevance within net assets to the detriment of liquid assets (see Chart 4)15. Among the components of funding, the relative year-on-year increase in the balance of foreign notes, OS, and lines of equity and net worth stood out, with a decrease in the importance of deposits in pesos (both in the public and private sectors).
Figure 4 | Composition of Net Assets and Liabilities
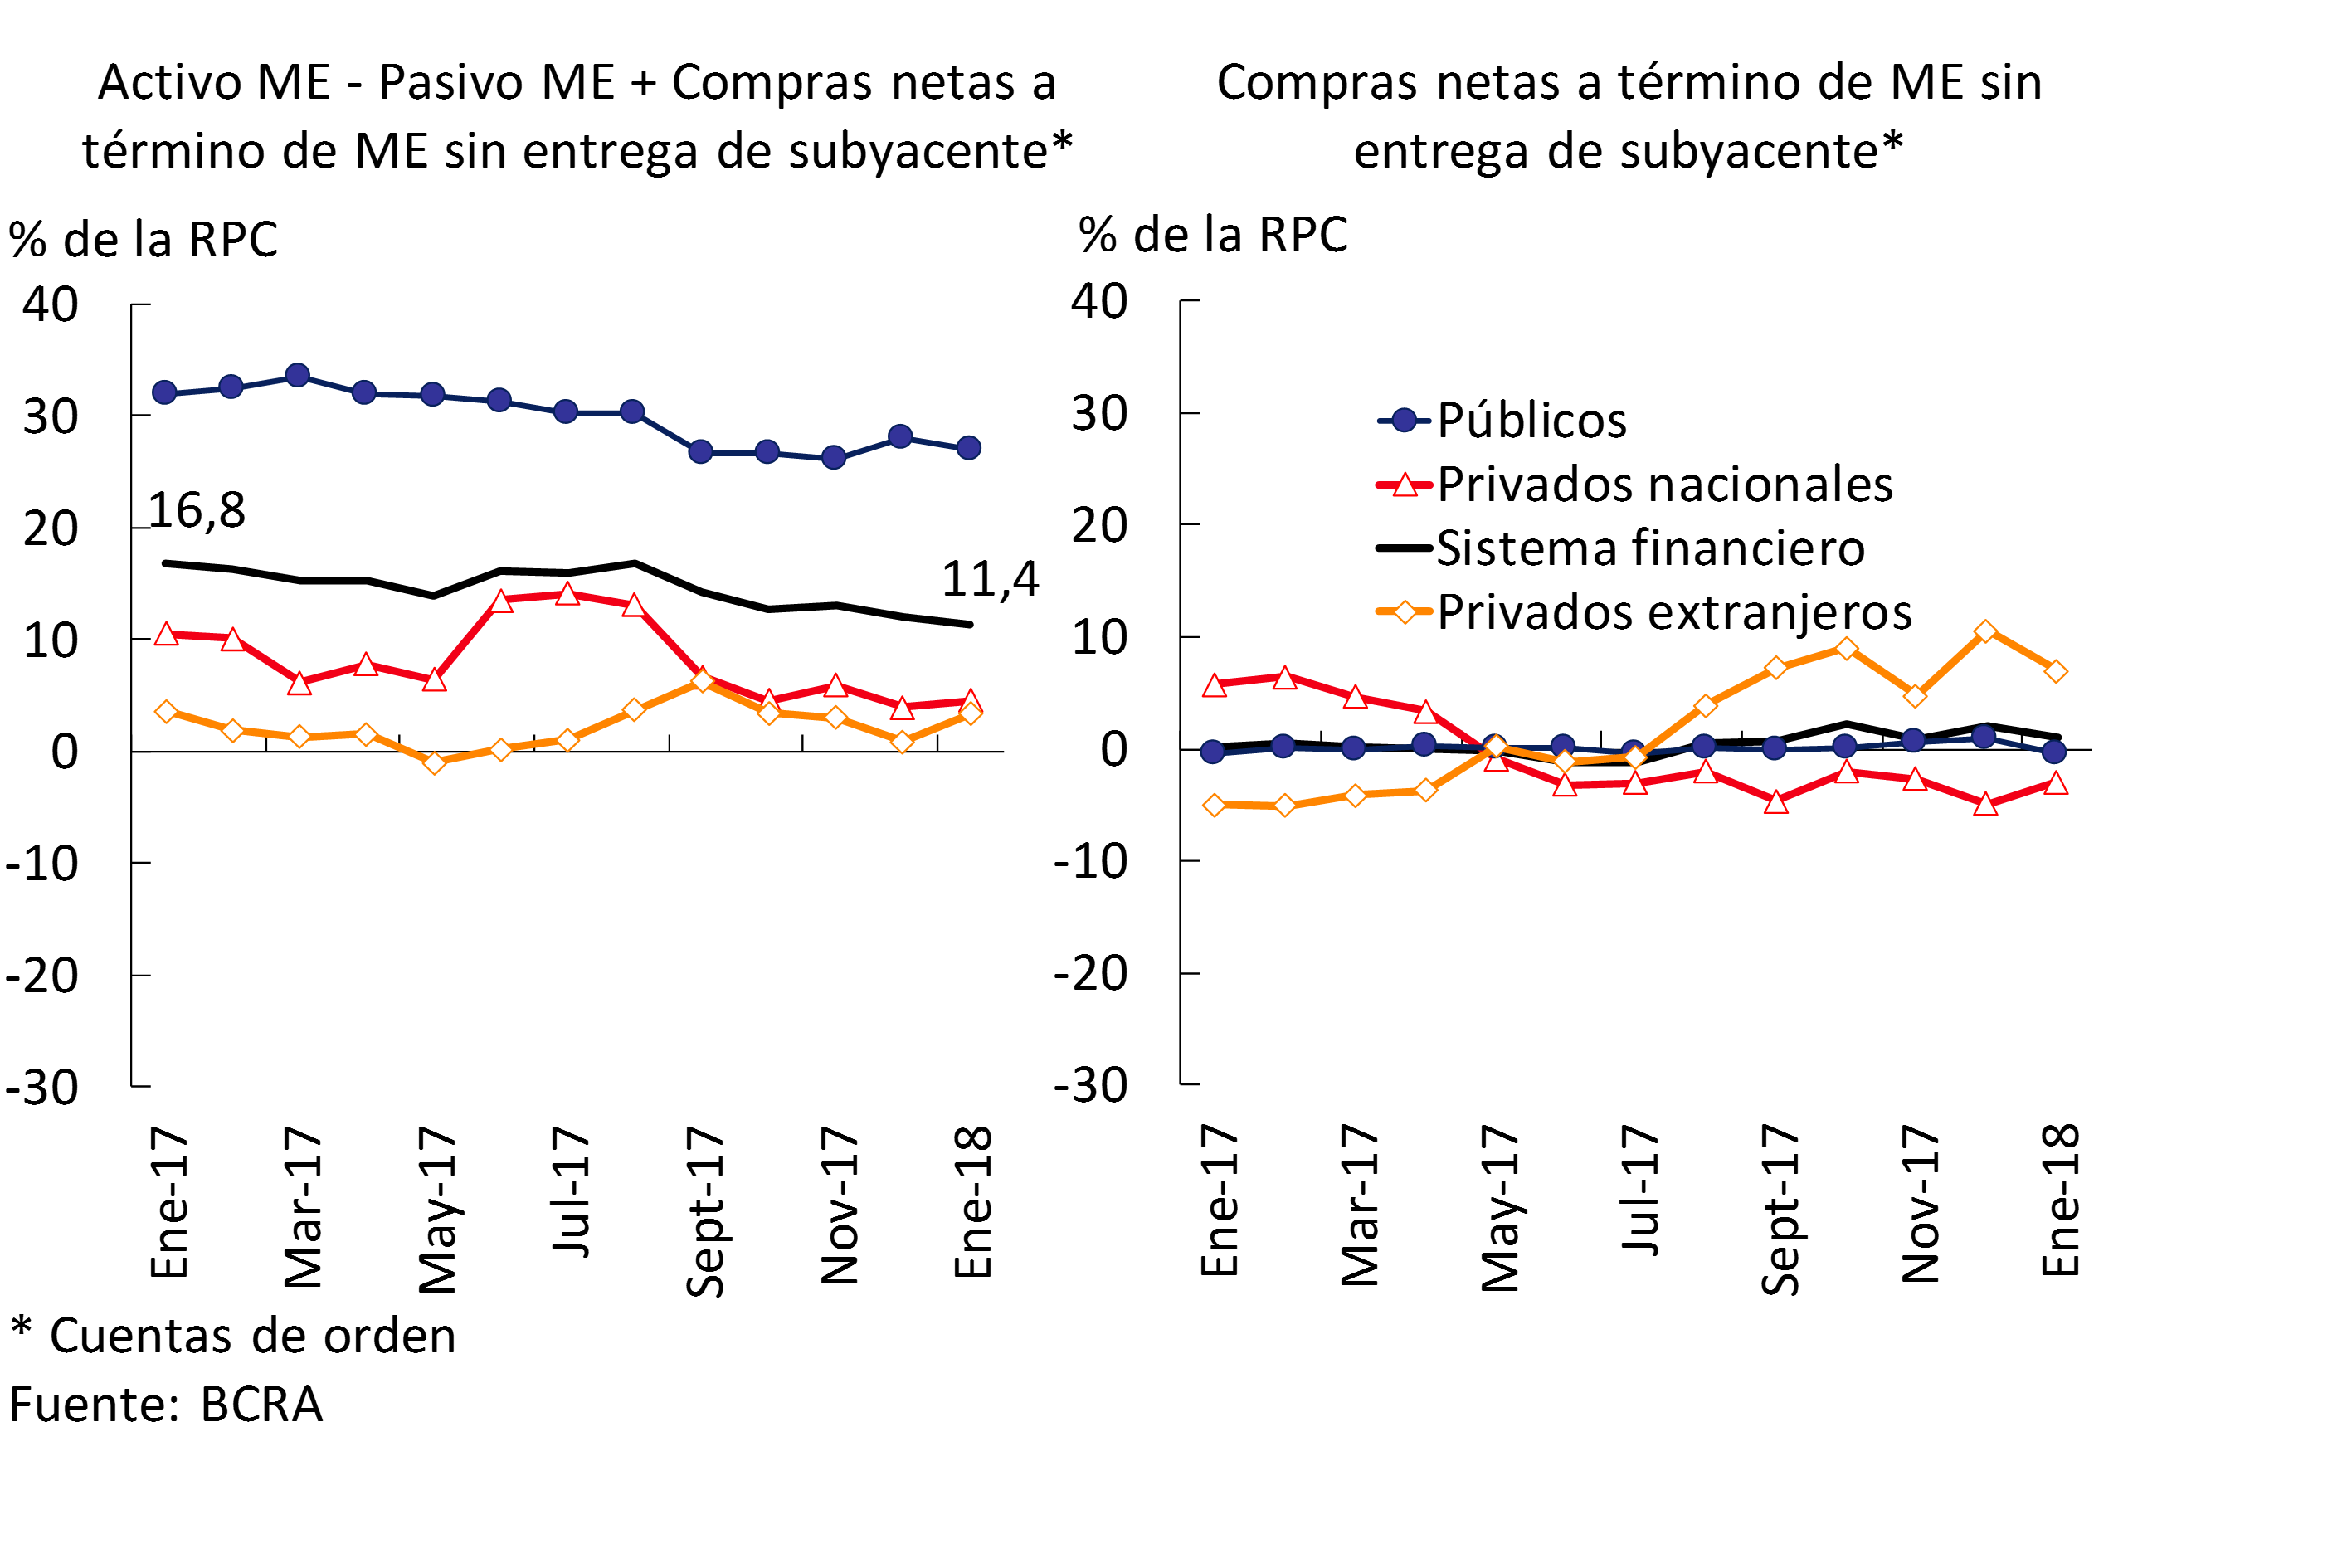
At the beginning of 2018, equity mismatches in the financial system continued to be moderate. The mismatch in foreign currency assets of the banks as a whole represented 11.4% of the Computable Patrimonial Liability (CPR) in January, 0.7 p.p. below the December figure and 5.4 p.p. less than the value of a year ago (see Graph 5). For its part, the estimated spread between assets and liabilities adjusted for CER stood at 31% of the PRC.
Graph 5 | Foreign Currency Mismatch
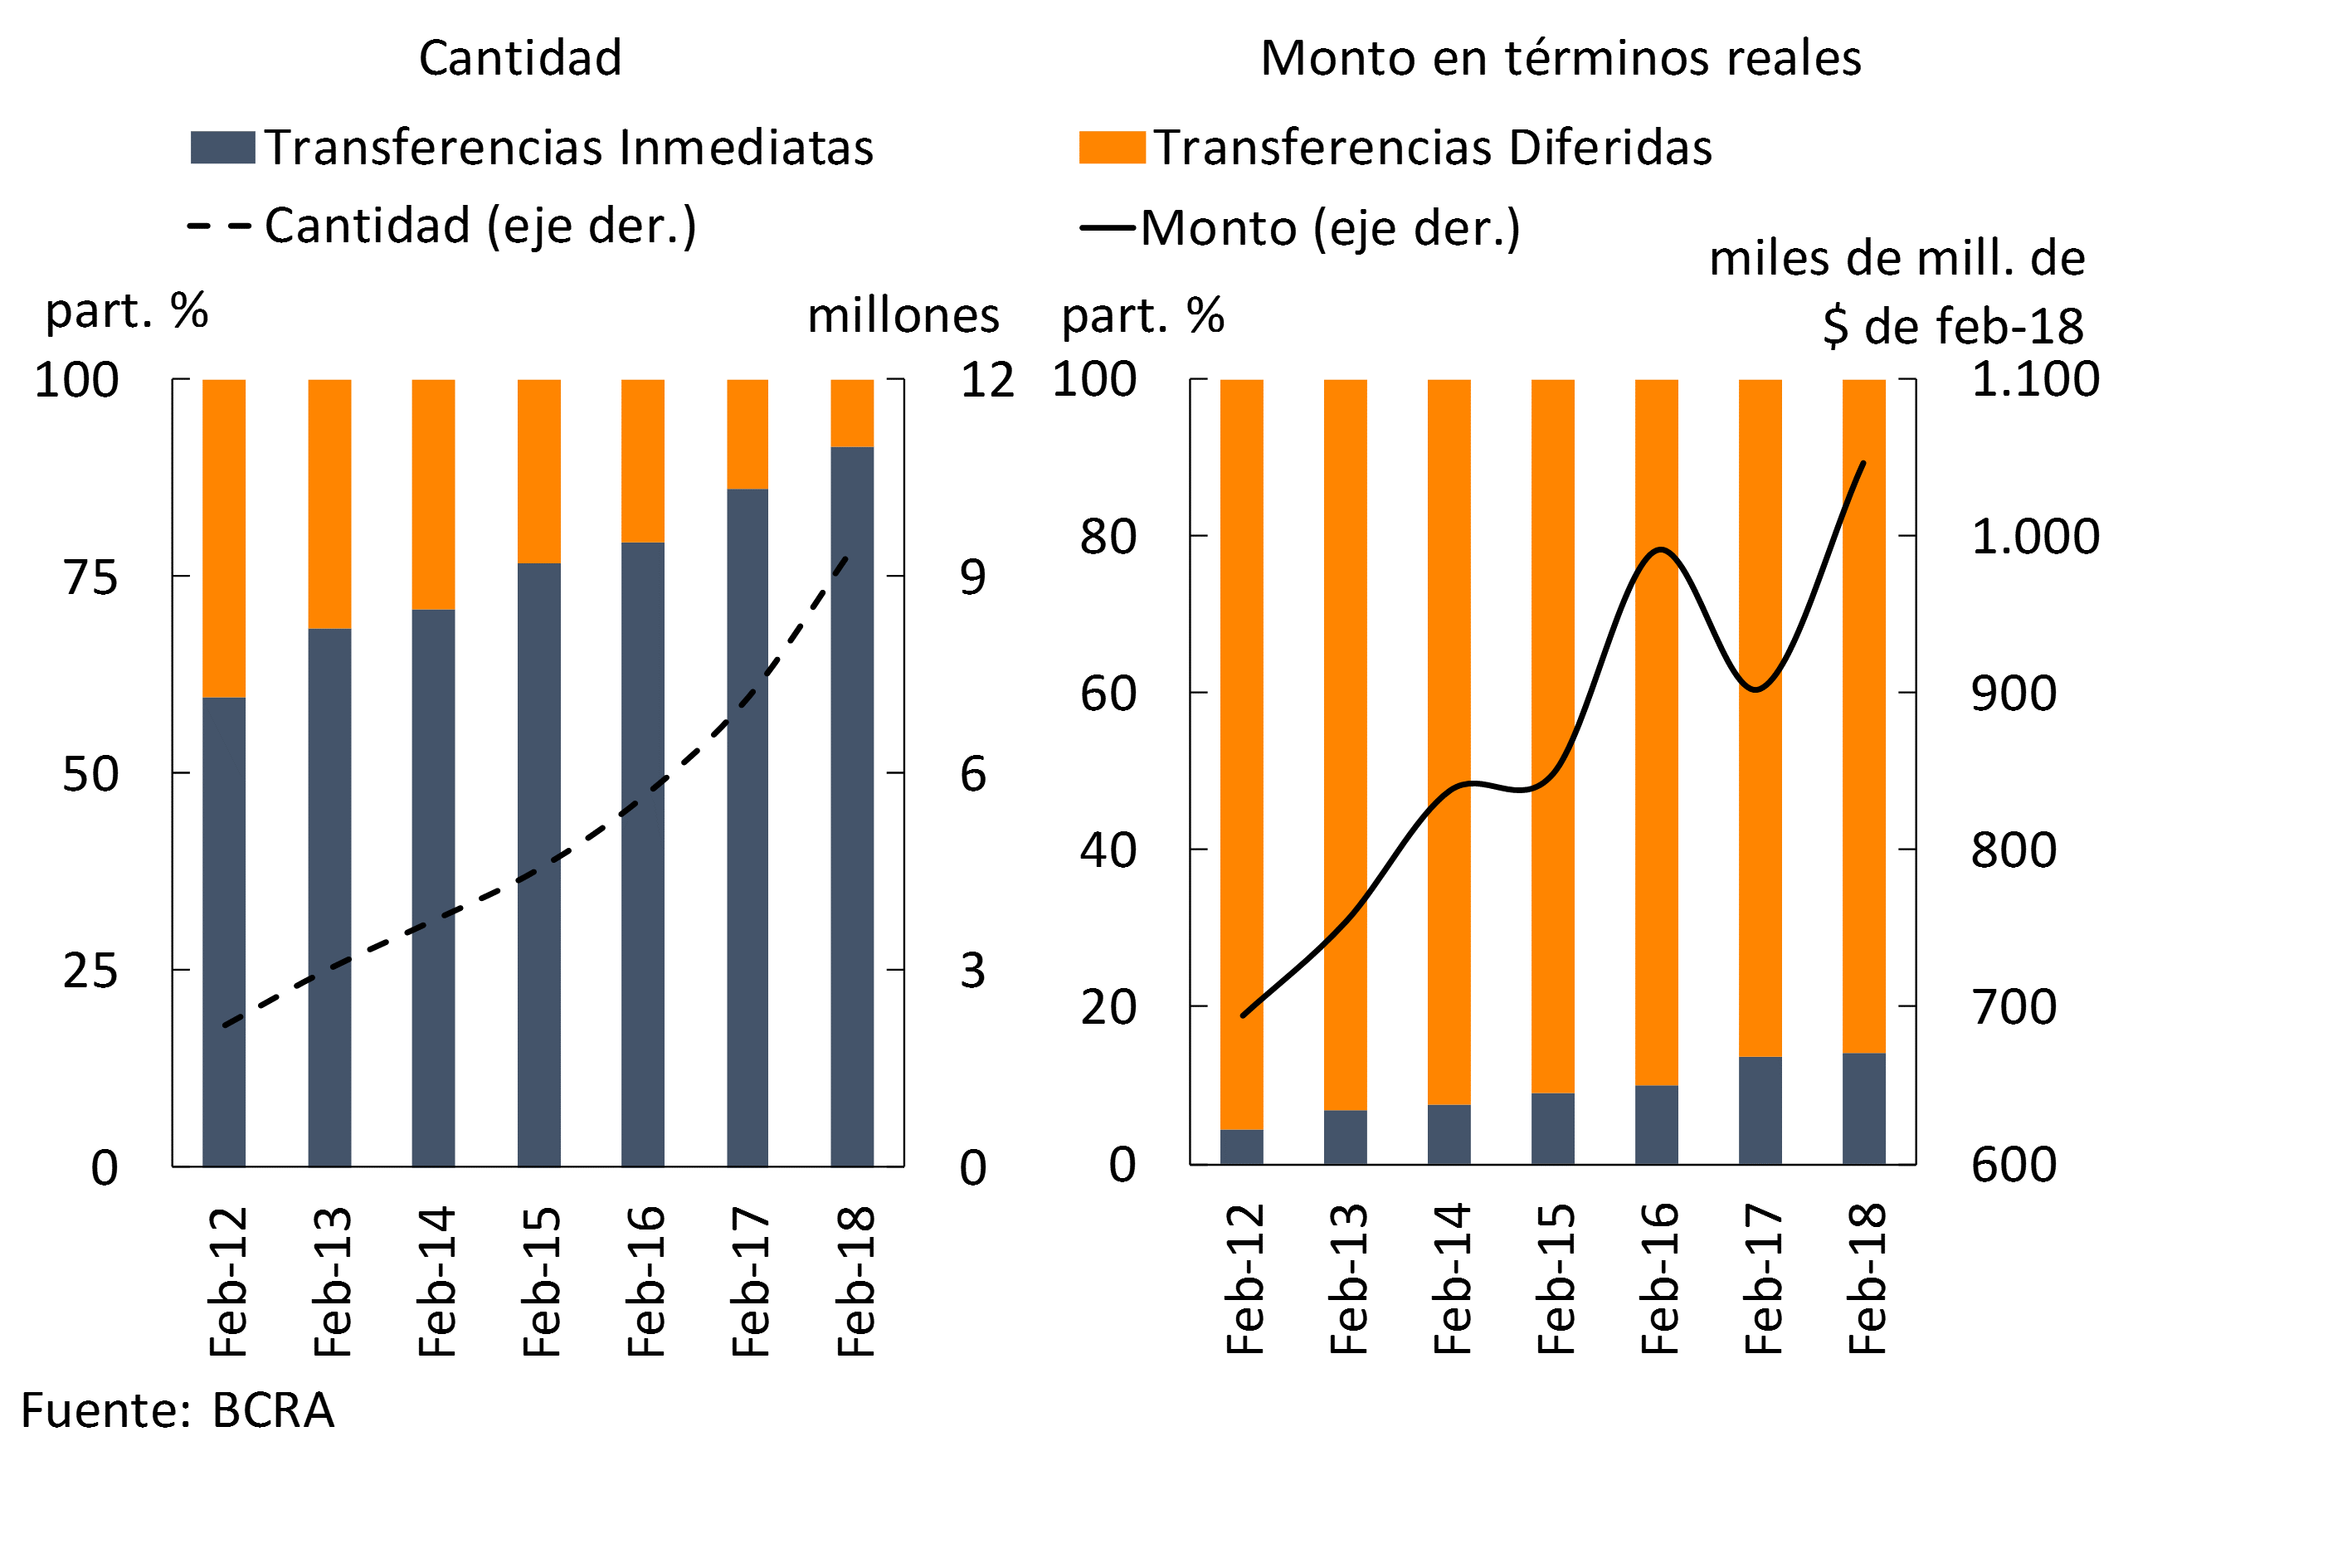
In relation to the operations of the National Payment System, in February transfers to third parties continued to grow, mainly driven by those with immediate accreditation. The latter increased 19.3% YoY in real values and 40.2% YoY in number of operations, gaining relevance compared to deferred payment transfers (see Graph 6). Considering the different channels through which immediate transfers are made, for the month of February 67% of operations were carried out from Internet banking, while 19% were carried out through ATMs. For its part, the use of mobile banking continued to gradually gain relevance, accounting for just over 10% in February.
Graph 6 | Transfers of Funds to Third Parties
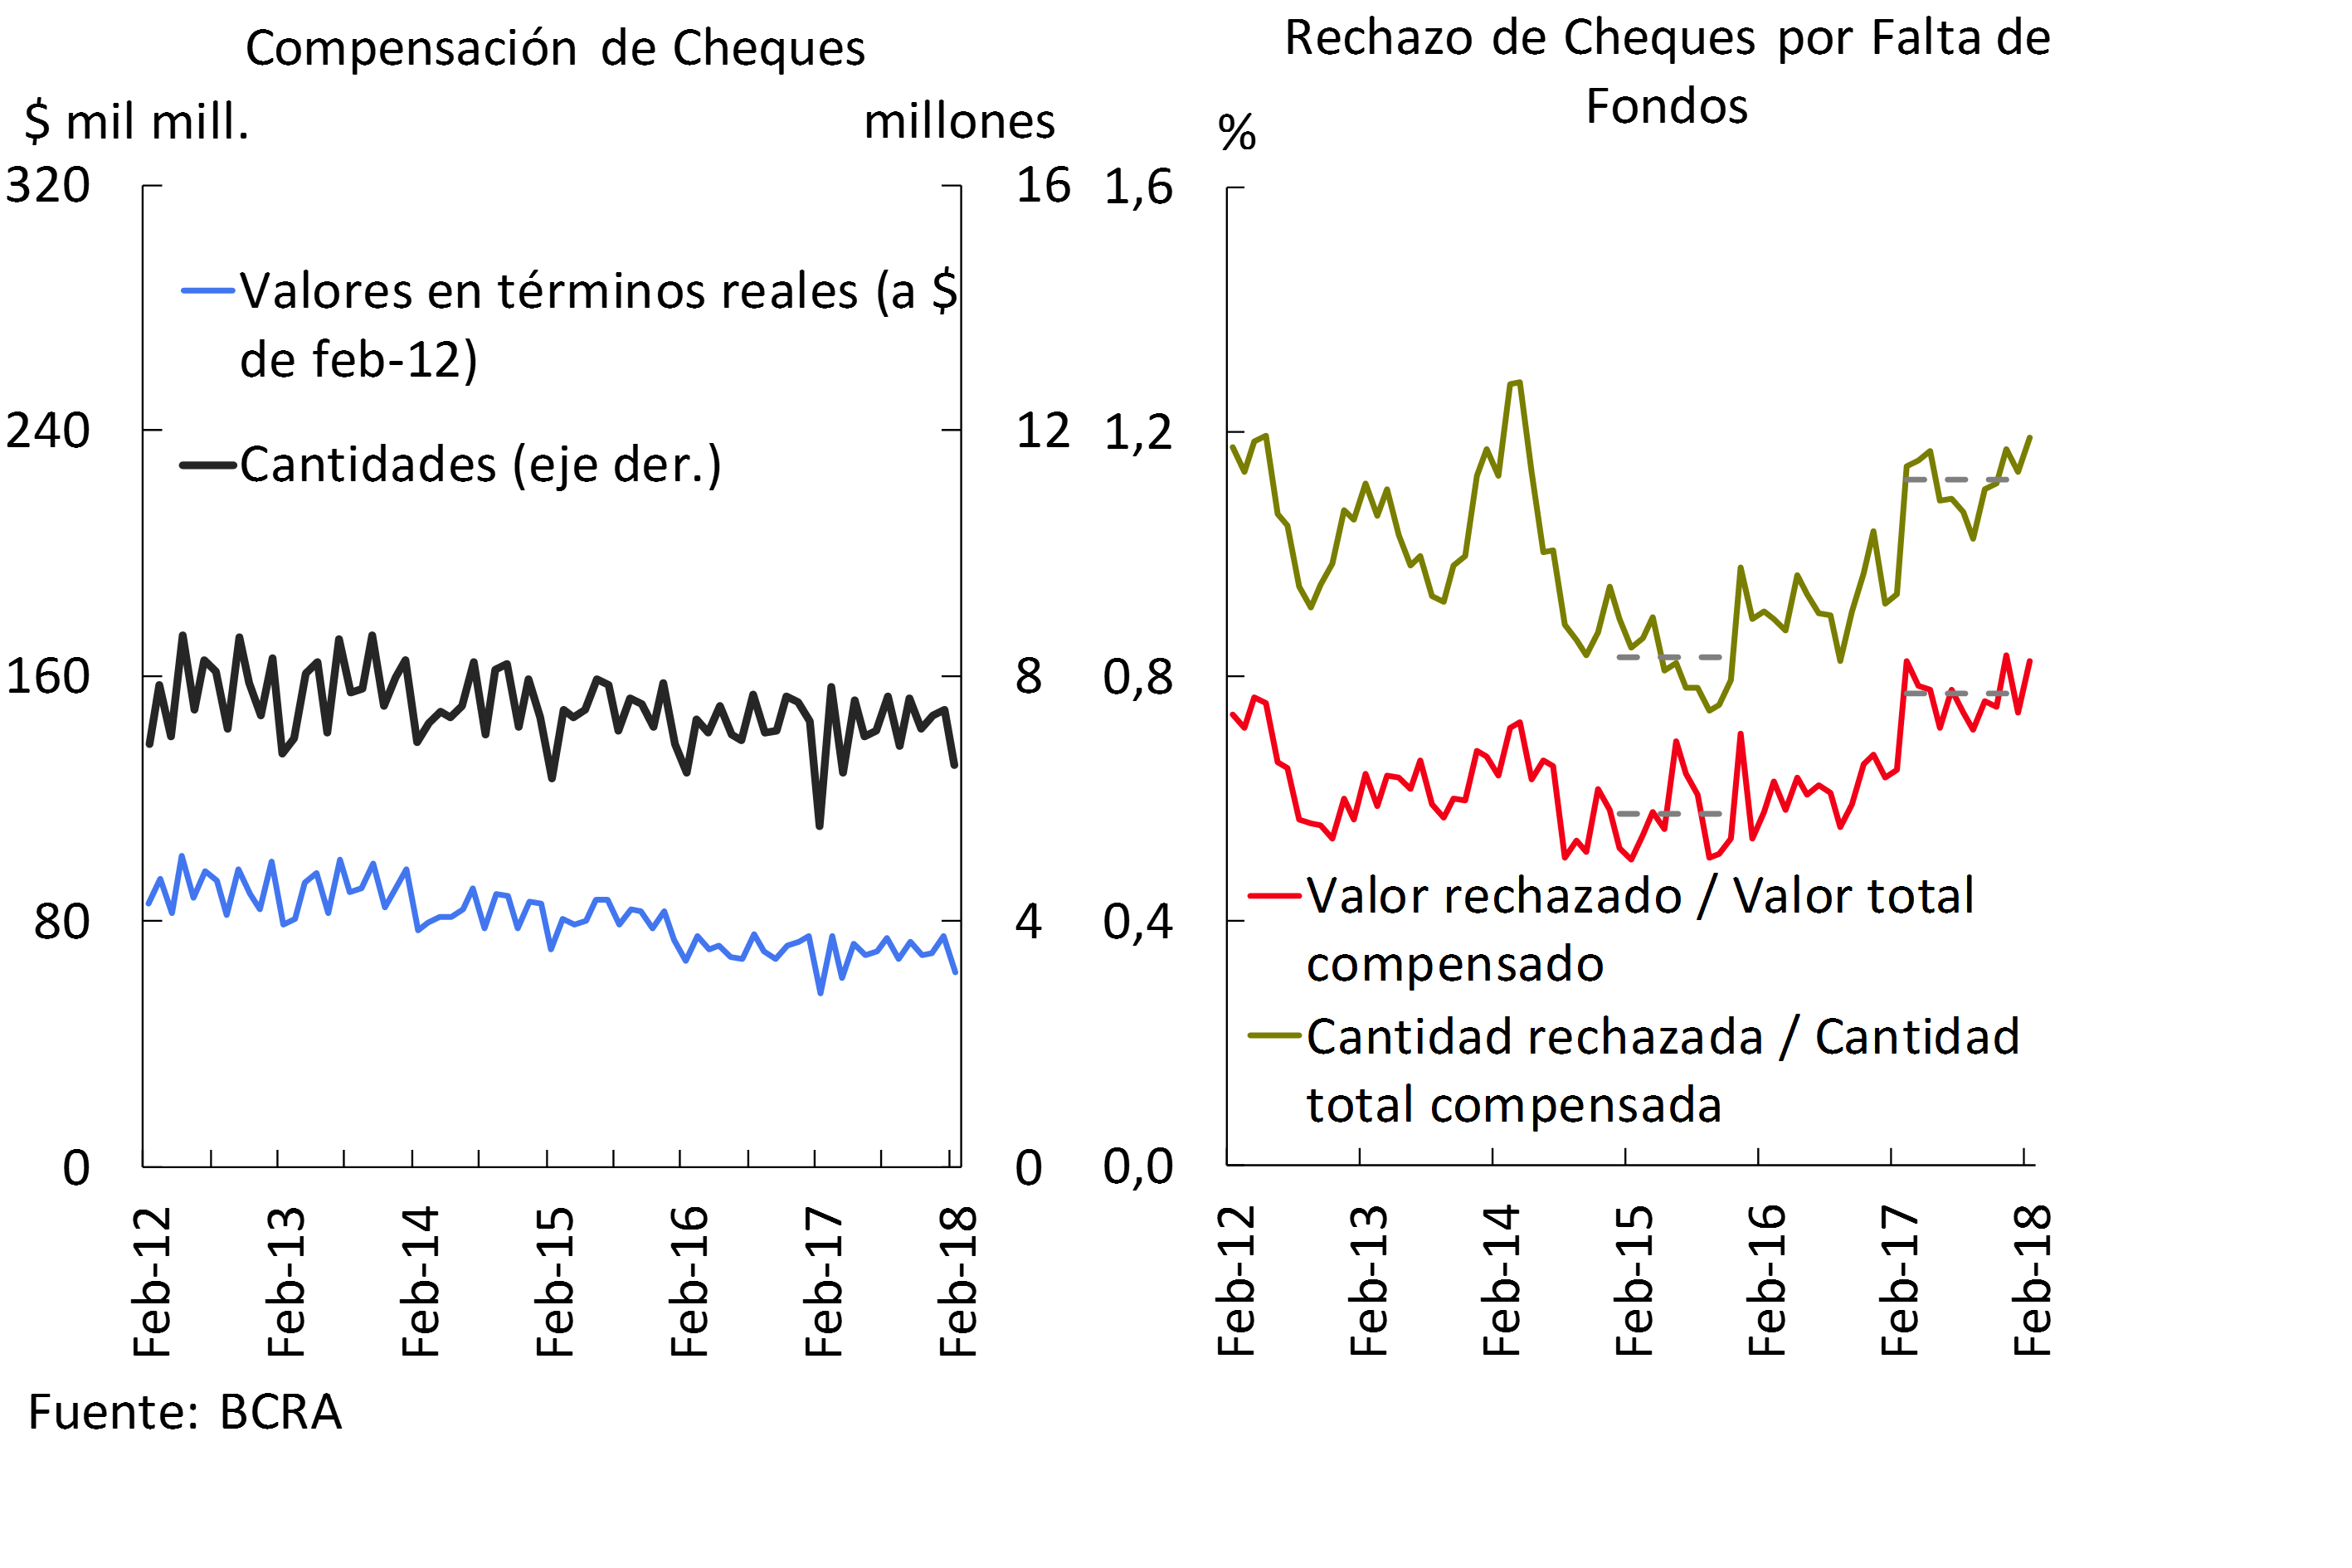
Partly due to seasonal issues, in February the clearing of checks fell 16.3% in real values (although it had a growth of 12.1% in a year-on-year comparison) and fell 12.0% in amounts (18.3% y.o.y.). On the other hand, in the period, the rejection of checks due to lack of funds in terms of the total compensated increased both in values and in amounts, standing at 0.83% and 1.19% respectively (see Graph 7).
Figure 7 | Cleared Checks and Bounced Checks for Insufficient Funds
IV. Deposits and liquidity
In January, the balance of total deposits in the financial system grew 3.9% in real terms, driven by the increase in public sector deposits16. For its part, in the month, total deposits of the private sector fell 2.9% in real terms, partly due to seasonal issues. Within the segment in national currency, there was an increase in term placements (+3.3% in real terms) that was more than offset by the decrease in demand account balances (-7.2% in real terms). In particular, deposits arranged in UVA showed significant monthly dynamism, almost tripling their balance between peak of the month, although it still represents 1% of the total balance of time deposits in pesos in the private sector.
In a year-on-year comparison, total deposits in the financial system grew at a rate very similar to inflation. On the other hand, loans by companies and households expanded by 3.1% in real terms in the last 12 months (see Graph 8), with a better performance of deposits in dollars (+11.4% y.o.y. —in source currency—) in relation to those arranged in national currency (without significant changes in real terms). Within the latter segment, the balance of demand accounts increased by 5.4% YoY, while Term Placements decreased by 2.8% YoY, both values adjusted for inflation. On the other hand, with respect to January 2017, both deposits in pesos and dollars in the public sector were reduced in real terms and in currency of origin, respectively.
Figure 8 | Total Private Sector Deposits – Var. A.I. of the balance in real terms
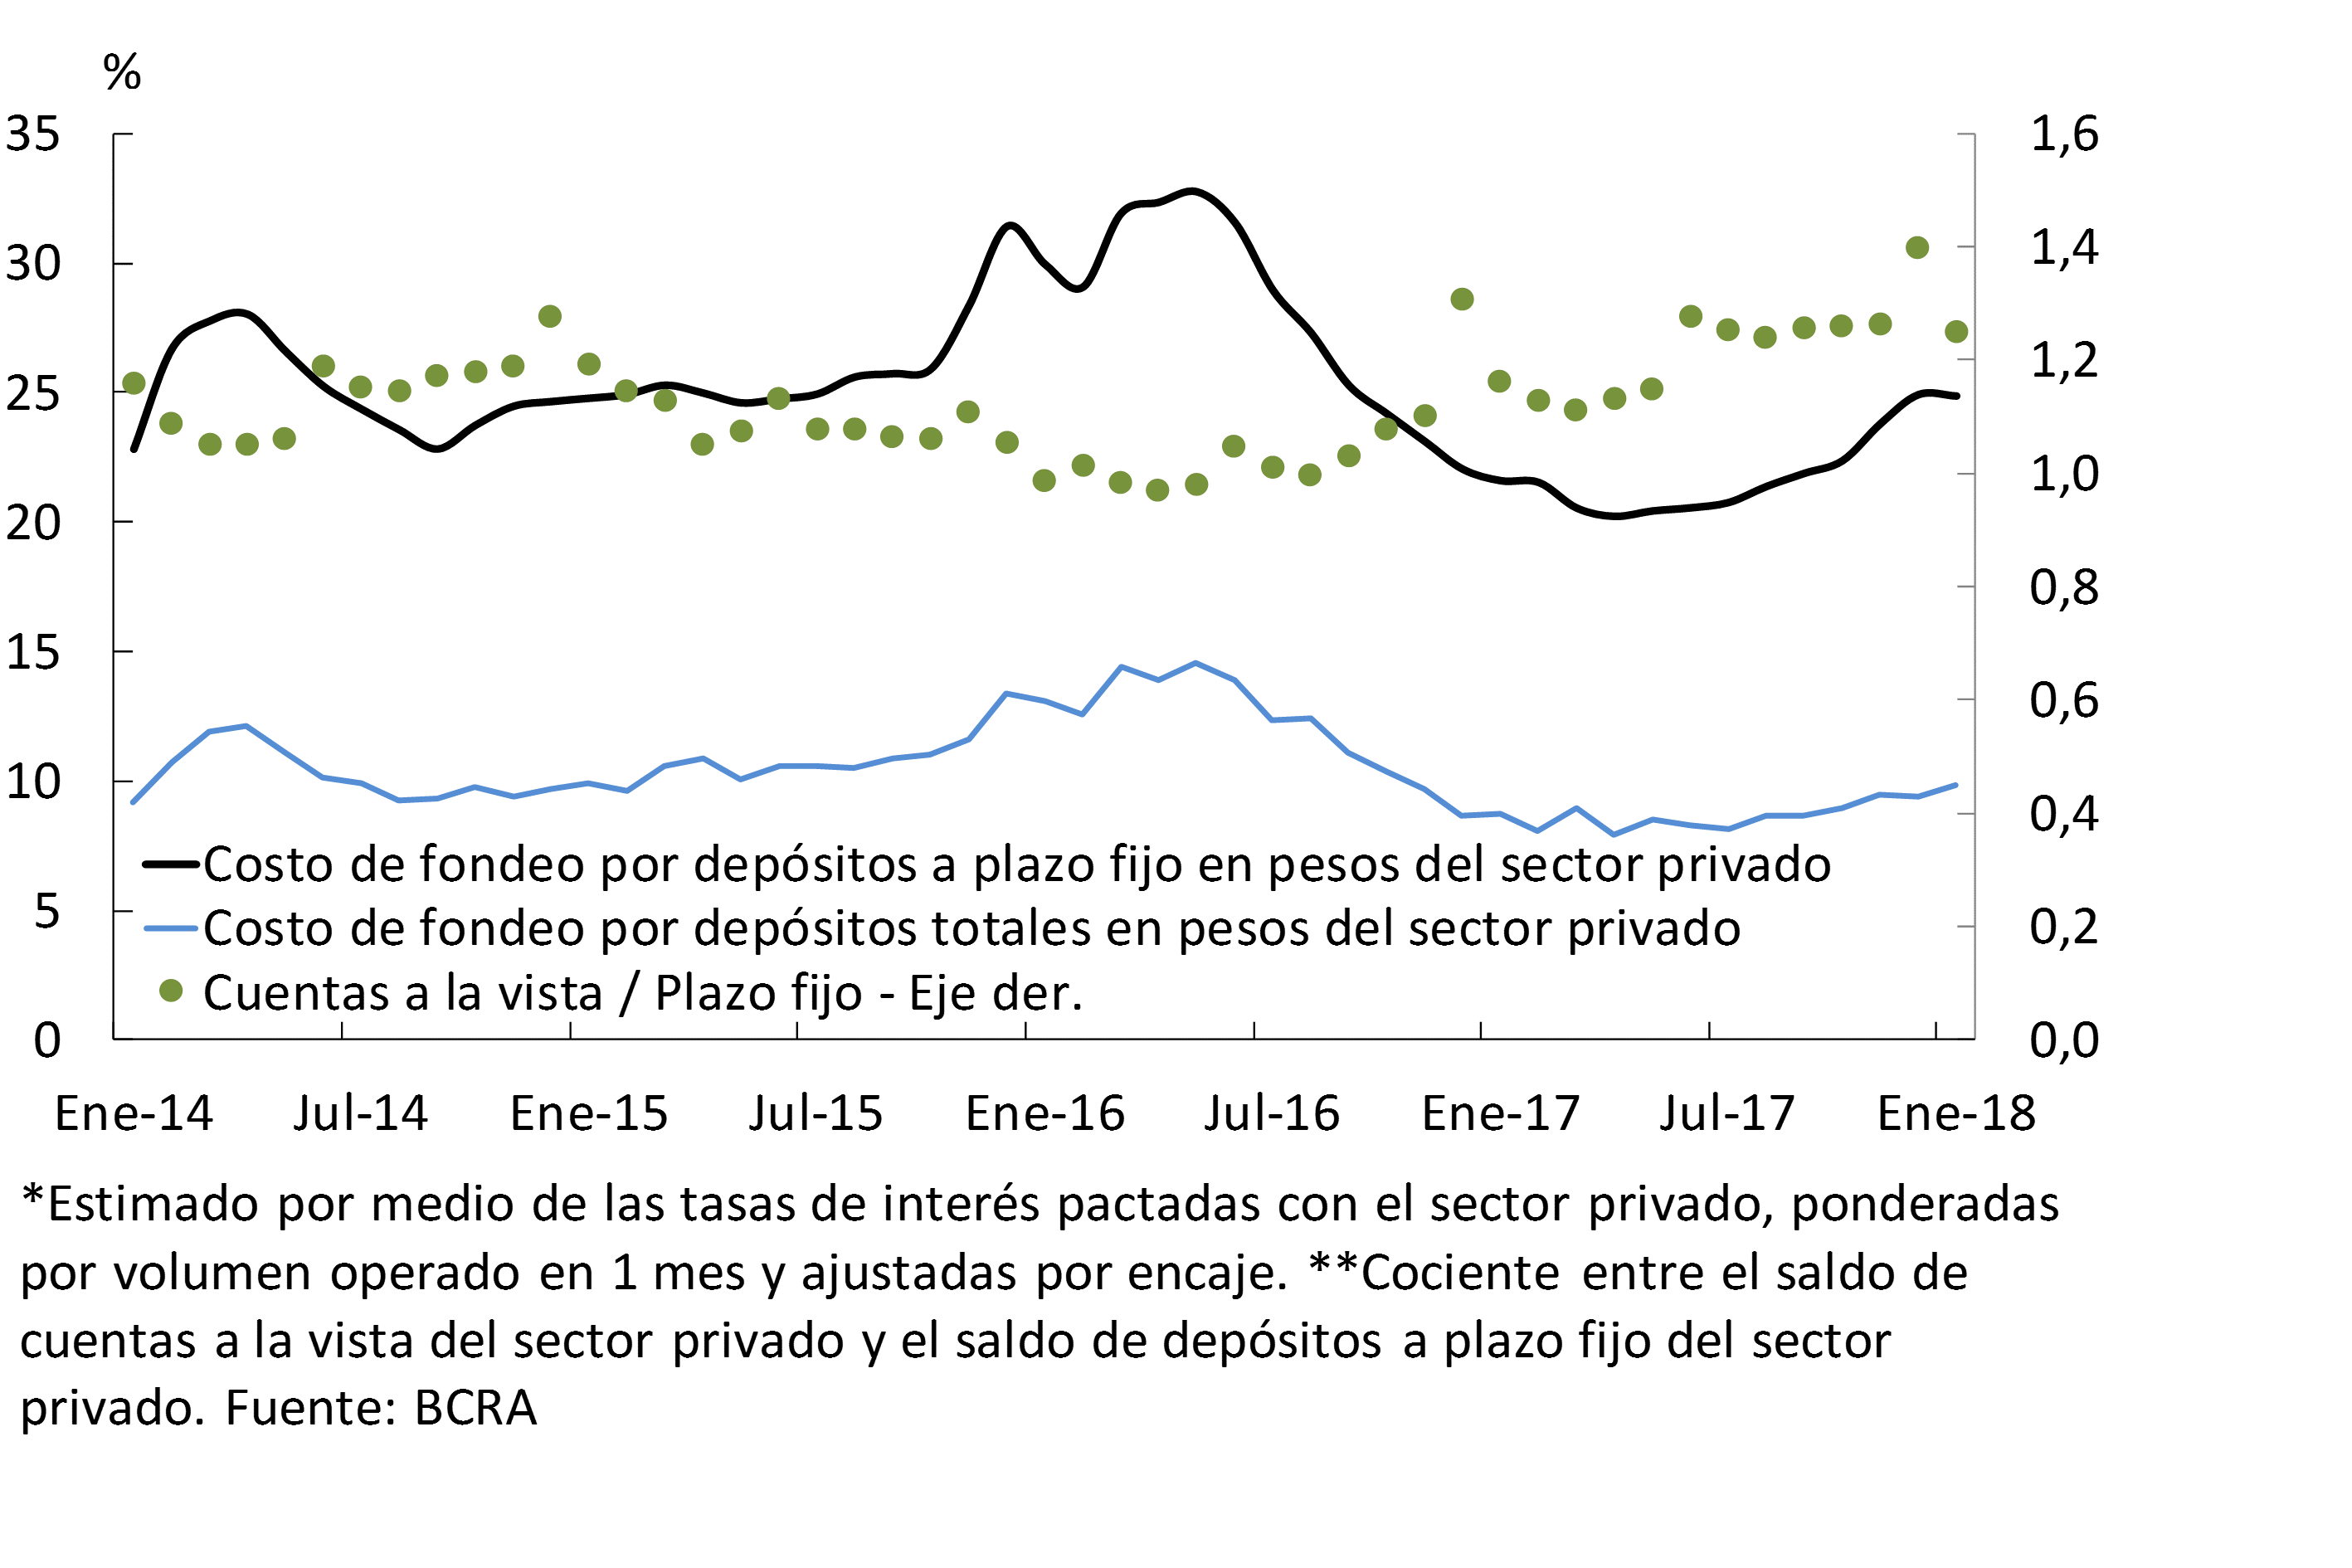
The cost of funding for time deposits in pesos remained unchanged in January, interrupting the upward trajectory it had shown until the end of last year (see Chart 9). This change partly reflected the effect of the reduction in the levels of monetary policy rates. However, term placements showed a greater weighting in relation to demand accounts in the period, leading to a slight increase in the estimated funding cost for total deposits in pesos operated with the private sector.
Figure 9 | Funding Cost for Private Sector Deposits in Pesos* and Ratio between Demand and Time Deposits**
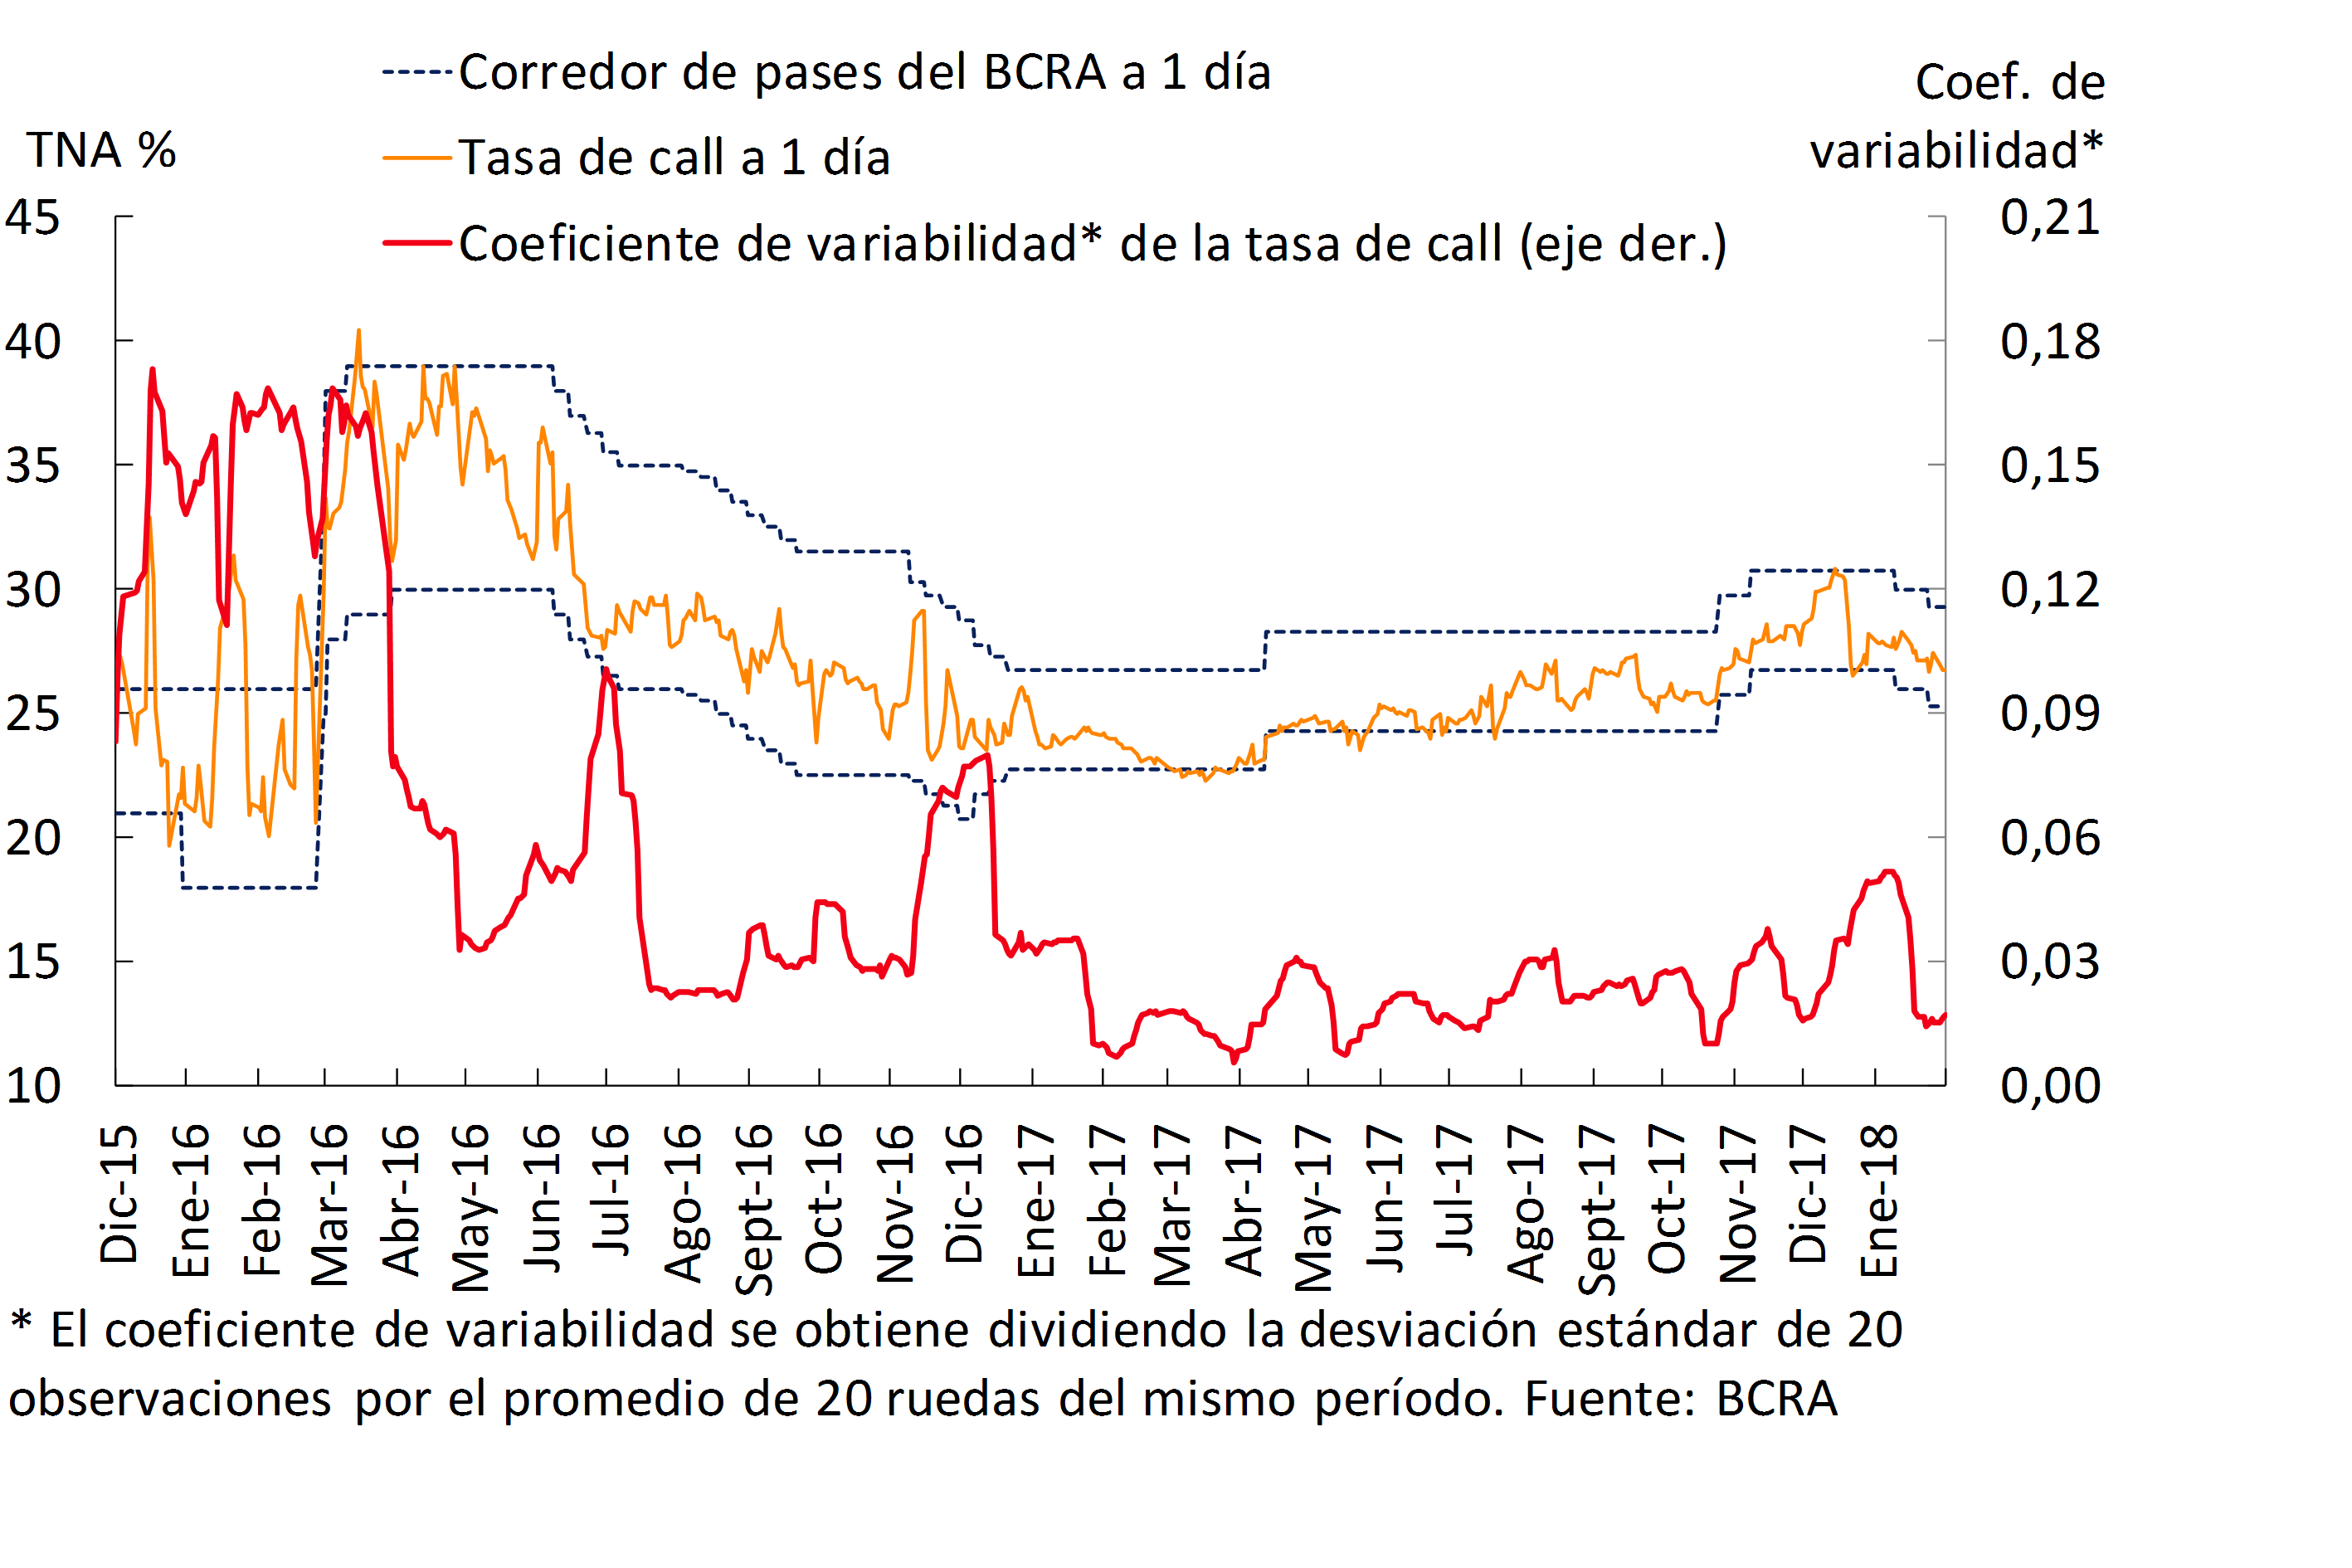
The average interest rates for loans between banks without collateral (call) fell at the beginning of the year, placing them in most of the rounds within the rate corridor established by the BCRA (see Chart 10). The average monthly volume traded in January in this market was 10.2% lower than in December. In the month, limited volatility was maintained in the call rate.
Figure 10 | Interest Rates in Interfinancial Markets and Volatility
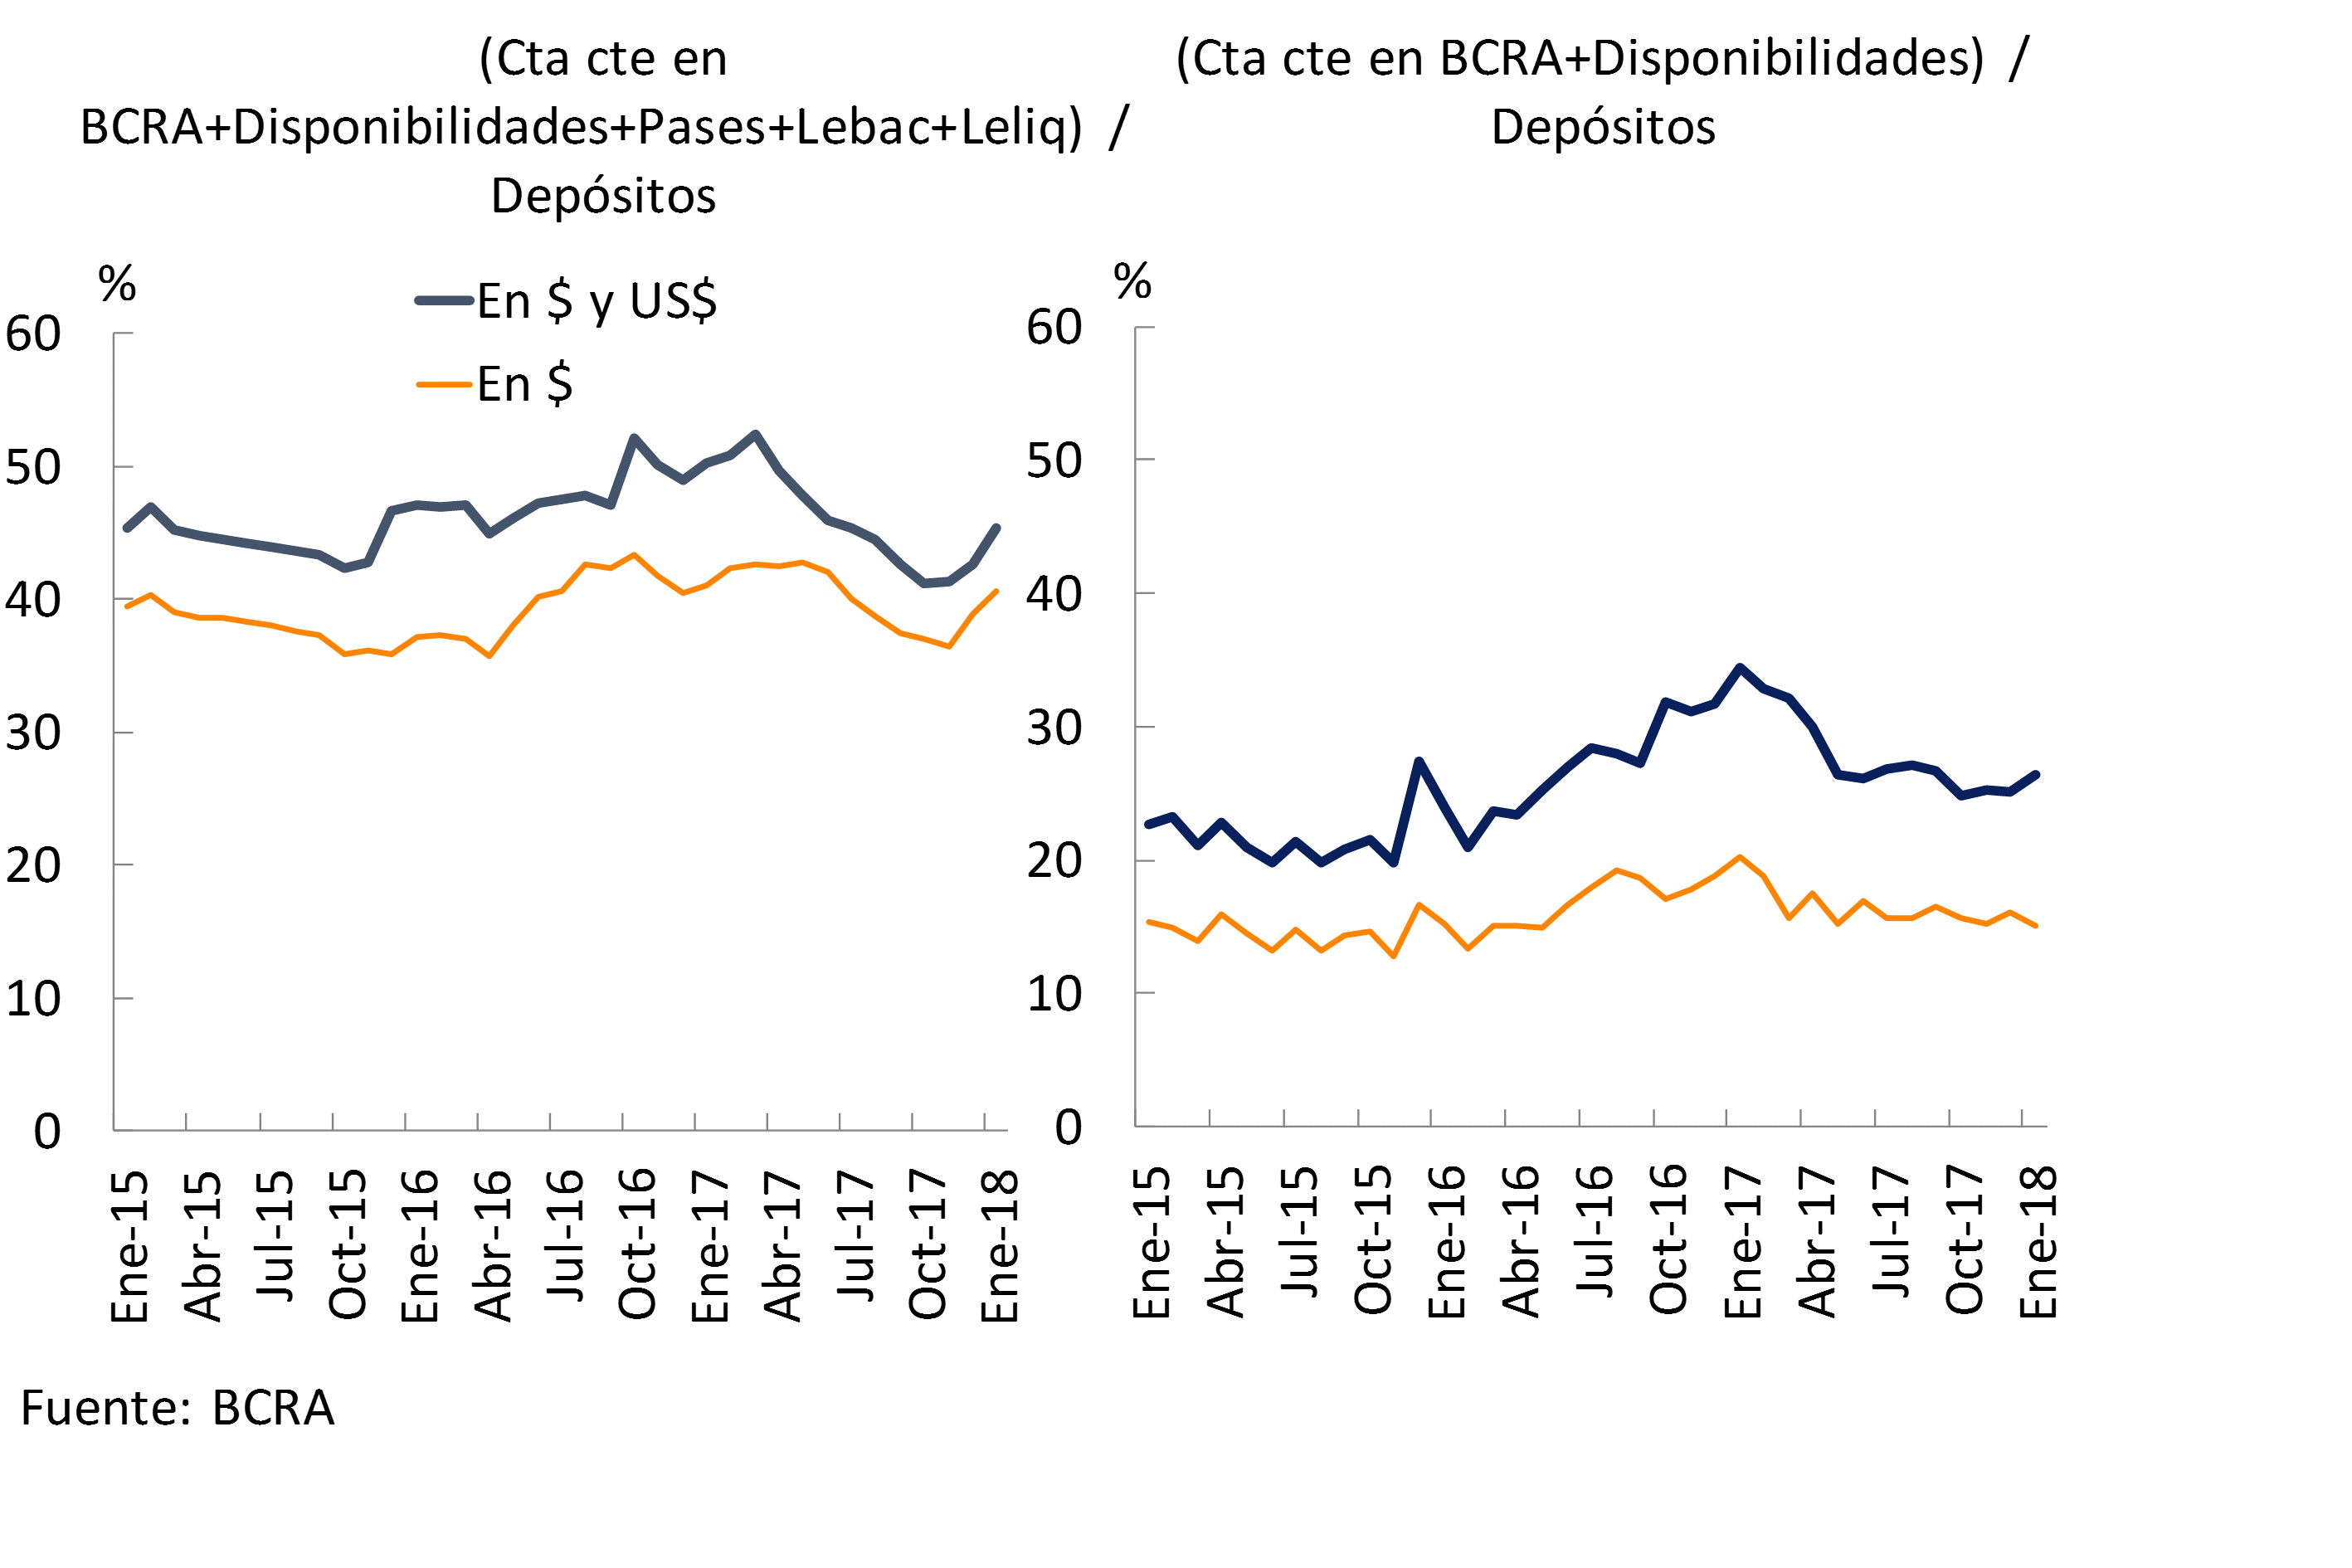
Given the context in which the growth rate of financial intermediation moderates seasonally added to the strong increase in public sector deposits, in January there was evidence of an increase in liquid assets in the financial system, a behavior verified mostly in public banks. The broad liquidity indicator – in domestic and foreign currency, considering the banks’ current account at the BCRA, the availabilities, the passes with the BCRA, LEBAC and LELIQ – totaled 45.3% of deposits at the systemic level in the month, 2.8 p.p. more than on December17 (see Graph 11). Most of this increase was mainly due to increases in the holdings of liquidity bills (LELIQ), with some substitution with passes. However, this indicator was 4.9 p.p. of deposits below the value of January 2017, with a relatively greater drop in public banks. For their part, private banks did not present major changes in this indicator, standing at 45.3% of their deposits. Liquidity in the strictest sense – considering only the availabilities and the balance of the current accounts that banks have at the BCRA – increased by 1.2 p.p. of deposits in the first month of the year to reach 26.3%. In the last 12 months, this indicator decreased by 8.2 p.p. of deposits.
Figure 11 | Ample Liquidity of the Financial System
V. Financing
Influenced by seasonal factors, in the first month of the year the real balance of total credit to the private sector increased by 1.1%18. Although this figure was lower than that of the previous eight months, it comfortably exceeded the variations observed in the same period of previous years. Loans in foreign currency19 grew 1.6% in January, with a greater relative increase in cards. For its part, in the month, financing in pesos increased 0.4%20 when adjusted for inflation. Within this segment, heterogeneous behaviors were observed among credit lines: monthly increases in advances, loans with real collateral (mostly mortgages) and consumer loans (personal and cards) and a fall in documents —mainly explained by the summer recess—.
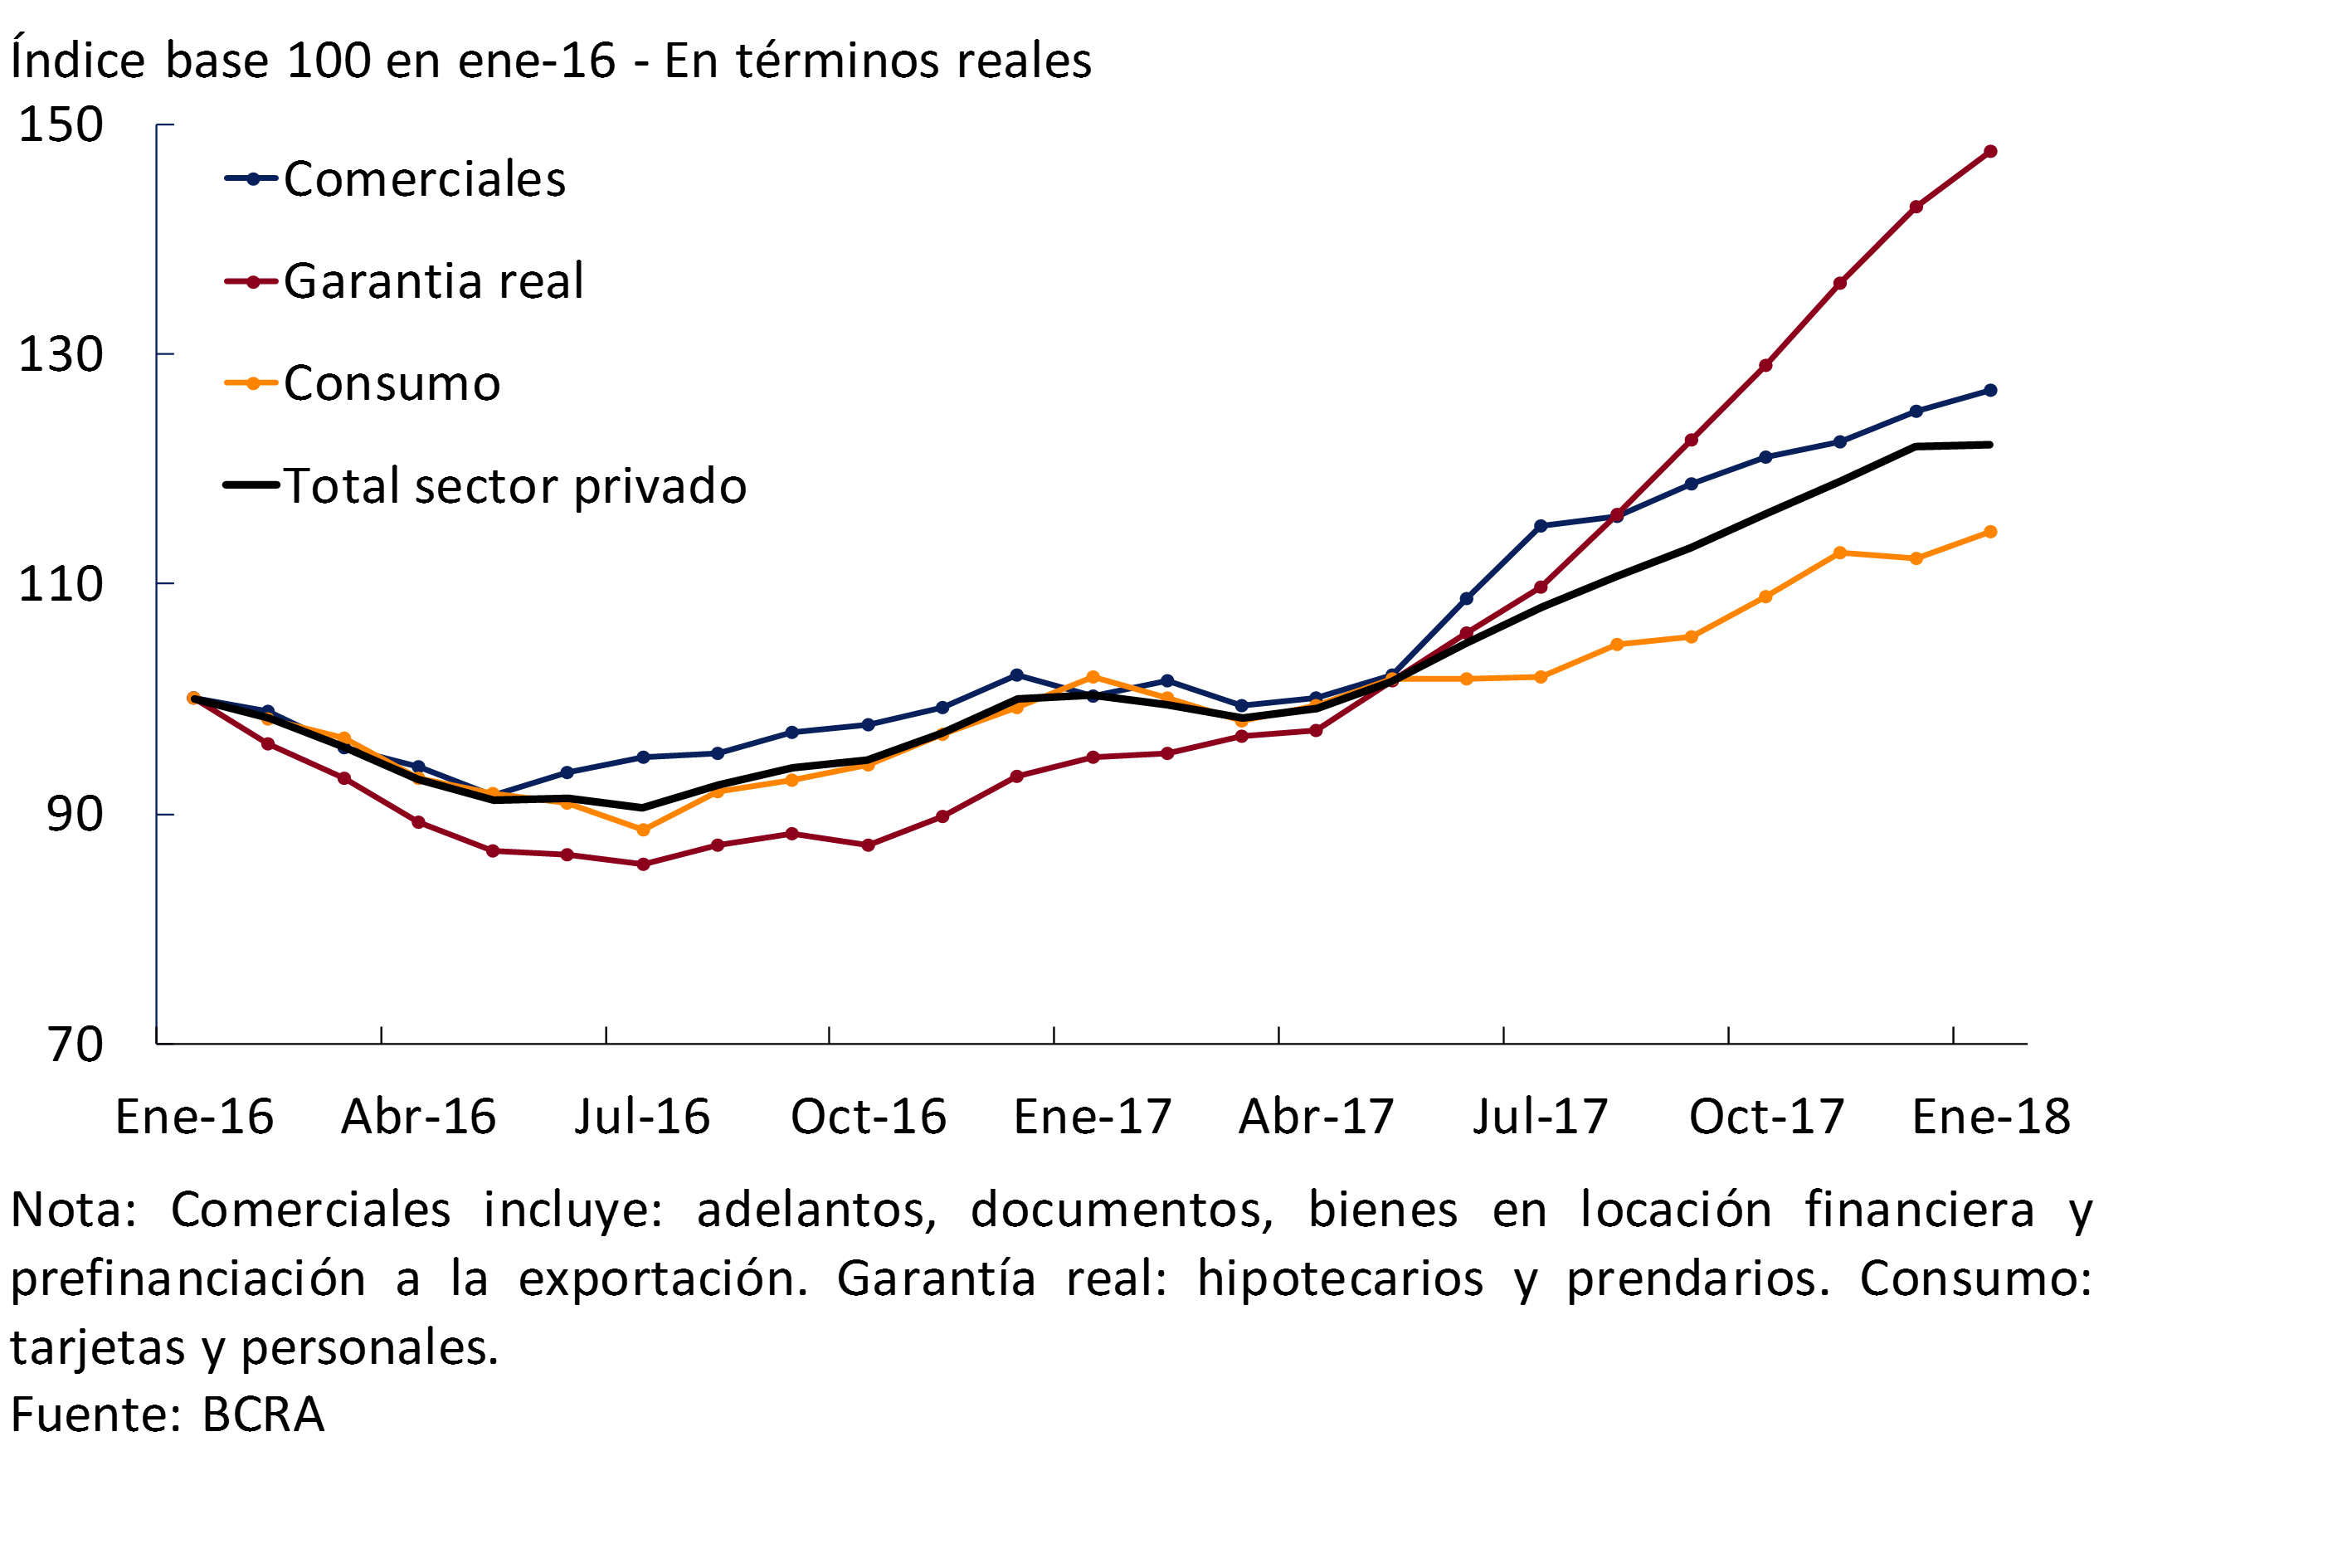
In January, total bank financing to companies and households accumulated a year-on-year growth of 21.8% when adjusted for inflation, practically unchanged with respect to the December value (see Chart 12). Secured lines continued to show the greatest relative year-on-year dynamism (see Chart 13). In particular, in the first month of the year, mortgage loans to the private sector increased 76.3% y.o.y. in real terms. Disaggregated by currency, in the period, credit lines to the private sector in foreign currency accumulated a year-on-year increase equivalent to 61.2%21. On the other hand, loans in pesos increased 15.7% y.o.y. adjusted for inflation.
Figure 12 | Real Balance of Total Credit to the Private Sector
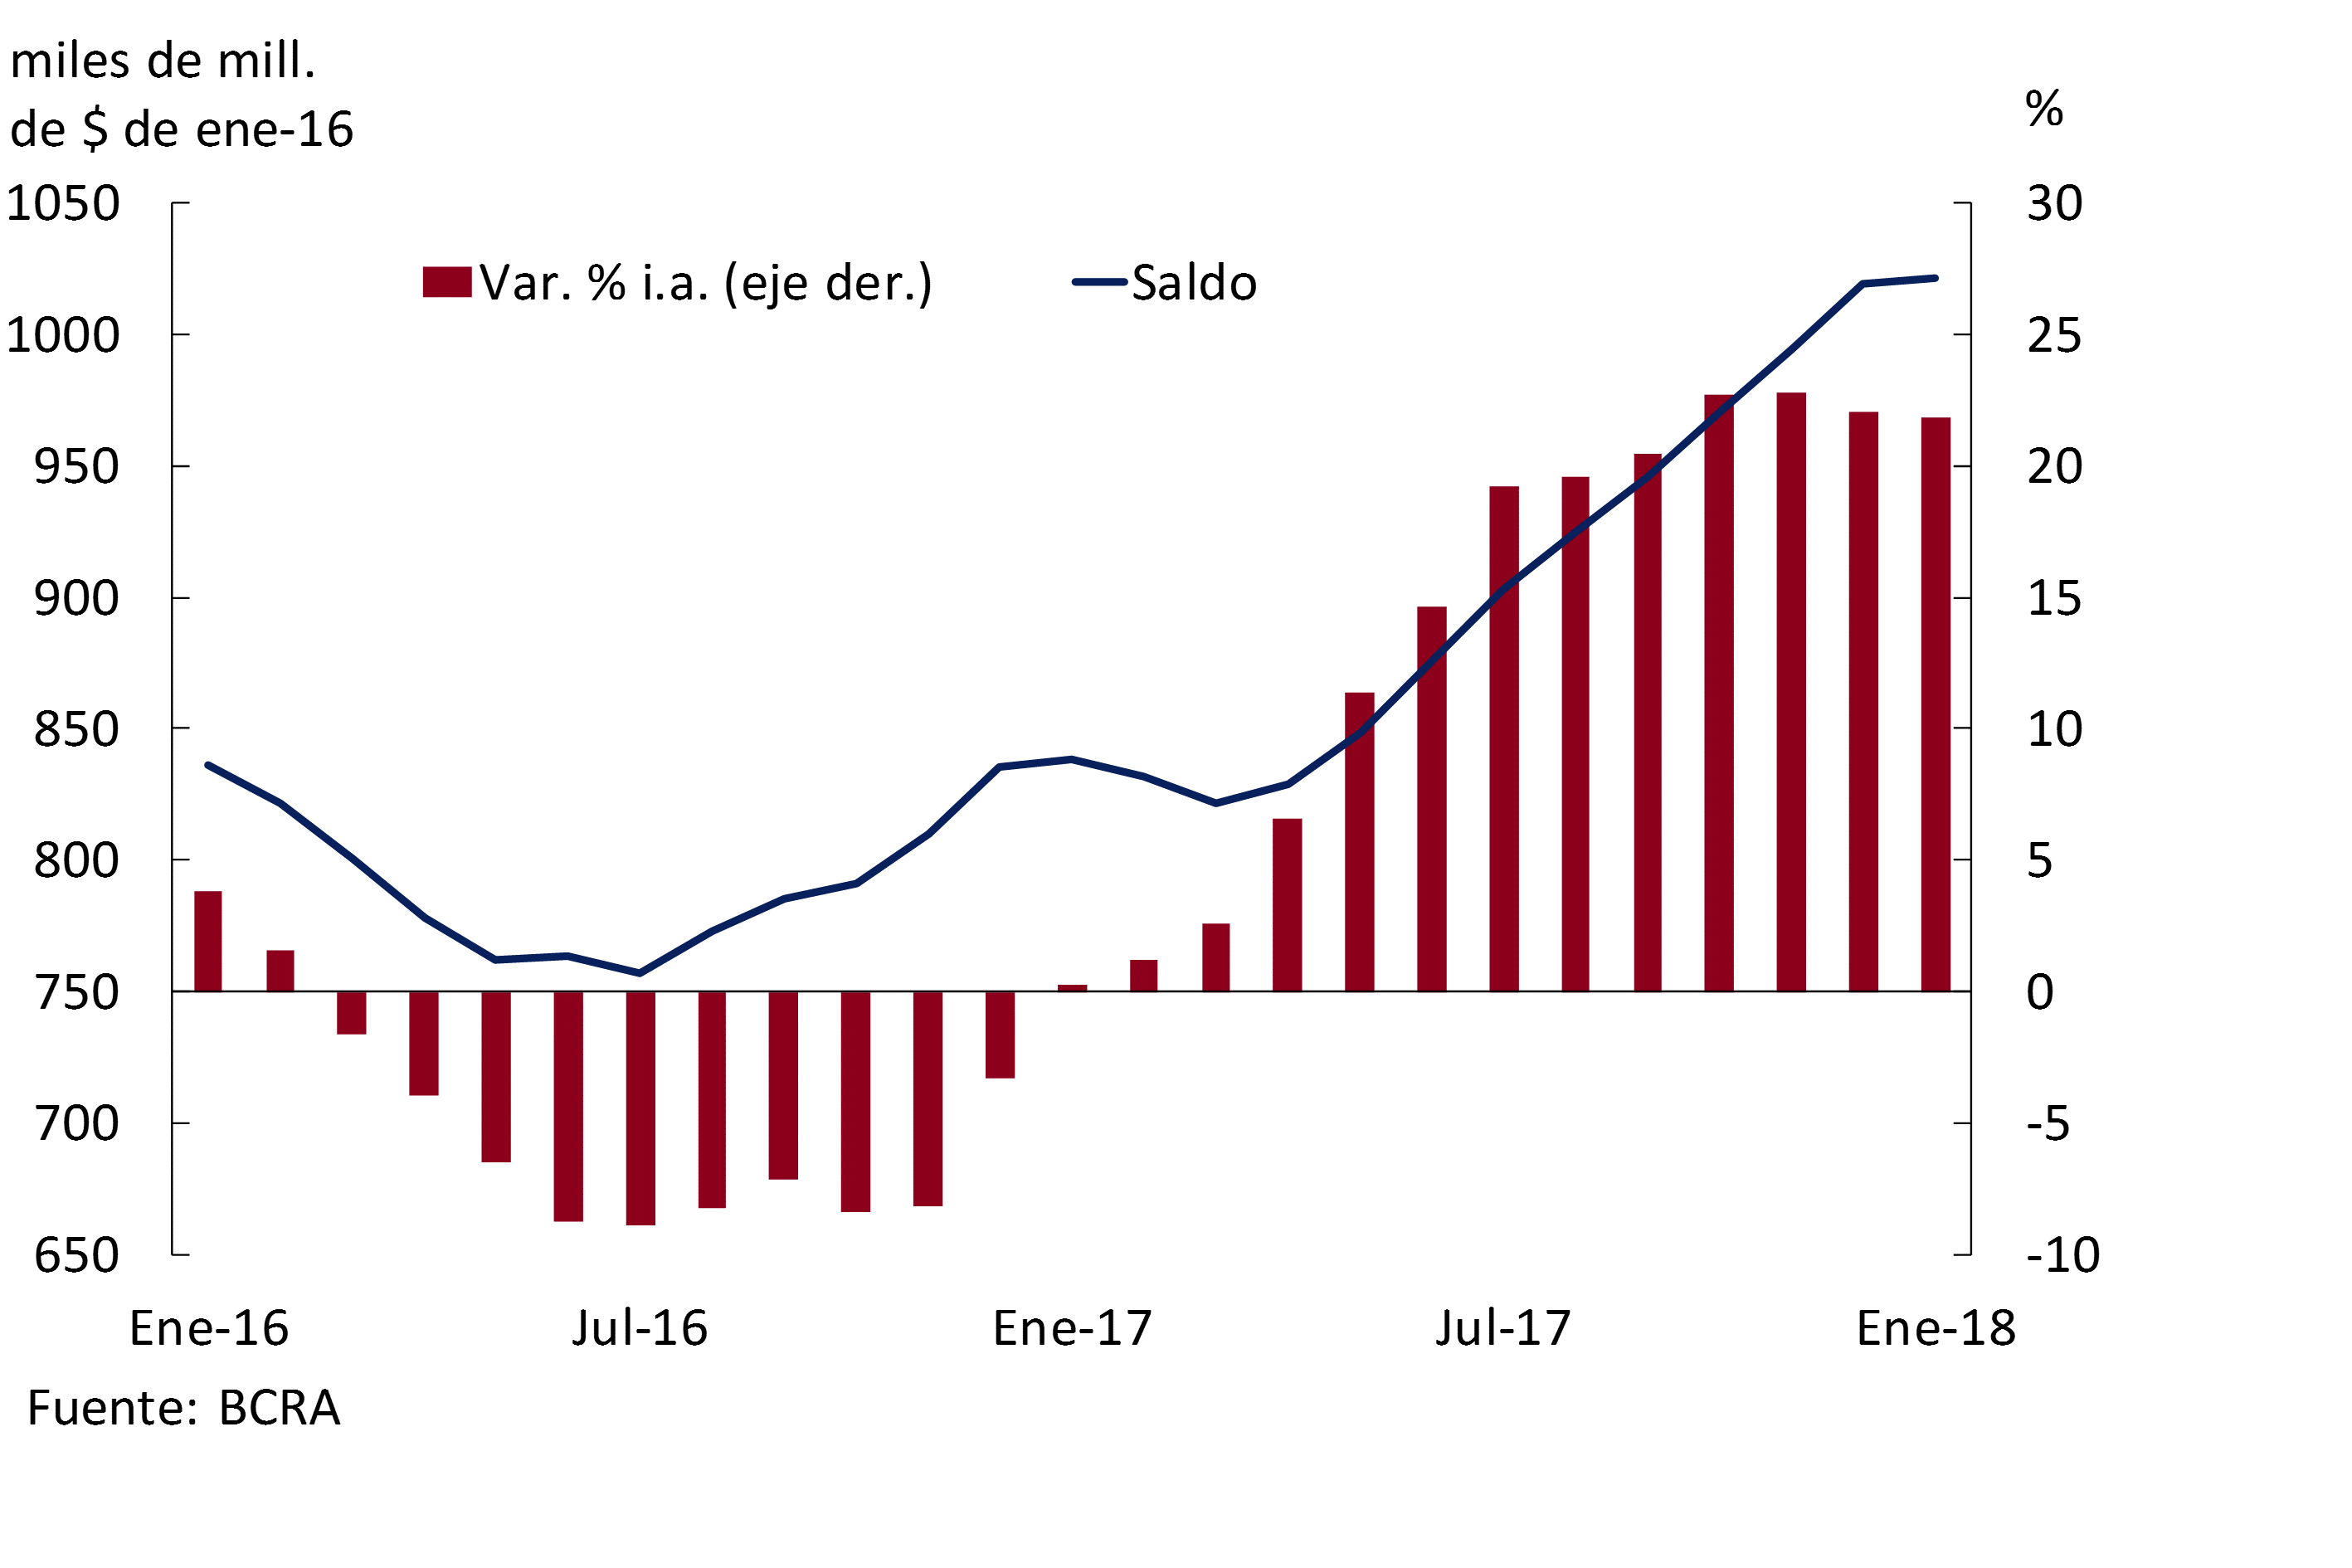
Figure 13 | Real Balance of Total Credit to the Private Sector
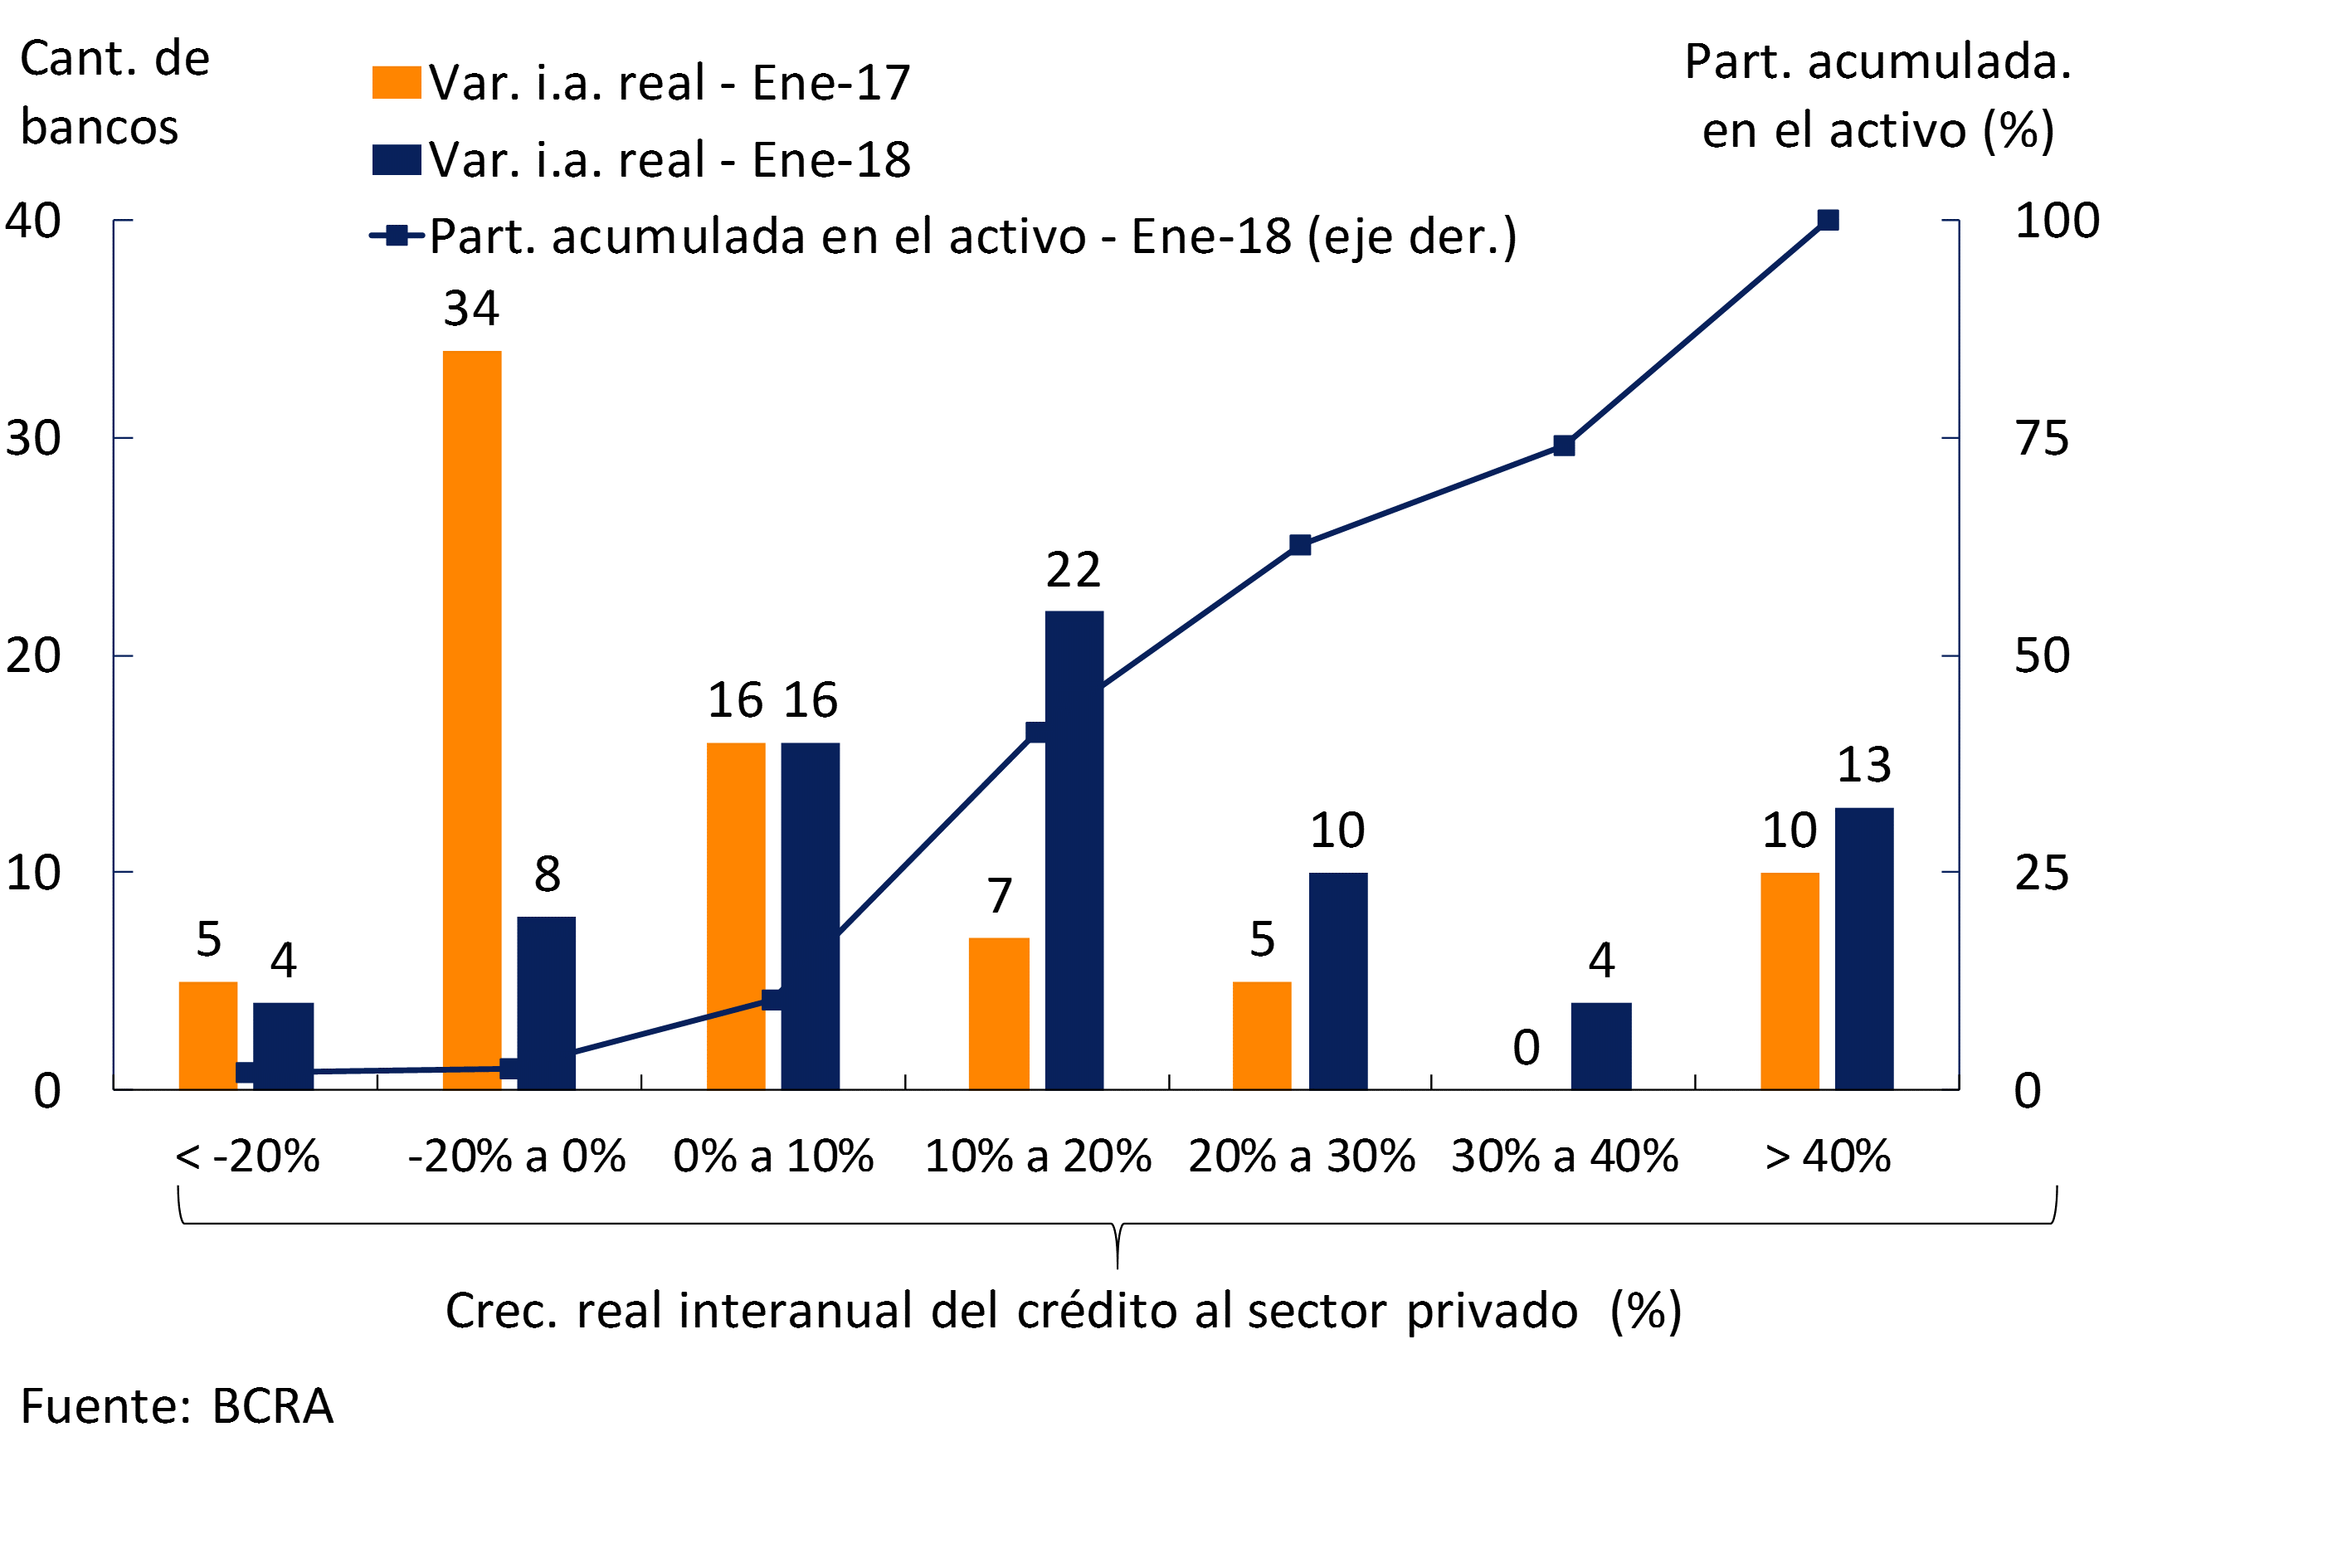
At the beginning of 2018, the real year-on-year growth of credit to the private sector was widespread among financial institutions. In the period, more than 84% of the banks that make up the financial system—which represent 97% of total assets—registered a real year-on-year increase in loans to the private sector (see Chart 14). In particular, thirteen entities showed an increase in loans to this sector of more than 40% y.o.y. adjusted for inflation (5 national private banks, 6 non-bank financial institutions and two public banks).
Figure 14 | Distribution of Real Year-on-Year Growth in Credit to the Private Sector – By Financial Institutions
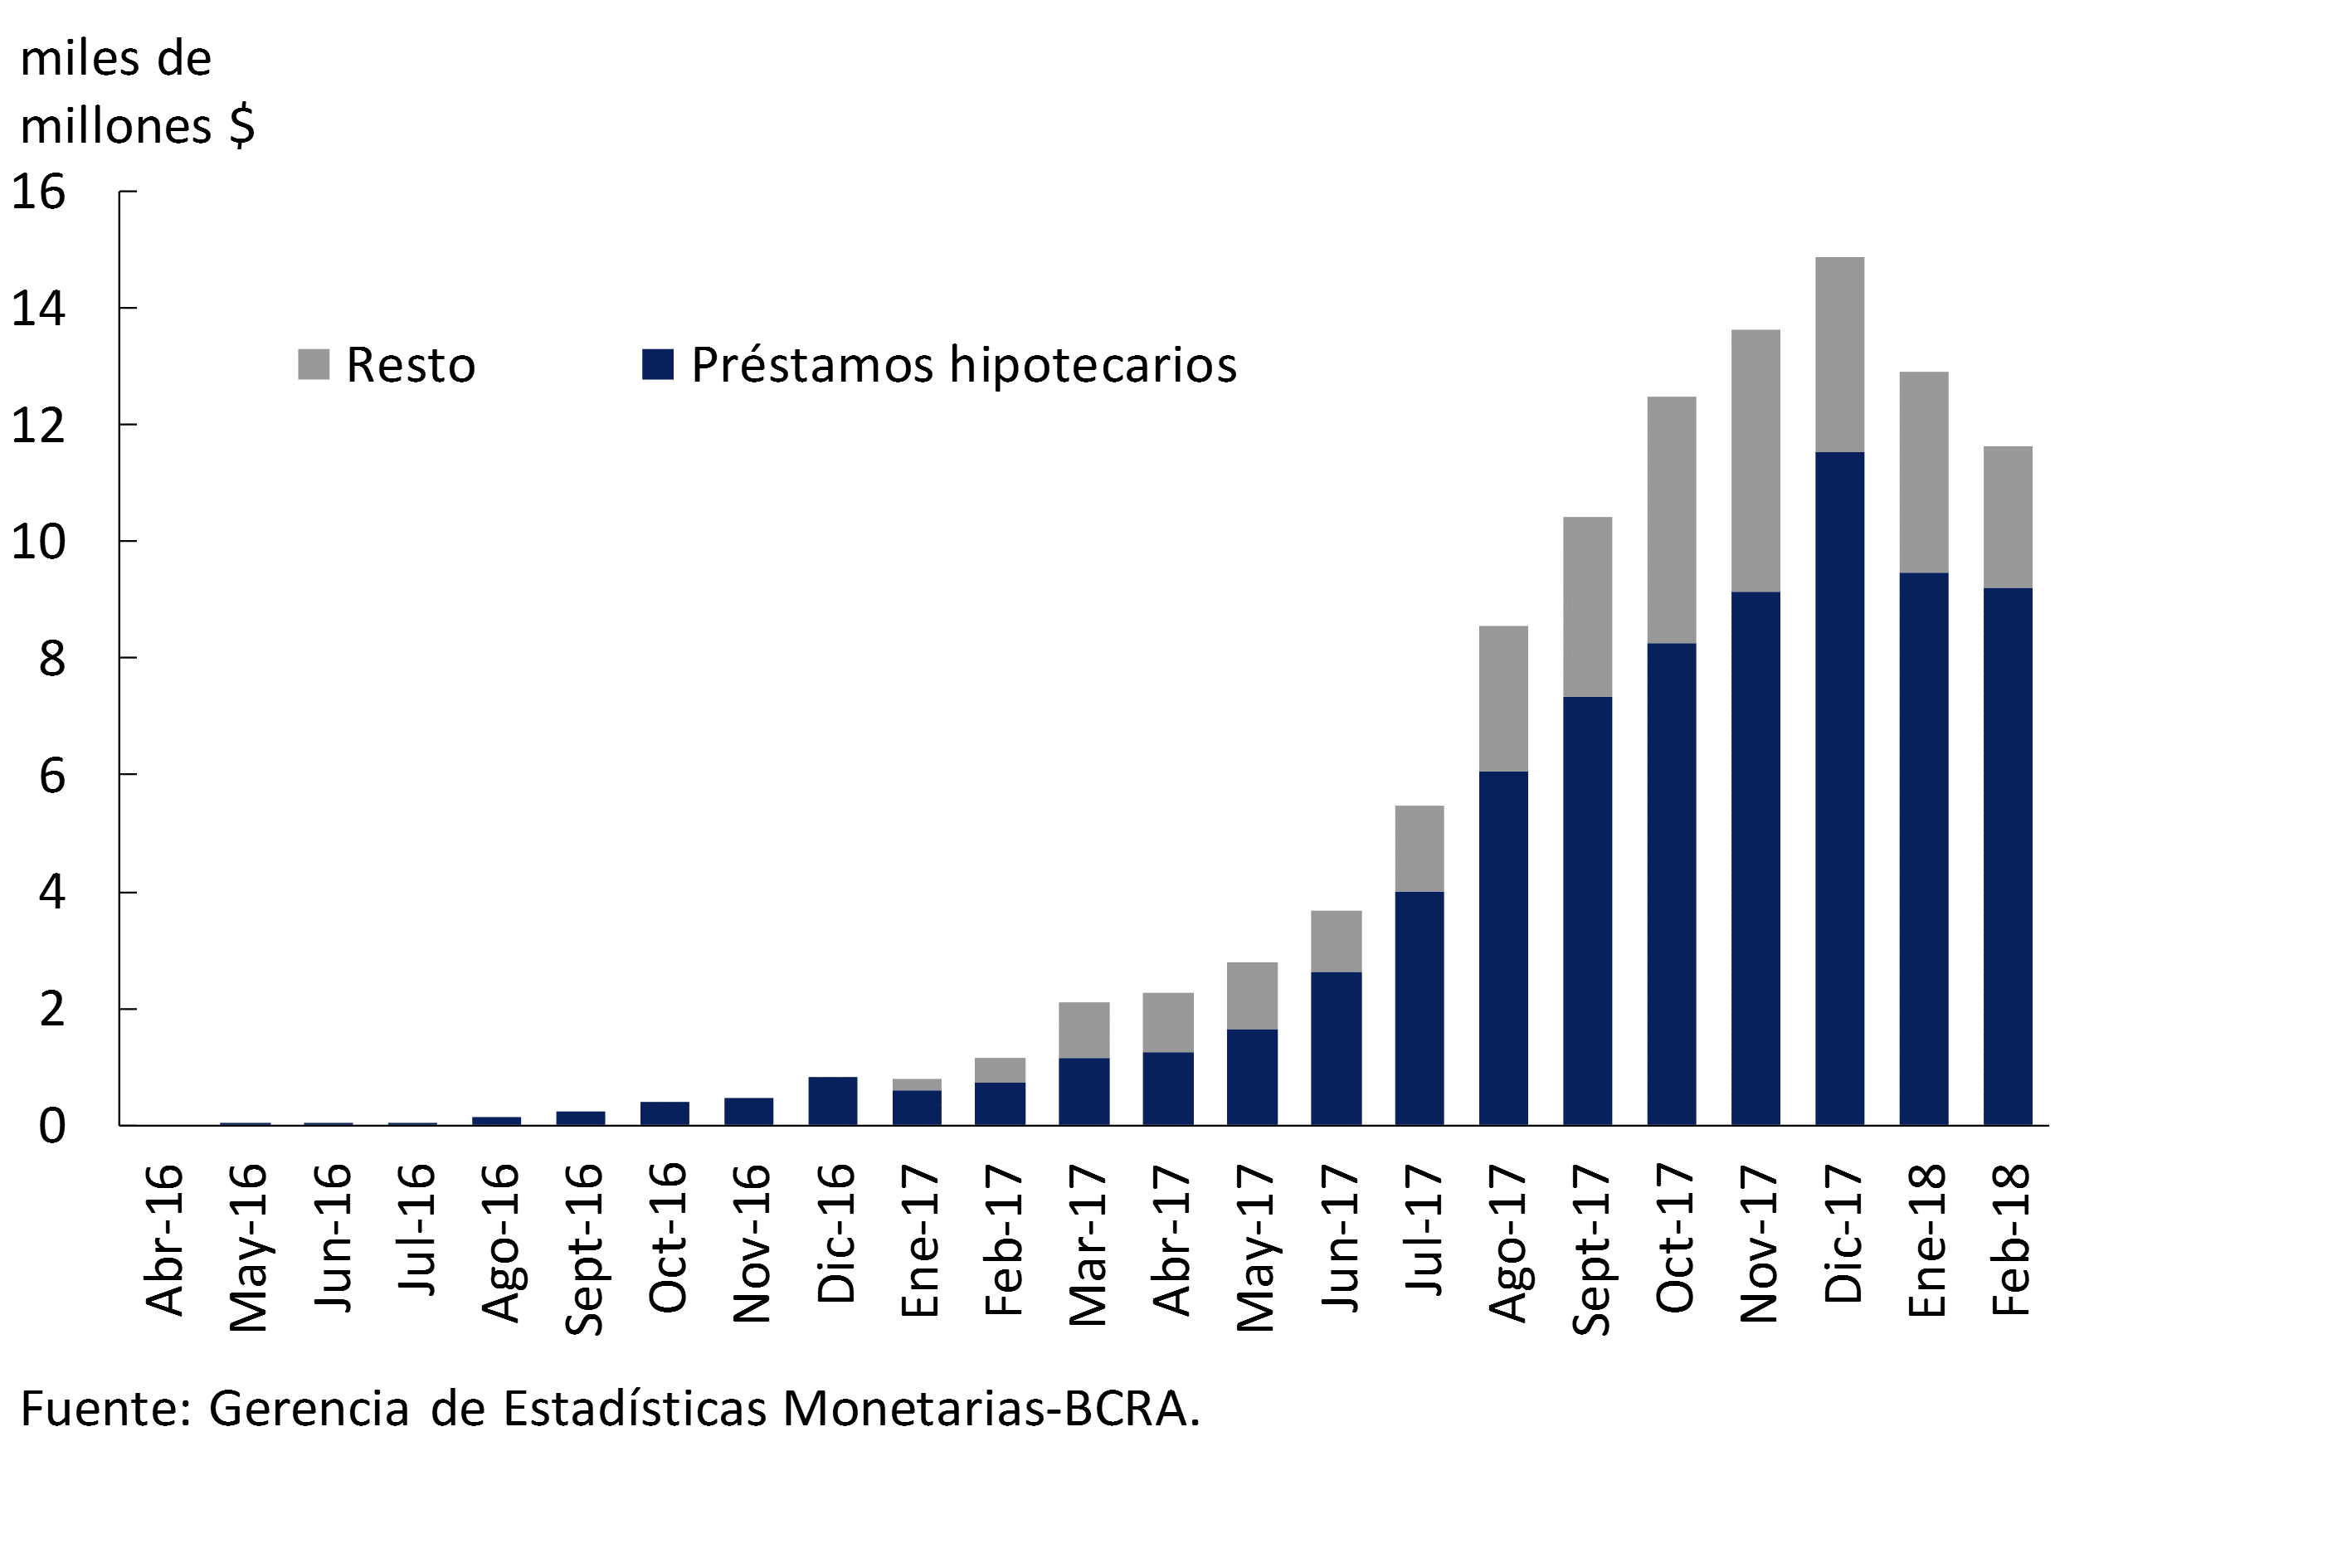
In February, total loans granted in UVA to individuals and legal entities totaled $11,625 million, of which more than 79% corresponded to mortgage loans (see Graph 15). In the first two months of the year, sixteen financial institutions agreed to UVA loans with an average term of 24 years for mortgages, 5 years for personal loans and 4 years for pledges. In this way, since UVA loans began to be granted until the second two months of 2018, more than $104,800 million of financing has been channeled in this unit of account22 (72% mortgage, 25% personal and 3% pledged).
Figure 15 | UVA Financing – Amounts Granted
At the beginning of 2018, nominal interest rates operating in pesos with the private sector23 increased slightly in all groups of financial institutions. In January, there were slight increases in the interest rates agreed on mortgage and consumer loans, and falls in commercial and pledge lines. On the other hand, interest rates operated in UVA increased slightly compared to December, mainly those agreed for personal and pledge loans, (11.6% and 11.7% respectively). Meanwhile, in January the rate of mortgage loans in UVA averaged 4.6%, remaining without significant changes with respect to the end of 2017.
VI. Solvency
As mentioned in section II of this report, since January 2018, financial institutions have been reporting in accordance with IFRS. The initial application of the new accounting criteria meant an improvement in accounting equity for the financial system24. These initial modifications did not affect the monthly flows of the “income statement” (ER) or the monthly flows of the new “other comprehensive income” (ORI) item.
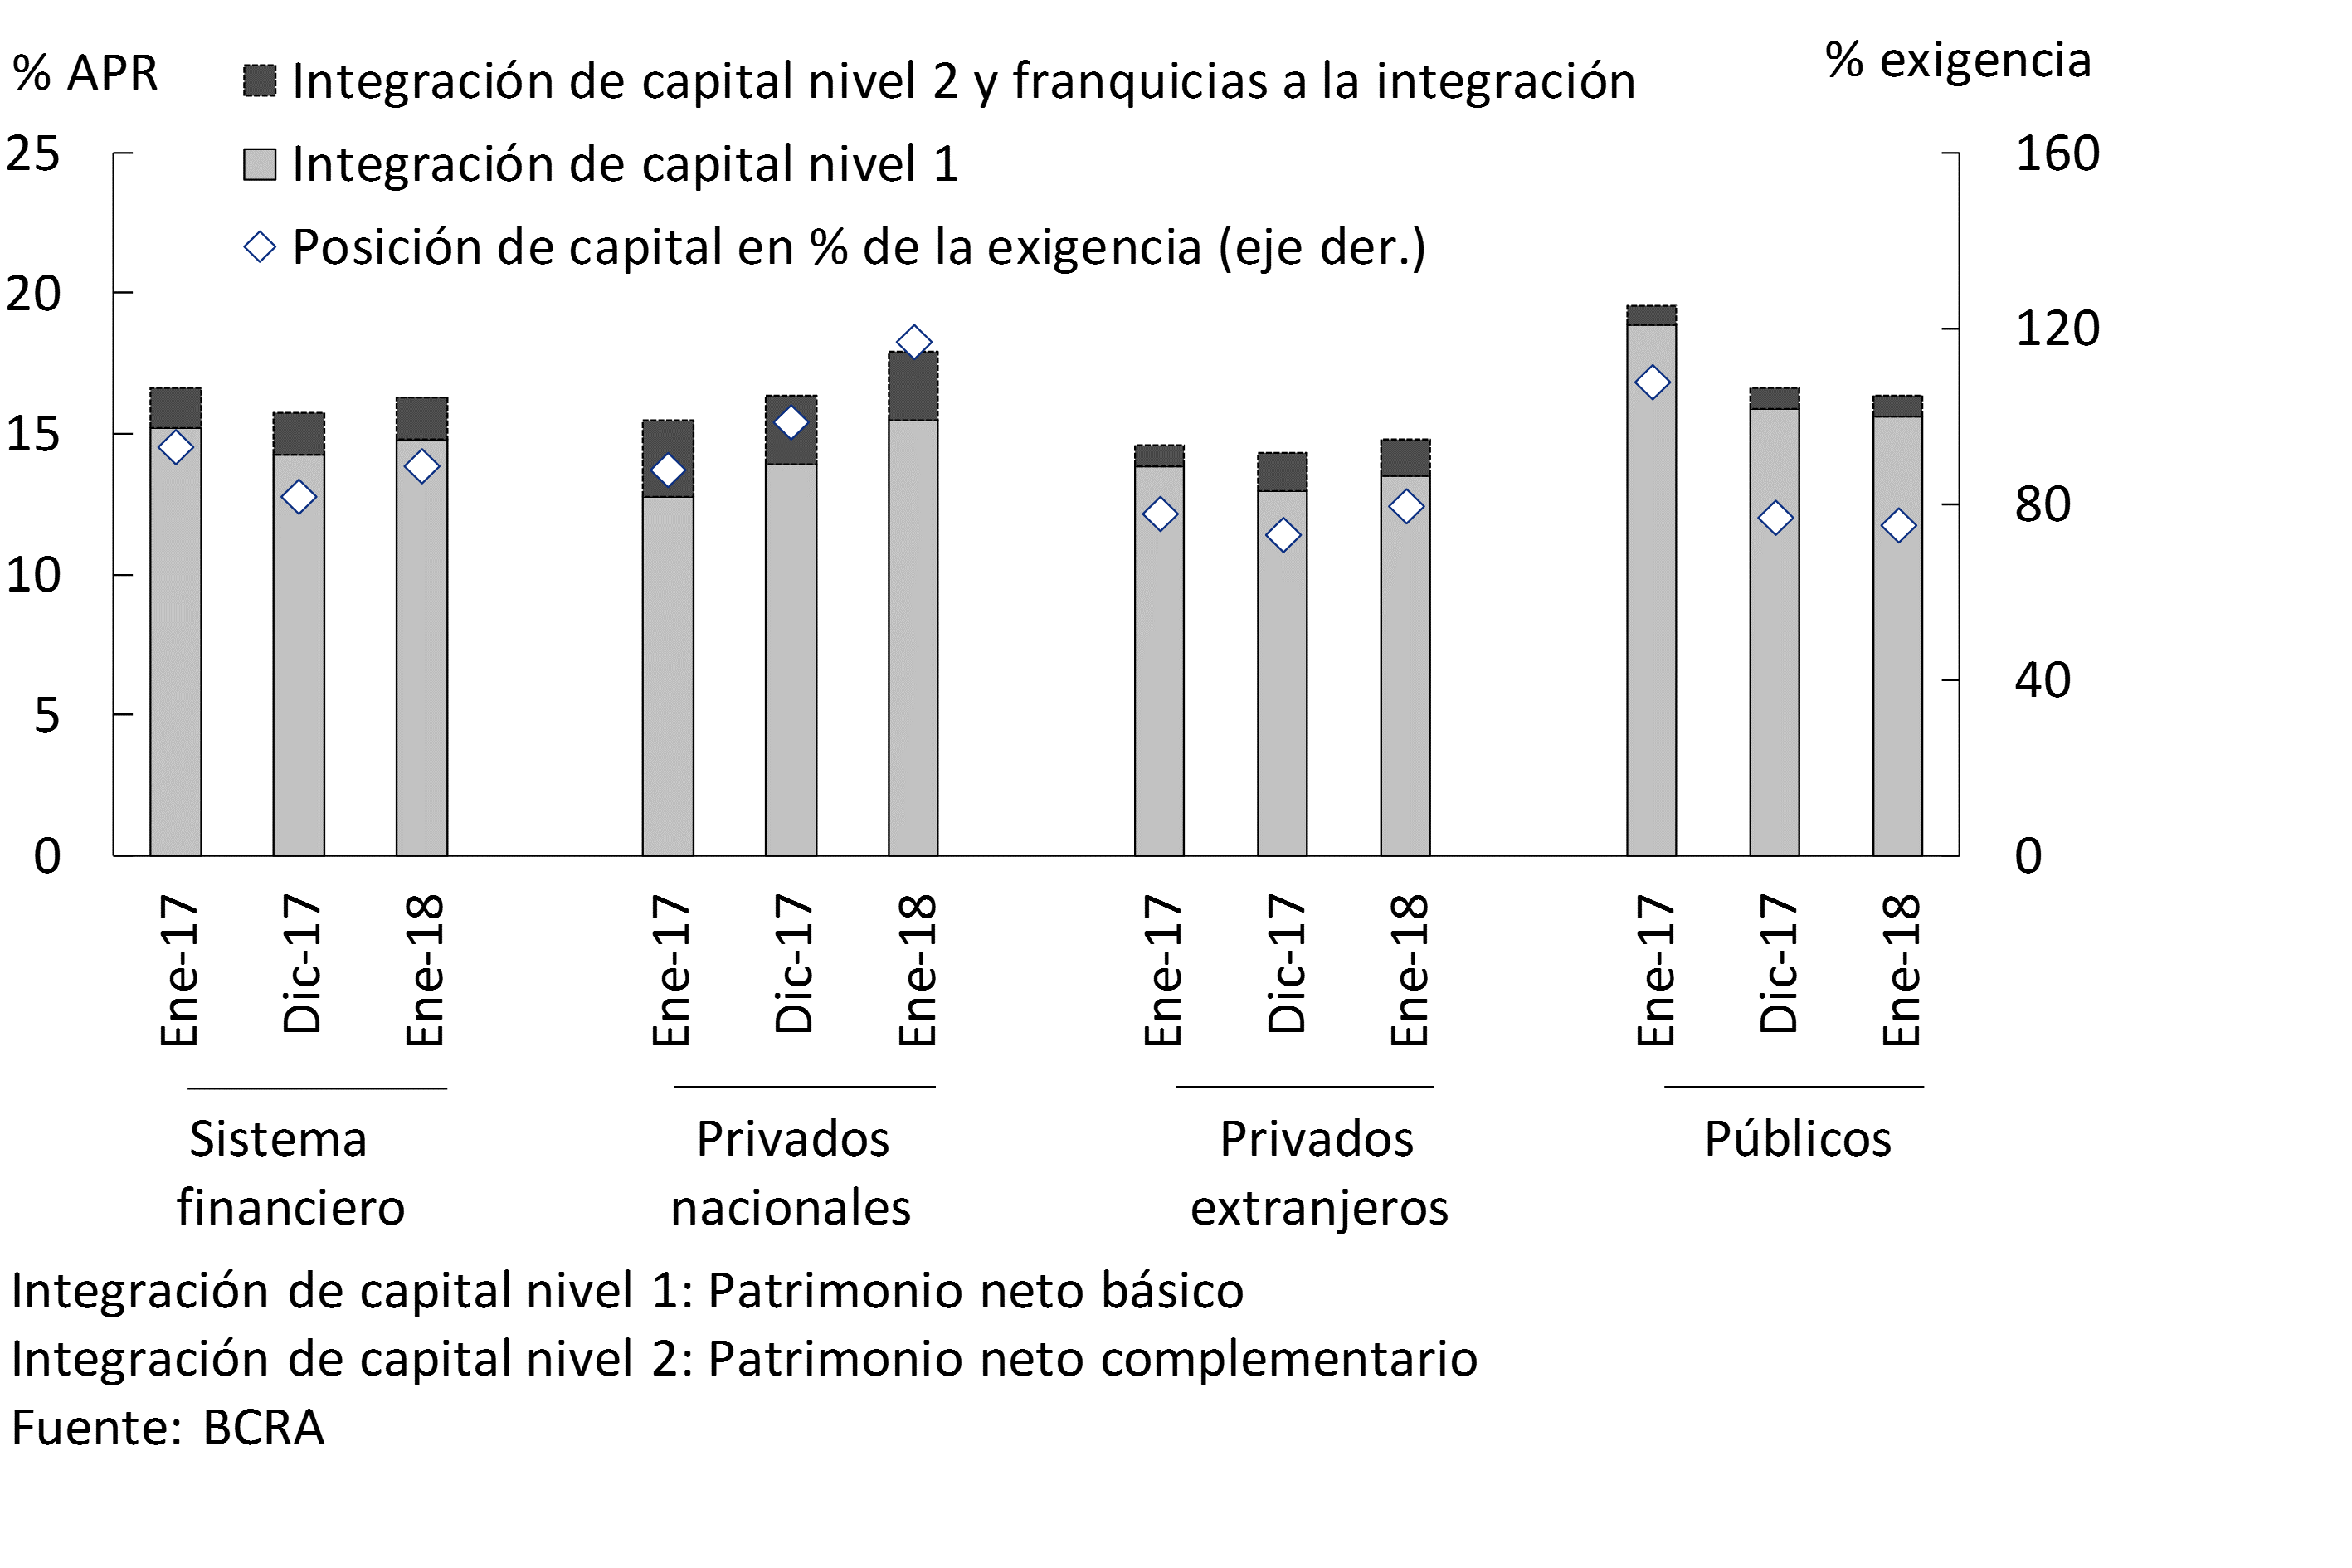
In this context, at the beginning of 2018 the solvency indicators of the aggregate financial system increased. This increase was mainly driven by private banks25. The capital integration of the banks as a whole stood at 16.3% of risk-weighted assets (RWA) in January, 0.6 p.p. more than at the end of 2017 (see Chart 16). Tier 1capital 26 accounted for 14.8% of RWAs at the beginning of the year. At the aggregate level, the excess integration of regulatory capital was equivalent to 88% of the regulatory requirement, 7 p.p. more than in December.
Figure 16 | Integration and Excess Regulatory Capital (Position)
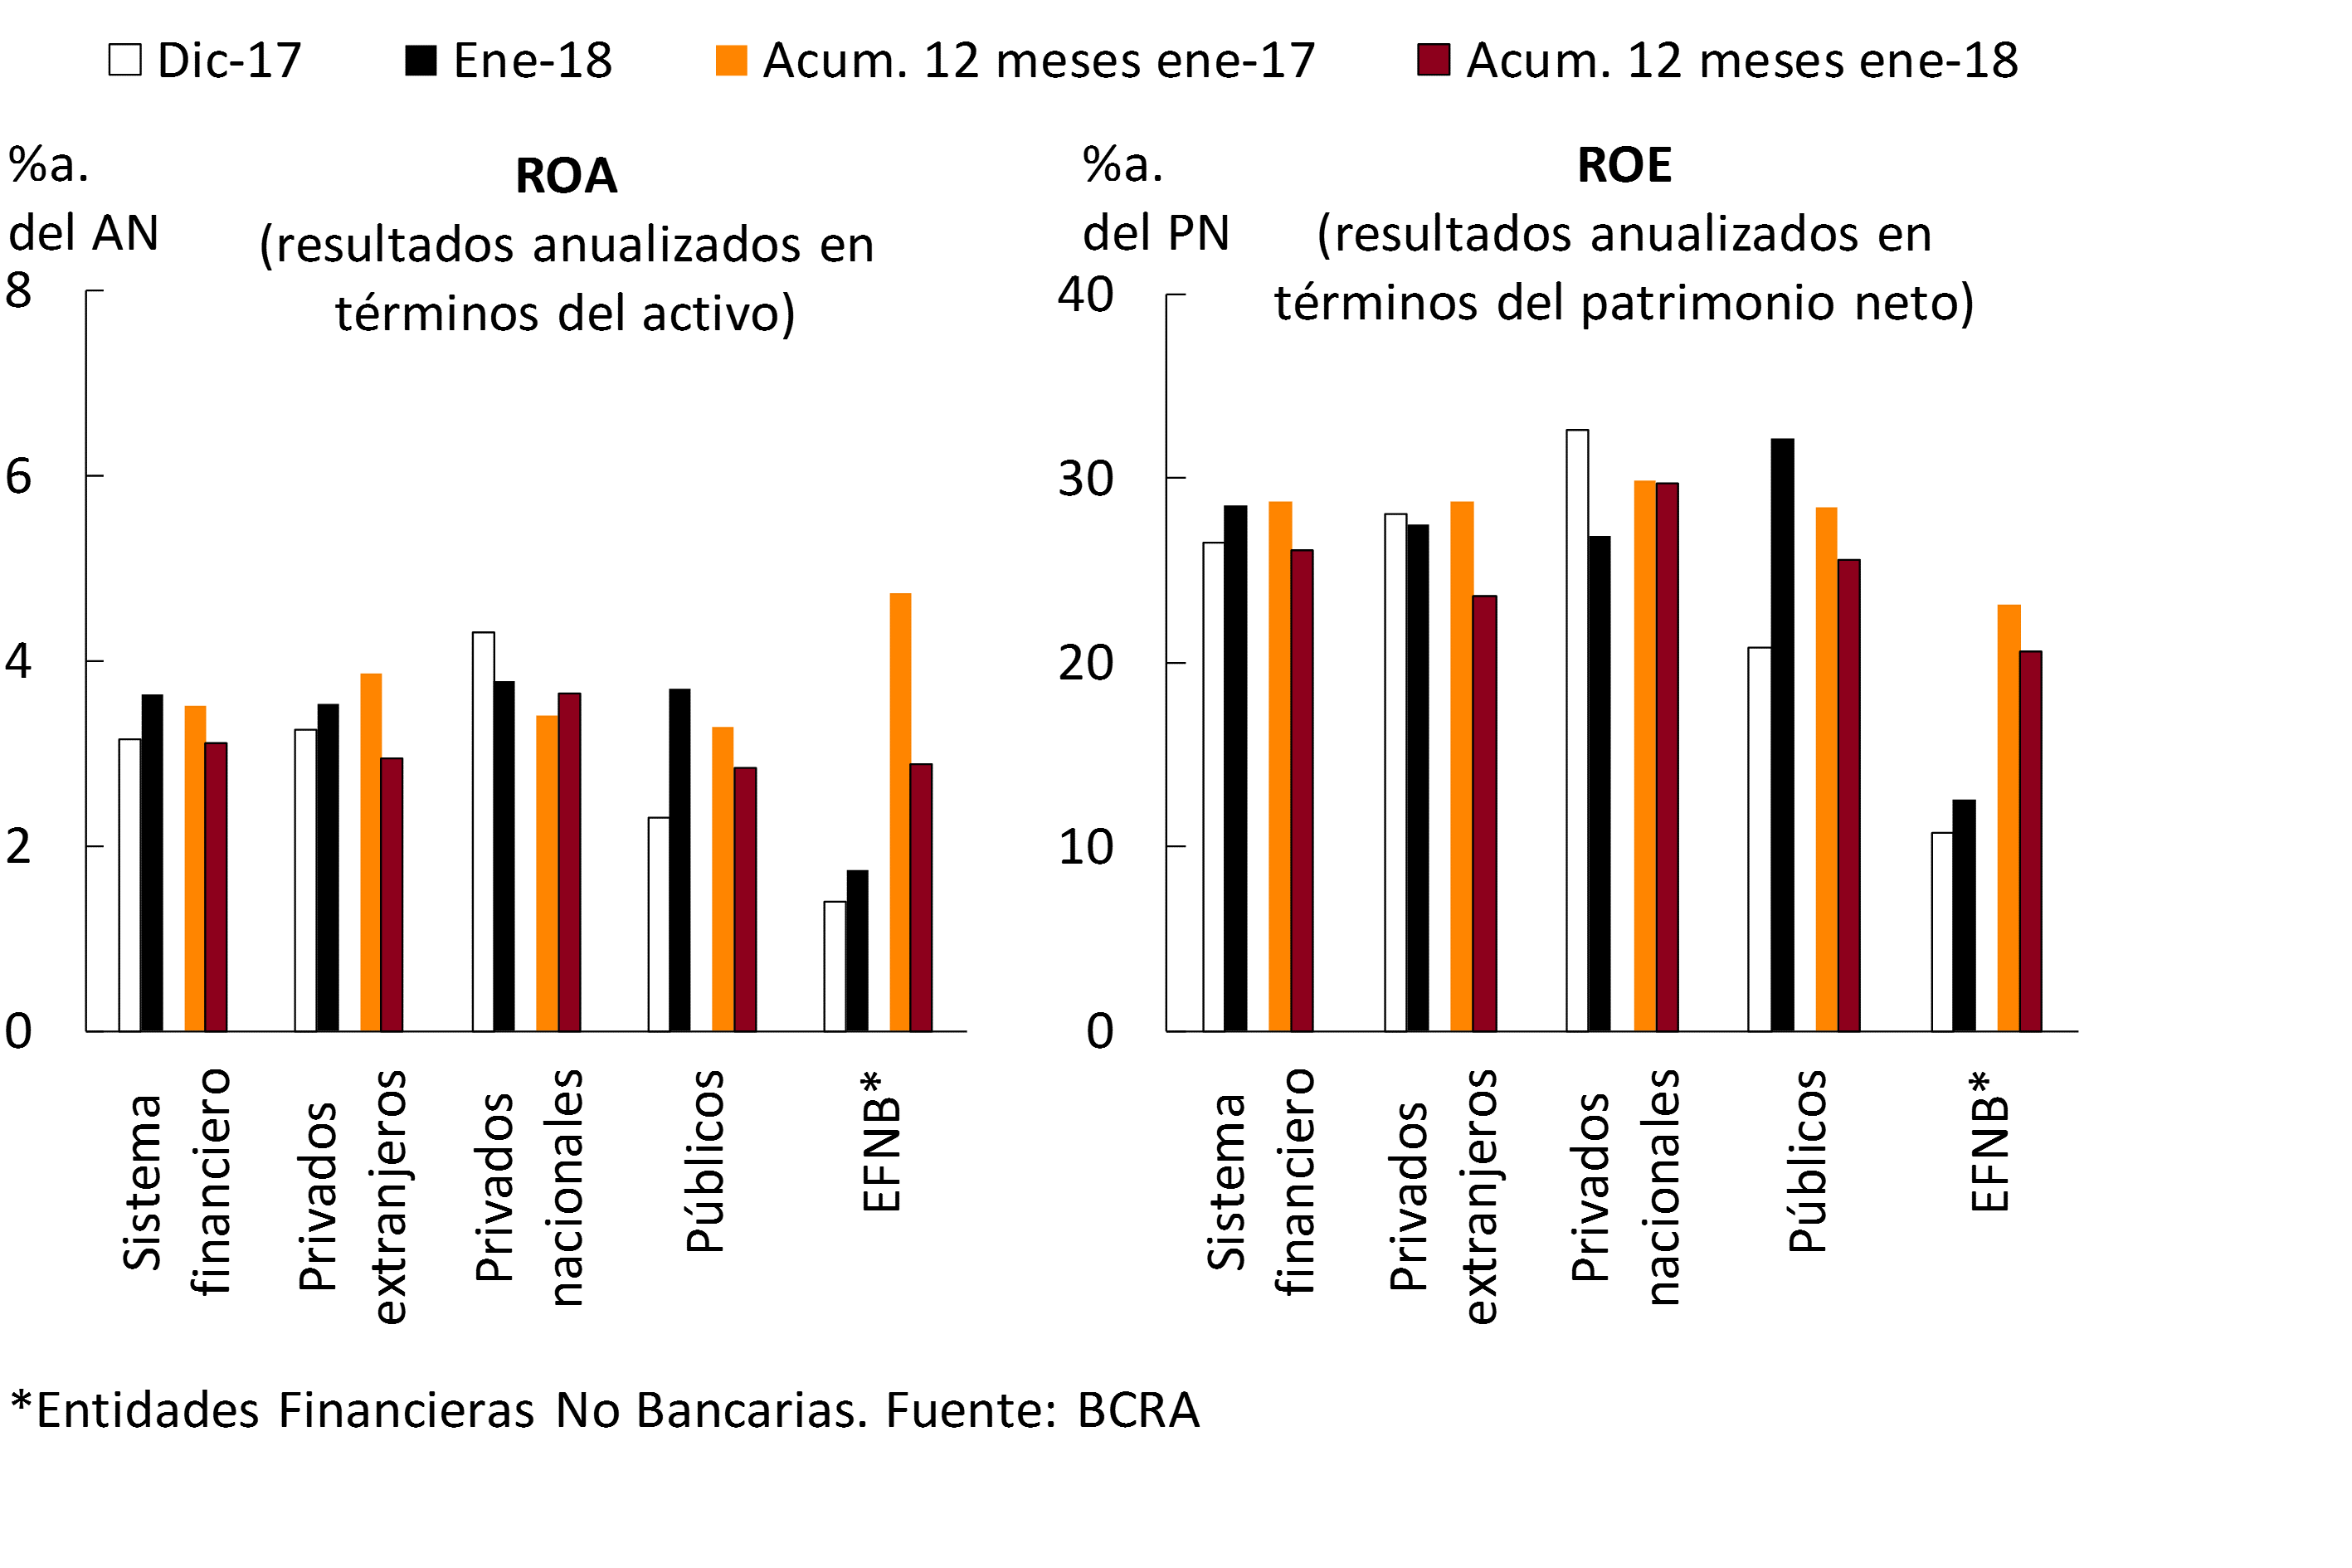
In terms of the income statement (ER), the gains accrued in January by the financial system represented 3.6% y/y of assets (28.5%y. of equity), increasing 0.5 p.p. compared to December and 0.9 p.p. compared to January 2017. The group of private banks obtained gains of 3.6% of assets in the first month of the year (accumulated ROA in 12 months of 3.3%, being 0.3 p.p. lower in a year-on-year comparison). At the aggregate level, if the monthly flow of other comprehensive income27 (ORI) is added, the total comprehensive income (RIT) in terms of assets would reach 3.7%a. in the month (see Table 1). The nominal results of the ER accumulated in the 12 months to January were equivalent to 3.1% of assets, 0.4 p.p. less in a year-on-year comparison (between February 2017 and January 2018 these results reached $89,416 million, with an increase of 21% y.o.y.). In the last 12 months, the results totaled 26.1% of net worth (ROE), 2.7 p.p. lower in a year-on-year comparison (see Chart 17).
Table 1 | Accrued Results – January 2018 – Financial System)
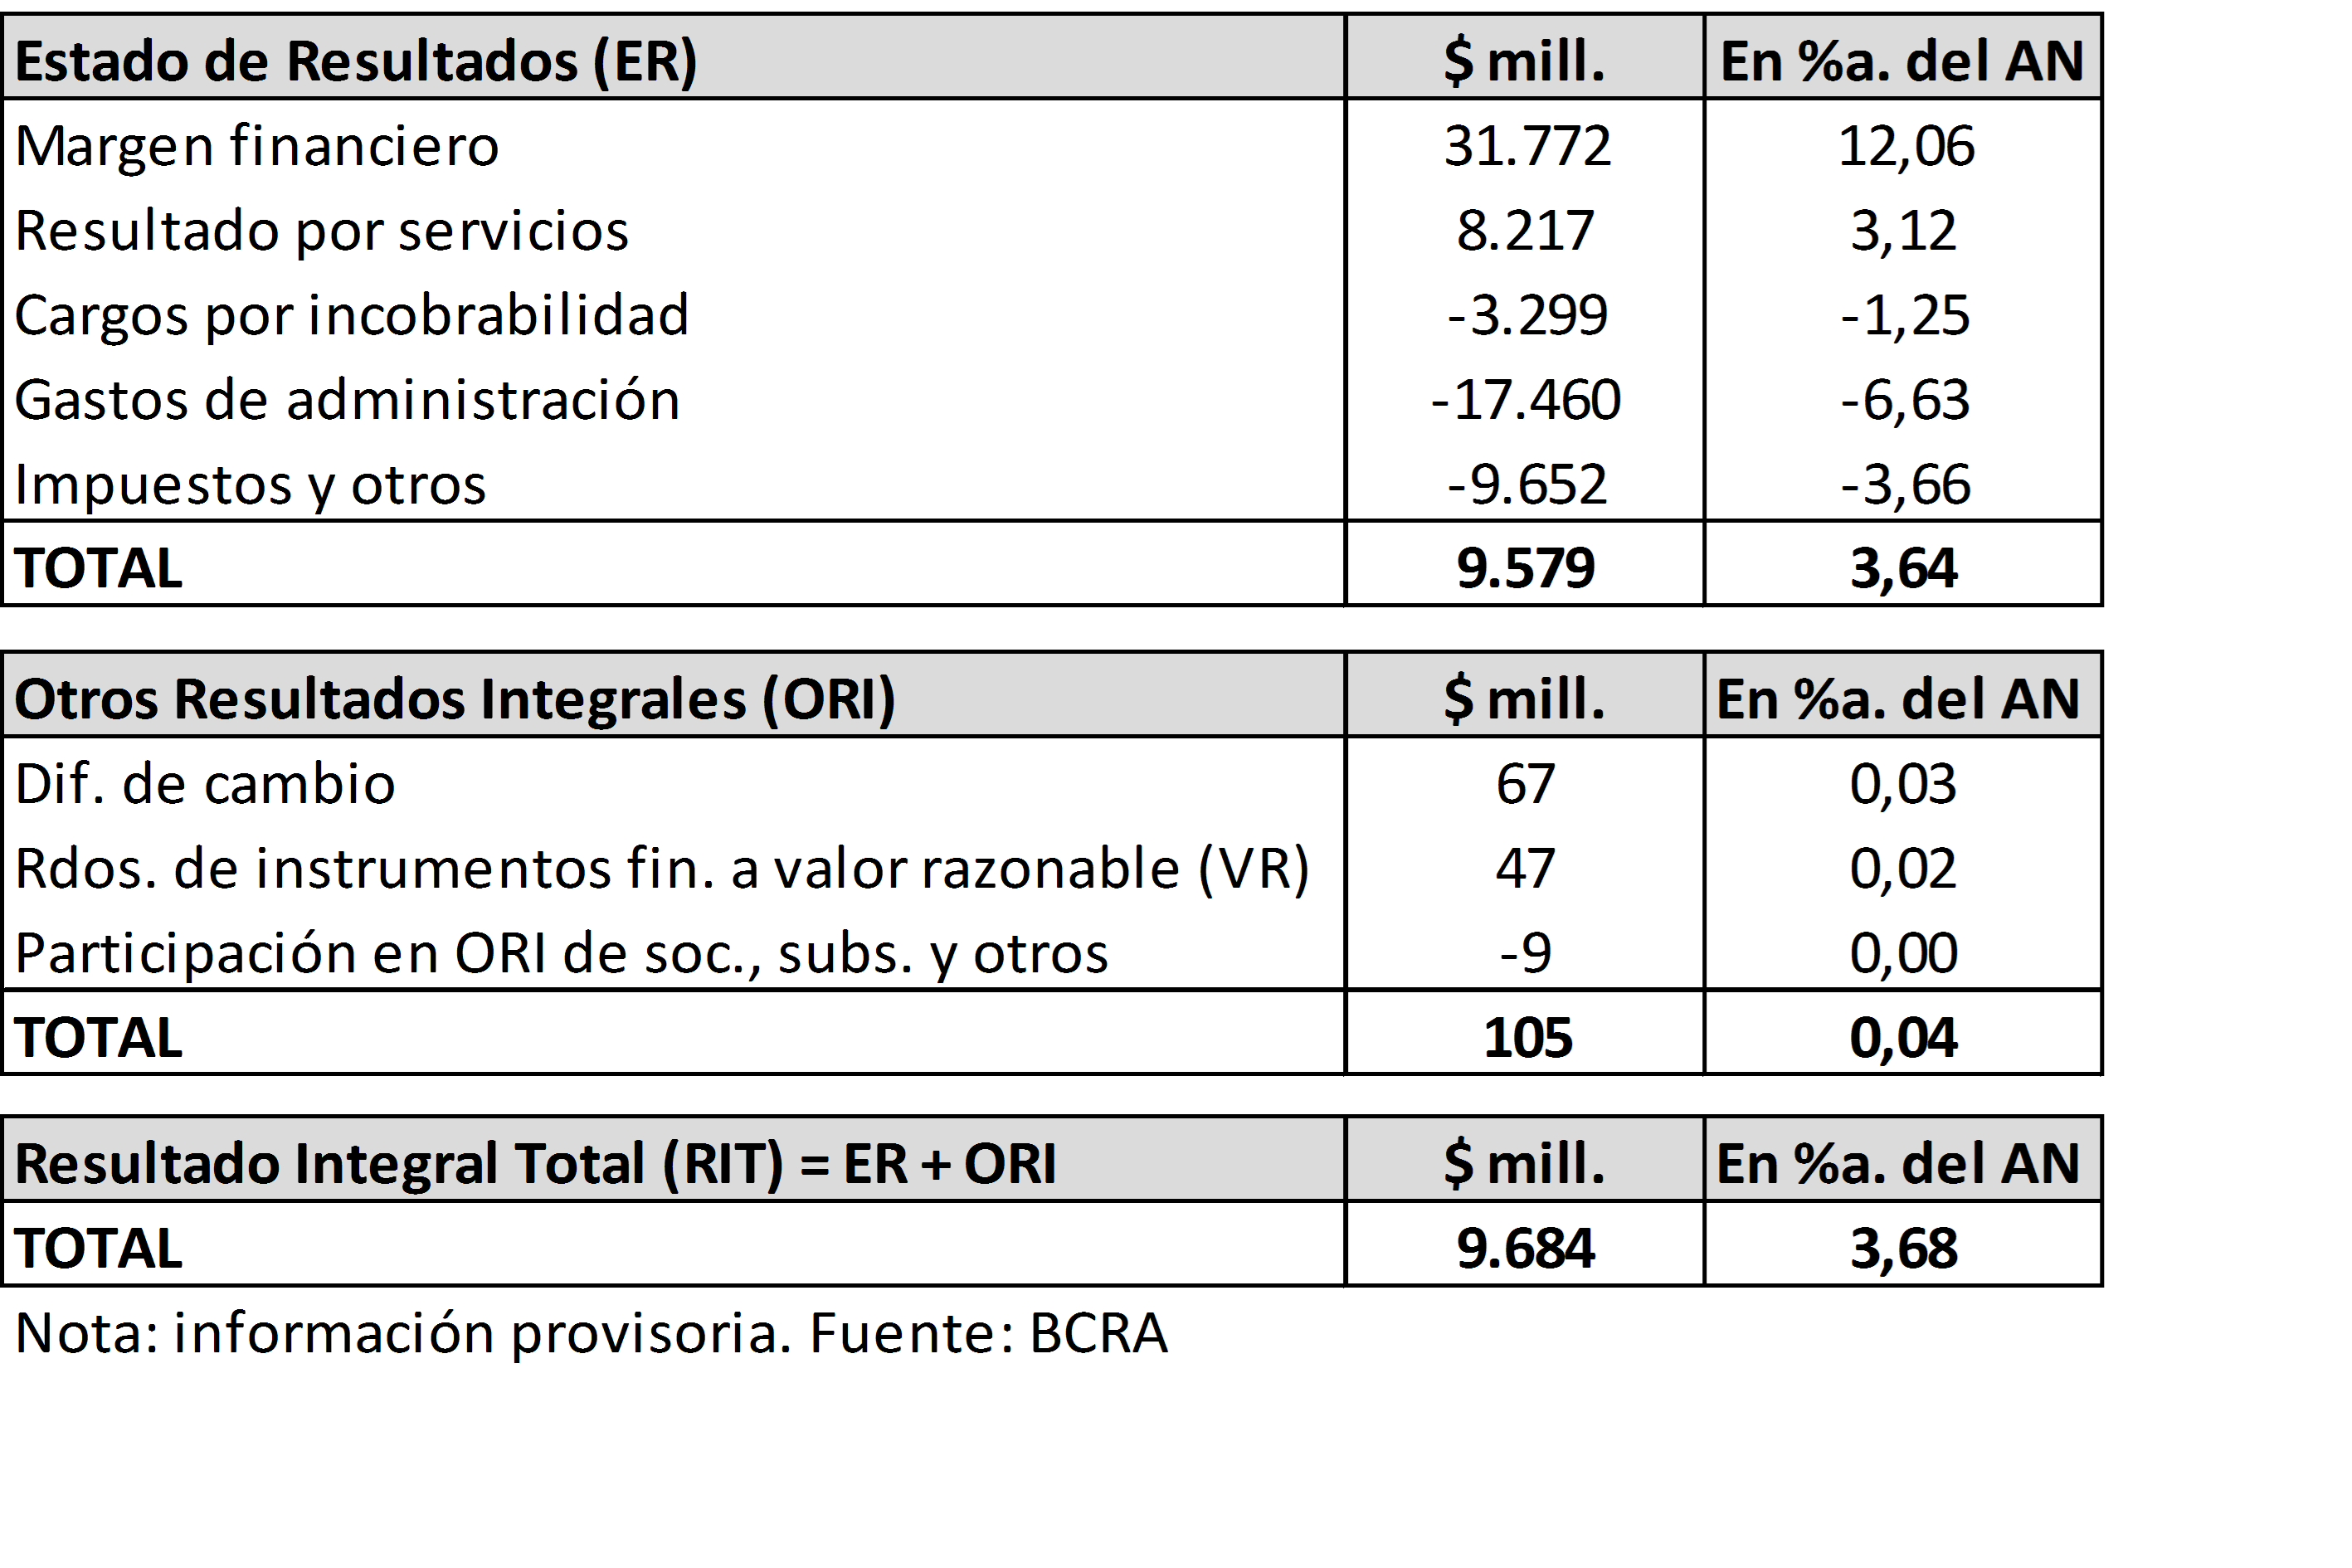
Figure 17 | Income Statement by Financial Institution Group
In January, the financial margin of the banks as a whole represented 12.1% y/y of assets, 0.6 p.p. more than in December. This increase was mainly explained by higher gains on securities, an effect partially offset by lower interest income and a fall in earnings due to share price differences28. The accumulated financial margin in the last 12 months represented 10.5% of assets, 0.7 p.p. less in a year-on-year comparison (see Chart 18). This decline was due to lower interest income and equity gains, variations partially offset by lower interest outflows and higher pass premiums.
Results from financial system services represented 3.1% y/y of assets, falling 0.3 p.p. compared to December partly due to seasonal issues. Considering the cumulative figure for the 12 months to January 2018, net income from services of the banks as a whole totaled 3.5% of assets, falling 0.3 p.p. in a year-on-year comparison (see Chart 18).
Figure 18 | Components of the Income Statement of the Financial System
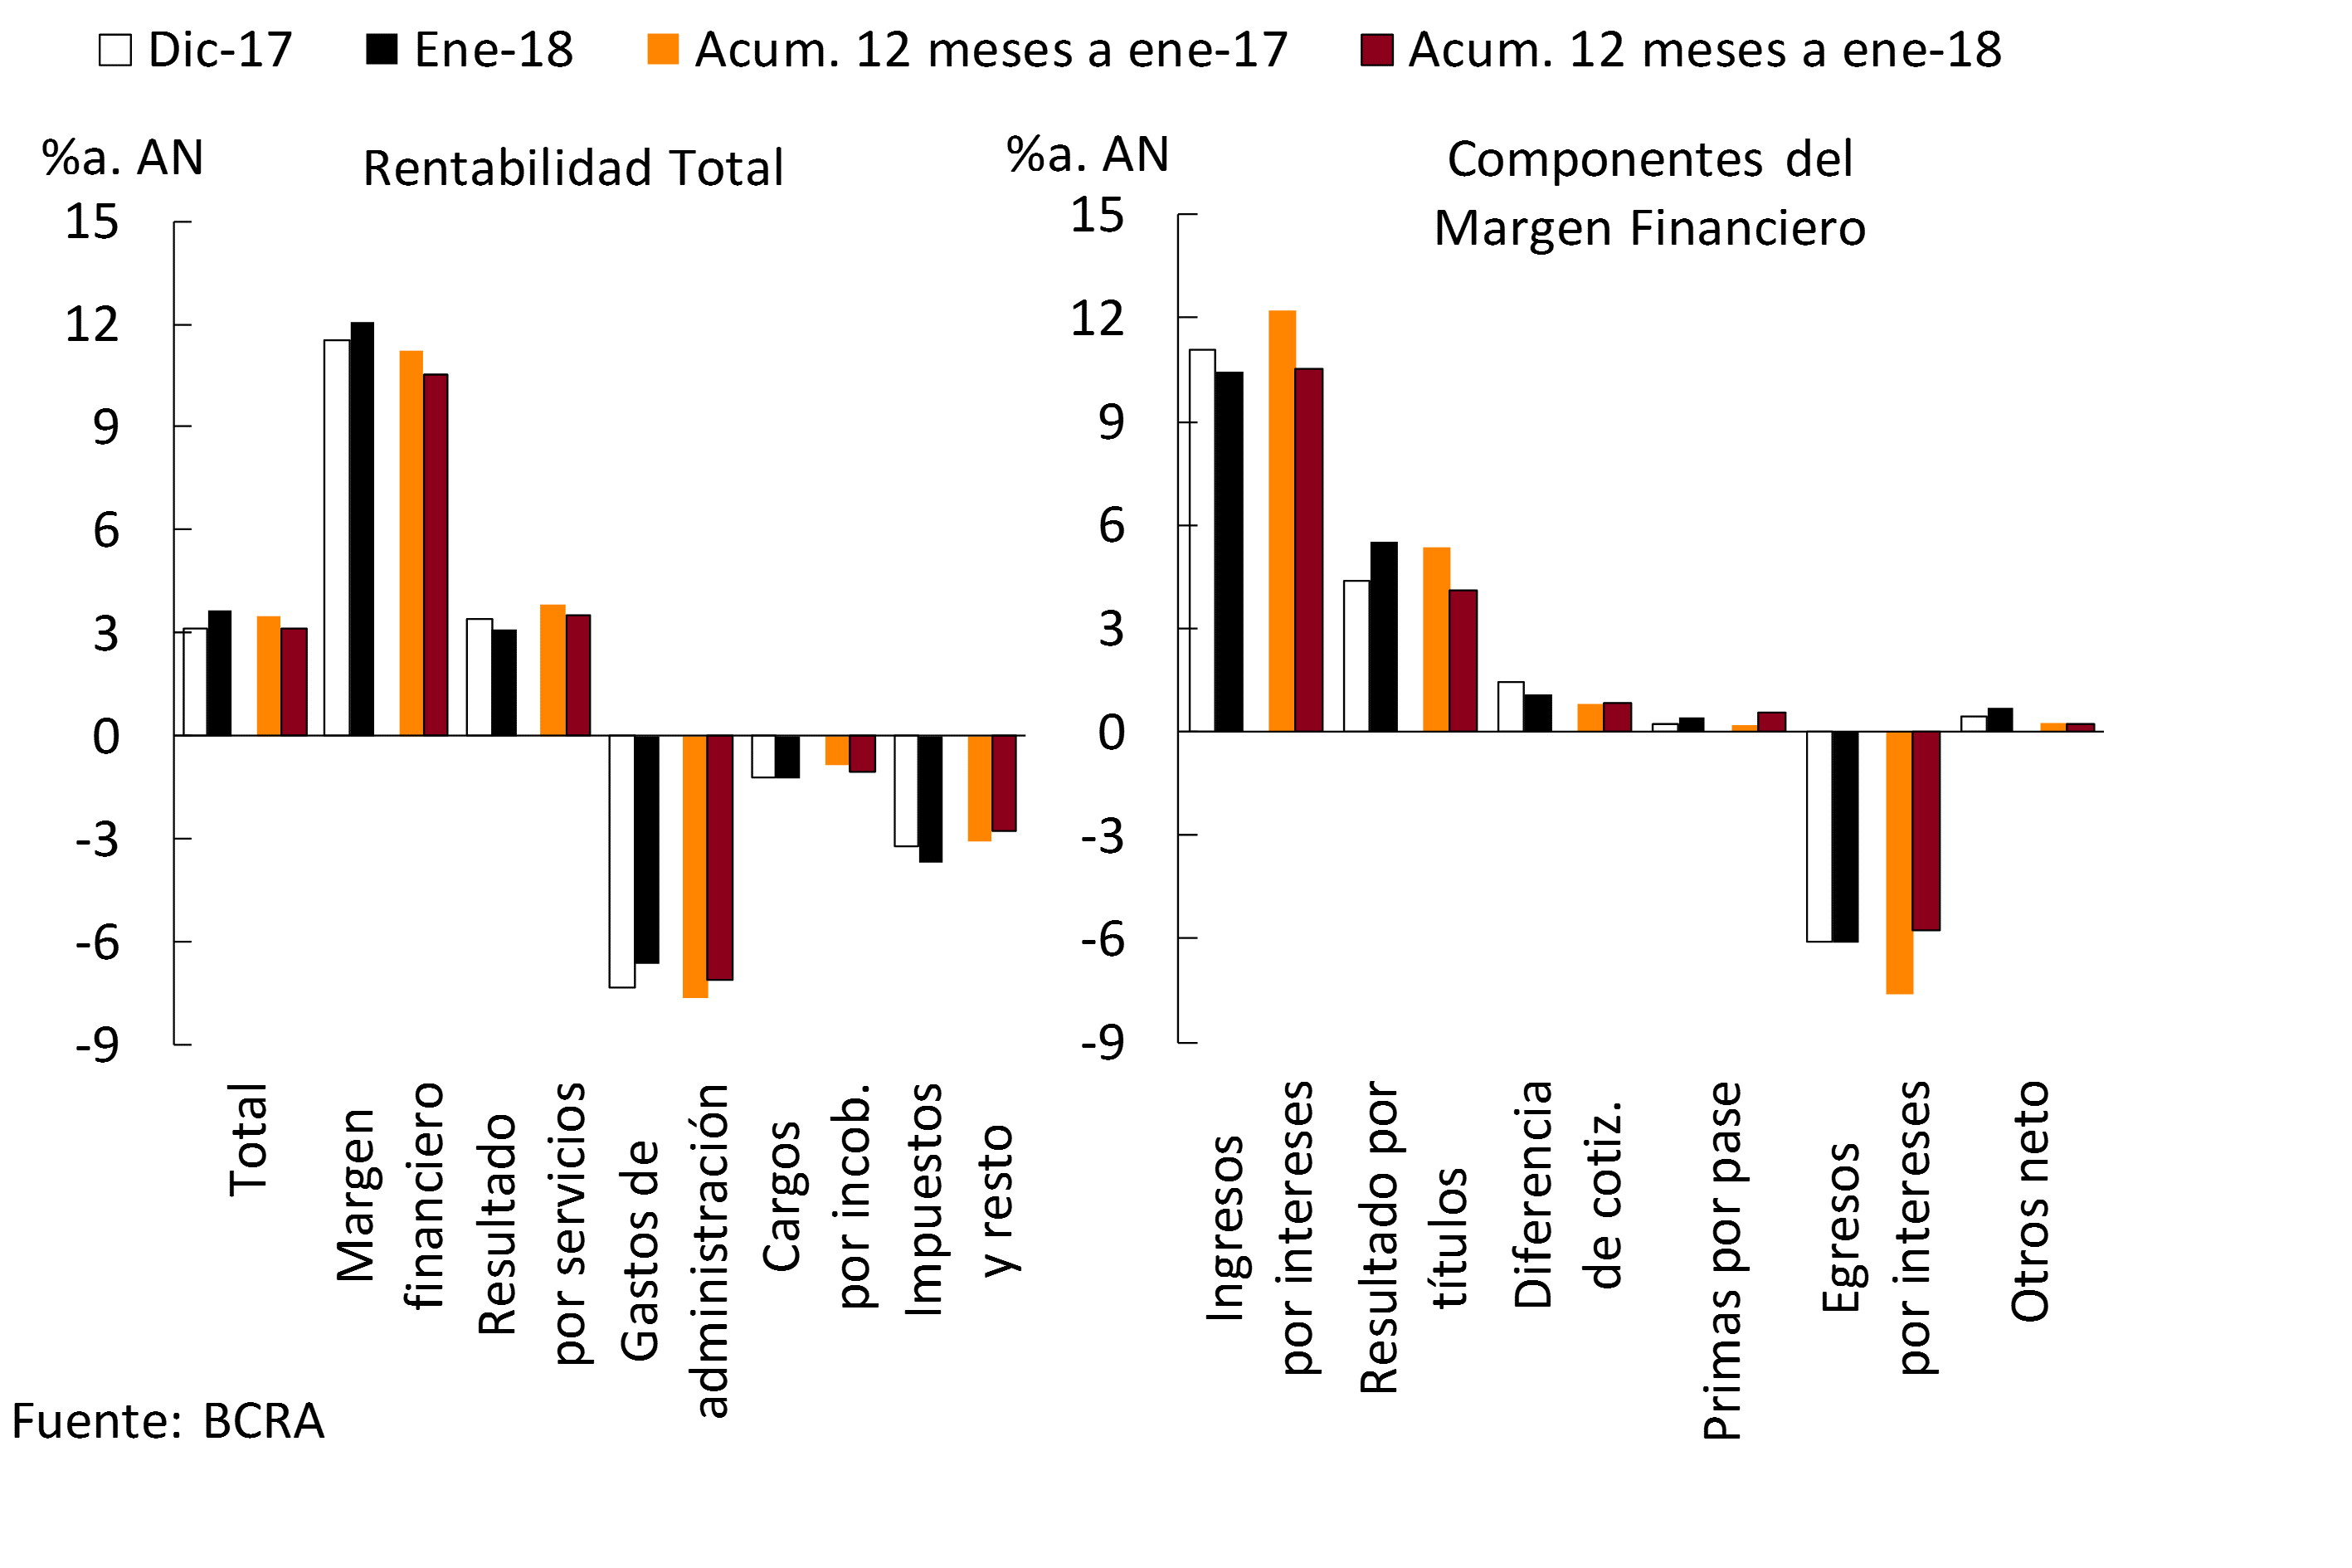
Charges for uncollectibility stood at 1.3% of assets in the first month of 2018, increasing slightly compared to the end of last year. In the accumulated 12 months, charges for uncollectibility of the financial system represented 1.1% of assets, 0.2 p.p. more in a year-on-year comparison.
In January, administrative expenses stood at 6.6% of assets, falling compared to December, partly due to seasonal issues. Between February 2017 and January 2018, the administrative expenses of the financial system represented 7.1% of assets, reducing 0.5 p.p. in a year-on-year comparison (see Chart 18).
In January, tax burdens totaled 1.8% of assets, slightly reduced compared to the end of last year. These tax burdens represented 1.9% of assets in the accumulated 12 months, with no changes in magnitude in a year-on-year comparison. The income tax accrued in January totaled 1.6% of the assets, similar to that of December. In 12 months, this tax represented 1.4% of assets, 0.3 p.p. less than in January 2017.
Regulations
Summary of the main regulations of the month, implemented by the BCRA, related to financial intermediation activity. The effective date of the regulation is taken as a reference.
Communication “A” 6432 – 12/01/18
The rules on “Minimum security measures in financial institutions” are adapted, allowing the use of mobile devices for the sole purpose of promoting, installing and/or explaining how to use the mobile banking applications and/or mobile payment platform that the entities have made available to their customers.
Communication “A” 6433 – 12/01/18
The rules on “Minimum capital of financial institutions” are adapted, incorporating the new standard revised by the Basel Committee on Banking Supervision in terms of securitizations. A standardised approach is introduced for the calculation of the weights to be applied to securitisation positions, providing that those to which this approach cannot be applied are weighted at 1250%. It is established that institutions must have or estimate the information necessary for the calculation of certain variables and, depending on their results, establish the weighting to be assigned to the securitisation position, providing that it is subject to a minimum of 15% for securitisations and 100% for re-securitisations. Two of the three particular treatments in force are repealed: second-loss positions in ABCP (“Asset-Backed Commercial Paper”) programs and eligible liquidity facilities, while the transparency approach is contemplated as an alternative treatment for positions of maximum preference. Criteria are included for the identification of simple, transparent and comparable securitisations, which will receive preferential treatment. By virtue of the aforementioned changes, the rules on “Guidelines for risk management in financial institutions” are adjusted. These measures come into force on 01/03/18.
Communication “A” 6435 – 19/01/18
By virtue of the provisions of Decree No. 30/2018, which eliminates the exclusion of deposits from guarantee coverage to those collected at rates higher than the reference rate, the rules on “Application of the deposit guarantee insurance system” are adapted. It is established that demand deposits in which interest rates higher than the determined reference rates are agreed and time deposits and investments that exceed 1.3 times that rate are excluded from coverage. For its part, based on the provisions of Decree No. 27/2018, the rules on “Credit Management” are modified.
Communication “A” 6437 – 19/01/18
The rules on “Mutual Guarantee Companies” and “Public Guarantee Funds” are modified, incorporating as beneficiaries the guarantees granted to third parties (in general) other than the participating partners (MSMEs).
References
* As of the change in the form of presentation of the balance sheets due to the local application of International Financial Reporting Standards (IFRS), the information for January 2018 should be considered provisional and subject to rectification. In particular, at the time of publication of this Report, the balance sheets of 65 of the 77 financial institutions are available, representing 89% of total assets. On the other hand, no data are available as of January 2018 on the Monthly Information Regime for Debtors of the Financial System or the Monthly Information Regime for Securities.
1 Reference is made to those measures of relevance to the financial system that were adopted since the date of publication of the previous Report on Banks.
4 Correspond to those entities in which the amount of their deposits is less than 1% of the total deposits of the financial system.
8 For more details, see Section 3 of the Financial Stability Report (FSR) for the first half of 2017.
9 The increase in equity reached 11.6% and 10.1% for the group of public and private banks, respectively.
10 Assets and liabilities are net of accounting duplications for pass-through, forward and spot transactions to be settled.
11 Based on balance sheet balances.
12 This performance was mainly explained by funds from the National Treasury. For more details, see the Deposits and Liquidity Section of this Report.
13 This variation is made up of an increase of $62,000 million in LELIQs, $35,000 in LEBAC holdings and a reduction of $31,000 million in debtors for transfer operations.
14 See note 11.
15 In addition, within the framework of the local application of IFRS, “Other Assets” gain share, in large part, due to the aforementioned revaluation of Goods for Use.
16 In the context of the National Treasury’s debt placements and the receipt of temporary advances, public sector deposits were driven both by the demand segment in foreign currency (+150.7% in source currency) and by term placements in domestic currency (+66.5% adjusted for inflation).
17 Ample liquidity, considering only items in pesos, stood at 40.5% of deposits in pesos in January, 1.7 p.p. above the previous month and 0.4 p.p. below the figure for early 2017.
18 For the monthly variation, balances of loans and assets in financial lease (without accrued interest or adjustments) are considered. In line with the recommendations of international organizations, the BCRA opportunely ordered that as of January 2018, financial institutions must prepare and present their balance sheets in accordance with International Financial Reporting Standards (IFRS) using criteria that bring accounting closer to economic reality. Taking into account the new adjustments recorded in January – derived from the valuation at the effective rate or fair value – the increase in total credit to the private sector would be 0.2% in real terms compared to December. In the month, two financial trusts were issued for a total of $768 million with credits originated by financial institutions, corresponding to $388 million to securitizations of financial lease contracts and $380 million to securitizations of personal loans. Under the adoption of IFRS, part of the amount of the trusts issued remained recorded within the asset. In fact, if the balance sheet is corrected for the assets securitized and derecognized from the assets in the month, the real increase in total loans to the private sector would remain at 1.1%.
19 Variation in currency of origin.
20 If the balance sheet is corrected for assets securitized in January and derecognized from assets, real growth in loans in pesos to the private sector would remain at 0.4%.
21 Variation in currency of origin.
22 These amounts operated do not consider the adjustment of the capital by CER.
23 It includes a fixed and repacable interest rate.
24 It should be considered that financial institutions may not make distributions of profit or loss with the accounting gain arising from the application of International Financial Reporting Standards (IFRS) for the first time, and must constitute a special reserve that may only be set aside for capitalization or to absorb any negative balances under the heading “Unallocated results”. See Communication “A” 6327.
25 In addition to the effect of the increase in equity that will gradually be reflected in the regulatory capital, in the month there was evidence of a capital contribution from Grupo Financiero Galicia to Banco Galicia.
26 Tier 1 capital defined as basic equity (ordinary and additional capital, net of deductible accounts). Com “A” 5369.
27 In January, the financial system recorded only $105 million of positive results in terms of ORI, mainly due to the exchange difference for the period due to the translation of financial statements of foreign businesses and gains from the valuation of financial instruments at fair value with changes in ORI. Only 15 financial entities used these items in January 2018. However, it should be noted that the information used for the month of January is subject to rectifications and not all the entities are available.
28 Although they remained at high levels, based on the monthly increase of 4.7% in the nominal peso-dollar exchange rate.
Glossary
%a.: annualized percentage.
% YoY: Year-on-year percentage.
Liquid assets: availabilities (integration of “minimum cash” in current accounts at the BCRA and in special guarantee accounts and other concepts, mainly cash in banks and correspondent offices) plus the net credit balance for transfer operations of financial institutions against the BCRA using LEBAC and NOBAC.
Consolidated assets and liabilities: those arising from deducting transactions between entities in the system.
Net Assets (NA): Assets and liabilities are net of accounting duplications for pass-through, forward and spot transactions to be settled.
APR: Total Risk Weighted Assets.
BCBS: Basel Committee on Banking Supervision (BCBS).
Irregular portfolio: portfolio in situation 3 to 6, in accordance with the “Classification of Debtors” regime.
Credit to the public sector: Position in public securities (without LEBAC or NOBAC) + Loans to the public sector + Compensation to be received + Debt securities and Certificates of participation in financial trusts (with underlying public securities) + Miscellaneous credits to the public sector.
Credit to the private sector: loans to the non-financial private sector including accrued interest and CER and CVS adjustment and leasing.
Contribution differences: Results from the monthly update of assets and liabilities in foreign currency. The item also includes the results originated by the purchase and sale of foreign currency, which arise as a difference between the agreed price (net of the direct expenses originated by the operation) and the book value.
Miscellaneous: miscellaneous profits (including, but not limited to, gains on permanent shares, recovered loans and unaffected provisions) less miscellaneous losses (including, but not limited to, losses on permanent shareholdings, loss on sale or disposal of goods for use and amortization of business keys).
Equity exposure to counterparty risk: irregular portfolio net of provisions in terms of equity.
Administration expenses: includes remunerations, social charges, services and fees, taxes and amortizations.
IEF II-17: BCRA Financial Stability Report.
IPCBA: Consumer Price Index of the City of Buenos Aires.
CSF: Liquidity Coverage Ratio (LCR).
LEBAC and NOBAC: bills and notes issued by the BCRA.
LELIQ: BCRA liquidity bills.
LR: Leverage Ratio (LR).
Financial margin: Income minus financial expenses. It includes interest and securities earnings, CER and CVS adjustments, exchange rate differences and other financial results.
Mill.: Million or million, as appropriate.
IFRS: International Financial Reporting Standards.
ON: Negotiable Obligations.
ORI: Other comprehensive results.
OS: Subordinated Obligations.
Other financial results: rental income from financial leases, contribution to the deposit guarantee fund, interest on availabilities, charges for loan depreciation, premiums for the sale of foreign currency and other unidentified items.
PN: Net Worth.
p.p.: percentage points.
SME: Small and Medium Enterprises.
Consolidated profit: Results from permanent holdings in local financial institutions are eliminated. Available since January 2008.
Income from securities: includes results from public securities, temporary shares, negotiable obligations, subordinated obligations, options and other credits for financial intermediation. In the case of public securities, it includes the results accrued in terms of income, differences in share price, exponential increase based on the internal rate of return (IRR) and sales, in addition to the charge for forecasts for the risk of impairment.
Interest income: interest charged minus interest paid for financial intermediation, following the accrual criterion (balance sheet information) and not what is received. It includes interest on loans and deposits of government securities and premiums for passes.
Result for services: commissions charged minus commissions paid. It includes fees related to obligations, credits, securities, guarantees granted, the rental of safe deposit boxes and foreign and exchange operations, excluding in the latter case the results from the purchase and sale of foreign currency, the latter being accounted for in the “Differences in quotation” account. Expenses include commissions paid, contributions to the ISSB, other contributions for income from services and charges accrued from the gross income tax.
ROA: Final result as a percentage of net assets. In the case of referring to accumulated results, the average of the NA for the reference months is considered in the denominator.
SWEE: Final result as a percentage of equity. In the case of referring to accumulated results, the average net worth for the reference months is considered in the denominator.
RPC: Computable Patrimonial Liability. For more details, see Ordered Text “Minimum Capitals of Financial Institutions”.
TNA: Annual nominal rate.
US$: US dollars.
UVA: Unit of Purchasing Value.
ICU: Housing Units.
Share on


