I. Financial intermediation activity
The intermediation activity of the financial system with the private sector closed the year with significant growth. Considering the most important differences in the balances of the balance sheet in pesos of the group of entities – in homogeneous currency – in December the main sources of resources materialized from the reduction in LEFI holdings and the increase in the balance of private sector deposits. The most relevant application of funds for the segment in pesos in the month was the increase in the real balance of credit to the private sector and, to a lesser extent, the increase in the real balance of the current accounts of the entities in the BCRA and the decrease in the real balance of public sector deposits. With regard to foreign currency items, in December the balance of financing to the private sector increased and the balance of deposits in this sector was reduced, in a context of a decrease in liquid assets in this denomination.
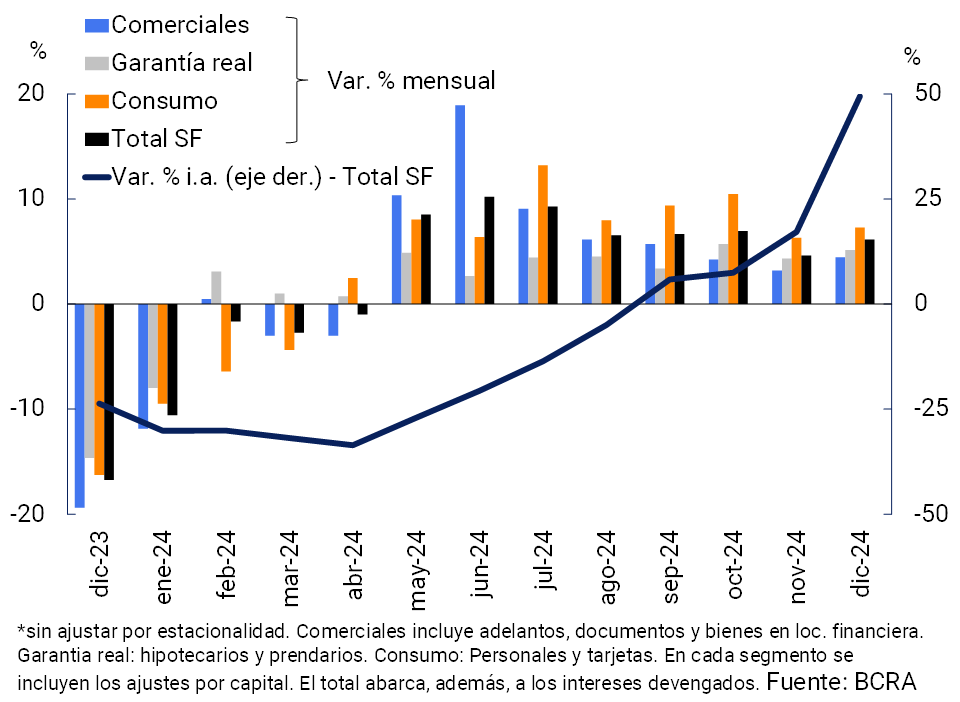
The real balance of financing in pesos to the private sector grew 6.2% in December (see Graph 1)1. The monthly dynamics were mainly explained by consumer lines (+7.3% in real terms in the month) and, to a lesser extent, by loans with real collateral (+5.1% real monthly) and commercial lines (+4.5% real in the month). In this way, the real balance of credit in pesos to the private sector accumulated an increase of 49.4% compared to the end of 2023.
Graph 1 | Real balance of credit to the private sector in pesos*
Graph 2 | Financial intermediation with the private sector in foreign
currency In source currency
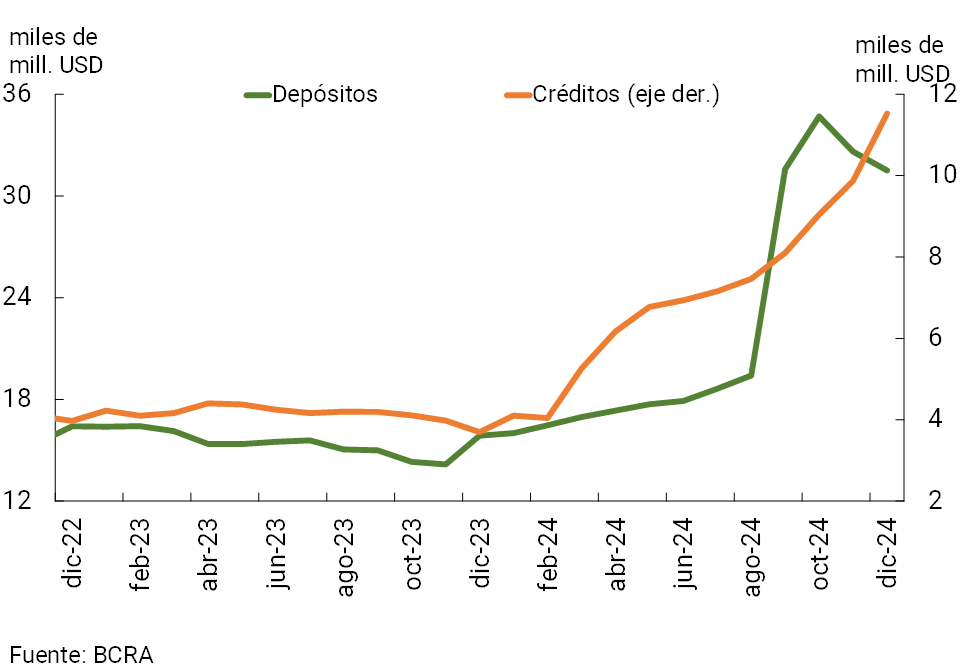
In relation to the foreign currency segment, in December the balance of credit to the private sector increased 16.8% compared to the previous month (in the currency of origin) (see Chart 2). When distinguishing by credit lines in foreign currency, advances, documents and pre-financing for exports verified the highest relative growth in the period.
In this scenario, at the end of 2024 the real balance of total credit (including domestic and foreign currency) to the private sector increased by 7.6% compared to November, with growth in both the business and household segments (see Chart 3)2. In a year-on-year comparison, the total credit balance to the private sector accumulated an increase of 54% in real terms.
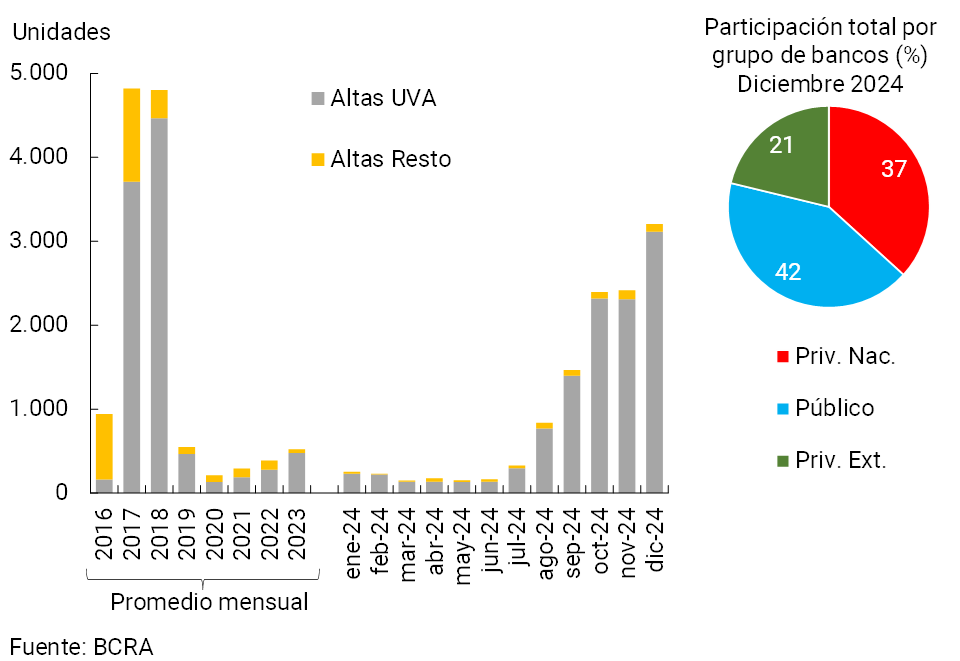
From levels even lower than those recorded in 2018 and 2019, the real balance of mortgage credit regained momentum in the second half of 2024, verifying a growth of 3.7% in real terms in the last month of the year and 30.1% in a year-on-year comparison – including principal and adjustment of UVA loans. It is estimated that in December the financial system incorporated about 3,200 new mortgage debtors, operations that were mostly agreed in UVA (see Graph 4).
Graph 3 | Real balance of total credit to the private sector*
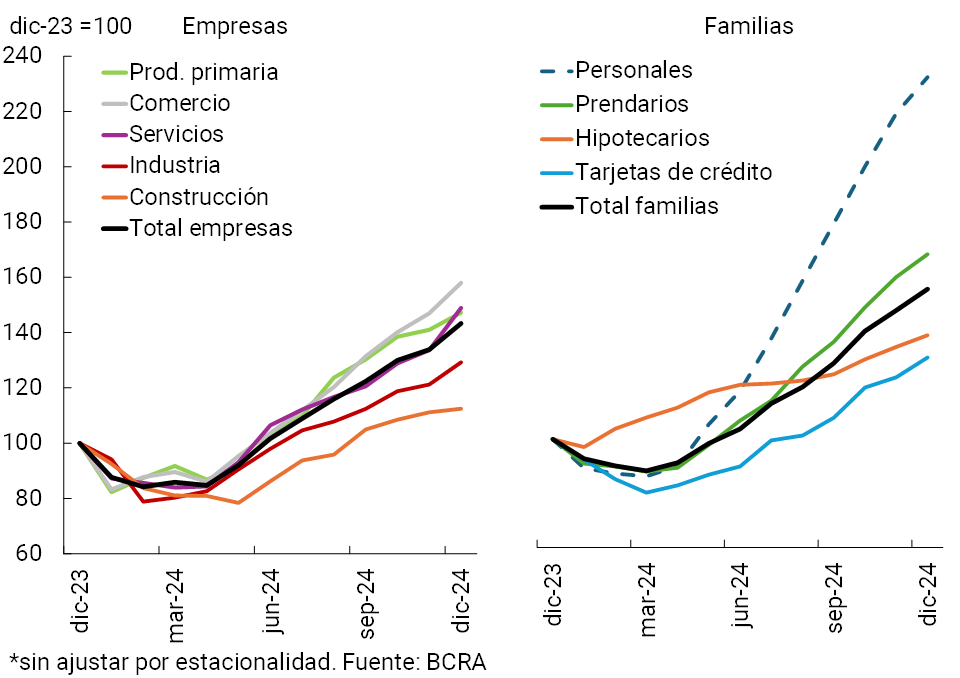
Figure 4 | Estimation of mortgage “registrations” (individuals)
Financial system
Regarding the funding of all financial institutions, in December the real balance of deposits in pesos of the private sector increased 4.9% (see Graph 5). Demand deposits increased 9.7% in real terms, partly due to the seasonal effect of the collection of the half bonus. On the other hand, the real balance of time deposits did not show significant changes in month3.
Graph 5 | Real balance of private sector deposits in pesos*
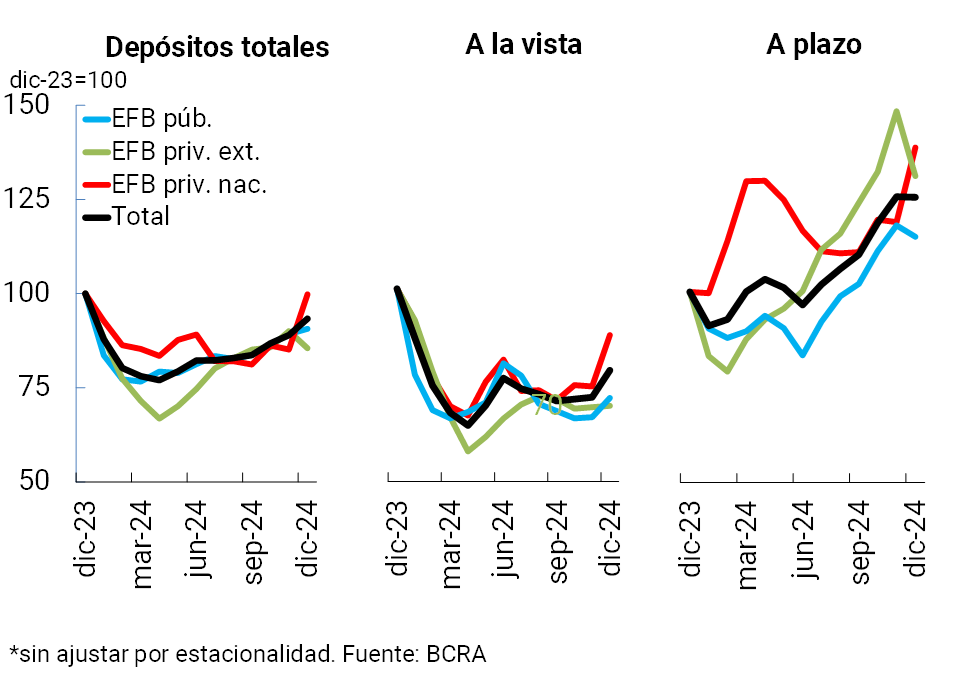
The balance of deposits in foreign currency of the private sector decreased 3.4% in December (in currency of origin; see Figure 2)4. By the end of 2024, the balance of foreign currency deposits in the private sector almost doubled that of the end of 2023 (+98.7% y.o.y. in foreign currency), a performance driven by the “Asset Regularization Regime”. On a cross-sector, currency-to-currency basis, the real balance of total deposits declined slightly in December (-0.4% in real terms), remaining unchanged year-on-year.
II. Evolution and aggregate composition of the balance sheet
In December, the total assets of the financial system did not show significant variations in real terms, accumulating a slight year-on-year reduction (-1.2%).
With respect to the composition of the sector’s total assets, the share of credit to the private sector – in pesos and foreign currency – increased again during the month, while the weighting of liquid assets in foreign currency and credit to the public sector fell (see Chart 6). In a year-on-year comparison, the changes in the composition of the assets of the financial system reflected the changes introduced in the monetary policy instruments5, as well as the boost in incentives for the development of financial intermediation between entities and the private sector. The space occupied by BCRA instruments (LELIQ and passes) in the assets of the financial system at the end of 2023 was replaced by holdings of LEFIs, other financing instruments for the public sector, and the growing relevance of credit to the private sector.
Graph 6 | Composition of assets and funding Financial
system – Participation %
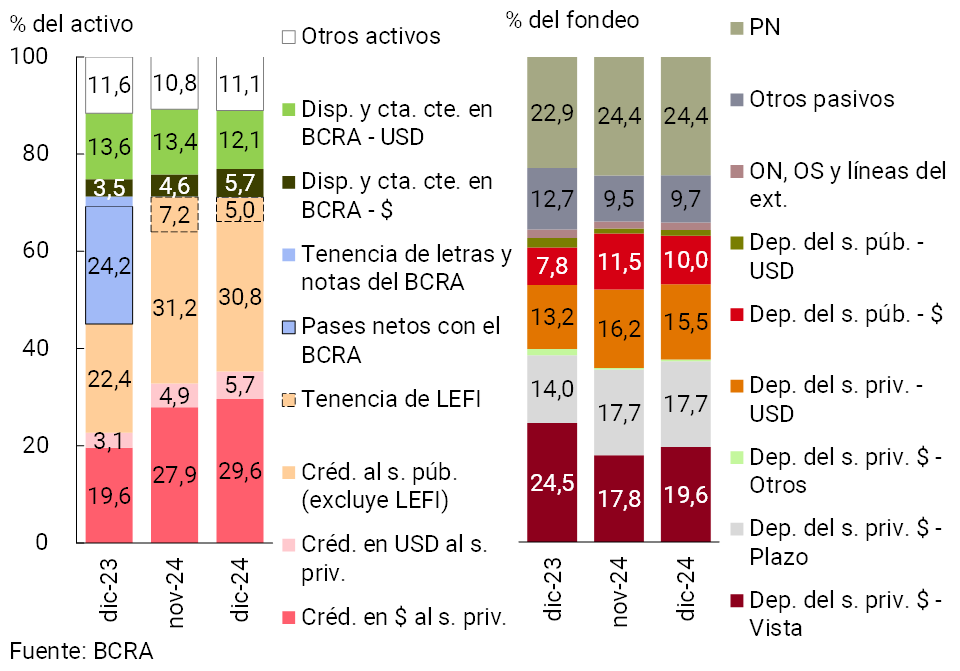
Considering the most relevant components of total funding, private sector demand accounts in pesos gained share in December (seasonal effect), while public sector deposits in pesos and private sector deposits in foreign currency reduced their relative weight in the total. With respect to the record of a year ago, the participation in the total of demand accounts in pesos of the private sector was reduced, while the weighting of term placements of the same sector in the same denomination, of net worth, of private sector deposits in foreign currency and of public sector deposits in pesos increased.
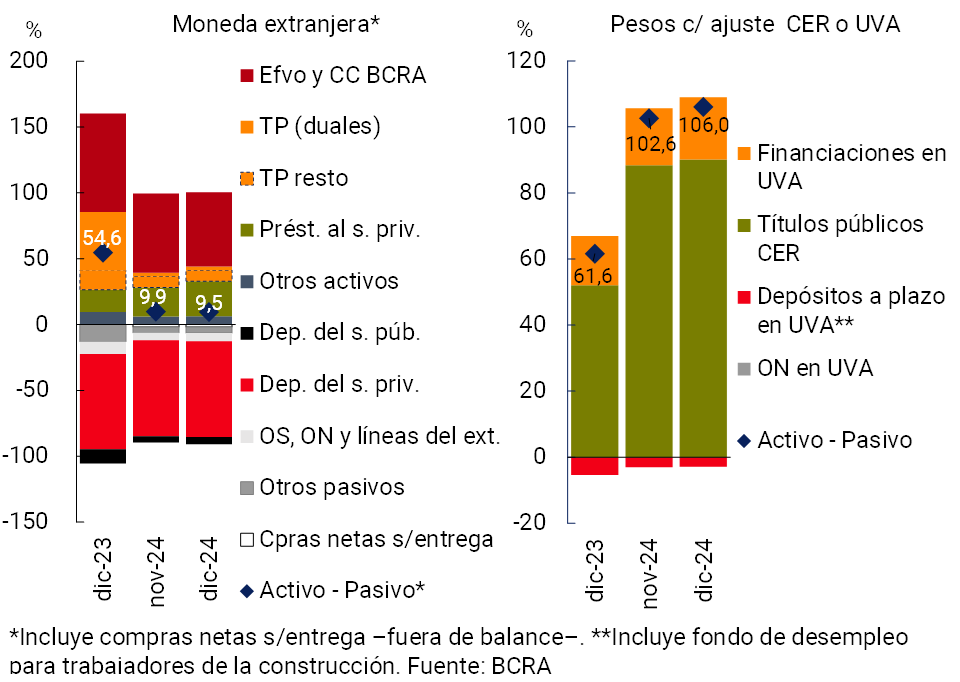
In December, the estimated spread between the financial system’s assets and liabilities in foreign currency fell slightly, standing at 9.5% of regulatory capital (RPC) for the sector as a whole (-45.1 p.p. y.o.y., see Chart 7)6. On the other hand, the differential between items in pesos adjustable by CER or agreed in UVA reached 106% of the sector’s PRC in the month, increasing slightly compared to November (+44.4 p.p. y.o.y.).
Figure 7 | Spread between assets and liabilities
In % of PRC
III. Portfolio quality
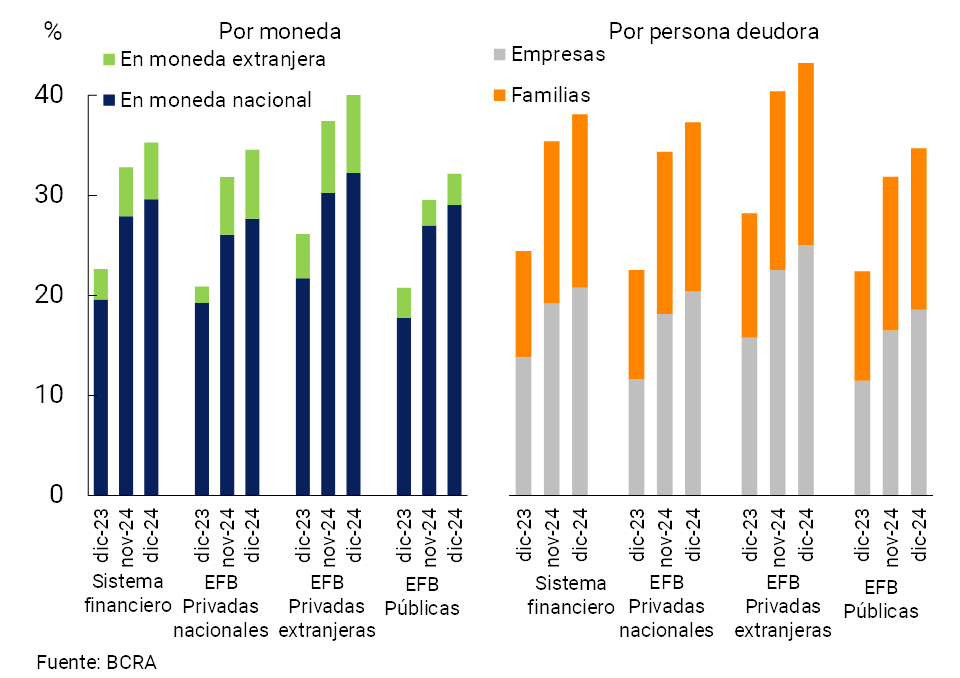
In December, the financial system’s exposure to the private sector stood at 35.3% of total assets, up 2.5 p.p. from November7. The monthly increase was disseminated among the groups of banking entities and was reflected in both the segment in domestic and foreign currency (see Graph 8). The private sector exposure of the aggregate of entities accumulated an increase of 12.7 p.p. of assets compared to December 20238.
Figure 8 | Credit balance to the private sector in terms of assets
By group of financial institutions
The non-performing loan ratio to the private sector remained stable at the end of the year, at around 1.6%. The levels of relative non-performing loans were similar in the different groups of banks, while the EFNBs continued to register higher values for this indicator (see Chart 9)9. Disaggregated by segment, the NPL ratio of financing to companies closed the year at 0.8%, while the indicator of irregularity of financing to households stood at 2.5% (see Graph 10).
Figure 9 | Private sector credit irregularity ratio by entity group
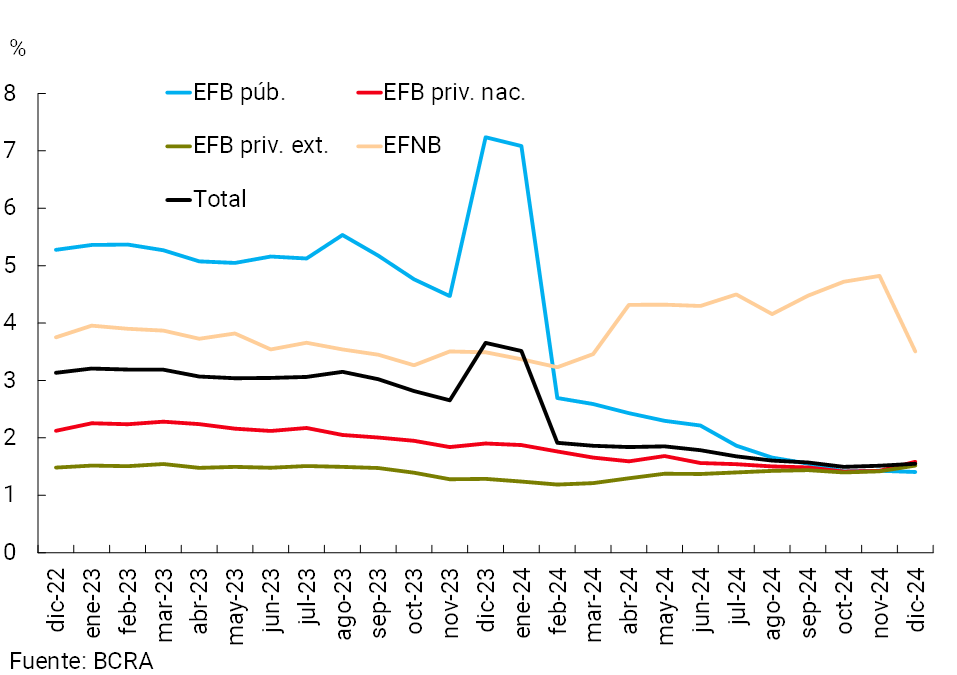
Figure 10 | Private Sector Credit Irregularity Ratio by Financial System Segment
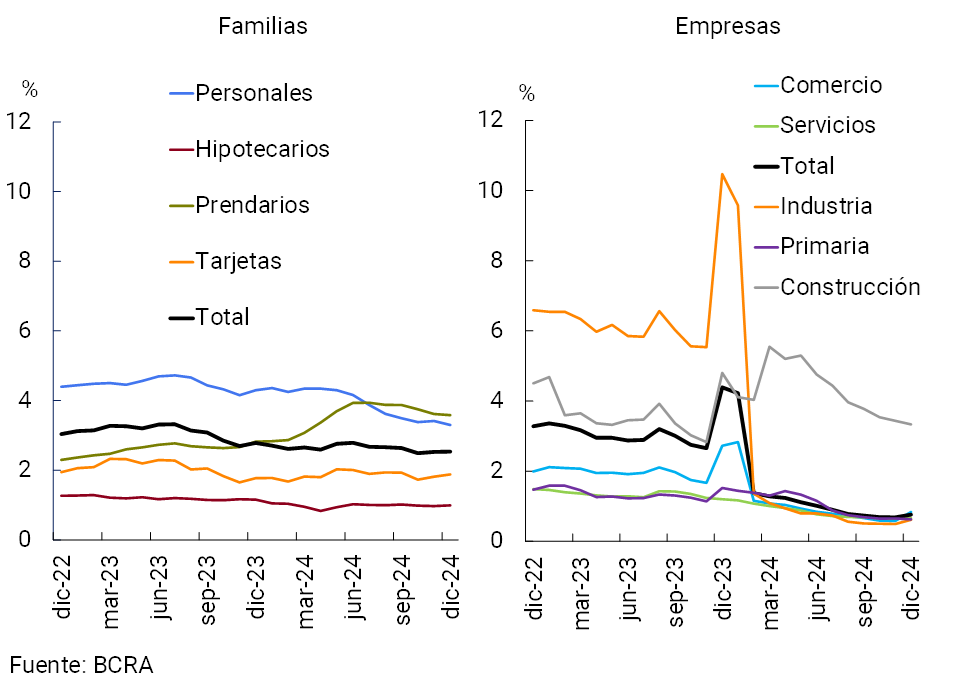
Throughout 2024, the non-performing loan ratio to the private sector fell by 2.1 p.p., with a steeper decrease in the corporate lending segment10, compared to that recorded in the household lending segment (see Chart 10). A complementary indicator to the irregularity ratio to assess credit risk is the Estimated Probability of Default (PDE)11. In December, the EDP (based on debt balances) for credit to the private sector stood at 0.8%, slightly above the level recorded in December 2023. In the corporate lending segment, in December the EDP remained at levels similar to the end of 2023, standing at around 0.3%. For its part, in the segment of credit to households, the PDE increased slightly in the last 12 months, to 1.4% in December12.
The financial system closed the year with high levels of forecasting. In December, the forecasts represented 2.6% of the total portfolio to the private sector (unchanged in the month and -2.5 p.p. y.o.y.). In terms of the portfolio in an irregular situation, the forecast reached 168.4% (-5.6 p.p. monthly and +27.4 p.p. y.o.y.). The net pension balance of that attributed to the regular portfolio (situations 1 and 2 according to the regulations on minimum regulatory provisions for uncollectibility risk) was slightly higher than the total of the portfolio in an irregular position in December (-4.1 p.p. monthly and +11.7 p.p. y.o.y.).
IV. Liquidity and solvency
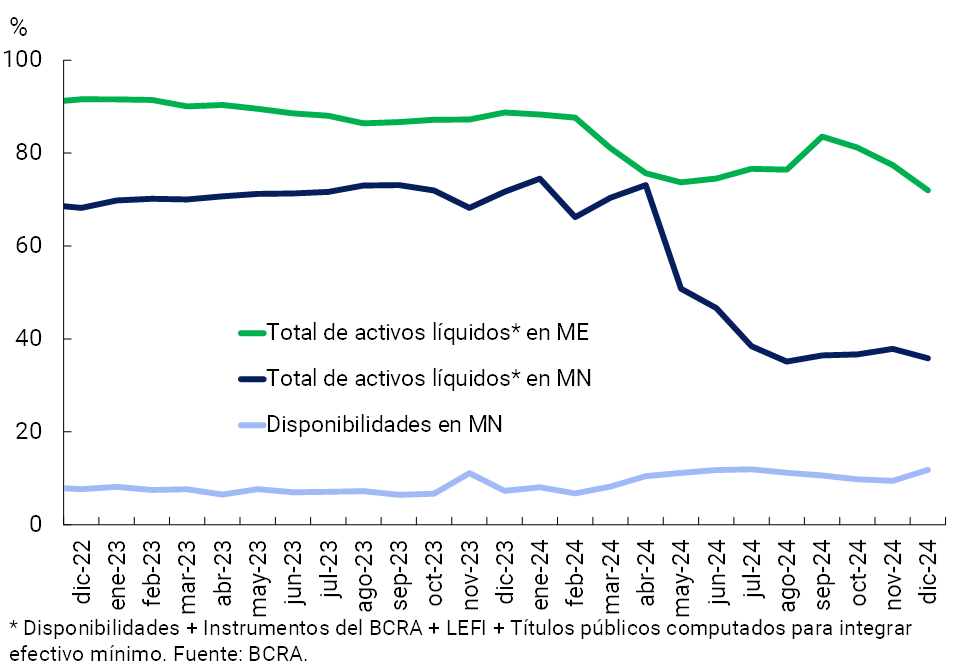
The ample liquidity of the financial system in national currency represented 35.9% of deposits in pesos at the end of the year, down 2 p.p. from the November figure and practically half the level of December 2023 (see Chart 11) 13 14. The monthly decrease was explained by a lower holding of LEFI, which was not compensated by the increase in the availability in pesos and in the public securities used to integrate minimum cash. The liquidity ratio for the foreign currency segment stood at 72% of deposits in that denomination at the systemic level, 5.4 p.p. less than at the end of November (-16.8 p.p. y.o.y.).
Figure 11 | Liquidity
indicators Financial system – As % of deposits in each denomination
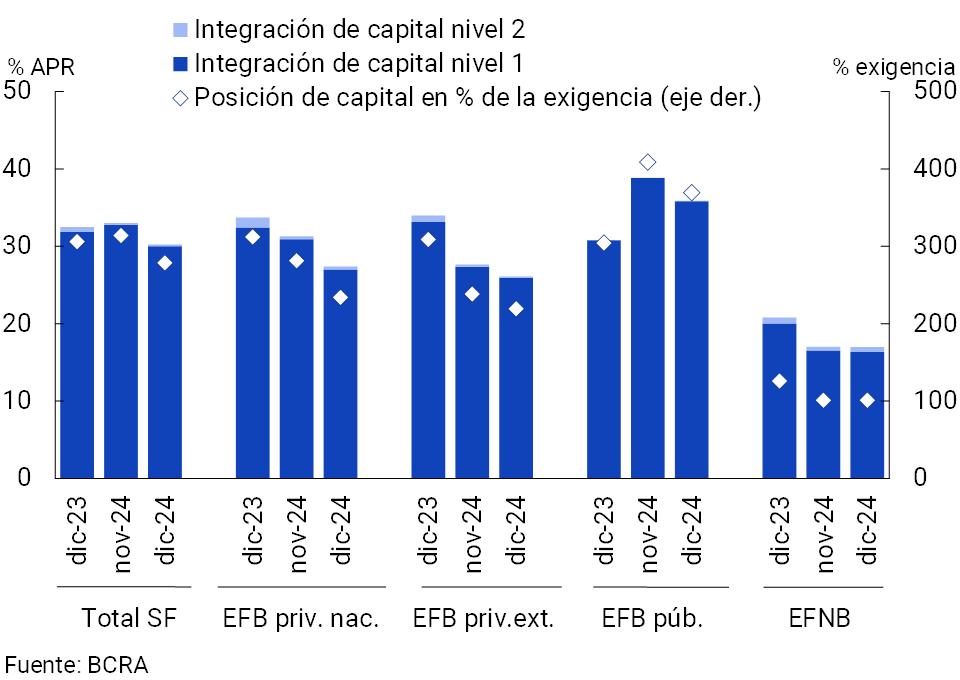
In December, the capital integration (RPC) of the group of entities represented 30.2% of risk-weighted assets (RWA, see Chart 12), 2.8 p.p. less than in November. This dynamic occurred in the context of a 3.9% real monthly decline in the PRC together with a 4.9% real increase in risk-weighted assets (RWA), and was mainly driven by domestic private banks and public banks15. In December, the excess regulatory capital of the financial system continued to be comfortable, totaling 279% of the regulatory requirement (compared to an average of 170% in the last 10 years) and 45.1% of the balance of credit to the private sector net of provisions (compared to an average of 26.7% in the last 10 years).
Figure 12 | Capital Integration
By the end of 2024, the leverage ratio16 amounted to 20.9% for the financial system as a whole, 1.2 p.p. below the previous quarter’s figure and 2.6 p.p. above a year ago (see Chart 13). All groups of financial institutions presented a level above the regulatory minimum (set at 3%).
In 2024, the financial system obtained positive levels of profitability, lower than those of the previous year, based on the moderation of results in the last two quarters of the year (see Chart 14). In 2024, the financial institutions as a whole accumulated comprehensive total results in homogeneous currency equivalent to 4.1% of assets (ROA) and 15.8% of equity (ROE), values lower than those of 2023 (5.3% and 26.9%, respectively). This year-on-year performance was verified in all groups of banks (in contrast, EFBNs began to obtain gains in 2024) and was explained at the systemic level mainly by the accrual of a lower real comprehensive financial margin (decrease in the results of securities and differences in prices, partially offset by lower interest expenses).
Figure 13 | Leverage
ratio Capital 1 in terms of a broad measure of exposure
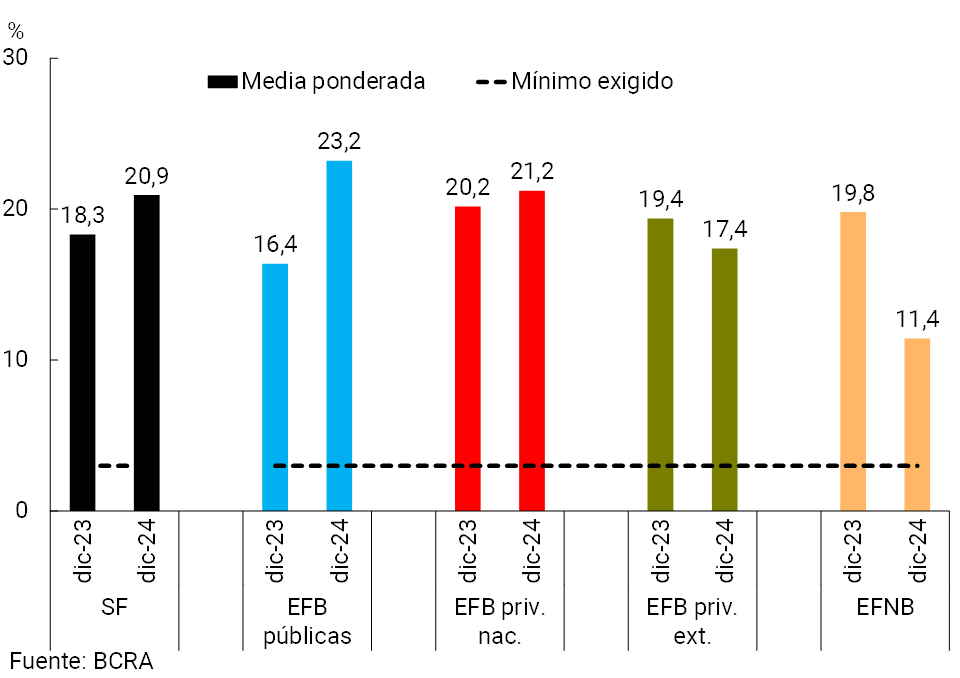
Figure 14 | Cumulative quarterly and annual ROABy financial institution group

V. Payment system
Throughout 2024, electronic means of payment continued to expand. It is estimated that the combination of the main means of electronic payment in relation to the Gross Domestic Product (GDP) grew almost 65 p.p. in the year (see Graph 15). In the period, immediate transfers (TI) stood out, which experienced a growth of 48.7% in real terms. When considering the IT operated at the end of 2024 (last three annualized months), it is estimated that they came to represent 115.8% of GDP, increasing 48.7 p.p. y.o.y.
Figure 15 | Main means of electronic
payment Estimation of amounts operated in % of GDP

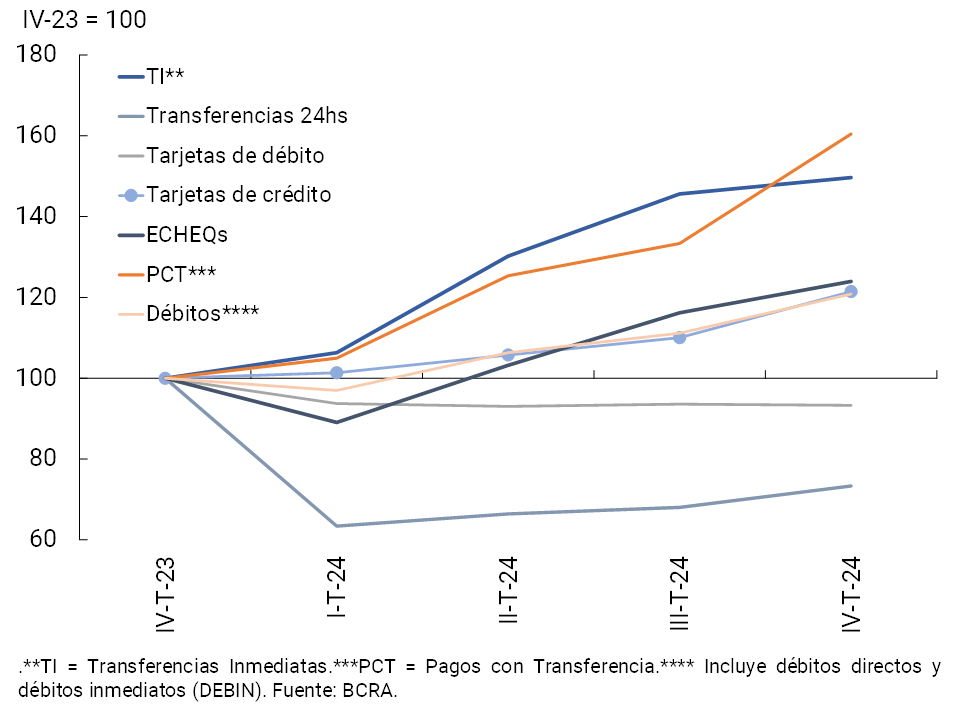
In 2024, the number of payment transactions carried out grew due to the dynamism of electronic means linked to mobile devices or immediate solutions (see Chart 16), while the number of payments that depend on physical or non-immediate means decreased. When broken down by type of instrument and compared to December 2023, the amount of IT increased by 49.6% and that of payments with transfers (PCT) by 60.4%, reflecting a preference for fast and digital options. In addition, the number of Electronic Checks (ECHEQs) cleared also grew 24% YoY. In contrast, 24-hour transfers and debit card payments showed year-on-year reductions.
Figure 16 | Main means of electronic
payment Number of transactions – Base index
References
1 Includes principal adjustments and accrued interest.
2 Financing to companies is defined here as that granted to legal entities and commercial financing granted to natural persons. On the other hand, loans to families are considered to be those granted to individuals, unless they are for commercial purposes.
3 The increase in the real balance of demand accounts was mainly driven by the non-interest-bearing segment.
4 When considering groups of financial institutions (according to capital origin), the variations observed in the balances between December and November 2024 reflect the effect of the progress in the process of acquiring a foreign bank by a national bank. For more details, see Communication “C” 99322 and Box 4 of the December 2024 Financial Stability Report.
5 For more details, see the New Monetary Policy Framework.
6 Includes off-balance sheet foreign currency forward purchase and sale transactions. Liabilities include deposits that have variable remuneration depending on the evolution of the exchange rate – associated with the Export Increase Programme – and LEDIV are included in assets.
7 The monthly dynamics were driven by the performance of the numerator: at the systemic level, in the month the balance of credit to the private sector grew 7.6% in real terms, while total assets did not show significant real variations.
8 Exposure to the private sector net of forecasts stood at 34.4% for the financial system as a whole (+2.4 p.p. monthly and +12.9 p.p. y.o.y.).
9 In December, there was a decrease in the indicator in the EFNB. This occurred in the context in which a relevant entity in this group decided to send a part of the balance in an irregular situation to off-balance sheet items.
10 This change was partly explained by the transfer of the balance of irregular financing made in February to off-balance sheet accounts.
11 The estimated EDP is defined as the proportion of the credit balance that, having been in a regular situation (category 1 and 2) in month T-3, migrates to an irregular situation (categories 3, 4 and 5) in month T. The EDP therefore provides information on the transition of the credit rating of debtors.
12 If the EDP indicator based on the amount of financing is considered, for credit to the private sector it stood at 2.1% at the end of the year, 1.4% for companies and 2.1% for families; All these indicators increased slightly throughout the year.
13 It considers availabilities (cash and current account at the BCRA), fiscal liquidity bills (LEFI), and the balance of the types of public securities that entities compute as integration of Minimum Cash (until May 2024, it also incorporated BCRA instruments).
14 When additionally considering the holding of LECAP whose residual term is less than 3 months, the broad indicator of systemic liquidity in national currency would amount to 41.2% of deposits in pesos at the end of the year (-2.7 p.p. compared to November).
15 The monthly evolution of these indicators occurred in a context of a strong increase in credit to the private sector (effect on the ARPs), added to one-off effects on the PRC and RWAs. In particular, in the group of domestic private banks, the reduction in the capital integration ratio was influenced by the progress in the process of acquiring a foreign bank by a domestic bank (effects on the PRC and on RWAs), while in the public banks there were additional particular adjustments on items deductible from the PRC imputed by an entity of magnitude.
16 Defined according to Basel Committee guidelines as Tier 1 Capital in terms of a broad measure of exposure.
Share on


