I. Recent measures1
In order to contribute to the execution of monetary policy, on February 8 it was established that the daily net position that financial institutions record in BCRA Liquidity Bills (LELIQ) and active passes in pesos against the BCRA may not exceed their computable equity liability (RPC) of the previous month or 65% of the monthly average of daily balances of total deposits in pesos – excluding those of the financial sector – of the previous month, of both the greatest. 2 A transition period was established with a pre-established timetable for adaptation to take into account those entities that must place their positions within the aforementioned limit.
In order to improve the infrastructure for the provision of financial services and thus continue to promote banking penetration, in January it was established that automated offices can improve the contracting and revocation/termination of products and/or services that are processed in them with customers (such as the registration of savings banks, credit cards, etc.). etc.), without the need to intervene in the centralizing branch. 3
It was recently provided that deposits of Purchasing Value Units (UVA) that are constituted within the framework of a previous savings plan to obtain loans denominated in UVA whose purpose is the acquisition, construction or renovation of housing, may be canceled early in the event that the user desists from the aforementioned savings plan. 4
II. Financial intermediation activity
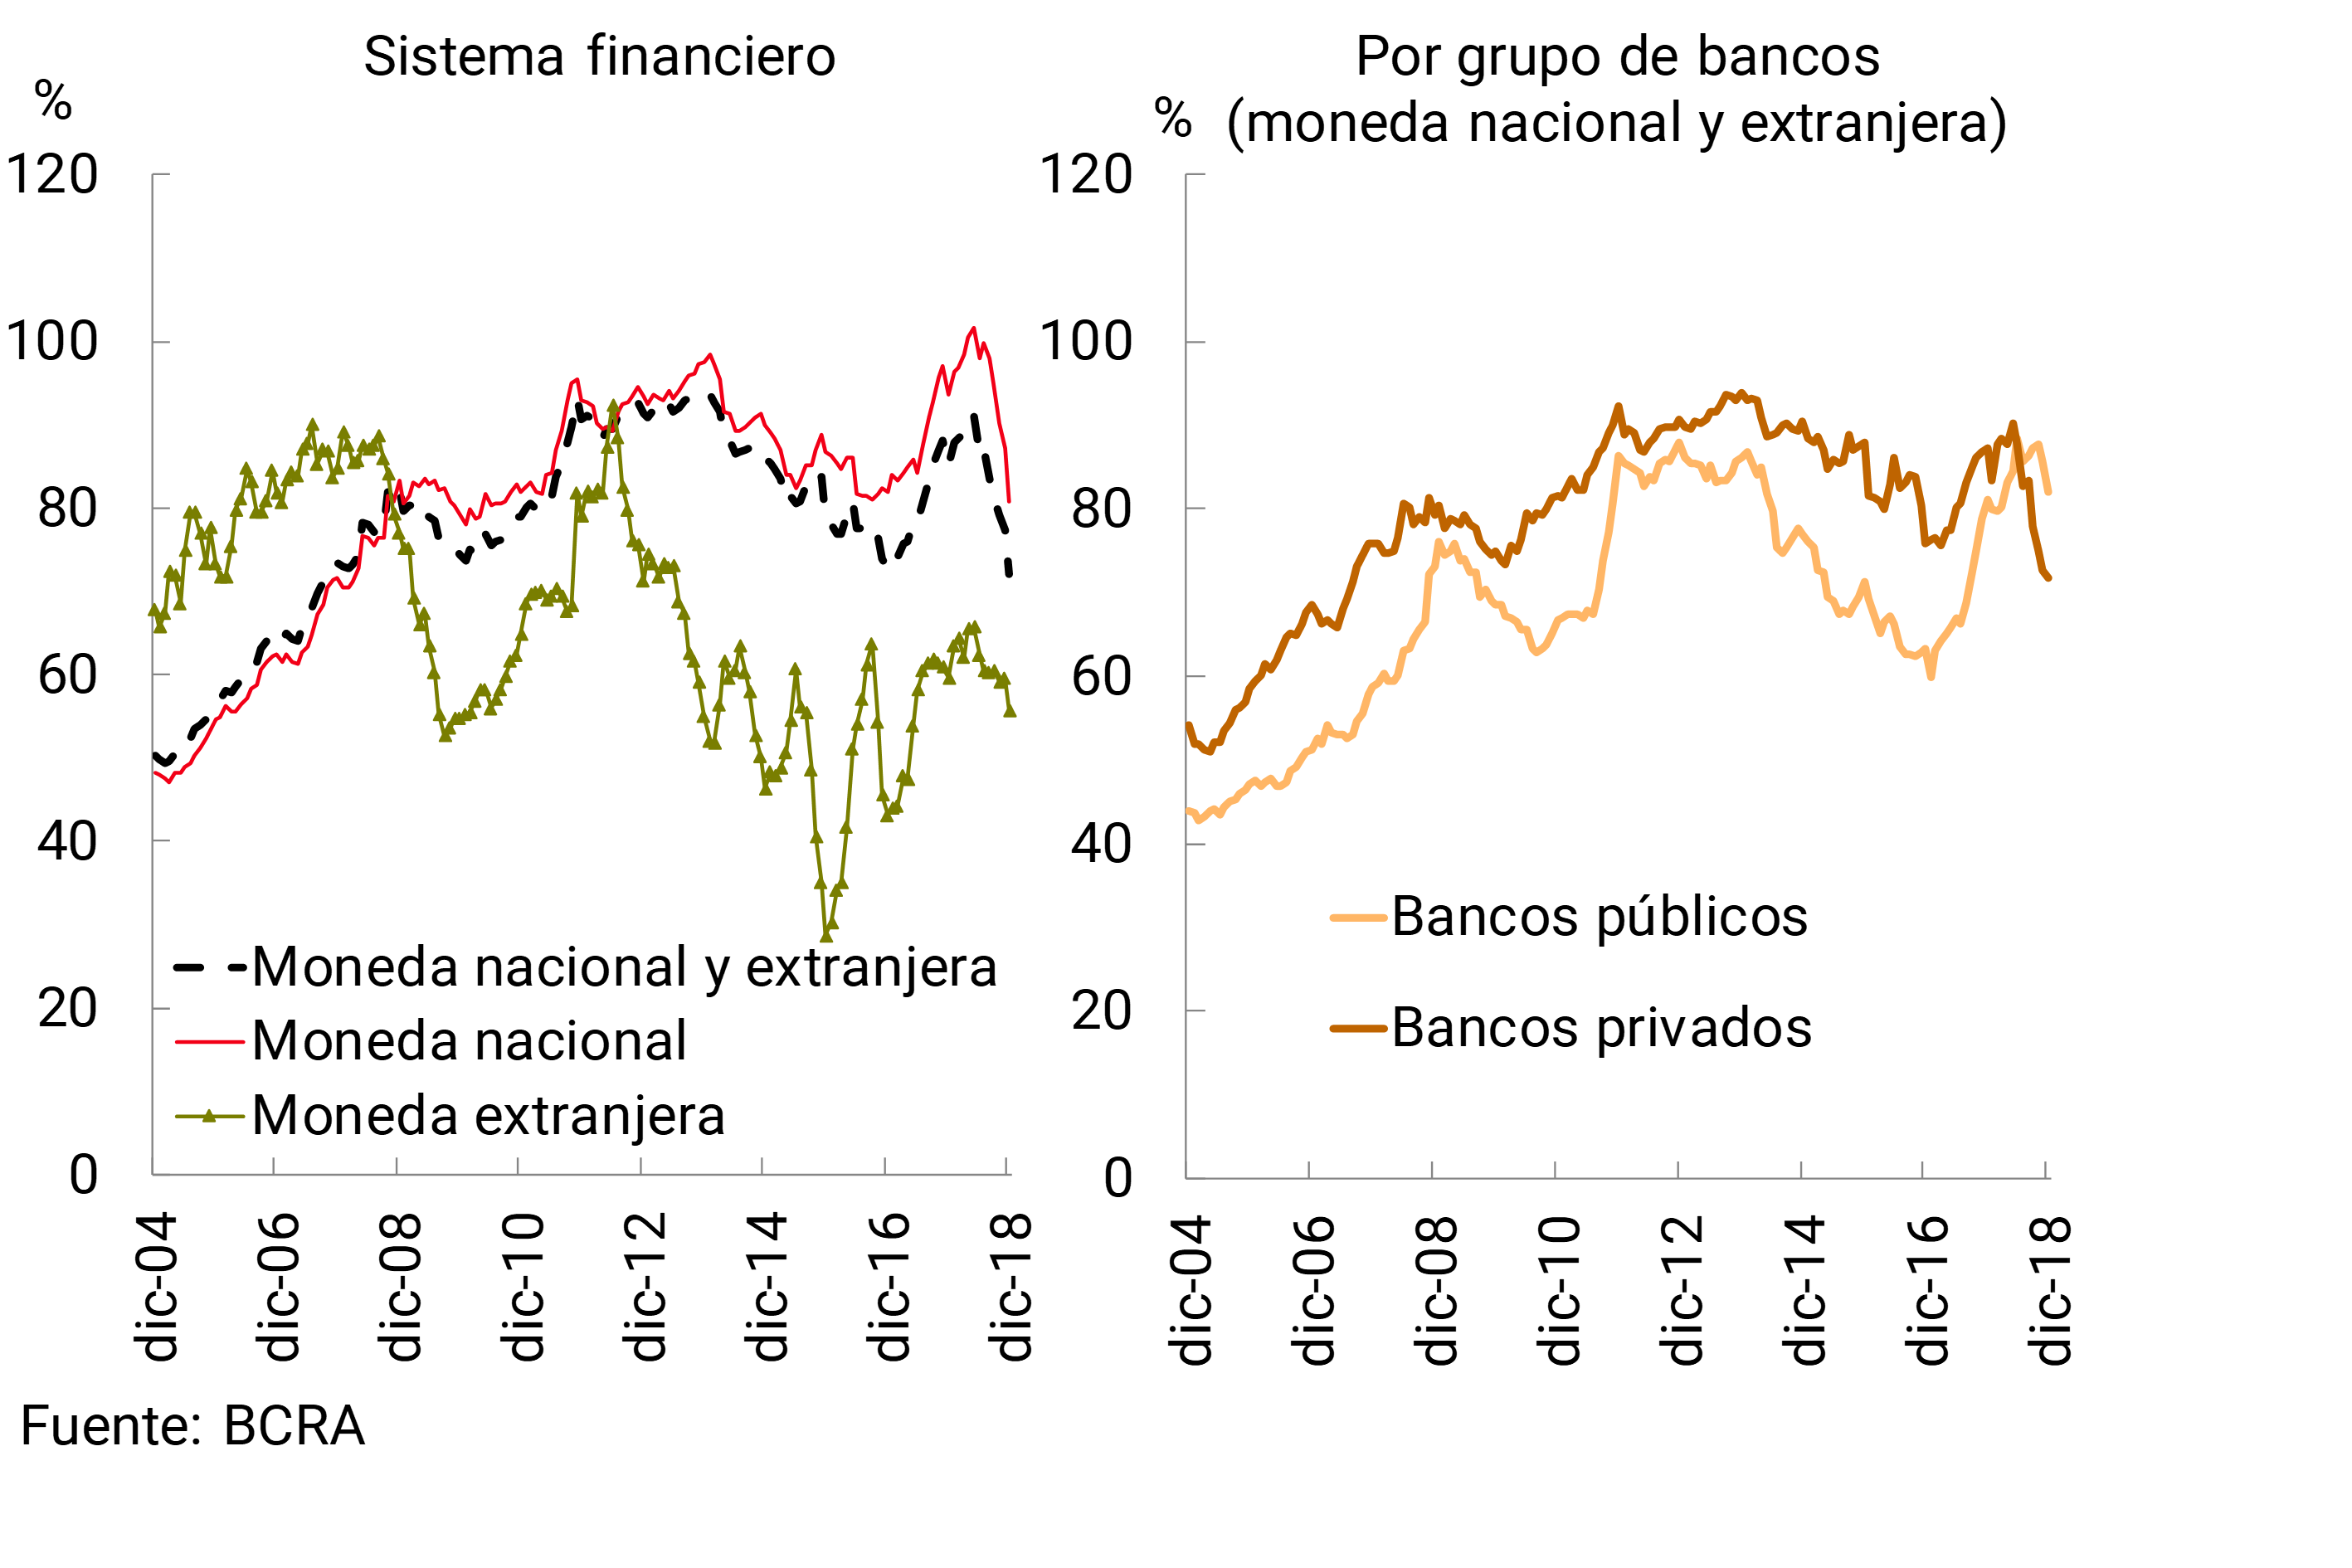
In December, the size of the financial system’s balance sheet was slightly reduced, with a fall in assets at the aggregate level of 0.6% in real terms (+12.9% real year-on-year5). During the month, the performance of loans to the private sector did not keep pace with the dynamism of deposits made by this sector, increasing liquidity in the system at the aggregate level. In particular, the ratio of loans to private sector deposits reached 72% at the end of 2018 (13 p.p. less than a year ago) (see Chart 1). This phenomenon occurred mainly in private banks.
Graph 1 | Loans in Deposit Terms – Balance Sheet Balances – Private Sector
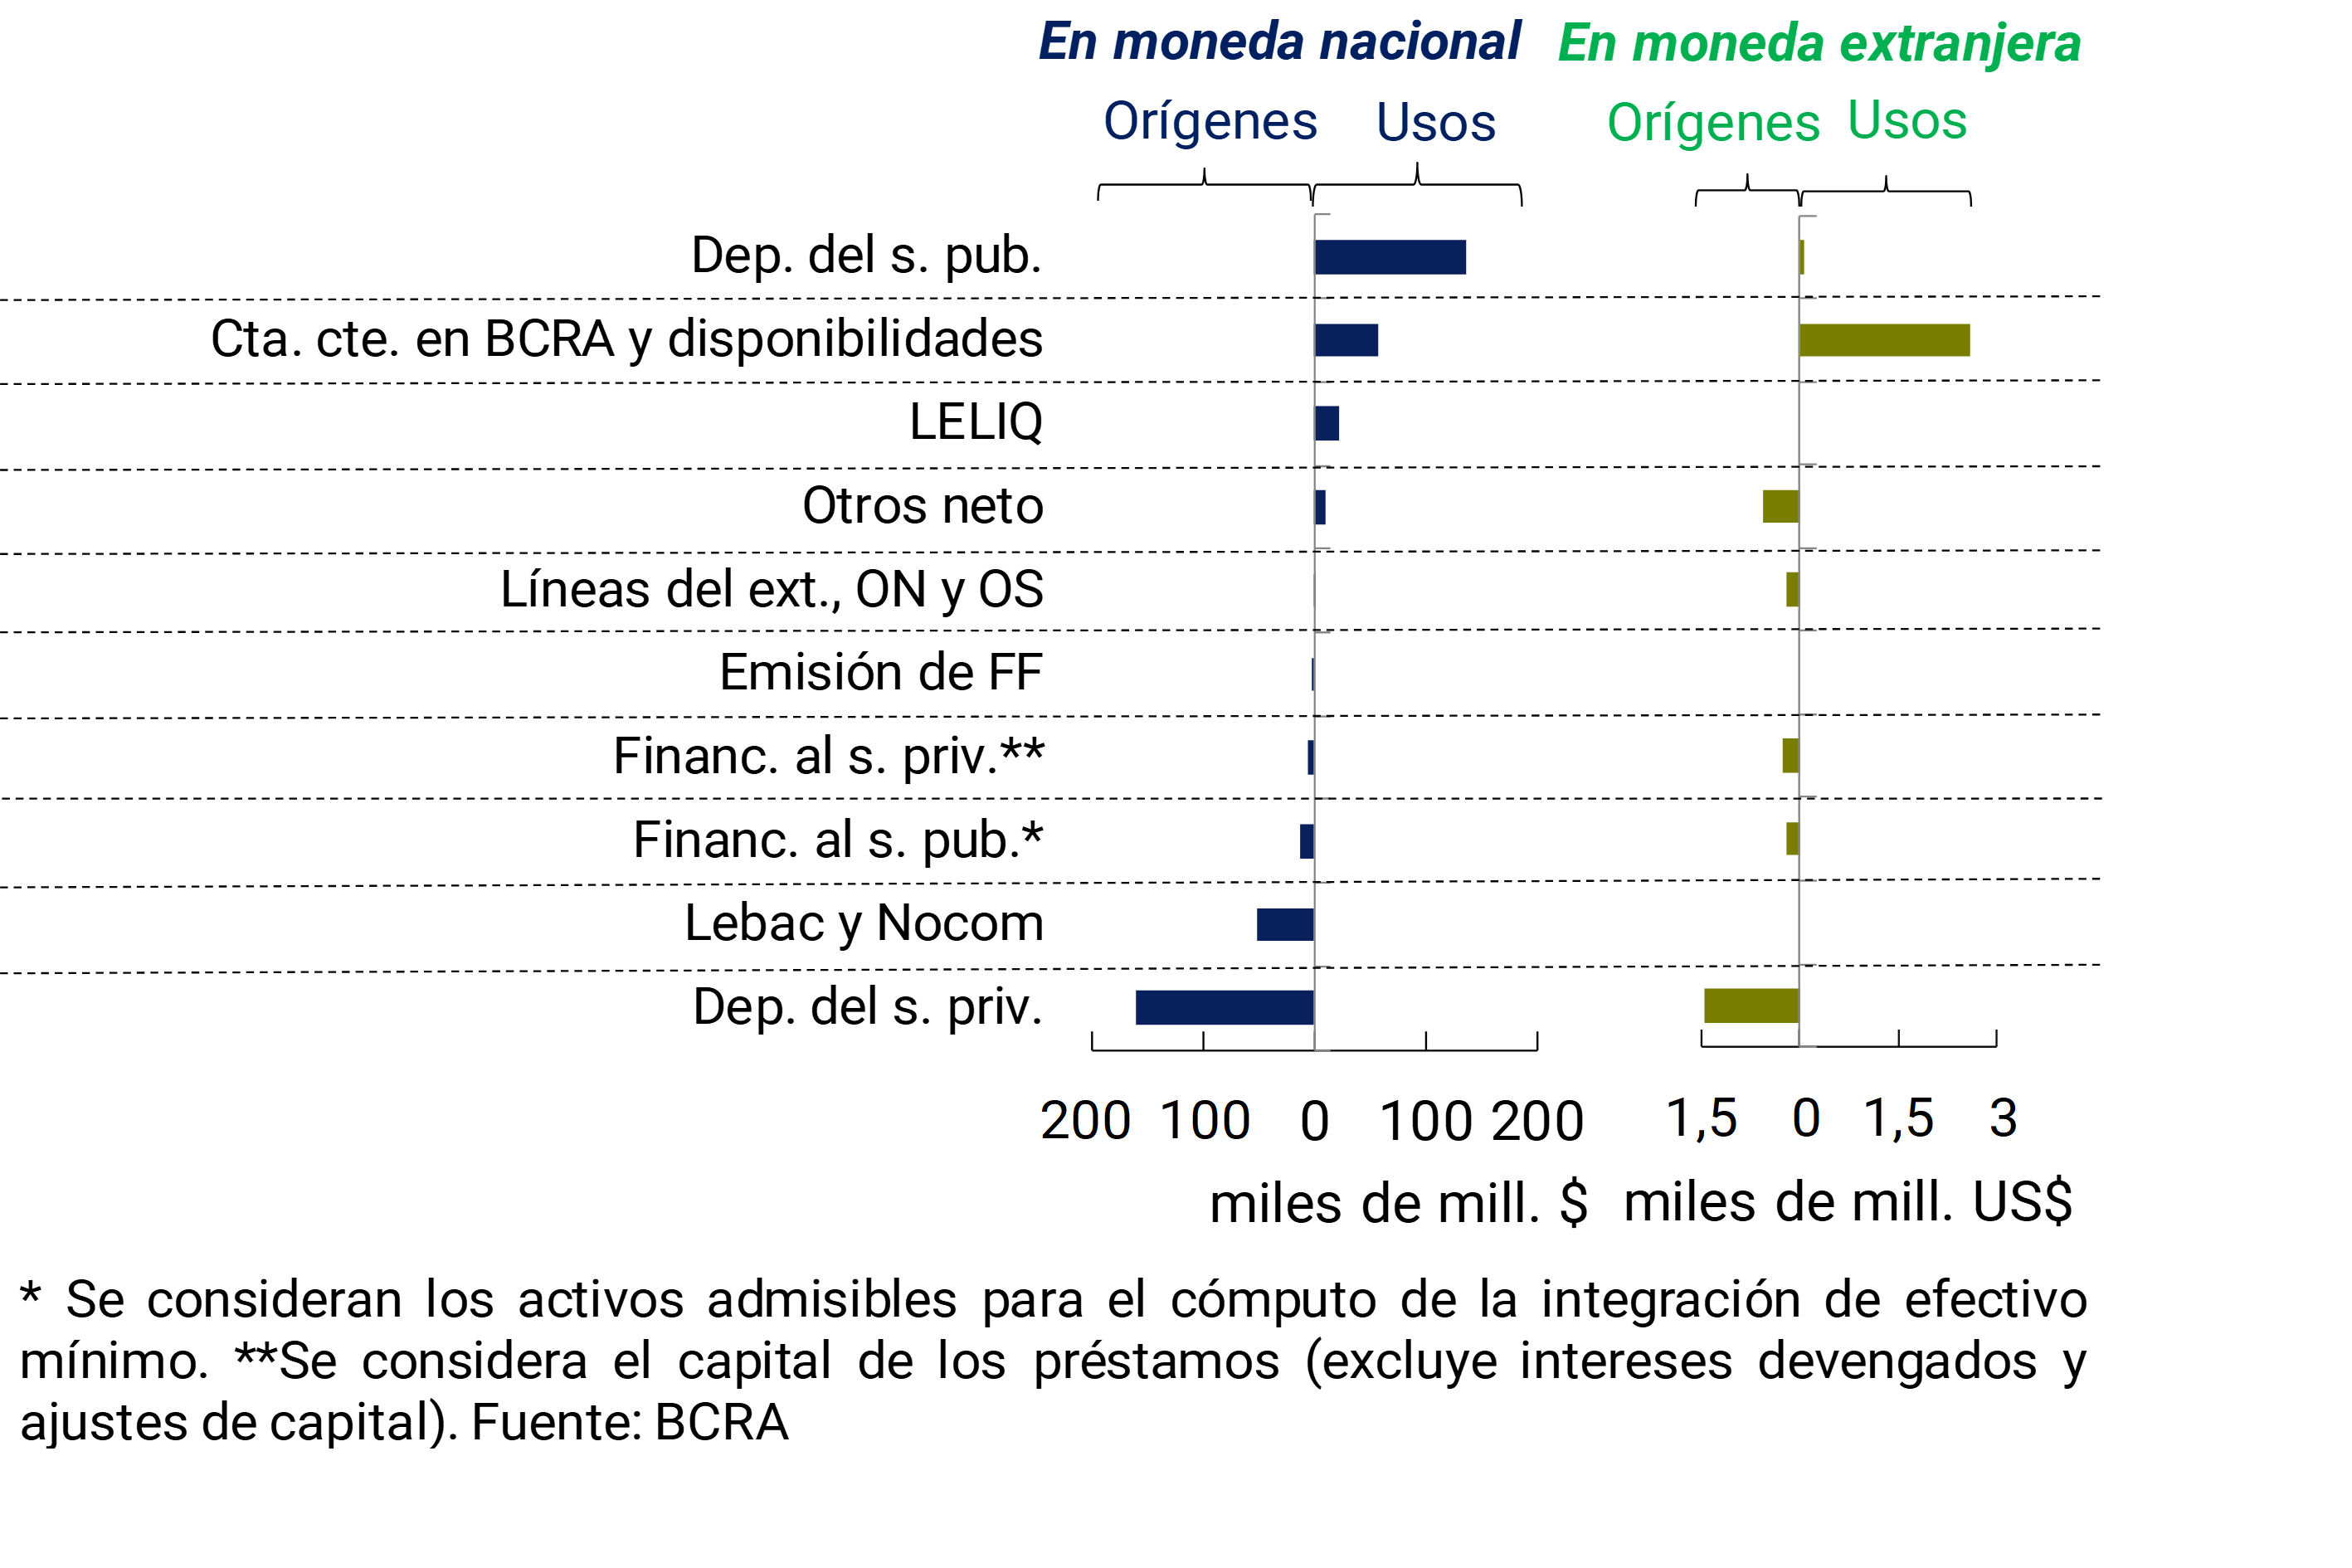
The estimated monthly cash flow of the financial system, for its operations in items denominated in national currency6, shows the increase in private sector deposits ($160,000 million) as the main source of funding for the sector in December (see Chart 2).7 For its part, the reduction in public sector deposits ($137,000) was the most relevant application of resources for the banks as a whole in the last month of the year. To a lesser extent, the increase in the balance of the current accounts that banks have in the BCRA was another notable use of funds. Taking into account the flow of funds in December for items in foreign currency, the increase in private sector deposits and the increase in liquidity were the origin and application of the most important resources for the financial system.
Graph 2 | Dec-18 Cash Flow Estimate – Financial System – By Source Currency
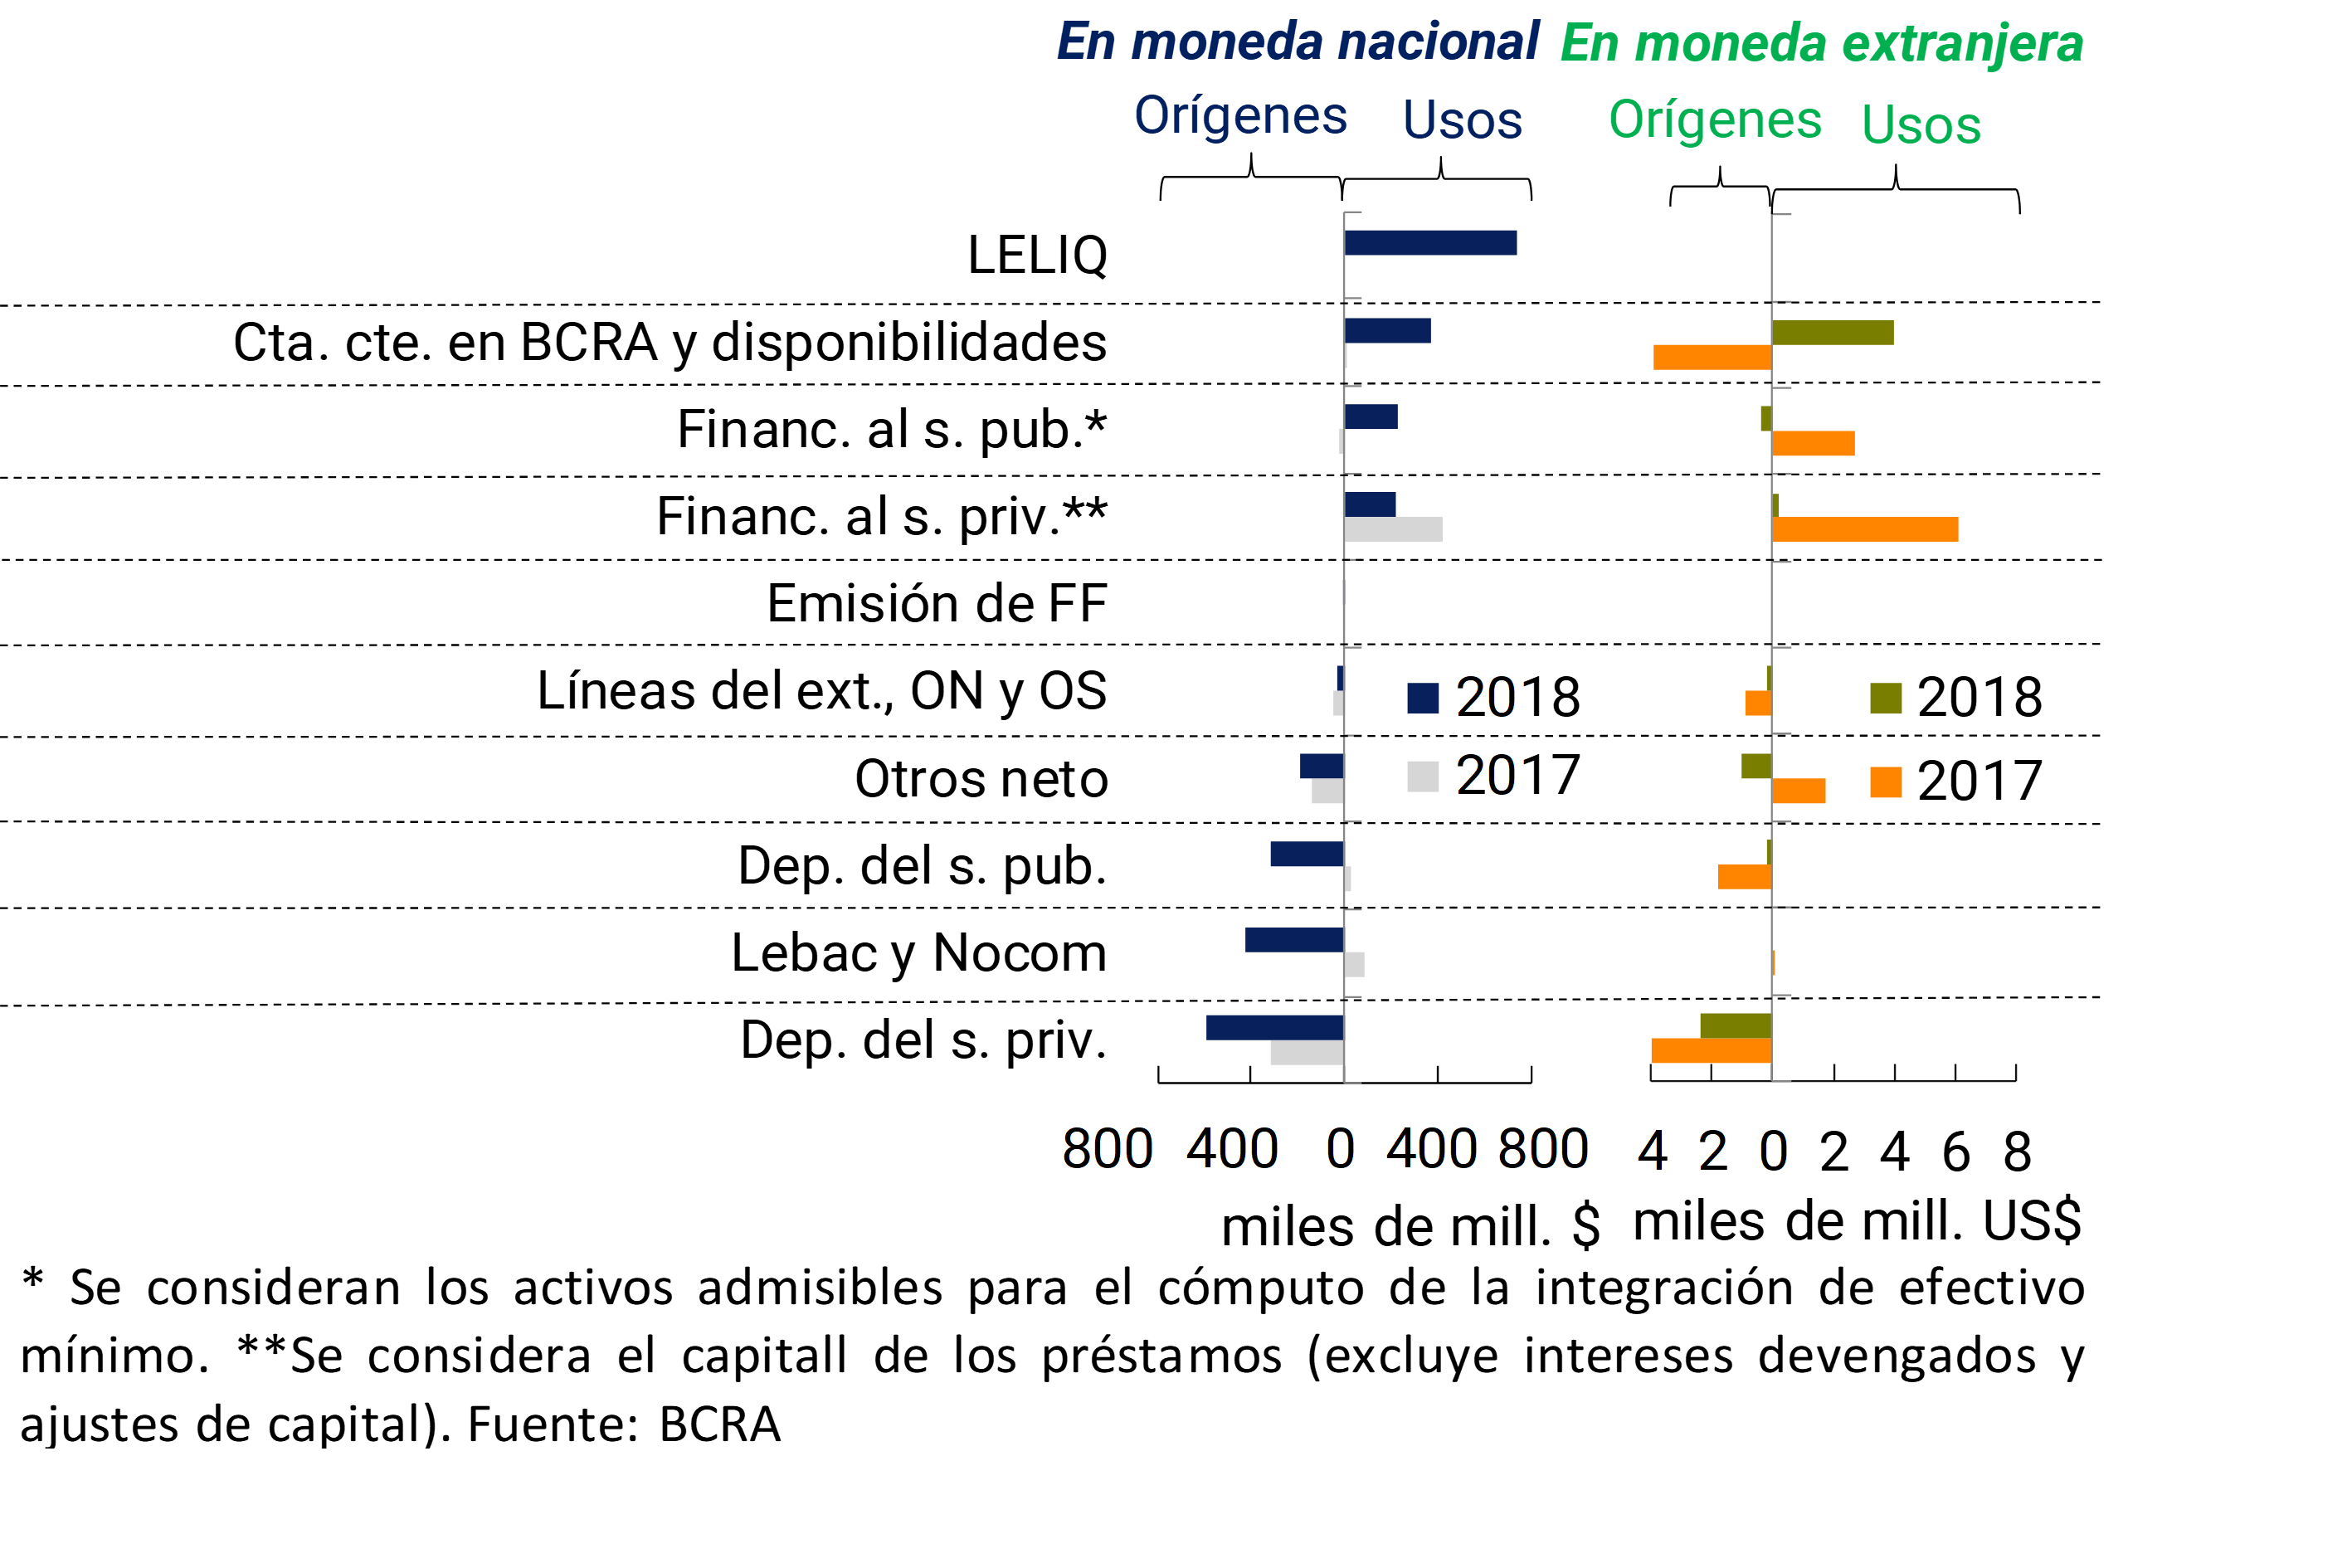
Considering the estimate of the flow of funds for 2018, the increase in deposits of households and companies ($595,000 million) was the most important source of resources among the items in national currency of the financial system (see Graph 3). 8 In addition, the reduction in LEBAC holdings and the increase in public sector deposits were sources of additional funding in pesos for banks in the period. These resources were mainly used to increase the holdings of LELIQ ($680,000 million) and, to a lesser extent, the balance of bank current accounts in the BCRA and bank financing. On the other hand, according to the estimated annual cash flow for foreign currency items, the increase in private sector deposits was the most relevant source of funds for banks. These funds were mainly used to increase liquidity in dollars throughout the year.
Graph 3 | Annual Cash Flow Estimate – Financial System – By Source Currency
In the month, the total assets in foreign currency of the financial system increased 4.3%, while liabilities grew 2.8%. 9 In addition, in the last month of the year, net forward purchases of foreign currency without delivery of underlying – classified off balance sheet – went from having a debit balance to a creditor, a performance mainly explained by foreign banks. Thus, the difference between assets and liabilities – including net forward purchases of off-balance sheet foreign currency – denominated in foreign currency stood at a value equivalent to 12.8% of the Computable Patrimonial Liability (CPR) for the entire system, 5.3 p.p. less than in November and 0.7 p.p. more than at the end of 2017 (see Chart 4). On the other hand, considering the items in national currency with CER adjustment, in December the spread between assets and liabilities totaled 53.5% of regulatory capital, 2.8 p.p. above the November figure and 22.5 p.p. more than at the end of last year. The monthly dynamics were mainly due to the re-expression of the capital of assets and liabilities. It should be noted that the spread of items with CER adjustment is mostly explained by public banks.
Figure 4 | EM Asset – EM Liabilities + Net Forward Purchases of EM without Delivery of Underlying – As % of the financial system’s PRC

III. Deposits and liquidity
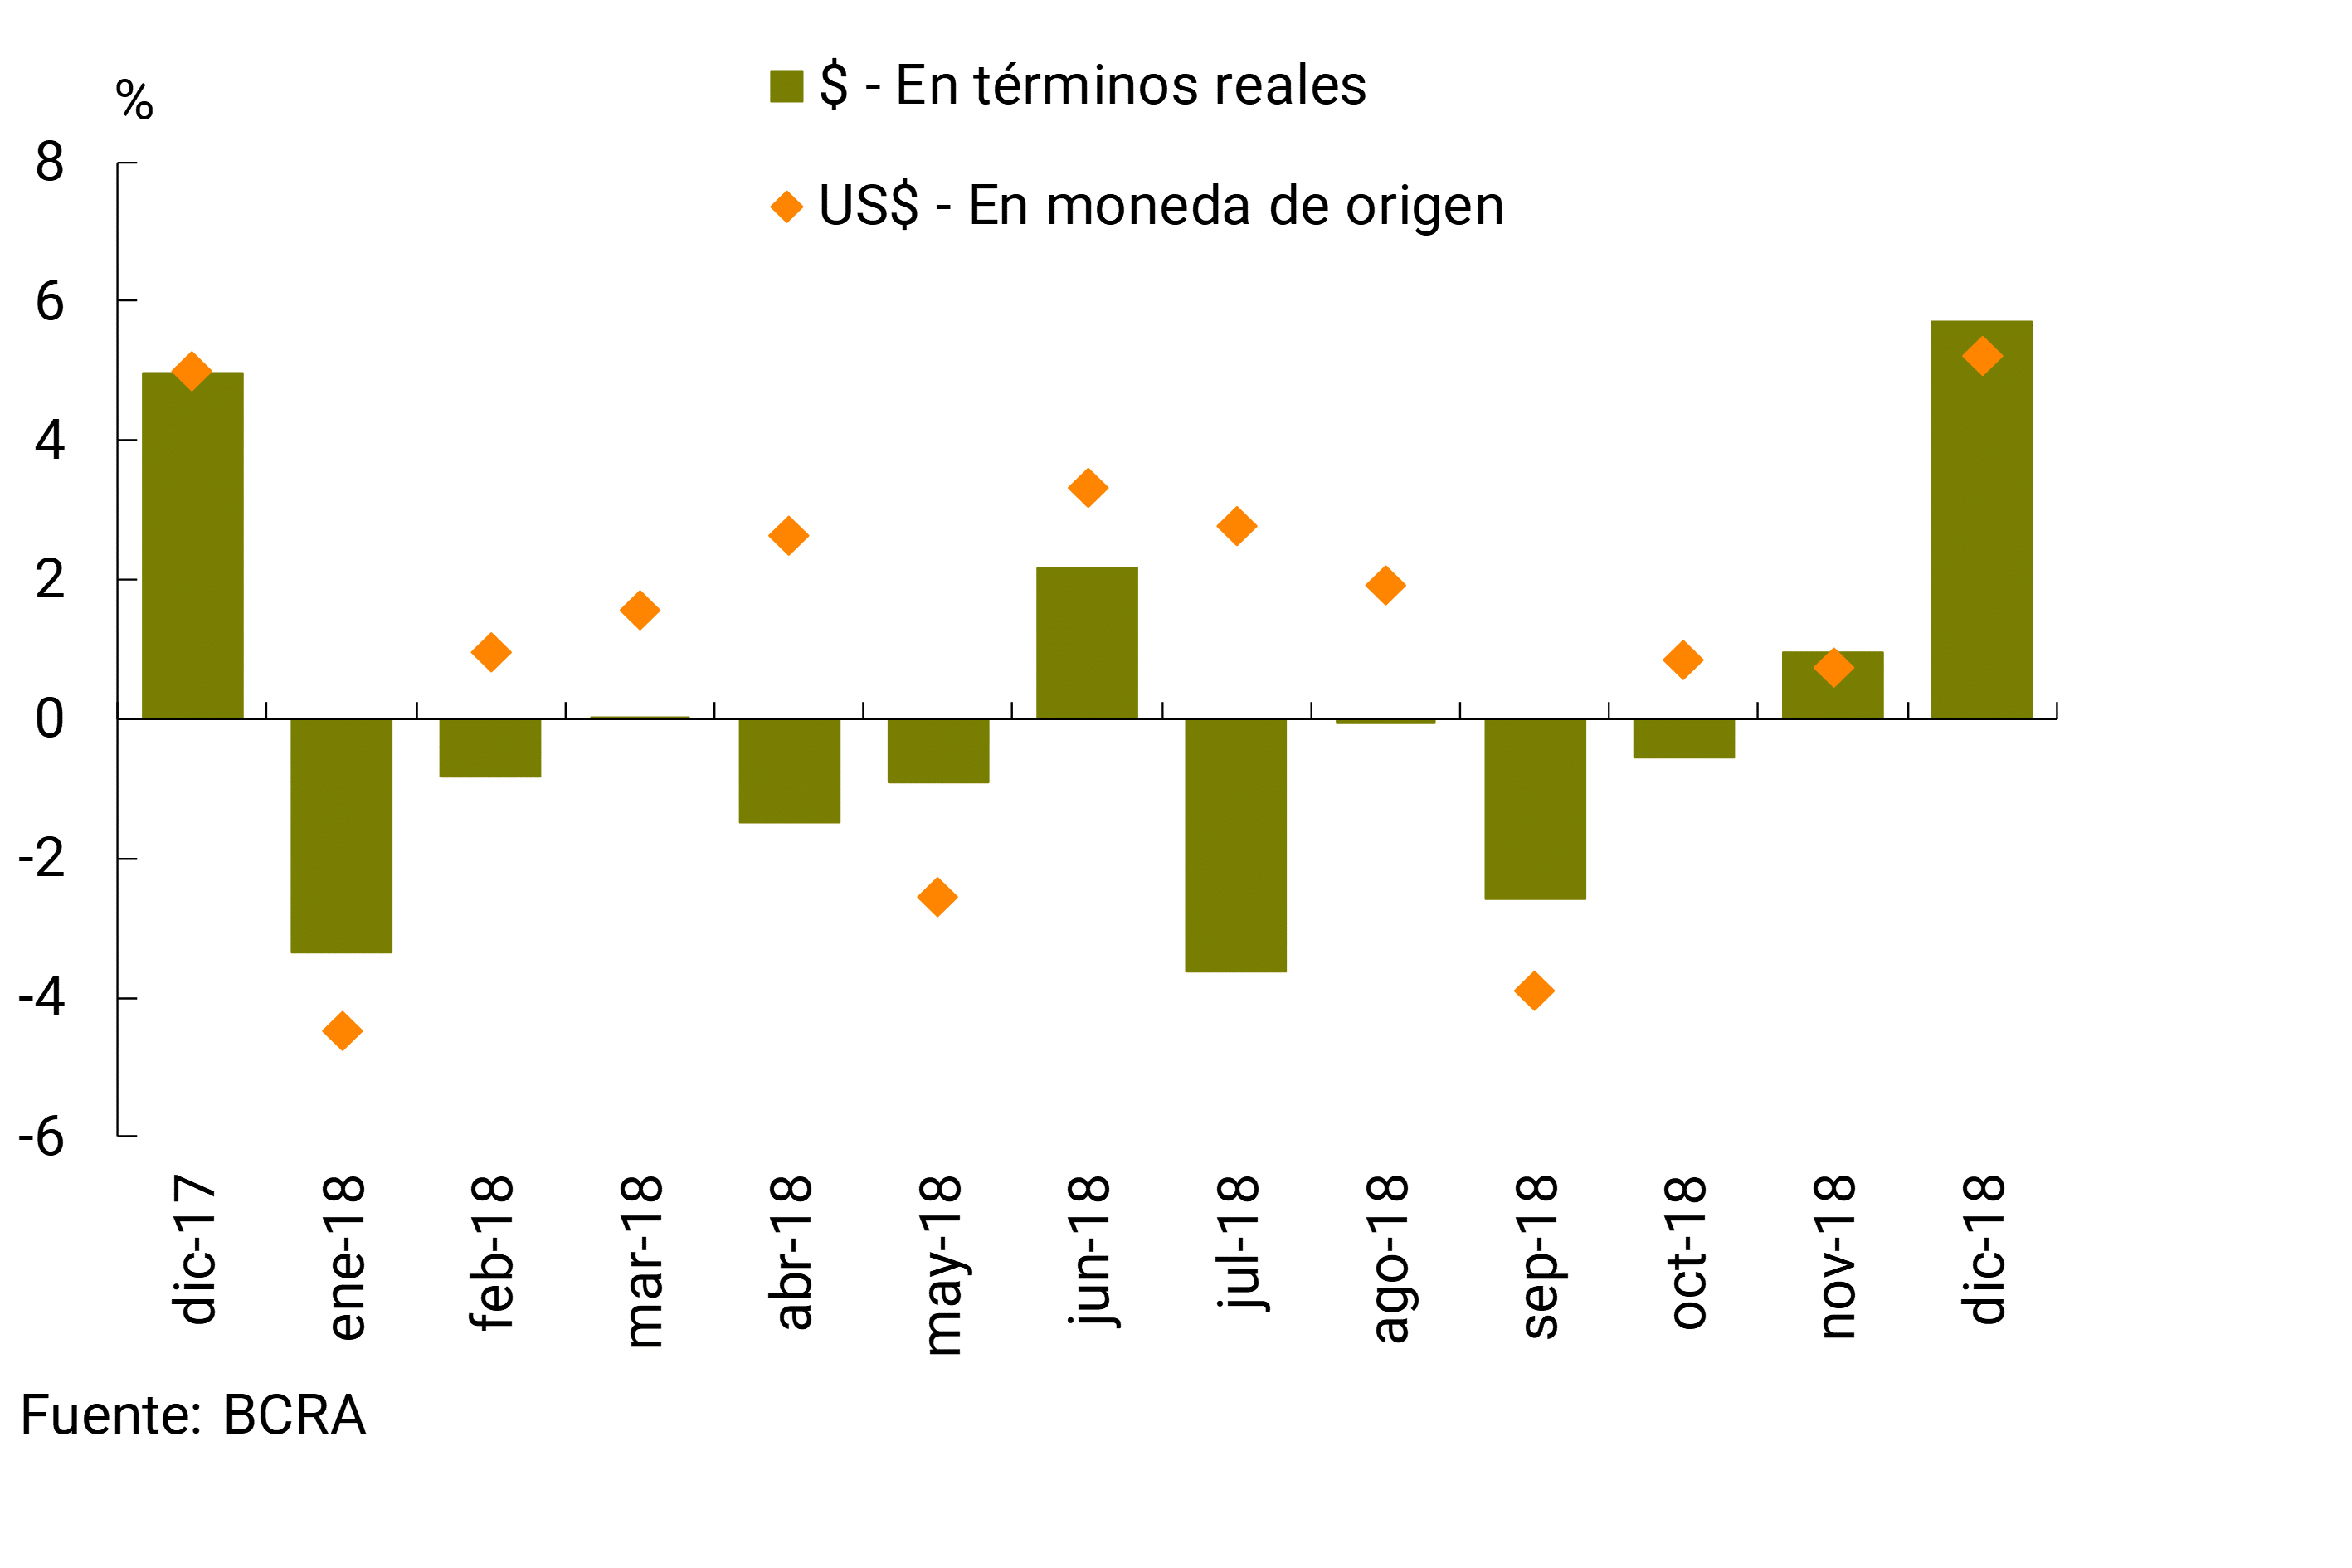
The balance of private sector deposits in pesos increased by 5.7% in real terms in December (+8.4% nominal), with a greater relative increase in demand accounts (+10.6% in real terms), which partly reflected the effect of the payment of the half bonus and the liquidity needs of the end of the year (see Chart 5). In turn, time placements in pesos by the private sector increased 1.2% in real terms compared to November, reversing the real variations observed in the same period of previous years (-4.6% in 2016 and -0.7% in 2017). Given the nominal reduction in deposits in pesos in the public sector – in part due to the aforementioned payment of the half bonus – total placements in the same denomination decreased 1.7% in real terms in the period.10 On the other hand, total deposits arranged in foreign currency increased 4.2% —in source currency— in December, driven by private sector placements, which grew 5.2% in the month.
Graph 5 | Monthly Evolution of Private Sector Deposits
Throughout 2018, private sector deposits in pesos decreased by 4.8% in real terms (-16.2% for demand accounts and +12.7% for term placements, both values in real terms), while those made by the public sector grew. Thus, the balance of total deposits in national currency increased 2.5% in real terms in the last twelve months. On the other hand, deposits in foreign currency accumulated an increase of 8.2% – in currency of origin – in 2018, with increases in private sector and public sector deposits (+8.9% and +4.9% respectively; both values in currency of origin).
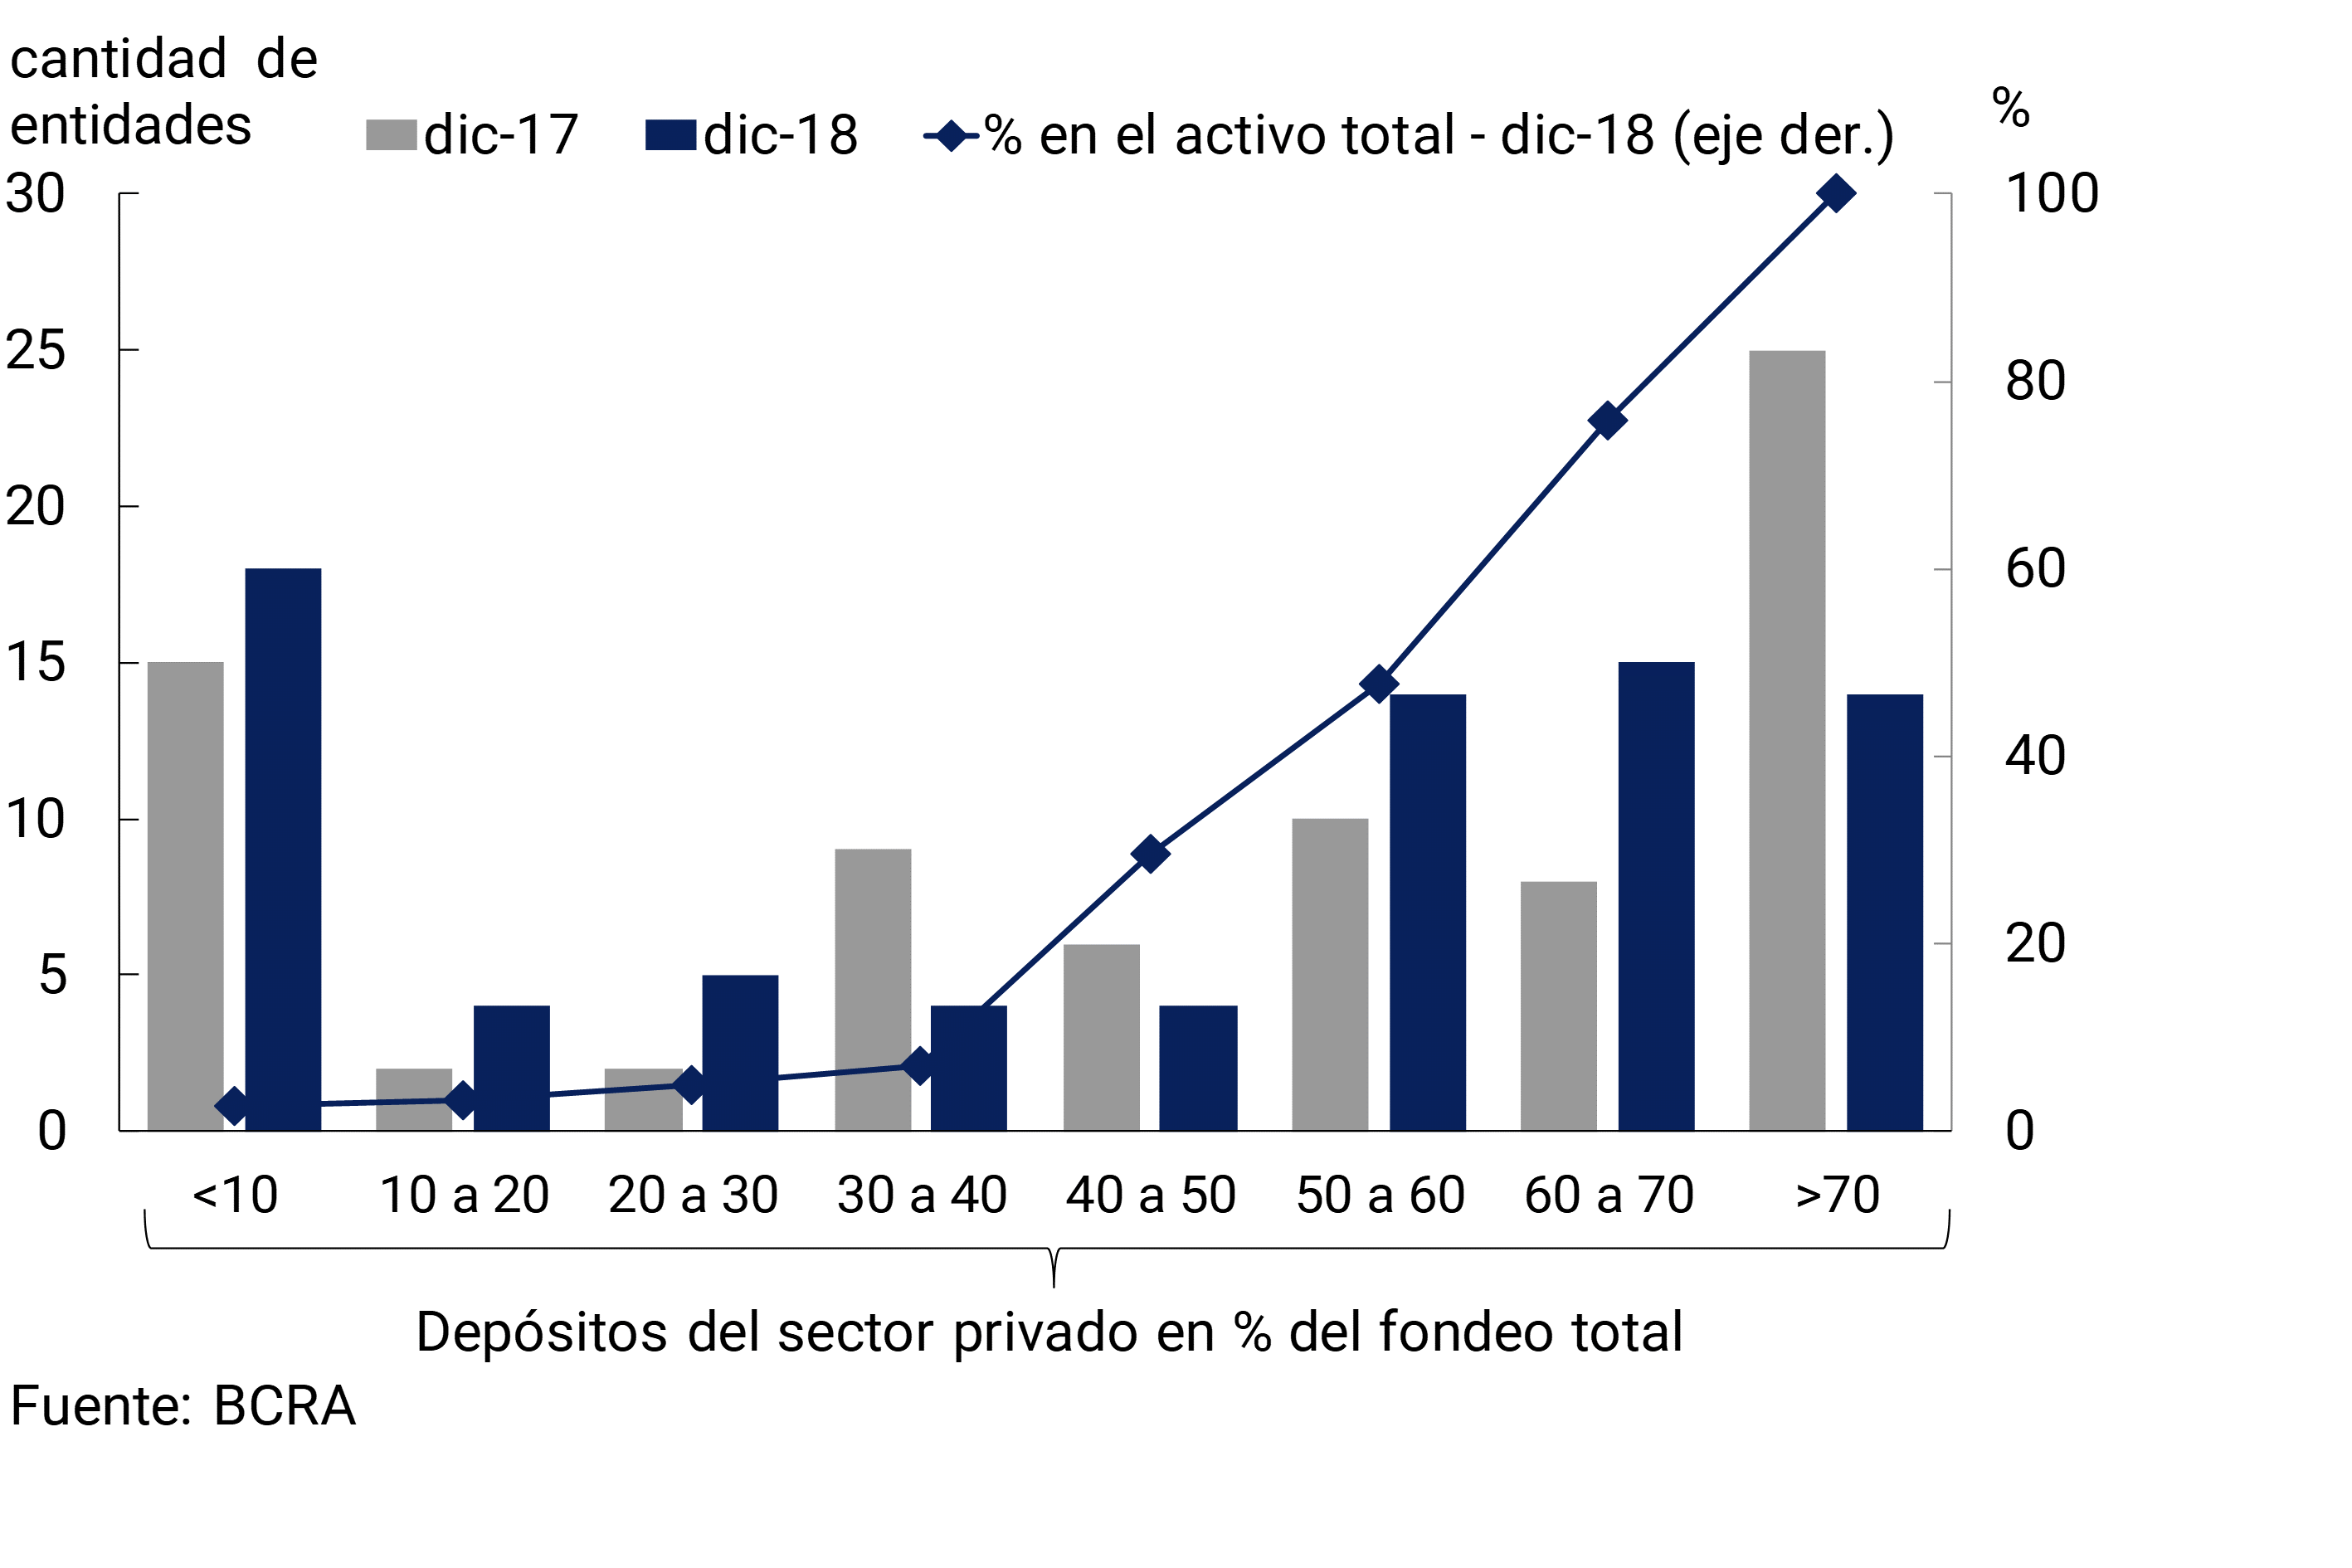
Taking into account the performance of the different sources of resources in the financial system, in December the relative importance of private sector deposits in total funding (liabilities and equity) increased by 2.8 p.p., reaching a level of 57.5%. On the other hand, in the month, public sector deposits reduced their share of total funding by 2.9 p.p. to 15.6%. At the end of 2018, a total of 43 banks (out of the 78 that make up the financial system) had a ratio of more than 50% between deposits from the non-financial private sector and total funding (these financial institutions accounted for more than 70% of aggregate assets, see Chart 6).
Graph 6 | Share of Private Sector Deposits in Total Funding – Distribution by Entity
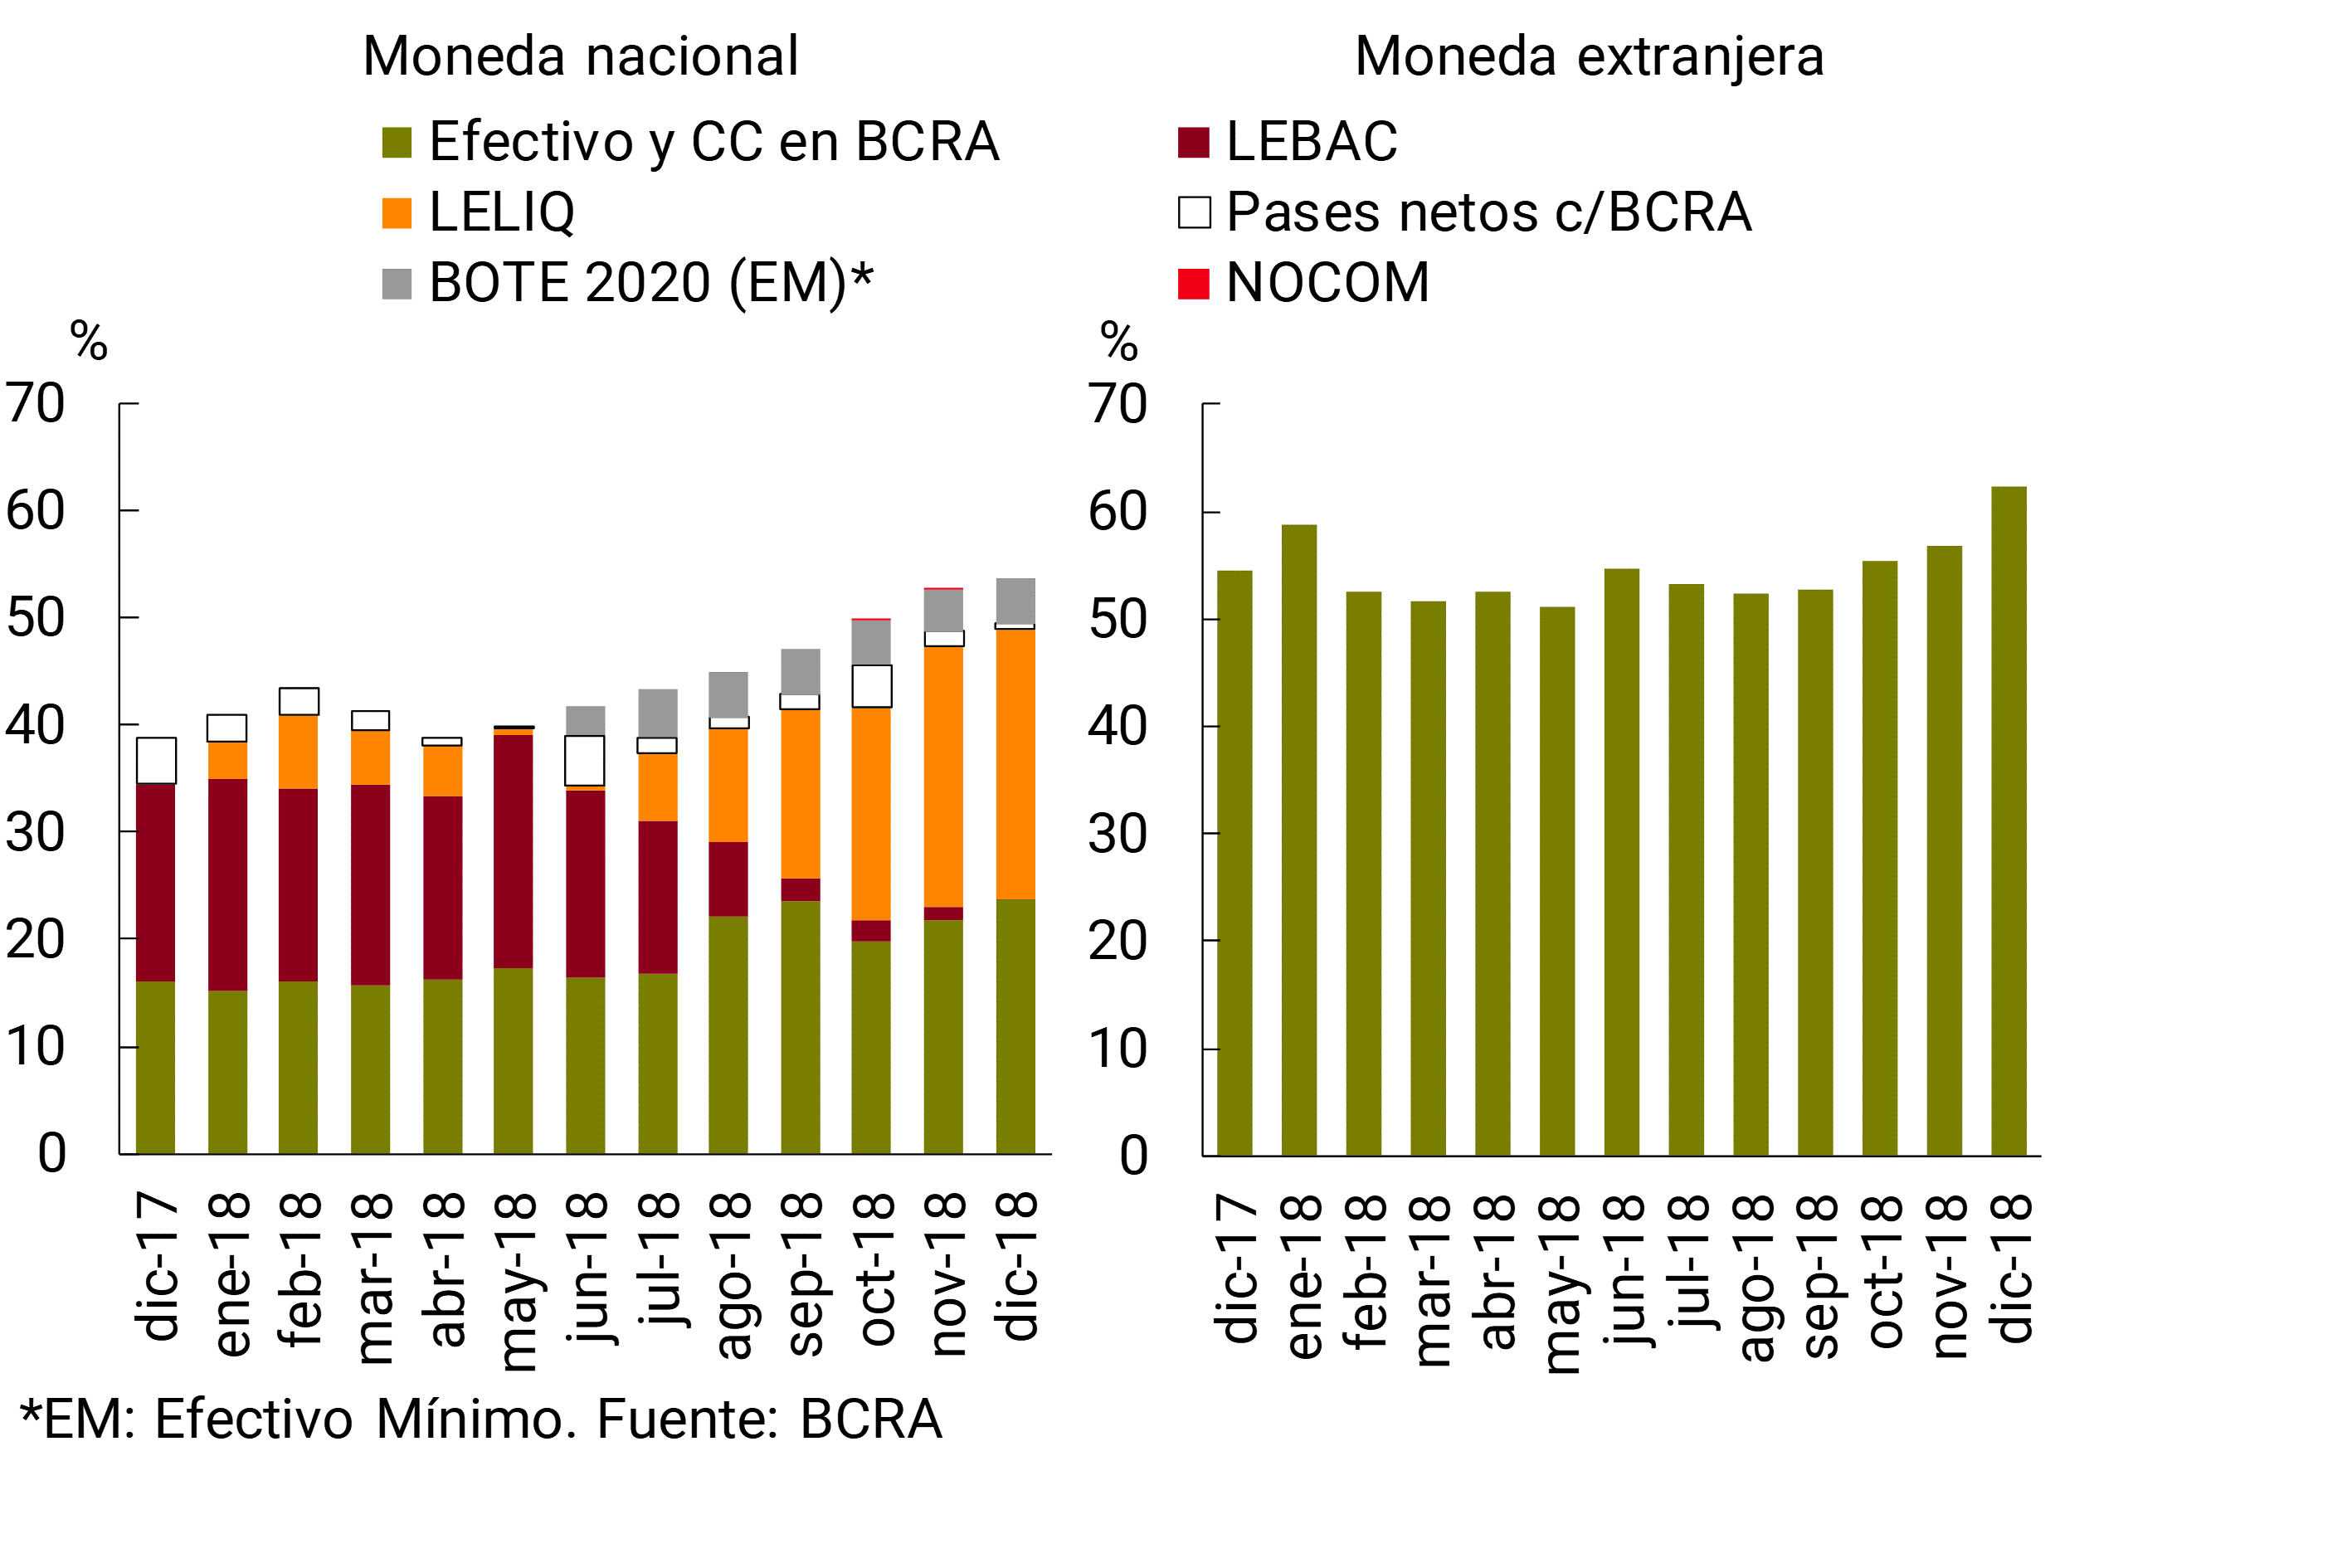
Bank liquidity closed the year at high levels. The broad liquidity ratio – integration of minimum cash, BCRA instruments and availabilities, in domestic and foreign currency – totaled 56.4% of total deposits in December (53.7% considering only items in pesos), increasing 2.3 p.p. (+0.9 p.p.) compared to the previous month. The monthly increase in liquidity was mainly due to the higher holdings of cash and balances in current accounts of the entities in the BCRA (see Chart 7). In a year-on-year comparison, the ample liquidity of the financial system increased 13.8 p.p. of deposits, a variation driven mainly by private banks. For its part, in December, liquid assets in foreign currency accounted for 62.4% of deposits in the same denomination, 5.5 p.p. above the previous month’s record and 7.8 p.p. above the level of December 2017.
Figure 7 | Composition of Bank Liquidity – As % of Deposits
Interest rates for fixed-term deposits in the private sector fell 1.6 p.p. to 46.2% nominal annual on average, after several months of upward trajectory.
IV. Credit and Portfolio Quality
In December, the balance of credit in pesos of the financial system aggregated to the private sector fell by 2.3% in real terms compared to November (+0.3% nominal11) (see Chart 8). 12 The monthly behavior was mainly explained by advances and personal loans, which, together, accounted for almost 90% of the real monthly fall in credit to the private sector. For its part, the balance of financing in foreign currency decreased 1.6% in the period with a generalized reduction among the different lines of credit. 13 In this context, in the last month of 2018 the total financing balance (including national and foreign currency) to companies and families re-expressed in pesos registered a monthly fall of 2.9% in real terms (-0.4% nominal).
Figure 8 | Private Sector Credit Balance by Currency
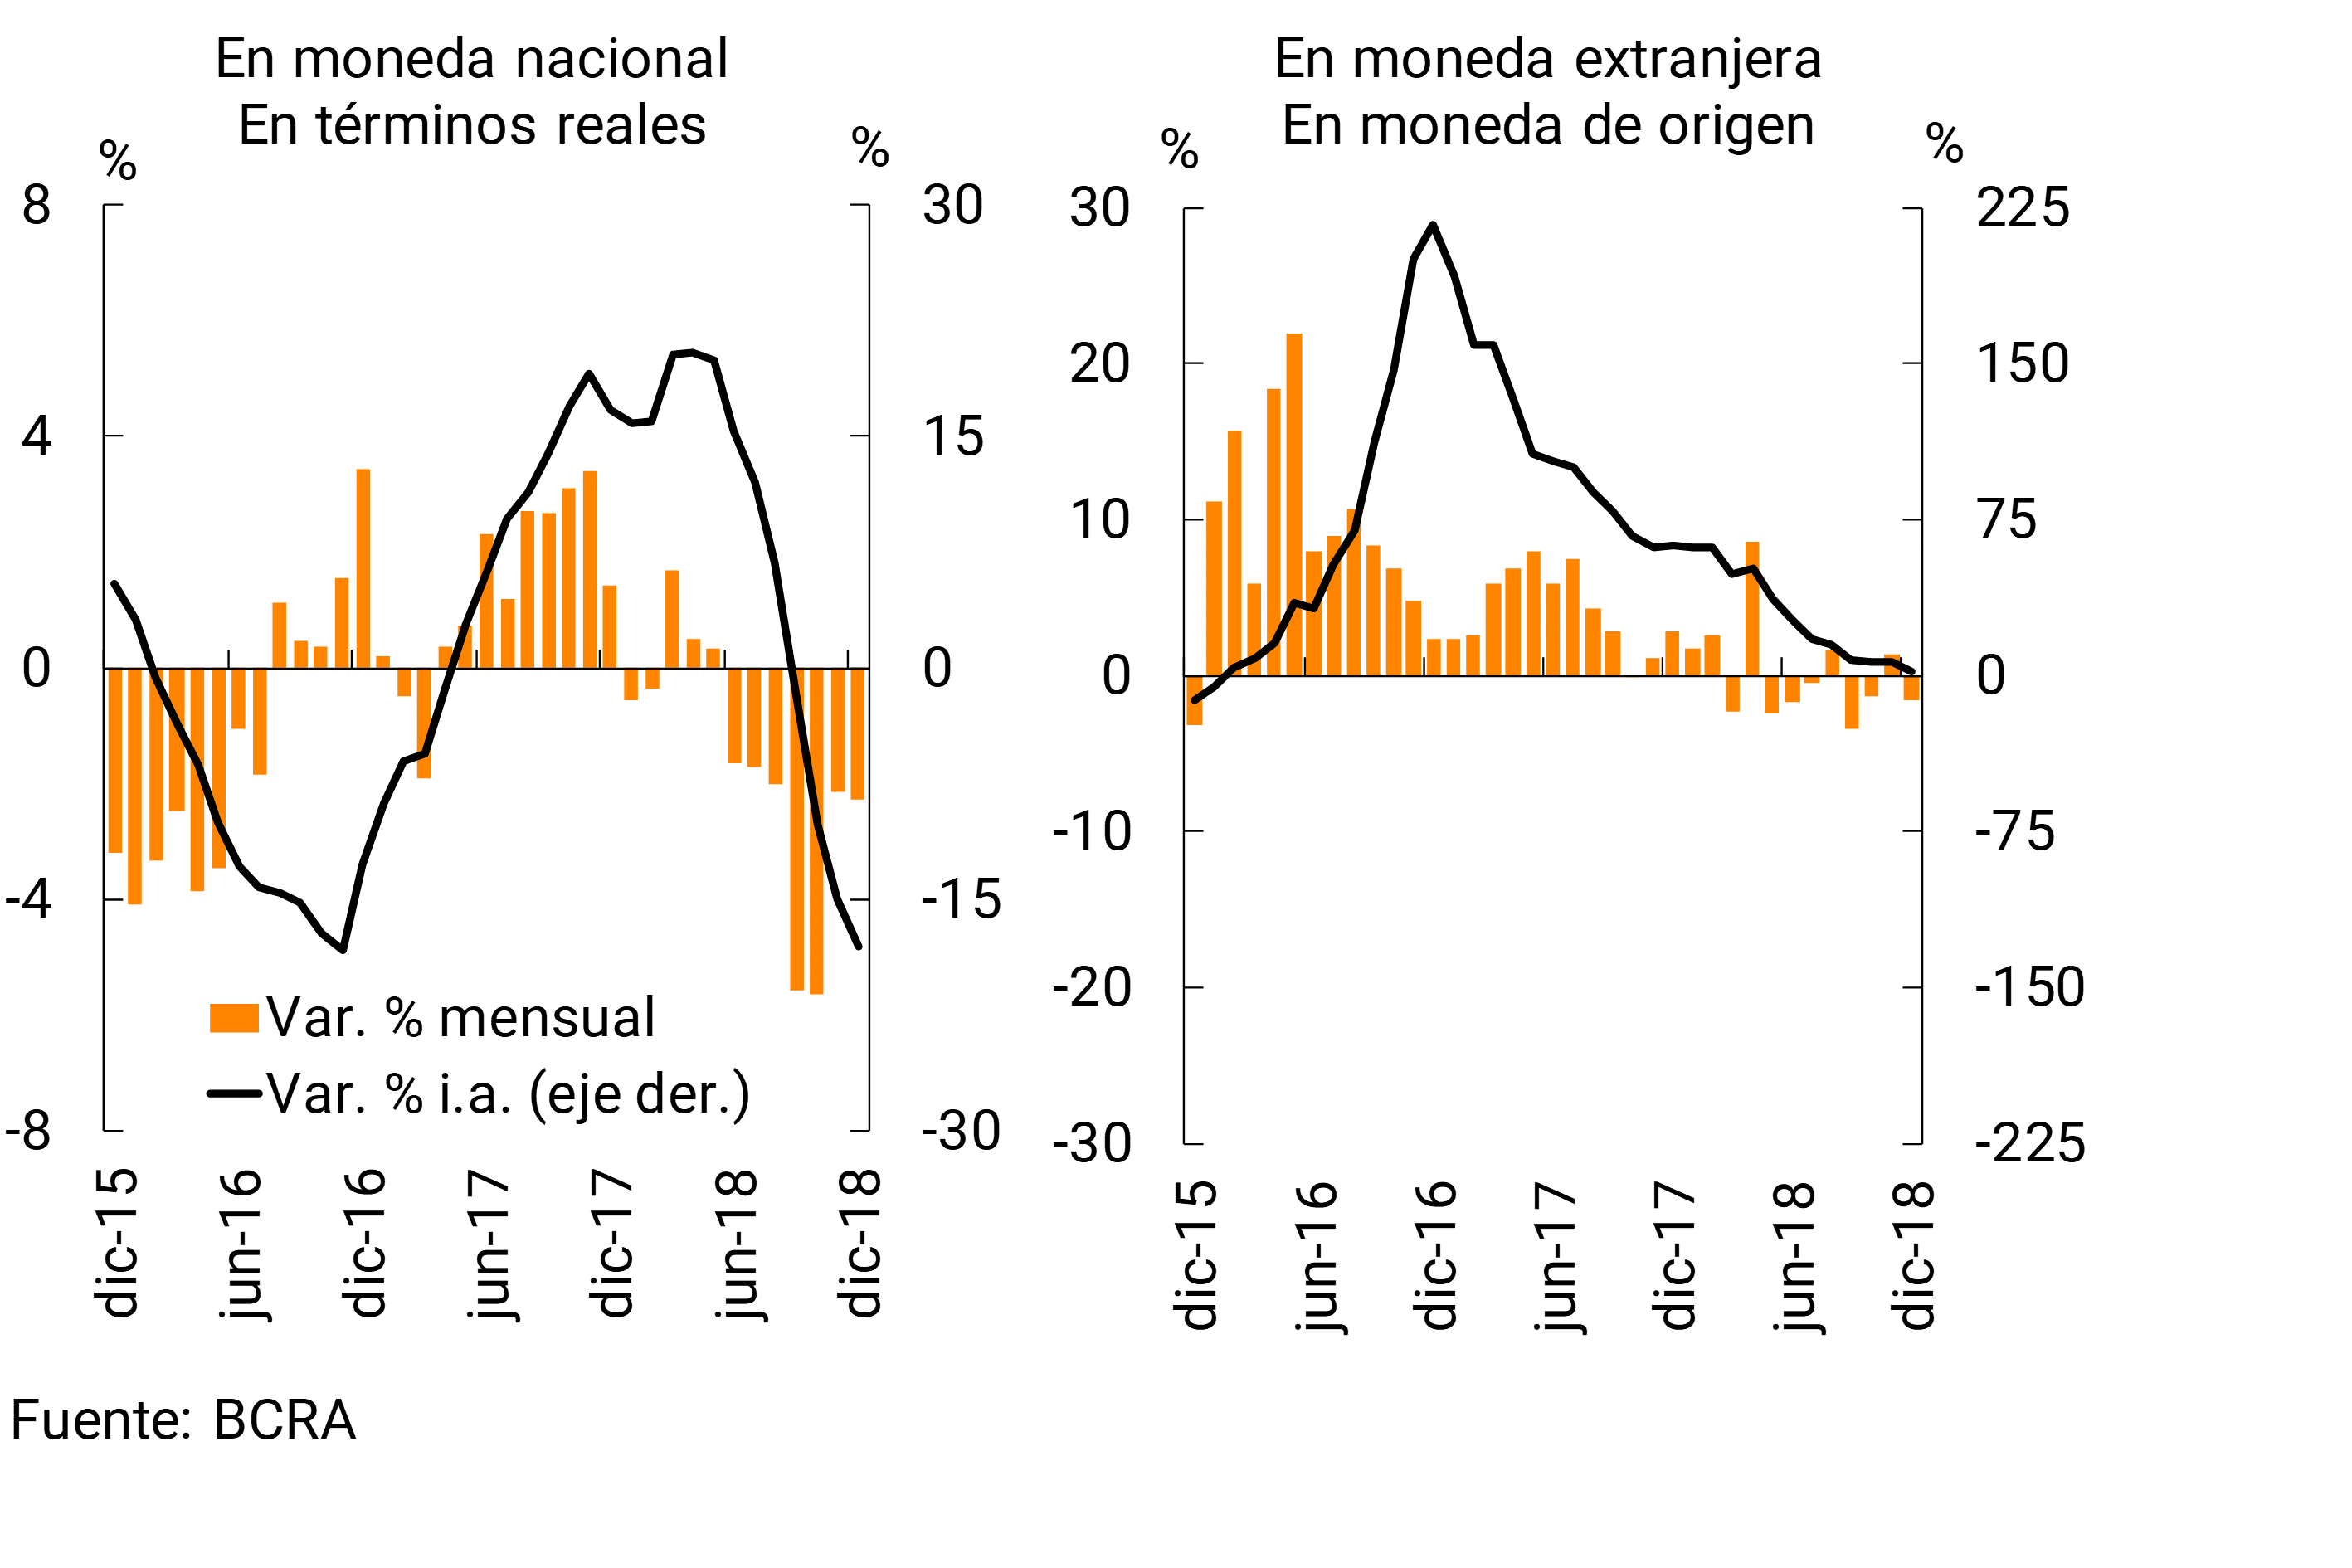
In 2018, loans in pesos to the private sector accumulated a decrease of 18% in real terms (see Graph 8). 14 Documents, leasing and pledges showed the largest relative year-on-year declines (-41%, -32% and -27%, respectively). Meanwhile, credit in foreign currency was slightly above the level observed at the end of 2017 (+1.8% YoY).
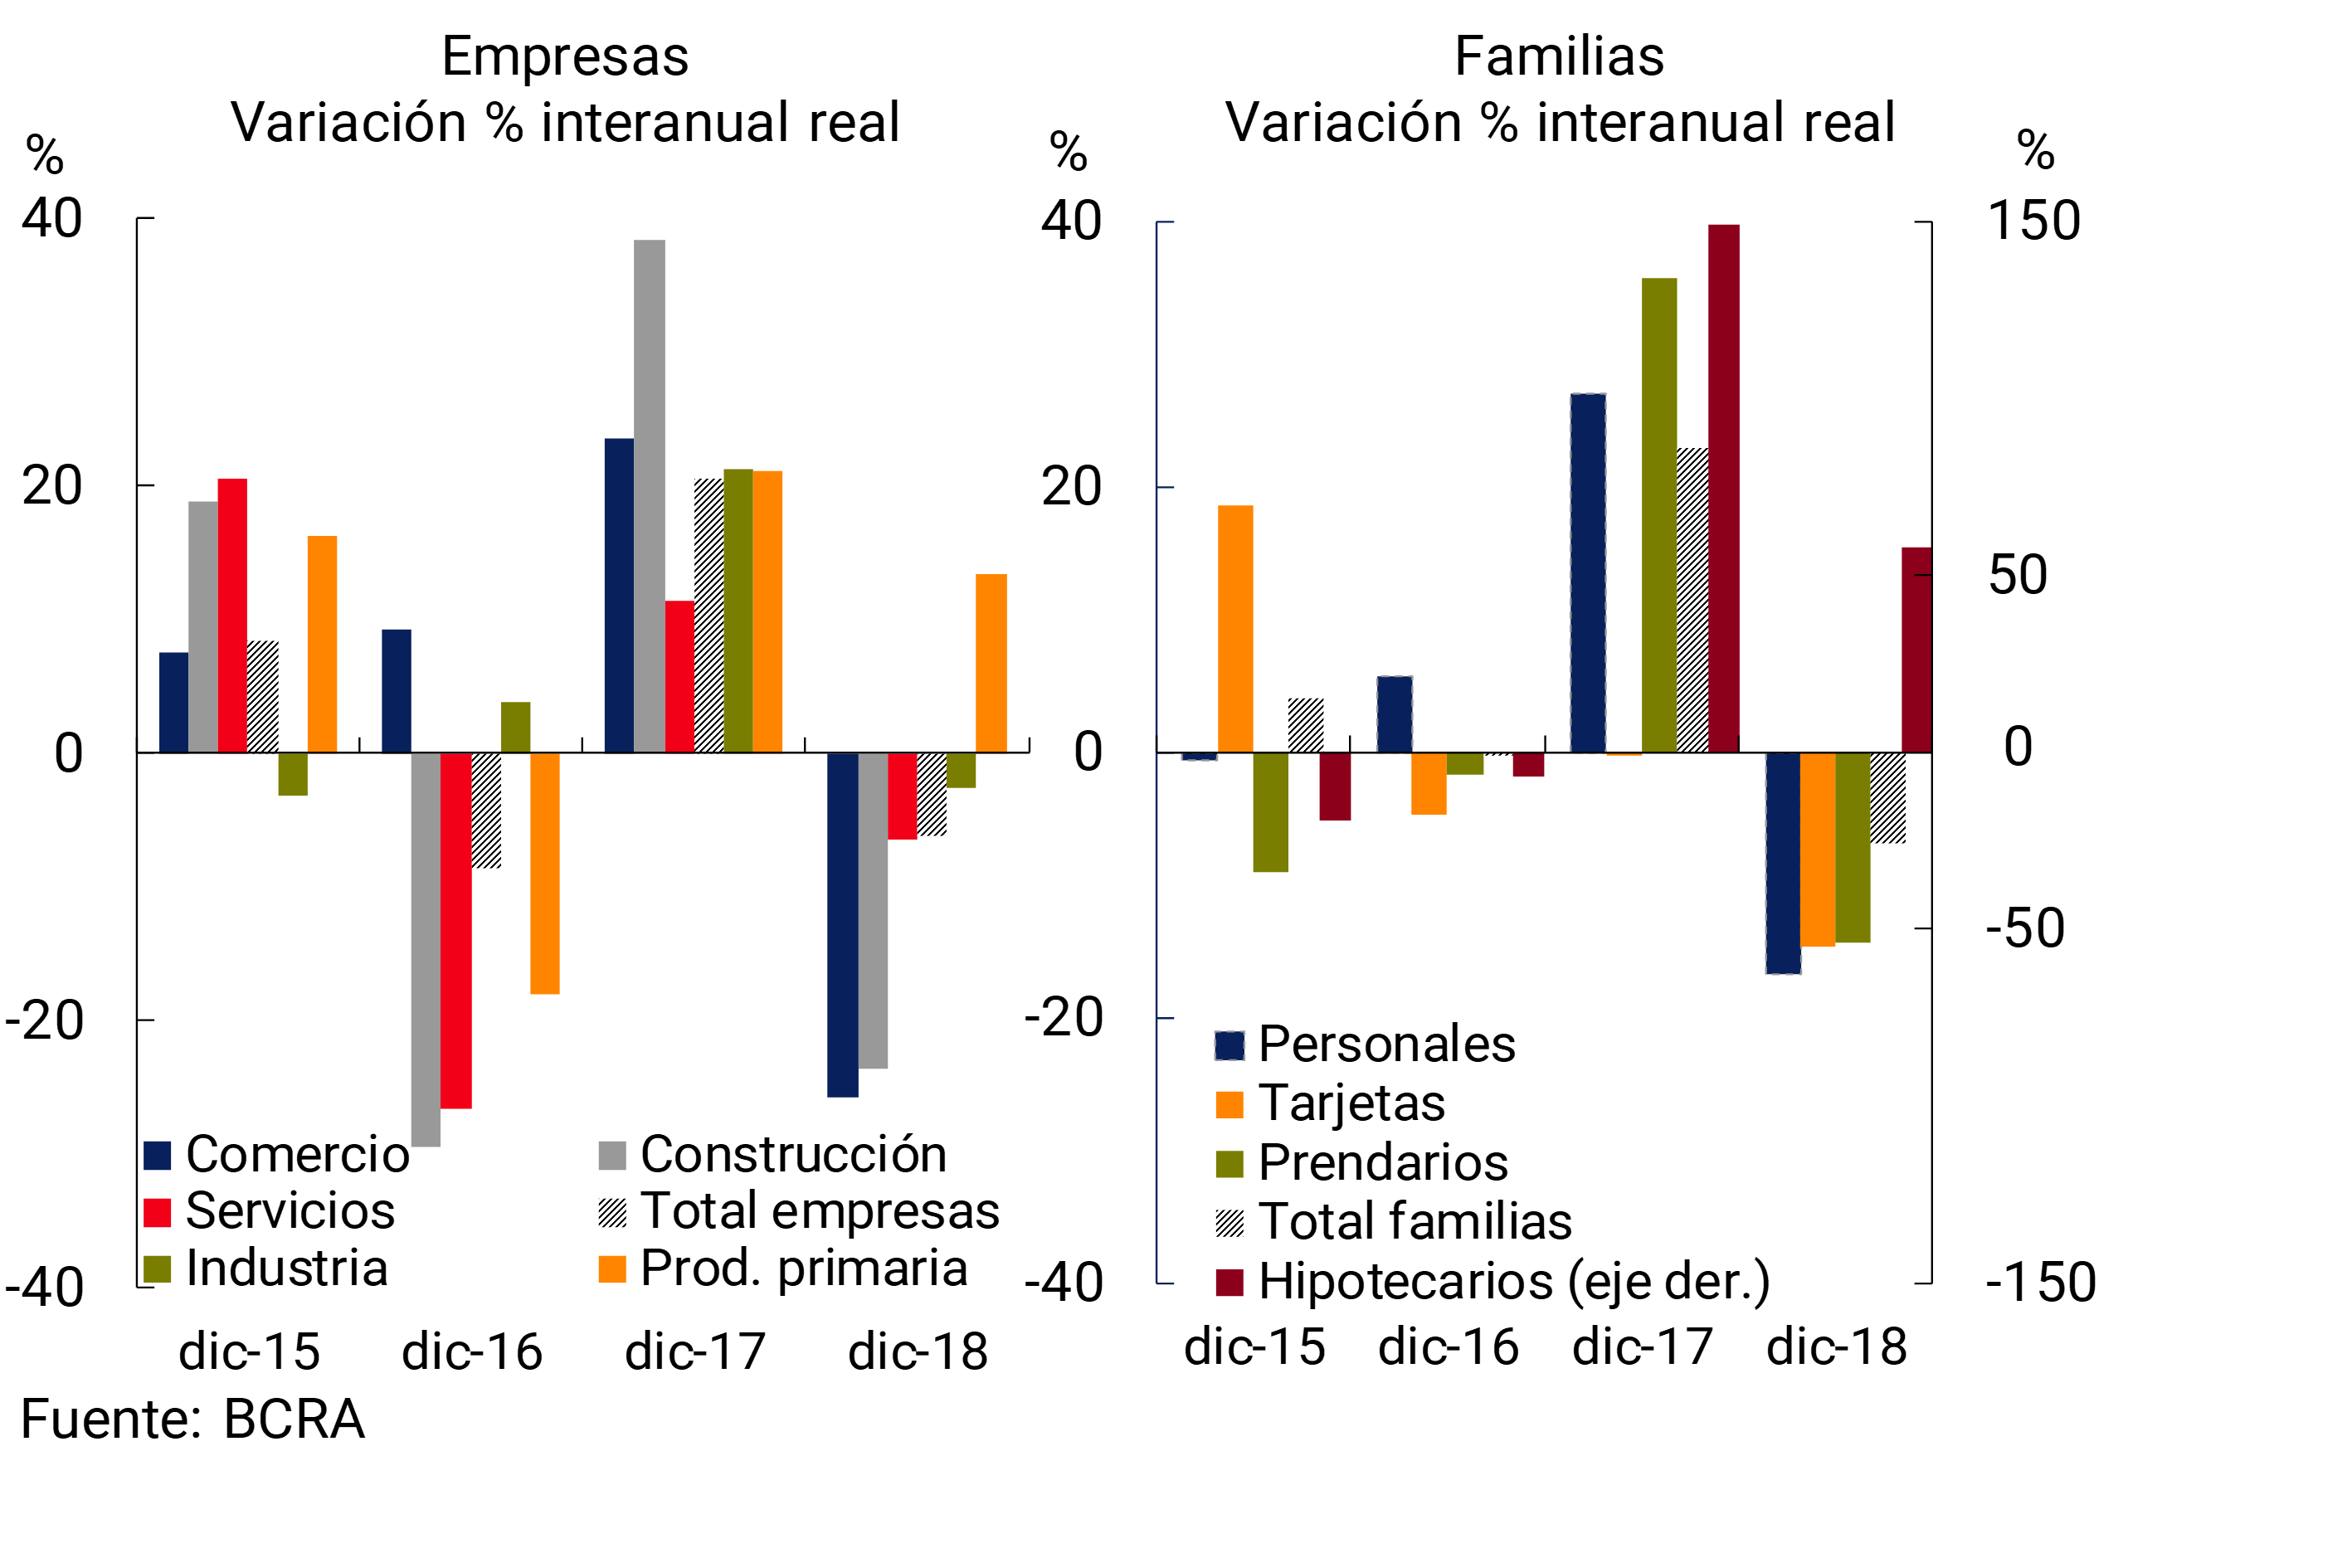
The total credit balance (including domestic and foreign currency) to companies fell 3.2% in December in real terms (-0.7% nominal) compared to November, mainly due to the performance of loans to industry and construction (see Chart 9). 15 During the year, the balance of total loans to firms accumulated a fall of 6.1% in real terms. In 2018, the real decrease in financing to this segment was observed in private banks, and to a lesser extent, in public banks. For their part, in 2018 non-bank financial institutions (NBEFs) increased the balance of credit to companies in real terms.
In December, loans to households decreased 2% in real terms compared to the previous month (+0.5% nominal), with a fall in real balances in all credit lines. 16 In year-on-year terms, total bank financing to households accumulated a reduction of 6.9% in real terms (see Chart 9), mainly explained by personal loans and cards. 17 The year-on-year performance of financing to households was driven by private banks and non-bank financial institutions, while public banks increased financing to this segment in real terms in the period.
Figure 9 | Total Credit Balance by Segment
The balance of credit in UVA to the private sector of the financial system reached $269,766 million at the end of 201818, registering a monthly growth of 2.8% in real terms. This type of credit came to represent 11.8% of the total balance of financing of all financial institutions to this sector at the end of 2018.
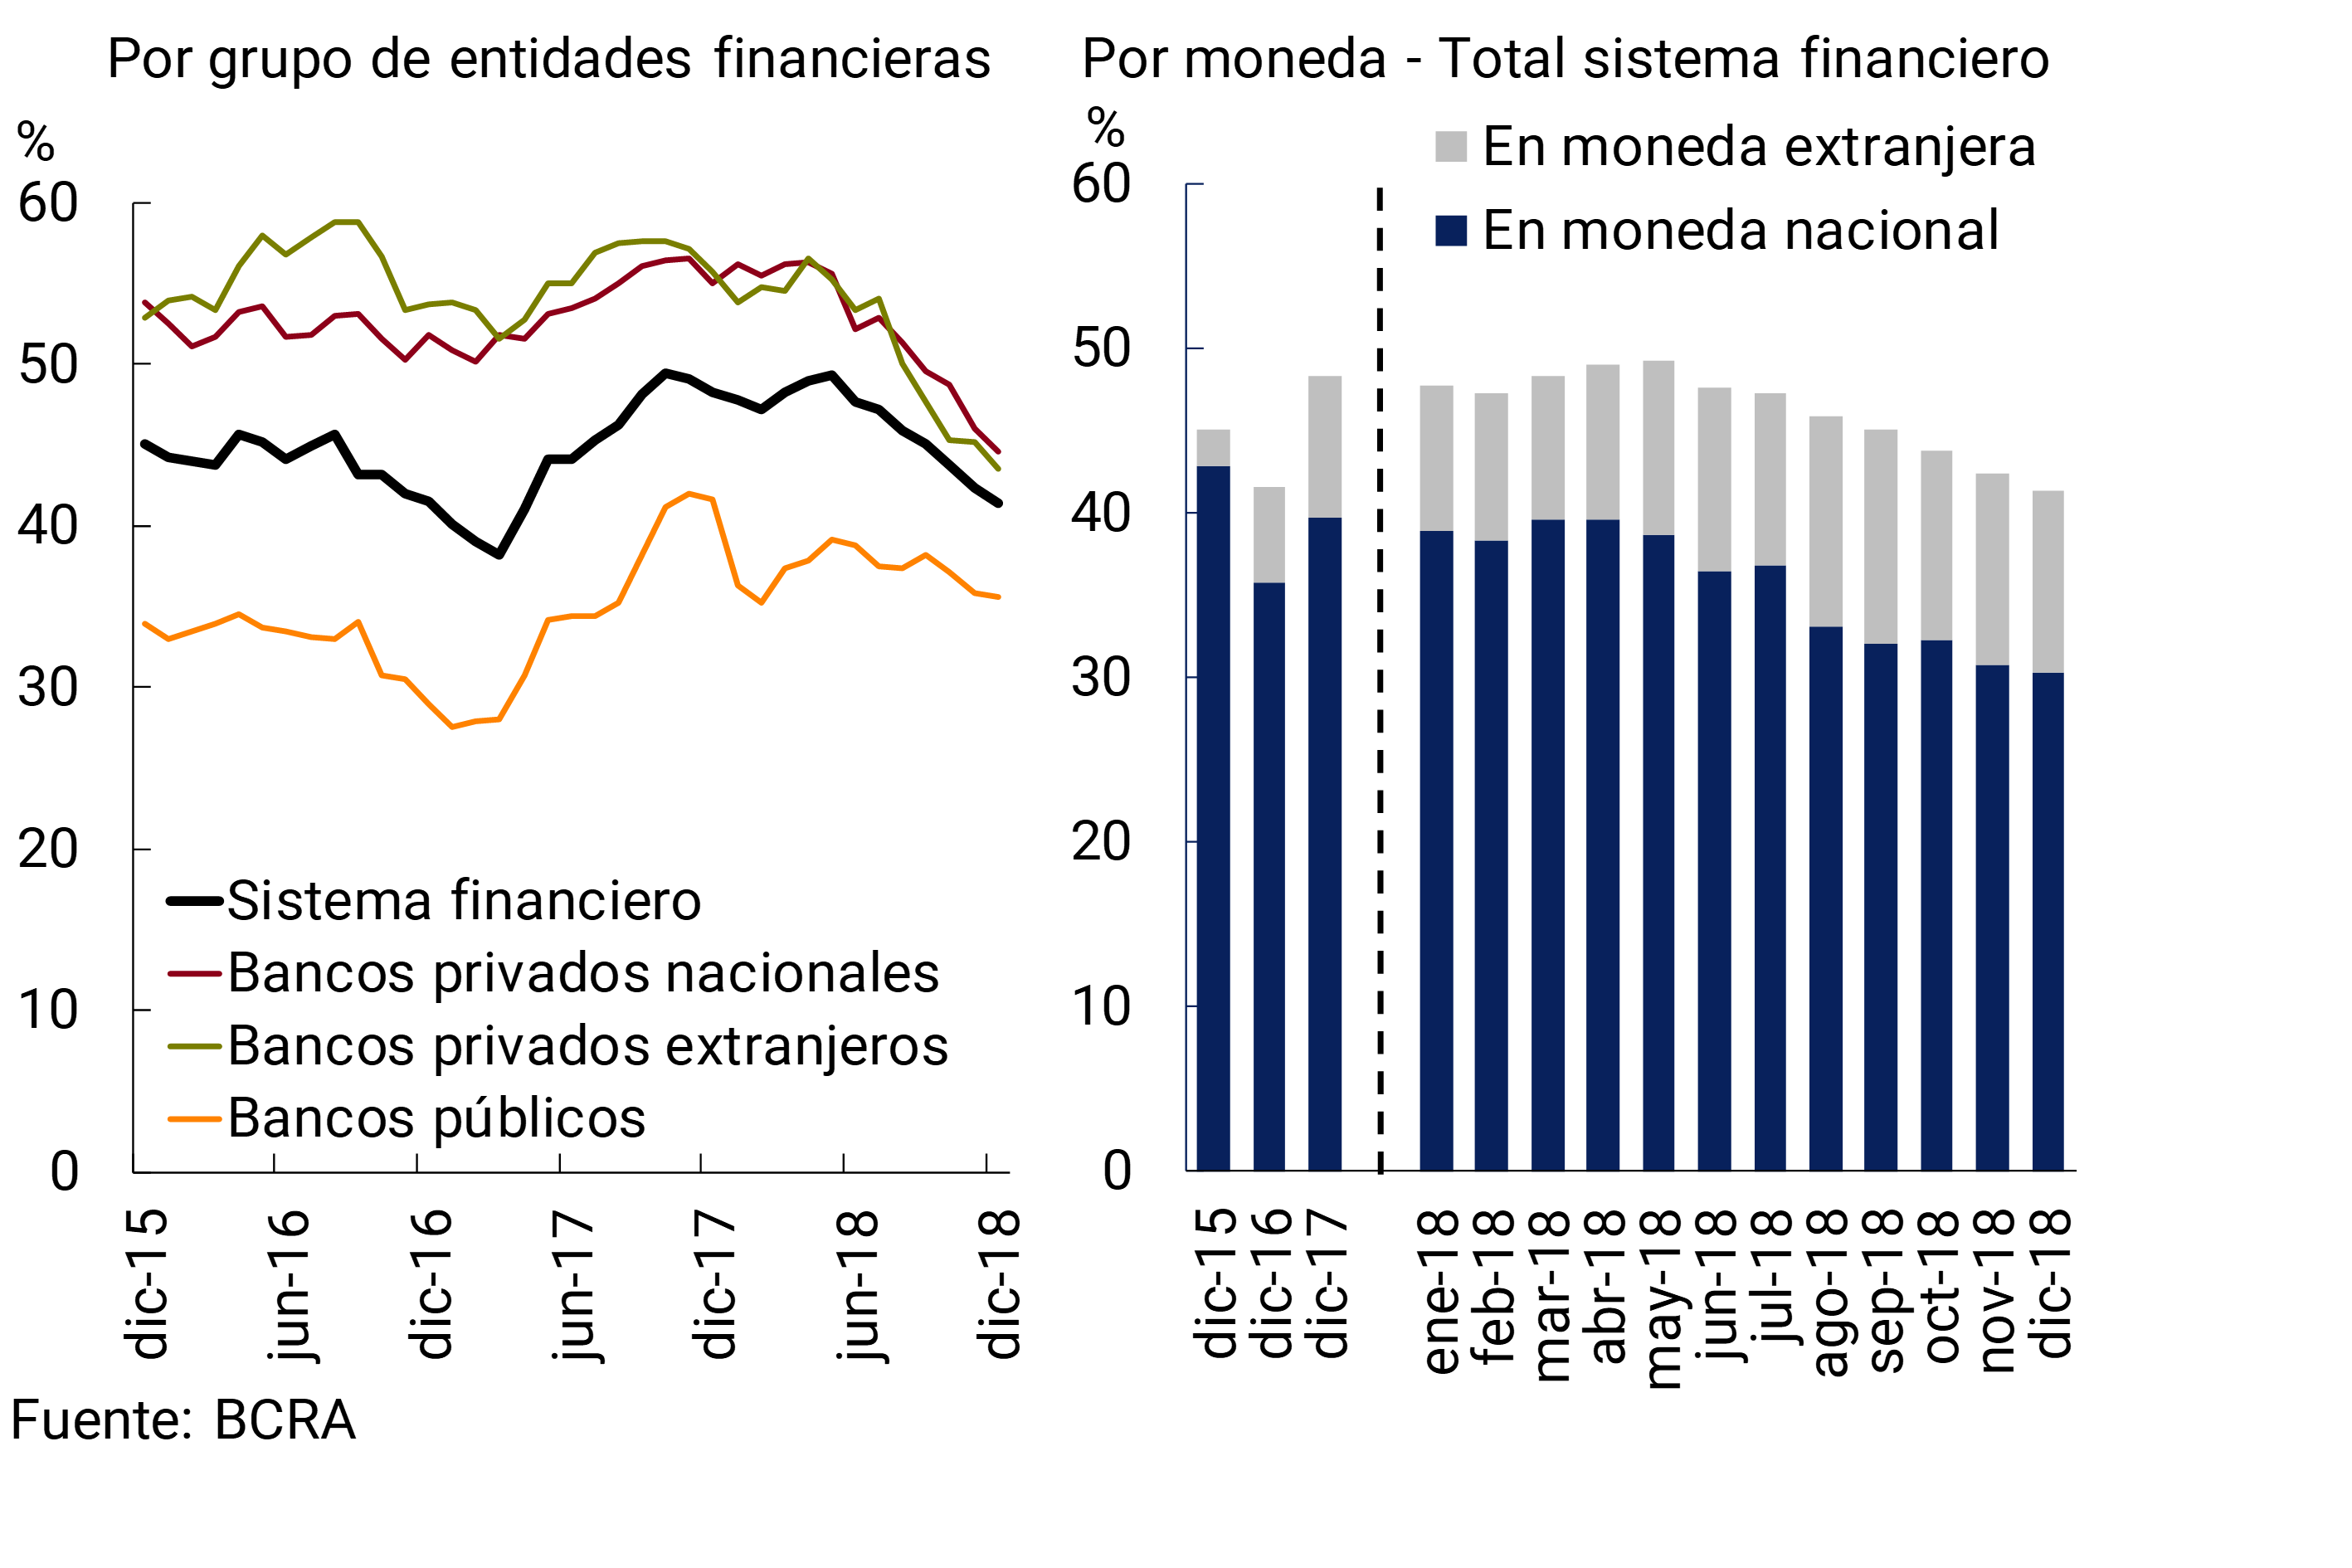
The share of credit to the private sector in the total assets of the financial system reached 41.3%, decreasing 1 p.p. compared to November’s figure and 6.9 p.p. in year-on-year comparison (see Chart 10). The monthly and year-on-year performance of this credit exposure indicator is mainly explained by private banks. Distinguishing by currency, the reduction in the exposure of the aggregate of banks to the private sector was mainly explained by the performance of financing in pesos, which went from representing 39.7% of total assets at the end of 2017 to 30.3% at the end of 2018.
Figure 10 |
Average lending rates in pesos for operations with the private sector showed heterogeneous behaviors in December. The interest rates agreed for commercial lines (advances and documents), pledges and personal interest rates were reduced compared to those observed in November, while in cards and mortgages they increased slightly. For its part, the average active interest rate operated in UVA in December remained without significant changes compared to November, with slight increases in the rates operated on mortgages and personal and documents, which were offset by falls in the rates on pledges.
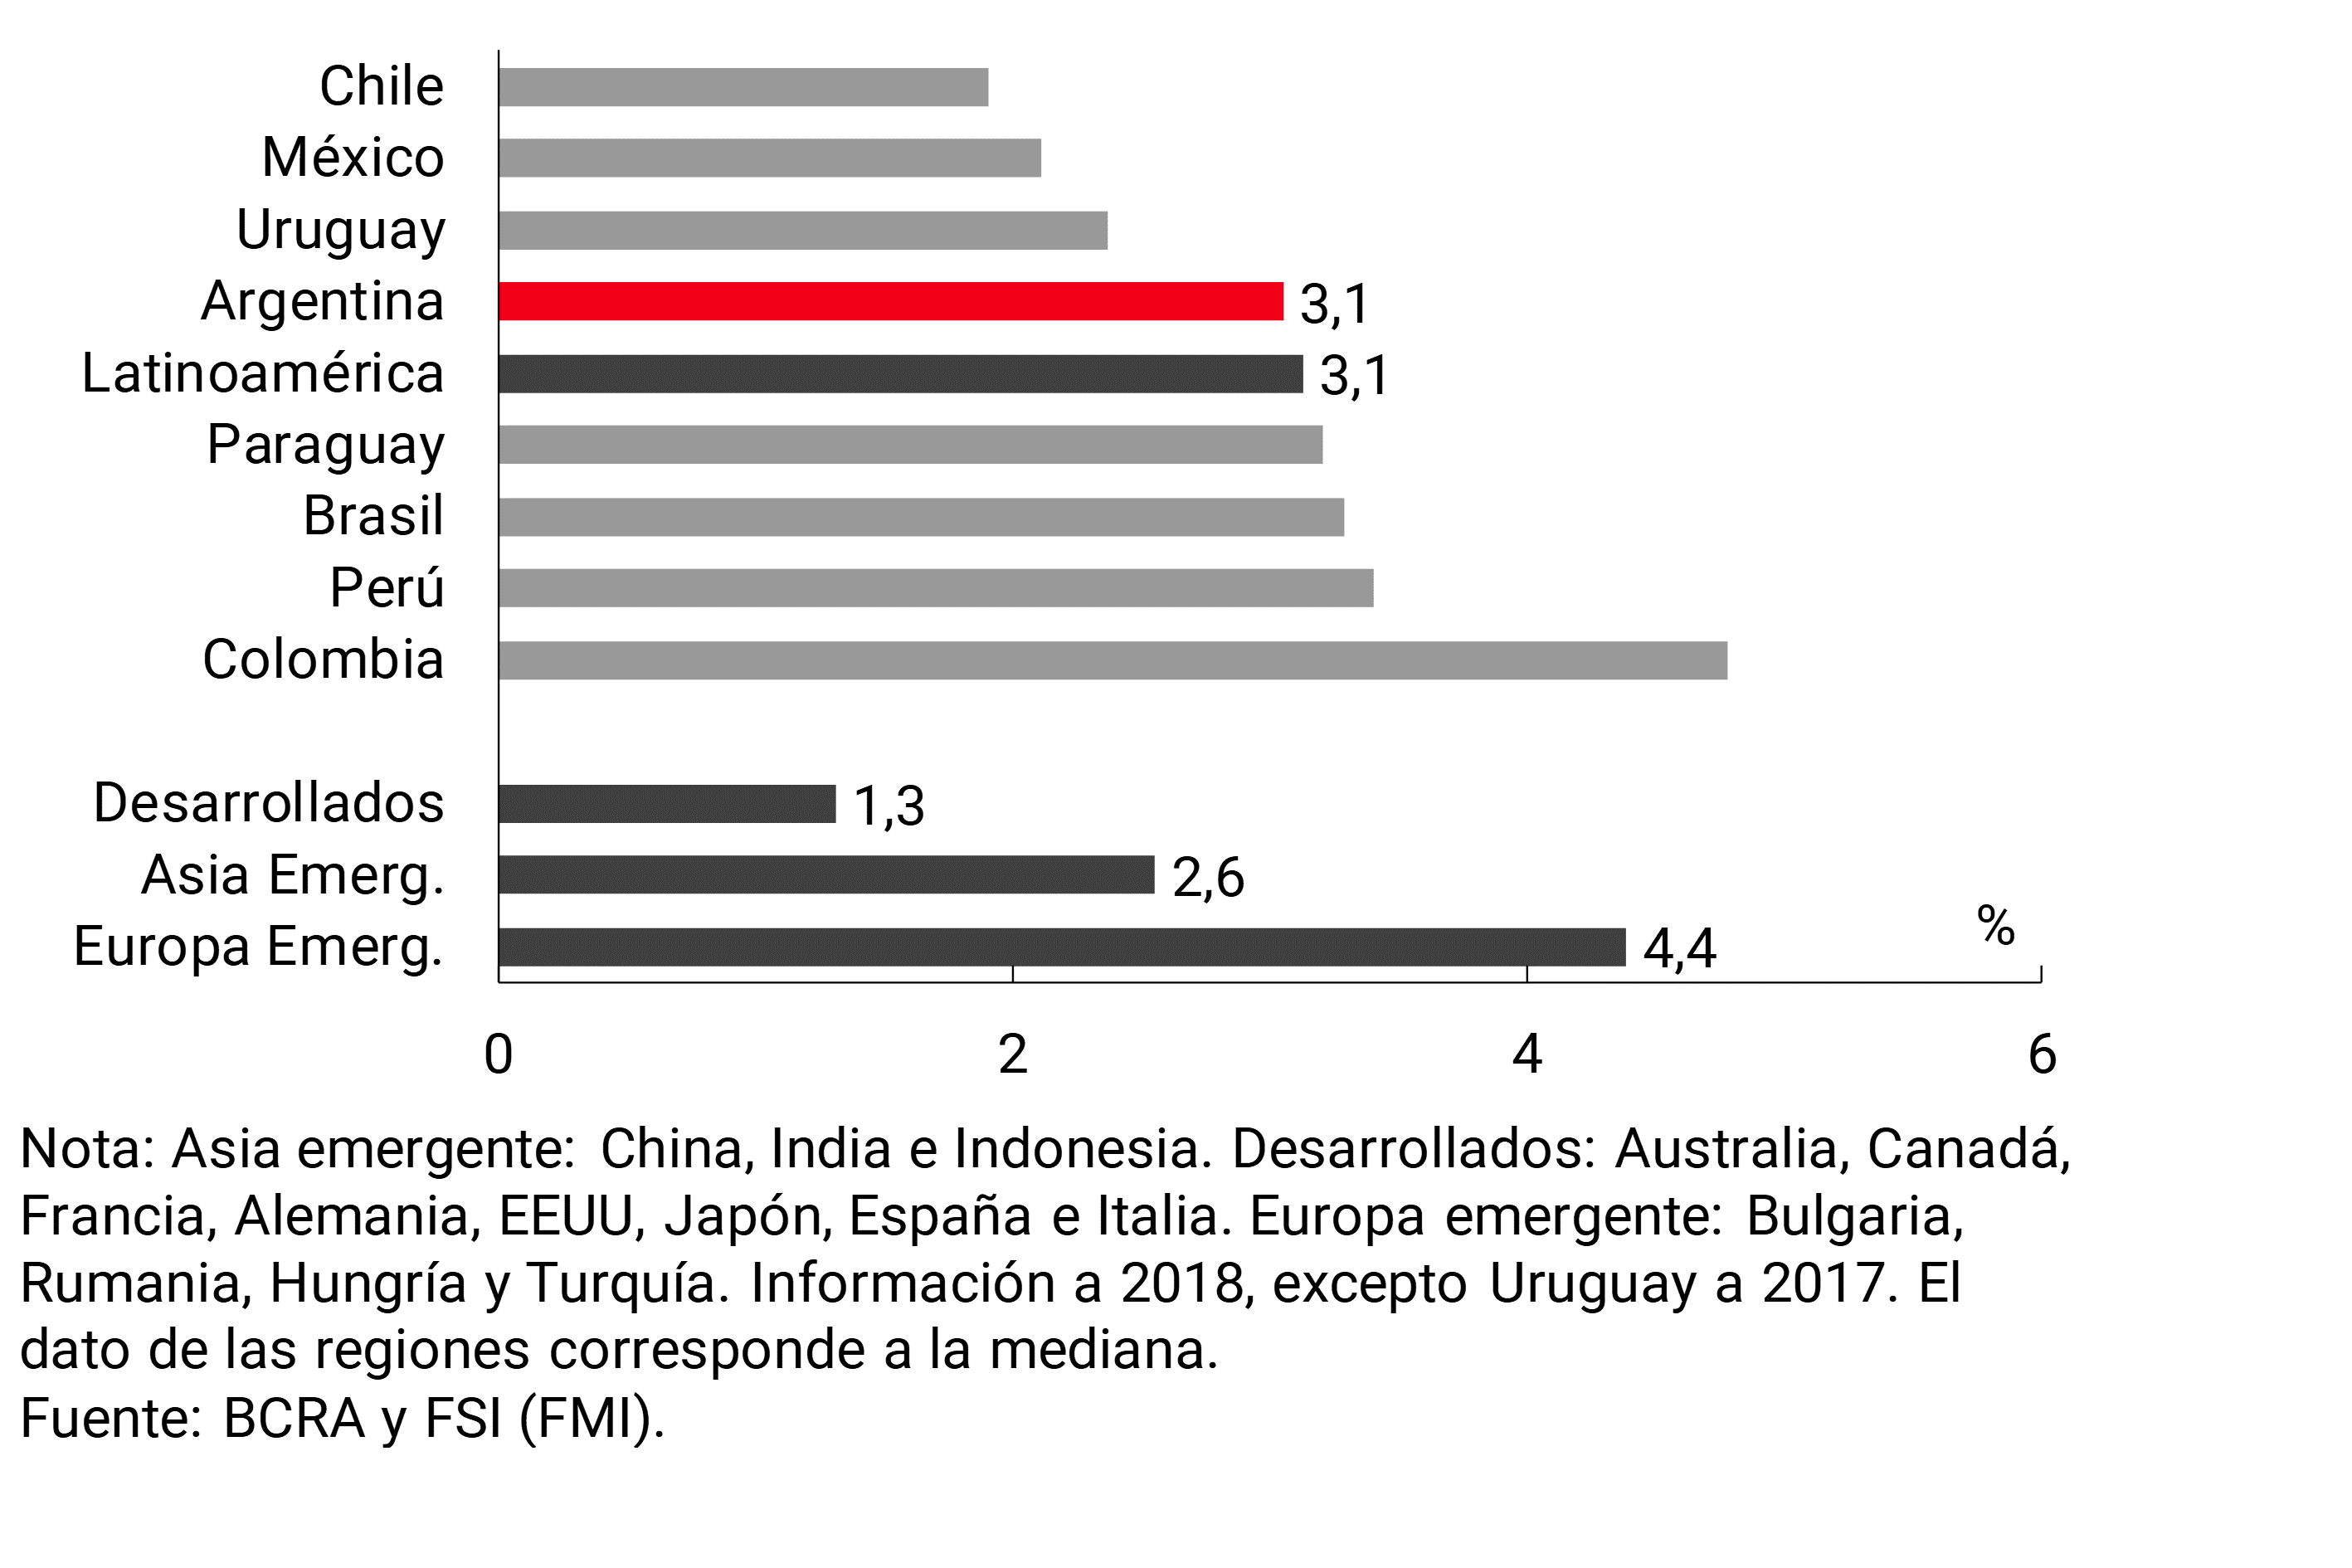
The NPL ratio of financing to the private sector stood at 3.1% at the end of 2018, increasing 0.2 p.p. compared to the value of November and 1.2 p.p. compared to the level at the end of 2017. However, it should be noted that the levels of irregularity of bank financing to the private sector remain at low levels in a historical comparison and with respect to the values observed in other economies in the region and emerging economies (see Figures 11 and 12).
Figure 11 | Irregularity of Credit to the Private Sector – Irregular financing / Total financing (%)
Figure 12 | Credit Irregularity – Irregular Financing / Total Financing (%)
Disaggregated by sector, in the last month of 2018 the NPL ratio of loans to companies increased by 0.3 p.p. compared to the value of November, reaching 2.4% in December (see Chart 13). In a year-on-year comparison, this indicator accumulated a rise of 1.5 p.p., mainly due to the behavior of loans to construction, commerce and industry.
Figure 13 | Irregularity of Credit to the Private Sector – Irregular financing / Total financing (%)
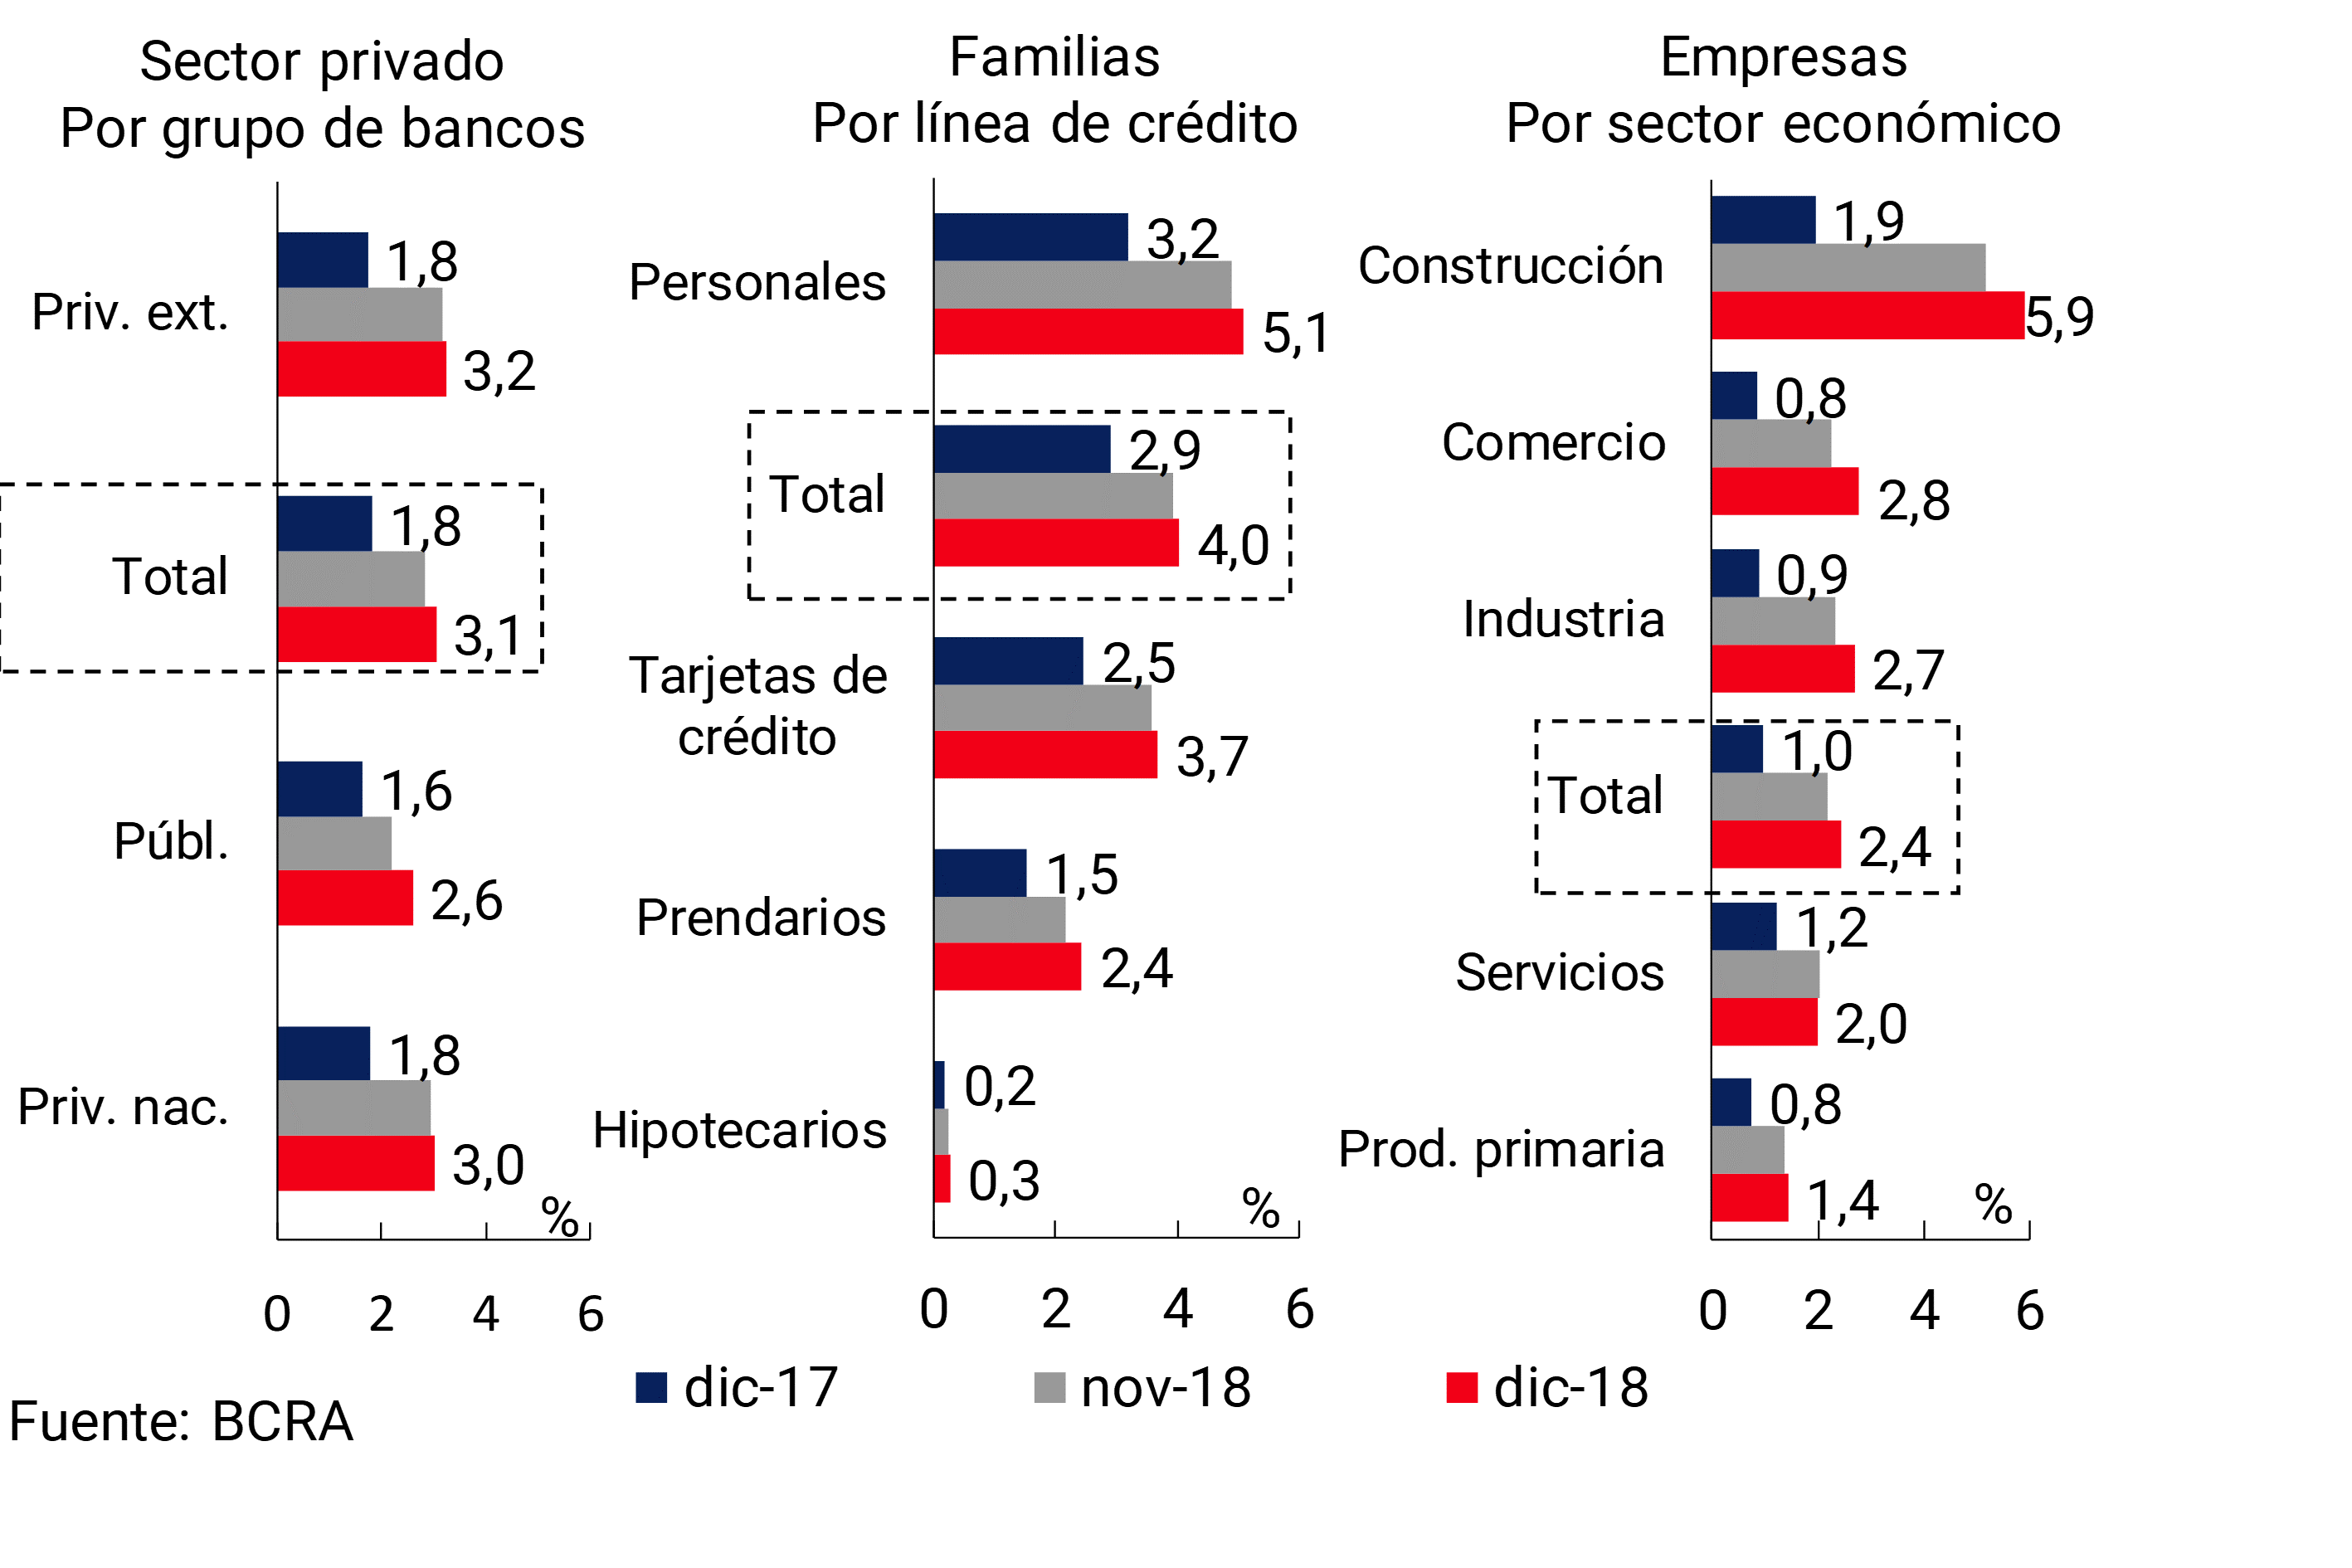
In December, non-performing loans to households stood at 4% of the total portfolio, increasing 0.1 p.p. compared to November’s figure and 1.1 p.p. compared to the level of a year ago (see Chart 13). The year-on-year performance was driven by consumer lines (personal and cards) and, to a lesser extent, by pledges. On the other hand, the NPL ratio for mortgage loans to households closed the year at a level equivalent to 0.3%, slightly above the figure at the end of 2017. In particular, the irregularity of mortgage loans in UVA was low in December at around 0.19% of the total.
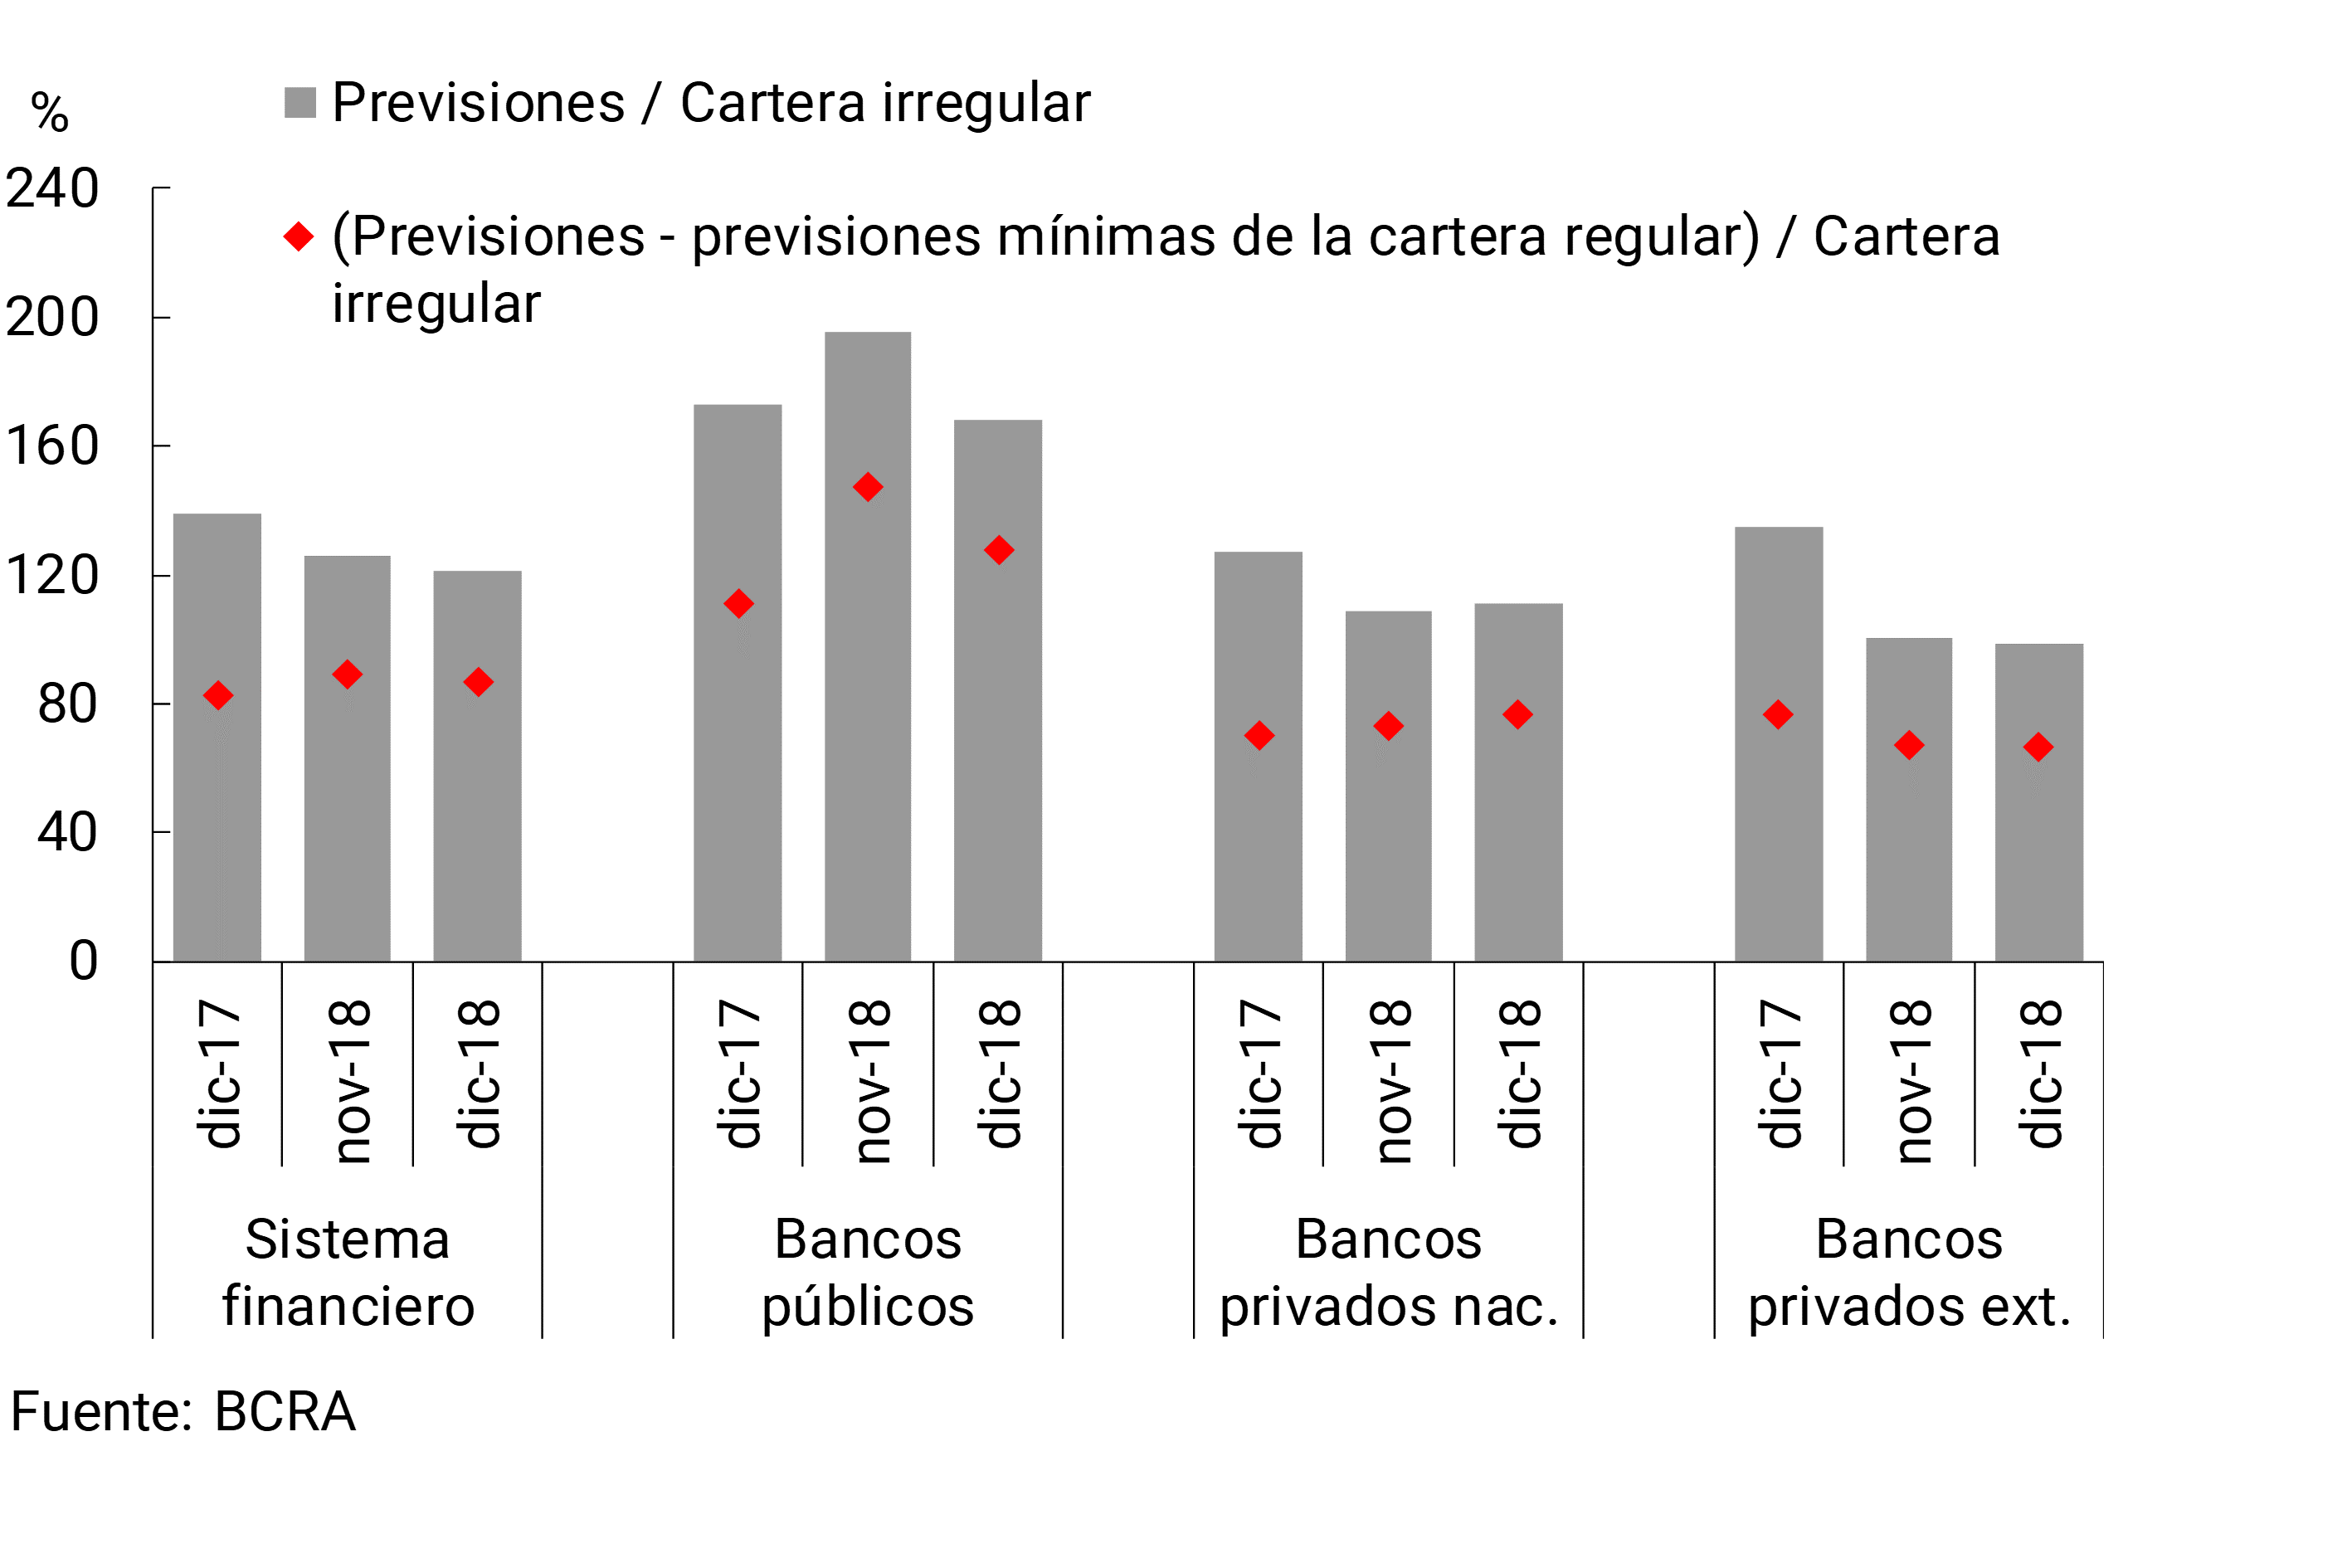
The banks as a whole closed 2018 with high levels of forecasting. If the estimate of the minimum forecasts attributable to the regular portfolio is excluded, the forecast for the aggregate financial system would stand at 87% of the portfolio in an irregular position in the month (see Chart 14). The total balance of accounting forecasts represented 121% of the private sector’s irregular portfolio in December, slightly below last month’s value and the level of a year ago.
Figure 14 | Forecasting of the Financial System
In December, the financial system’s equity exposure to the private sector increased by 0.3 p.p. compared to the value observed in November, reaching 1.6%. 19 The monthly performance was mainly explained by the increase in the balance of financing to this sector in an irregular situation. In a year-on-year comparison, this ratio was slightly above the level at the end of 2017. Meanwhile, the gross exposure of the aggregate of banks to the public sector stood at 10.4% of total assets in December, 0.5 p.p. less than the previous month’s figure (+2 p.p. y.o.y.). The fall in the period was driven by national private banks and by public banks. In addition, the financial system’s exposure to this sector net of the balance of public sector deposits stood at -5.2% of total assets in the period (-0.4 p.p. y.o.y.).
V. Solvency
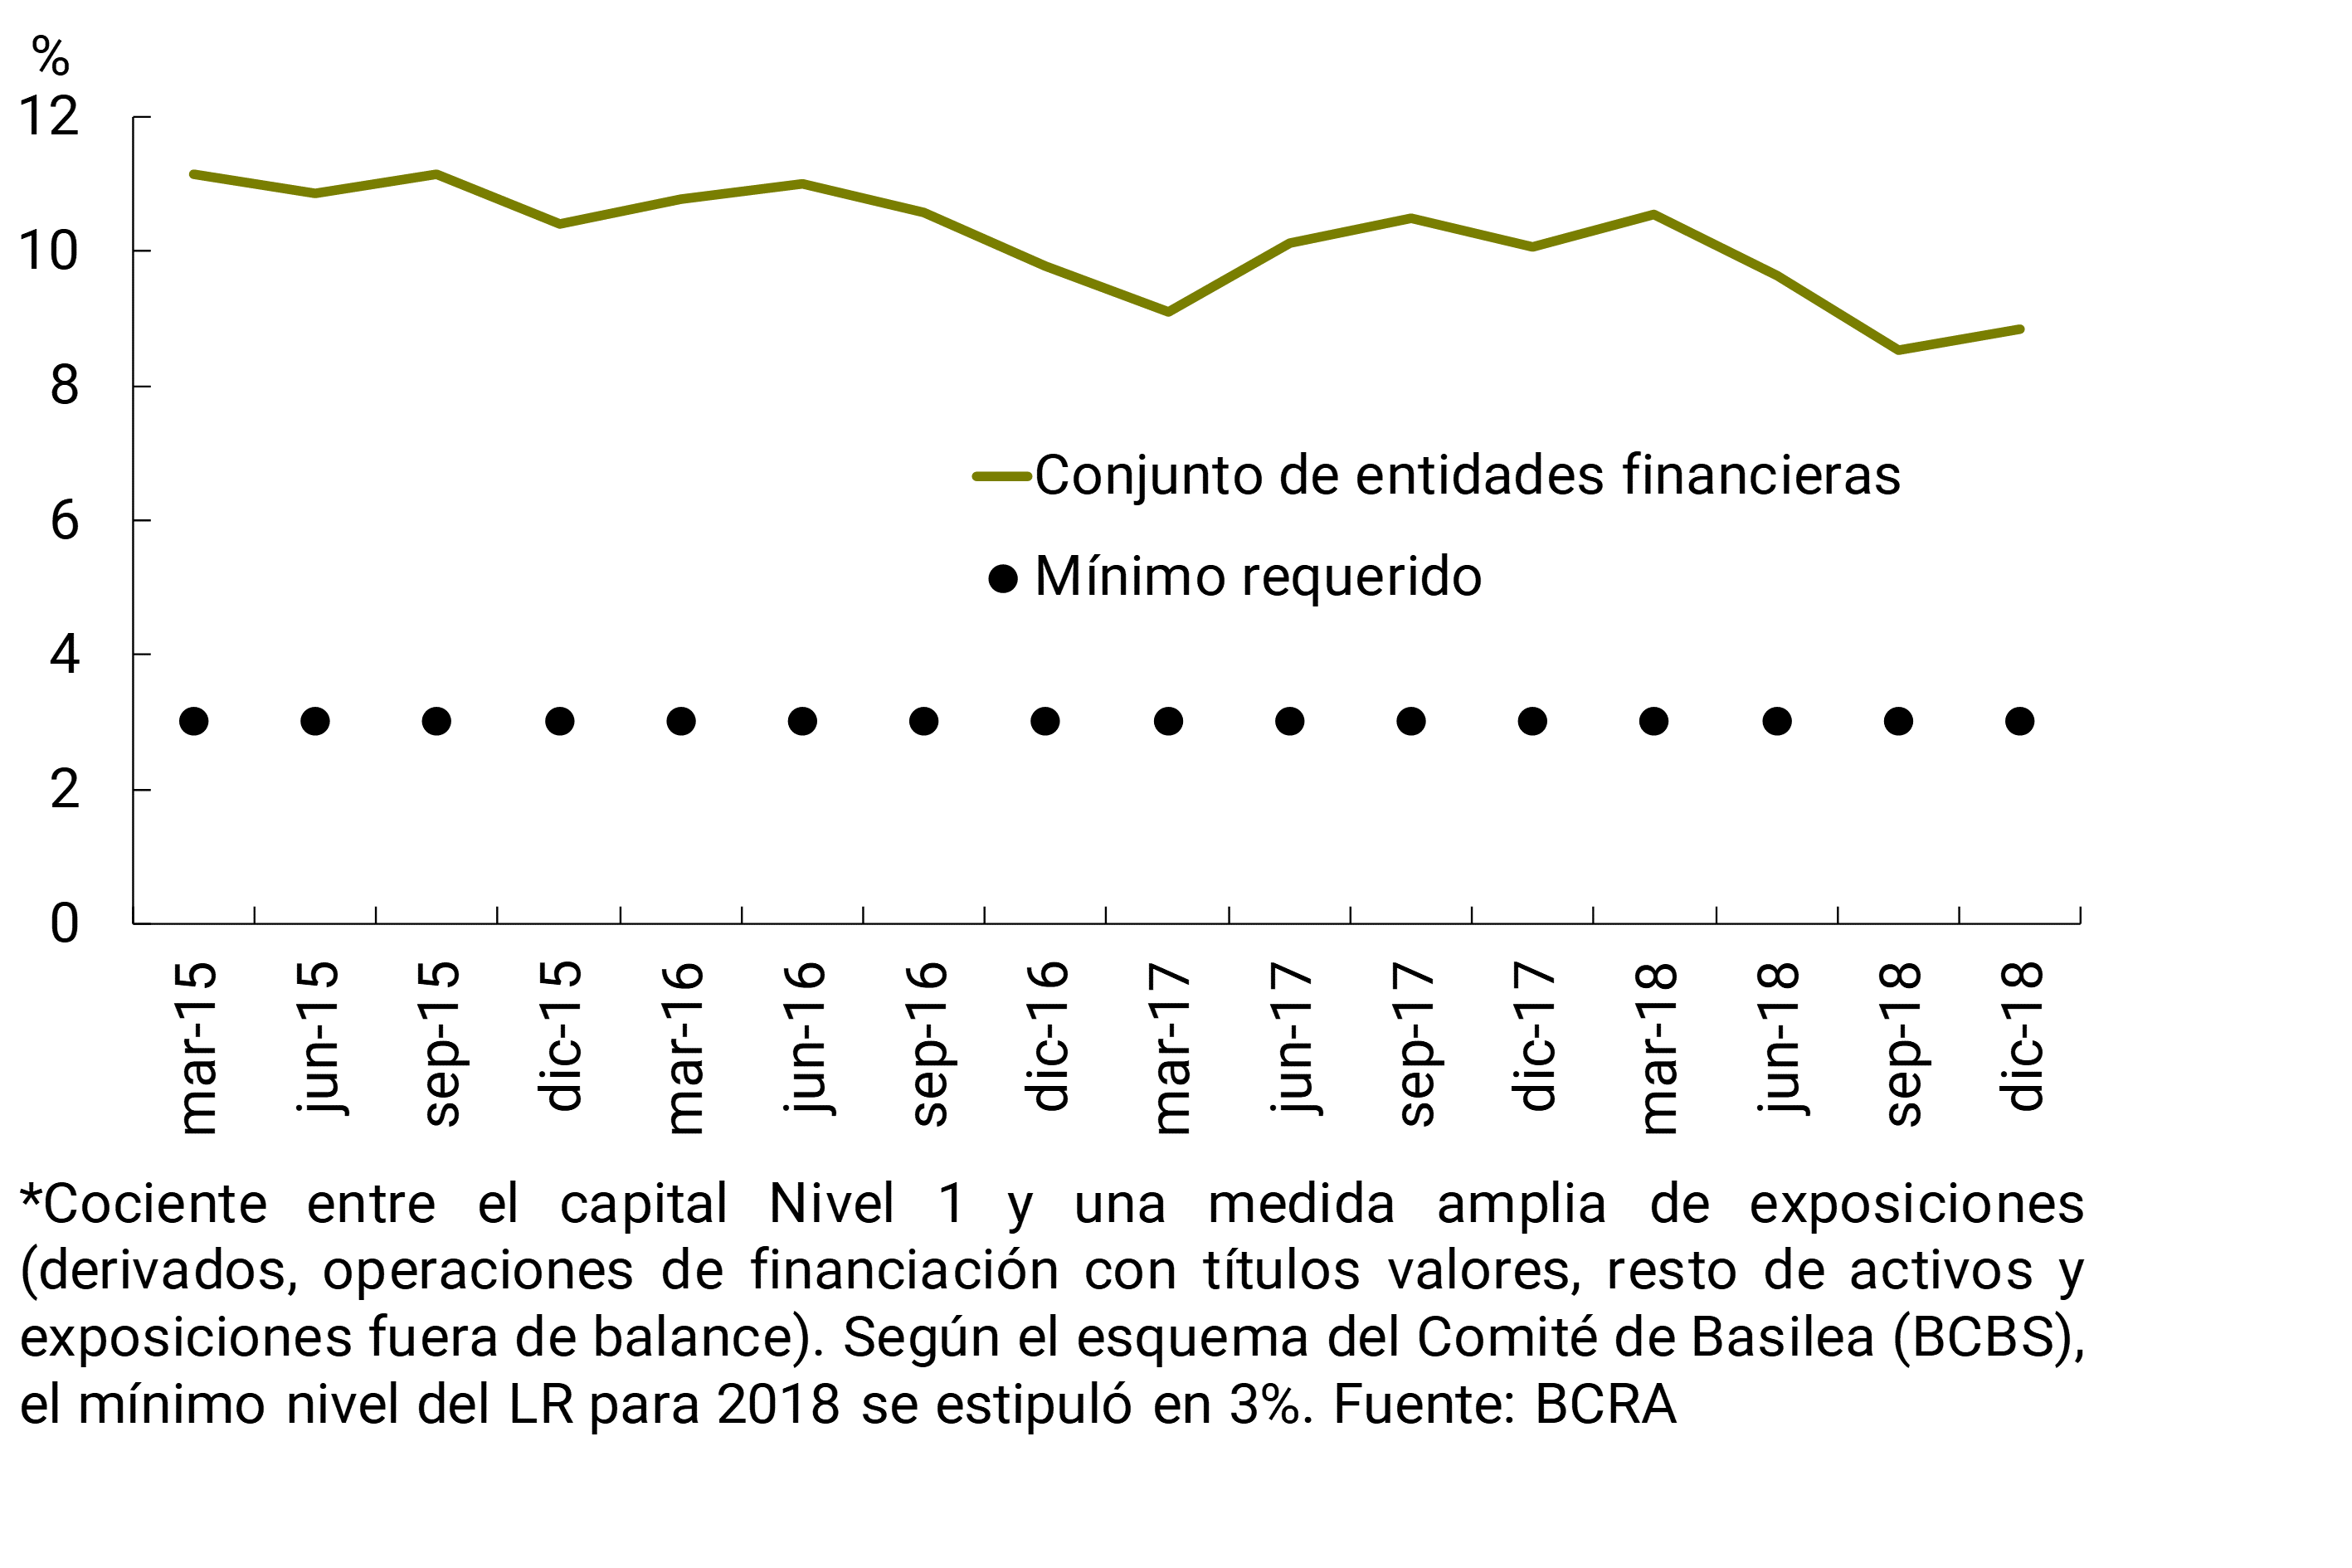
The financial system closed 2018 with relatively high values for solvency indicators (see Chart 15). The integration of regulatory capital represented 15.8% of risk-weighted assets (RWA) at the aggregate level in December, slightly higher than last November and at the end of 2017. Tier 1 capital continued to account for nearly 90% of total integration. 20 On the other hand, excess capital integration totaled 85% of the regulatory requirement. All bank groups had excess capital integration over the minimum prudential requirement. The leverage of all financial institutions continued to be moderate. The leverage ratio (as recommended by the Basel Committee) reached 8.8% in December, far exceeding the required minimum of 3% (see Chart 16).
Figure 15 | Integration and Excess Regulatory Capital
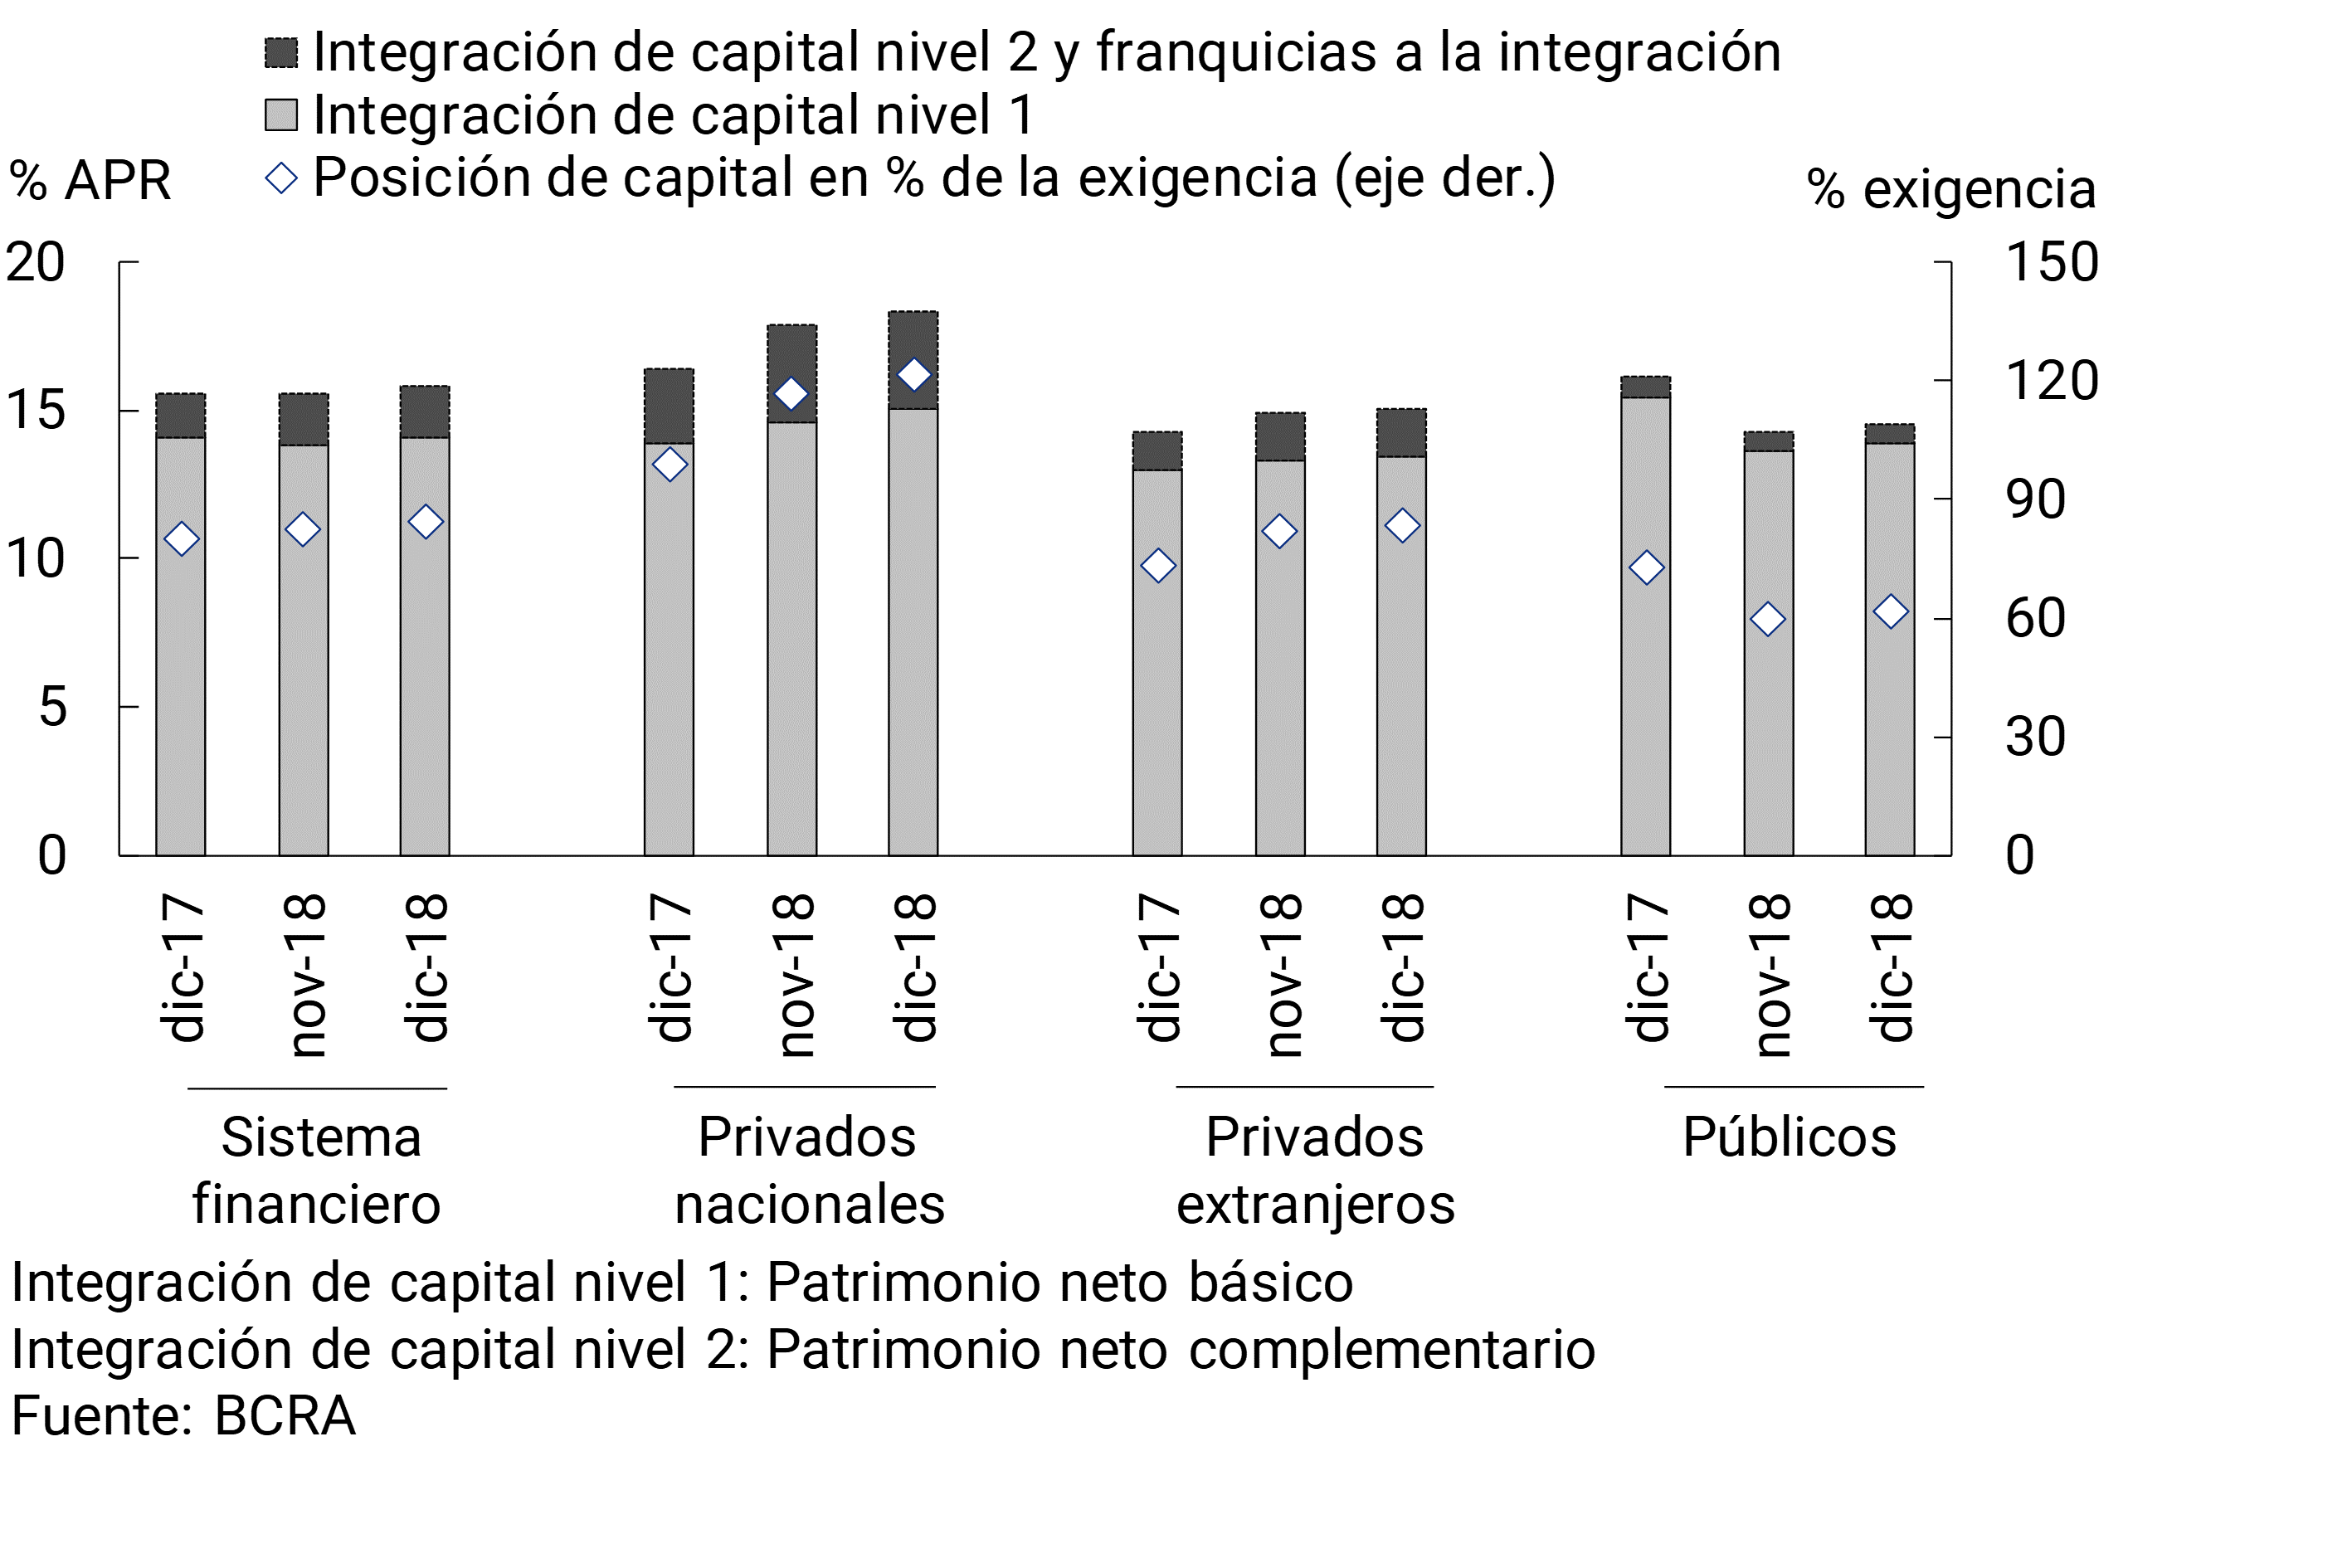
Figure 16 | Leverage Ratio* (LR)
In December, the financial system accrued nominal monthly gains that represented 5.1% of assets (ROA) (+2.7 p.p. compared to November, see Chart 17). Monthly ROA reached 6%y. in the group of private banks and 4.1%y. in the group of public banks. In all of 2018, the financial system recorded annual nominal profits equivalent to 3.9% of assets and 34.4% of equity, registering a nominal variation compared to 2017 of 1.1 p.p. of assets and 11.1 p.p. of net worth.
21
Figure 17 | Profitability by Group of Financial Institutions
In December, the financial margin of the entities as a whole reached 13.5% of assets (see Chart 18). This concept increased in nominal terms by 3.6 p.p. of assets compared to November, mainly due to higher gains from securities and lower interest expenses, effects that were partially offset by the decrease in gains due to differences in quotation and CER adjustment and lower interest income. 22 Over the course of the year, the financial margin of the banks as a whole reached 10.9% of assets, 0.8 p.p. above the level of 2017. Considering the group of private banks, in December the financial margin totaled 13% y/y of assets, 0.5 p.p. more than in November (in 2018 the financial margin of private banks totaled 12.1% of assets, increasing 0.8 p.p. year-on-year).
Figure 18 | Income Table – Financial System
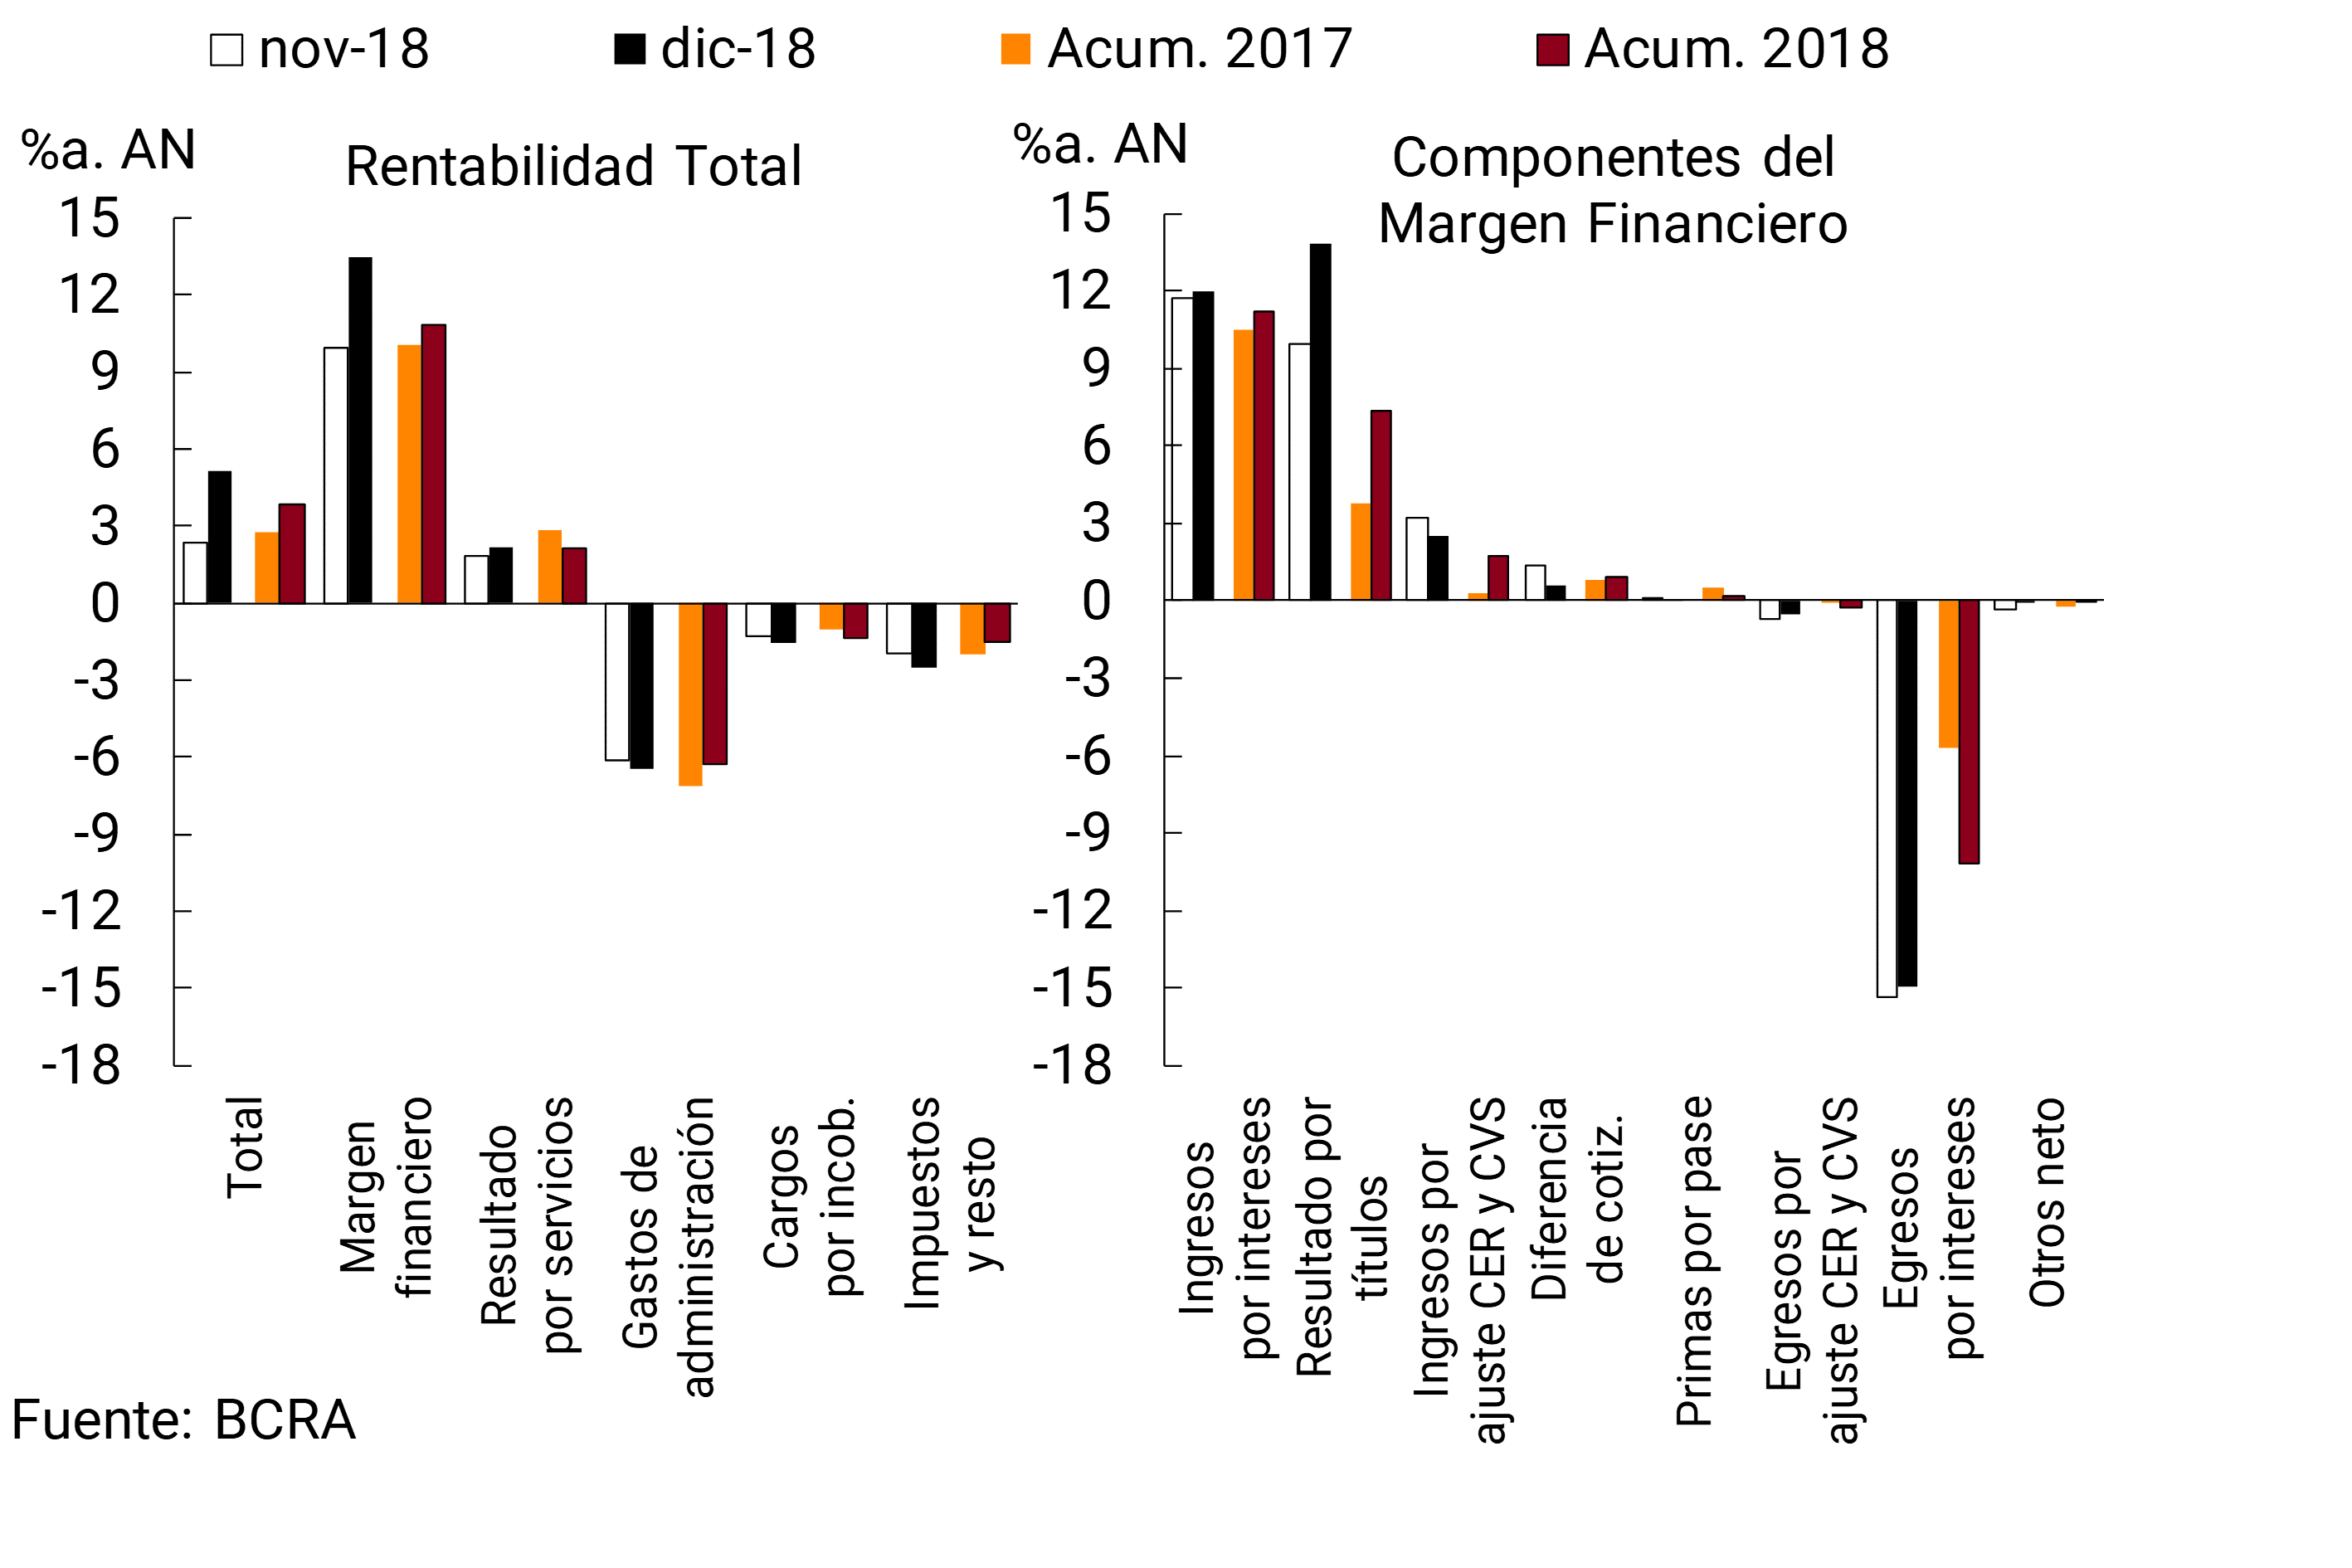
Results by services of the financial system represented 2.2% of assets in the month, increasing 0.4 p.p. compared to November (see Chart 18). In the year to date, net income from services stood at 2.2% of assets, 0.7 p.p. less than in 2017.
Aggregate bad debt charges increased 0.3 p.p. of assets in the month, to 1.5% y/y in December (see Chart 18). In 2018, bad debt charges reached 1.3% of assets, 0.3 p.p. more than in 2017 in the context of the increase in credit irregularity evidenced in the period.
Administrative expenses of the financial system increased by 0.4 p.p. of assets in December, to 6.5%a. (see Graph 18). In 2018, administrative expenses totaled 6.3% of assets, being 0.9 p.p. lower than those recorded in 2017.
Regulations
Summary of the main regulations of the month, implemented by the BCRA, related to financial intermediation activity. The date of publication of the standard is taken as a reference.
Communication A6610 – 14/12/18 | Adjustments are introduced in the rules on “Savings, salary and special account deposits”, effective as of 01/02/19. The limit for making credits in the accounts of “Savings Bank for the payment of social assistance plans or programs” is increased to the amount equivalent to five times the Minimum, Vital and Mobile Wage (SMVM) per calendar month. Likewise, the accreditation of all types of loans in this type of account is admitted. The scope of the types of loans allowed to be credited to the “Salary/Social Security Account” is expanded. The closing period of the “Salary Account” is modified, increasing from 60 calendar days to 180 from the date of the last credit of funds or the communication of closure of the employer or worker, as appropriate. It is provided that when the employment relationship ends and the salary account continues to be active, generating the loss of benefits and/or the collection of commissions associated with additional services previously contracted by the worker, the latter must be expressly informed prior to the accrual of the eventual commission.
Communication A6616 – 20/12/18 | The rules on “Minimum Cash” are adapted by establishing differentiated demand rates depending on:
i) Entities included in Group “A” and those that are branches or subsidiaries of foreign banks classified as systemically important (G-SIB) not included in that group. A minimum cash requirement is established for demand deposits of 30% to be integrated in pesos, 5% integrable in BOTES 2020 and 10% integrable in LELIQ. For fixed-term deposits of up to 29 days of residual term, these percentages are set at 17%, 5% and 13%, respectively. These requirements are reduced as the term of the deposits increases.
ii) Other financial institutions. A cash requirement is available in pesos of 20% for demand deposits, 14% for deposits with a residual term of up to 29 days, 10% for deposits with a residual term of between 30 and 59 days, 5% for deposits with a residual term of between 60 and 89 days and 0% for terms longer than 90 days. and the possibility of integration into BOTE 2020 is annulled.
These measures are effective as of 02/01/19 for the first group of entities, and as of 01/01/19 for the second group. On the other hand, the requirement of the minimum daily integration is reduced from 70% to 50% in the event of having registered a deficiency in its integration in the previous month. The possibility of integrating with LELIQ/NOBAC the increase in the balances recorded in certain term placements with respect to the balance as of 09/30/18 is null and void.
References
1 This Section includes those measures adopted since the date of publication of the last “Report on Banks”, January 16, 2019 to date.
2 Communication A6647
3 Communication A6644.
4 Communication A6645.
5 As of 2018, entities began to present their balance sheets in accordance with the local application of International Financial Reporting Standards (IFRS). It is estimated that if the equity effect of the application of IFRS “for the first time” in certain areas is to be purified, bank assets would have grown 8.6% in real terms in 2018.
6 The main origins and uses of resources were influenced by seasonal issues typical of the end of the year and certain specific movements. For more details see section III. Deposits and Liquidity of this Report.
7 Differences in balance sheet balances are considered for the estimation of cash flows.
8 Idem, previous note.
9 In currency of origin.
10 In December, certain one-off operations linked to deposits in the public and private sectors were recorded, such as adjustments to pensions and social benefits; as well as exceptional payments that covered some salaried employees.
11 Not adjusted for seasonal factors.
12 Includes principal adjustments and accrued interest.
13 Variation in currency of origin.
14 Includes principal adjustments and accrued interest.
15 Information extracted from the Central Debtors (includes both national and foreign currency). Loans to residents abroad are not included. Adjustments in principal and accrued interest are considered. Business financing is defined here as that granted to legal entities and commercial financing granted to individuals. On the other hand, loans to families are considered to be those granted to individuals, unless they are for commercial purposes.
16 Idem, previous note.
17 Adjustments to principal and accrued interest are considered.
18 Includes capital adjustments due to the evolution of the CER.
19 Equity exposure to the private sector is defined as the ratio of the private sector’s irregular portfolio net of forecasts associated with the private sector’s irregular portfolio and the consolidated net worth of the aggregate financial system.
20 Tier 1 capital is the capital with the greatest capacity to face unexpected losses, composed mainly of ordinary shares and accumulated earnings.
21 In 2018, private banks accumulated a nominal ROA of 4.3% (+1 p.p.i.a.) and a nominal ROE of 35.9% (+9.3 p.p.i.a.), and public banks a nominal ROA of 3.4% (+1.4 p.p.i.a.) and a nominal ROE of 33.7% (+15.1 p.p.i.a.).
22 Most of the increase in securities gains was due to an accounting adjustment made by a bank of magnitude.
Glossary
%a.: annualized percentage.
% YoY: Year-on-year percentage.
Liquid assets: availabilities (integration of “minimum cash” in current accounts at the BCRA and in special guarantee accounts and other concepts, mainly cash in banks and correspondent offices) plus the net credit balance for transfer operations of financial institutions against the BCRA using LEBAC and NOBAC.
Consolidated assets and liabilities: those arising from deducting transactions between entities in the system.
Net Assets (NA): Assets and liabilities are net of accounting duplications for pass-through, forward and spot transactions to be settled.
APR: Total Risk Weighted Assets.
BCBS: Basel Committee on Banking Supervision (BCBS).
Irregular portfolio: portfolio in situation 3 to 6, in accordance with the “Classification of Debtors” regime.
Credit to the public sector: Position in public securities (without LEBAC or NOBAC) + Loans to the public sector + Compensation to be received + Debt securities and Certificates of participation in financial trusts (with underlying public securities) + Miscellaneous credits to the public sector.
Credit to the private sector: loans to the non-financial private sector including accrued interest and CER and CVS adjustment and leasing.
Contribution differences: Results from the monthly update of assets and liabilities in foreign currency. The item also includes the results originated by the purchase and sale of foreign currency, which arise as a difference between the agreed price (net of the direct expenses originated by the operation) and the book value.
Miscellaneous: miscellaneous gains (including, but not limited to, gains on permanent interests, recovered loans and unaffected provisions) minus miscellaneous losses (including, but not limited to, losses on permanent interests, loss on the sale or impairment of goods in use and amortization of business keys).
Equity exposure to counterparty risk: irregular portfolio net of provisions in terms of equity.
Administration expenses: includes remunerations, social charges, services and fees, taxes and amortizations.
IEF II-17: BCRA Financial Stability Report.
IPCBA: Consumer Price Index of the City of Buenos Aires.
CSF: Liquidity Coverage Ratio (LCR).
LEBAC and NOBAC: bills and notes issued by the BCRA.
LELIQ: BCRA liquidity bills.
LR: Leverage Ratio (LR).
Financial margin: Income minus financial expenses. It includes interest and securities earnings, CER and CVS adjustments, exchange rate differences and other financial results.
Mill.: Million or million, as appropriate.
IFRS: International Financial Reporting Standards.
ON: Negotiable Obligations.
ORI: Other comprehensive results.
OS: Subordinated Obligations.
Other financial results: rental income from financial leases, contribution to the deposit guarantee fund, interest on availabilities, charges for loan depreciation, premiums for the sale of foreign currency and other unidentified items.
PN: Net Worth.
p.p.: percentage points.
SME: Small and Medium Enterprises.
Consolidated profit: Results from permanent holdings in local financial institutions are eliminated. Available since January 2008.
Income from securities: includes results from public securities, temporary shares, negotiable obligations, subordinated obligations, options and other credits for financial intermediation. In the case of public securities, it includes the results accrued in terms of income, differences in share price, exponential increase based on the internal rate of return (IRR) and sales, in addition to the charge for forecasts for the risk of impairment.
Interest income: interest charged minus interest paid for financial intermediation, following the accrual criterion (balance sheet information) and not what is received. It includes interest on loans and deposits of government securities and premiums for passes.
Result for services: commissions charged minus commissions paid. It includes fees related to obligations, credits, securities, guarantees granted, the rental of safe deposit boxes and foreign and exchange operations, excluding in the latter case the results from the purchase and sale of foreign currency, the latter being accounted for in the “Differences in quotation” account. Expenses include commissions paid, contributions to the ISSB, other contributions for income from services and charges accrued from the gross income tax.
ROA: Final result as a percentage of net assets. In the case of referring to accumulated results, the average of the NA for the reference months is considered in the denominator.
SWEE: Final result as a percentage of equity. In the case of referring to accumulated results, the average net worth for the reference months is considered in the denominator.
RPC: Computable Patrimonial Liability. For more details, see Consolidated Text “Minimum Capitals of Financial Institutions”.
TNA: Annual nominal rate.
US$: US dollars.
UVA: Unit of Purchasing Value.
ICU: Housing Units.
Share on


