Summary
• Financial intermediation activity with the private sector continued to grow in August. The real balance of credit to the private sector in pesos on the balance sheet of all financial institutions increased 0.7% in the month (56% YoY), with a greater relative dynamism of loans with real collateral. Within this last segment, it is estimated that during the period some 4,200 new mortgage loan debtors were incorporated, accumulating 38,000 in the last 12 months. The balance of financing to the private sector in foreign currency increased 10.2% in the month (160% YoY) – in the currency of origin.
• In August, the real balance of private sector deposits in pesos fell 0.9% compared to July (however, it grew 15.5% YoY). This monthly performance was mainly explained by demand deposits, while time deposits increased in real terms in the period. The balance of private sector deposits in foreign currency decreased 0.6% in August (accumulating an increase of 66.9% YoY) —in source currency—.
• The non-performing loan ratio to the private sector stood at 3.7% in the month, 0.5 p.p. above July’s record. The NPL indicator for loans to households reached 6.6%, while the irregularity ratio for financing to companies stood at 1.4%. The total forecast balance of the financial system represented 108% of the portfolio in an irregular situation and 4% of the total credit balance to the private sector.
• The liquidity ratio in pesos, which includes only availabilities, stood at 17.9% of deposits in national currency at the aggregate level in August, increasing 3 p.p. in the month within the framework of the modifications implemented on the minimum effect regulations. The broad liquidity indicator in pesos totaled 40% of deposits in the same denomination in the period, down 3.6 p.p. compared to July’s value. Regarding liquidity in foreign currency, in August the aggregate ratio stood at 55.6% of deposits arranged in that currency (-3.5 p.p. monthly).
• In August, capital integration (RPC) totaled 26.5% of risk-weighted assets (RWA) of the financial system as a whole, 0.4 p.p. less than last month. The excess capital (RPC net of the minimum regulatory requirement) with respect to the regulatory requirement totaled 227% in the month for the aggregate of entities (-5.6 p.p. compared to July). Regulatory capital represented 46.6% of the balance of financing to the private sector net of forecasts (-0.8 p.p. in the month), remaining above the average of the last 10 years.
• In the last 12 months to August, the entities as a whole presented positive results – comprehensive and measured in homogeneous currency – equivalent to 0.7% of assets (ROA) and 2.9% of equity (ROE). Both indicators were reduced in a year-on-year comparison.
I. Financial intermediation activity
In August, the financial intermediation activity of all entities with the private sector grew at a rate that has been moderating in recent months in the segment in national currency. Taking into account the most important variations (in homogeneous currency) of the balance sheet in pesos of the financial system, the main source of monthly funding originated through the public sector, either due to the reduction of bank financing or the increase in its deposits. The main applications of resources in pesos during August were explained by the increase in liquid assets1, credit to the private sector and the reduction in deposits in this sector. In relation to the foreign currency segment, liquidity decreased during the period, with the main counterpart in the increase in financing to the private sector.
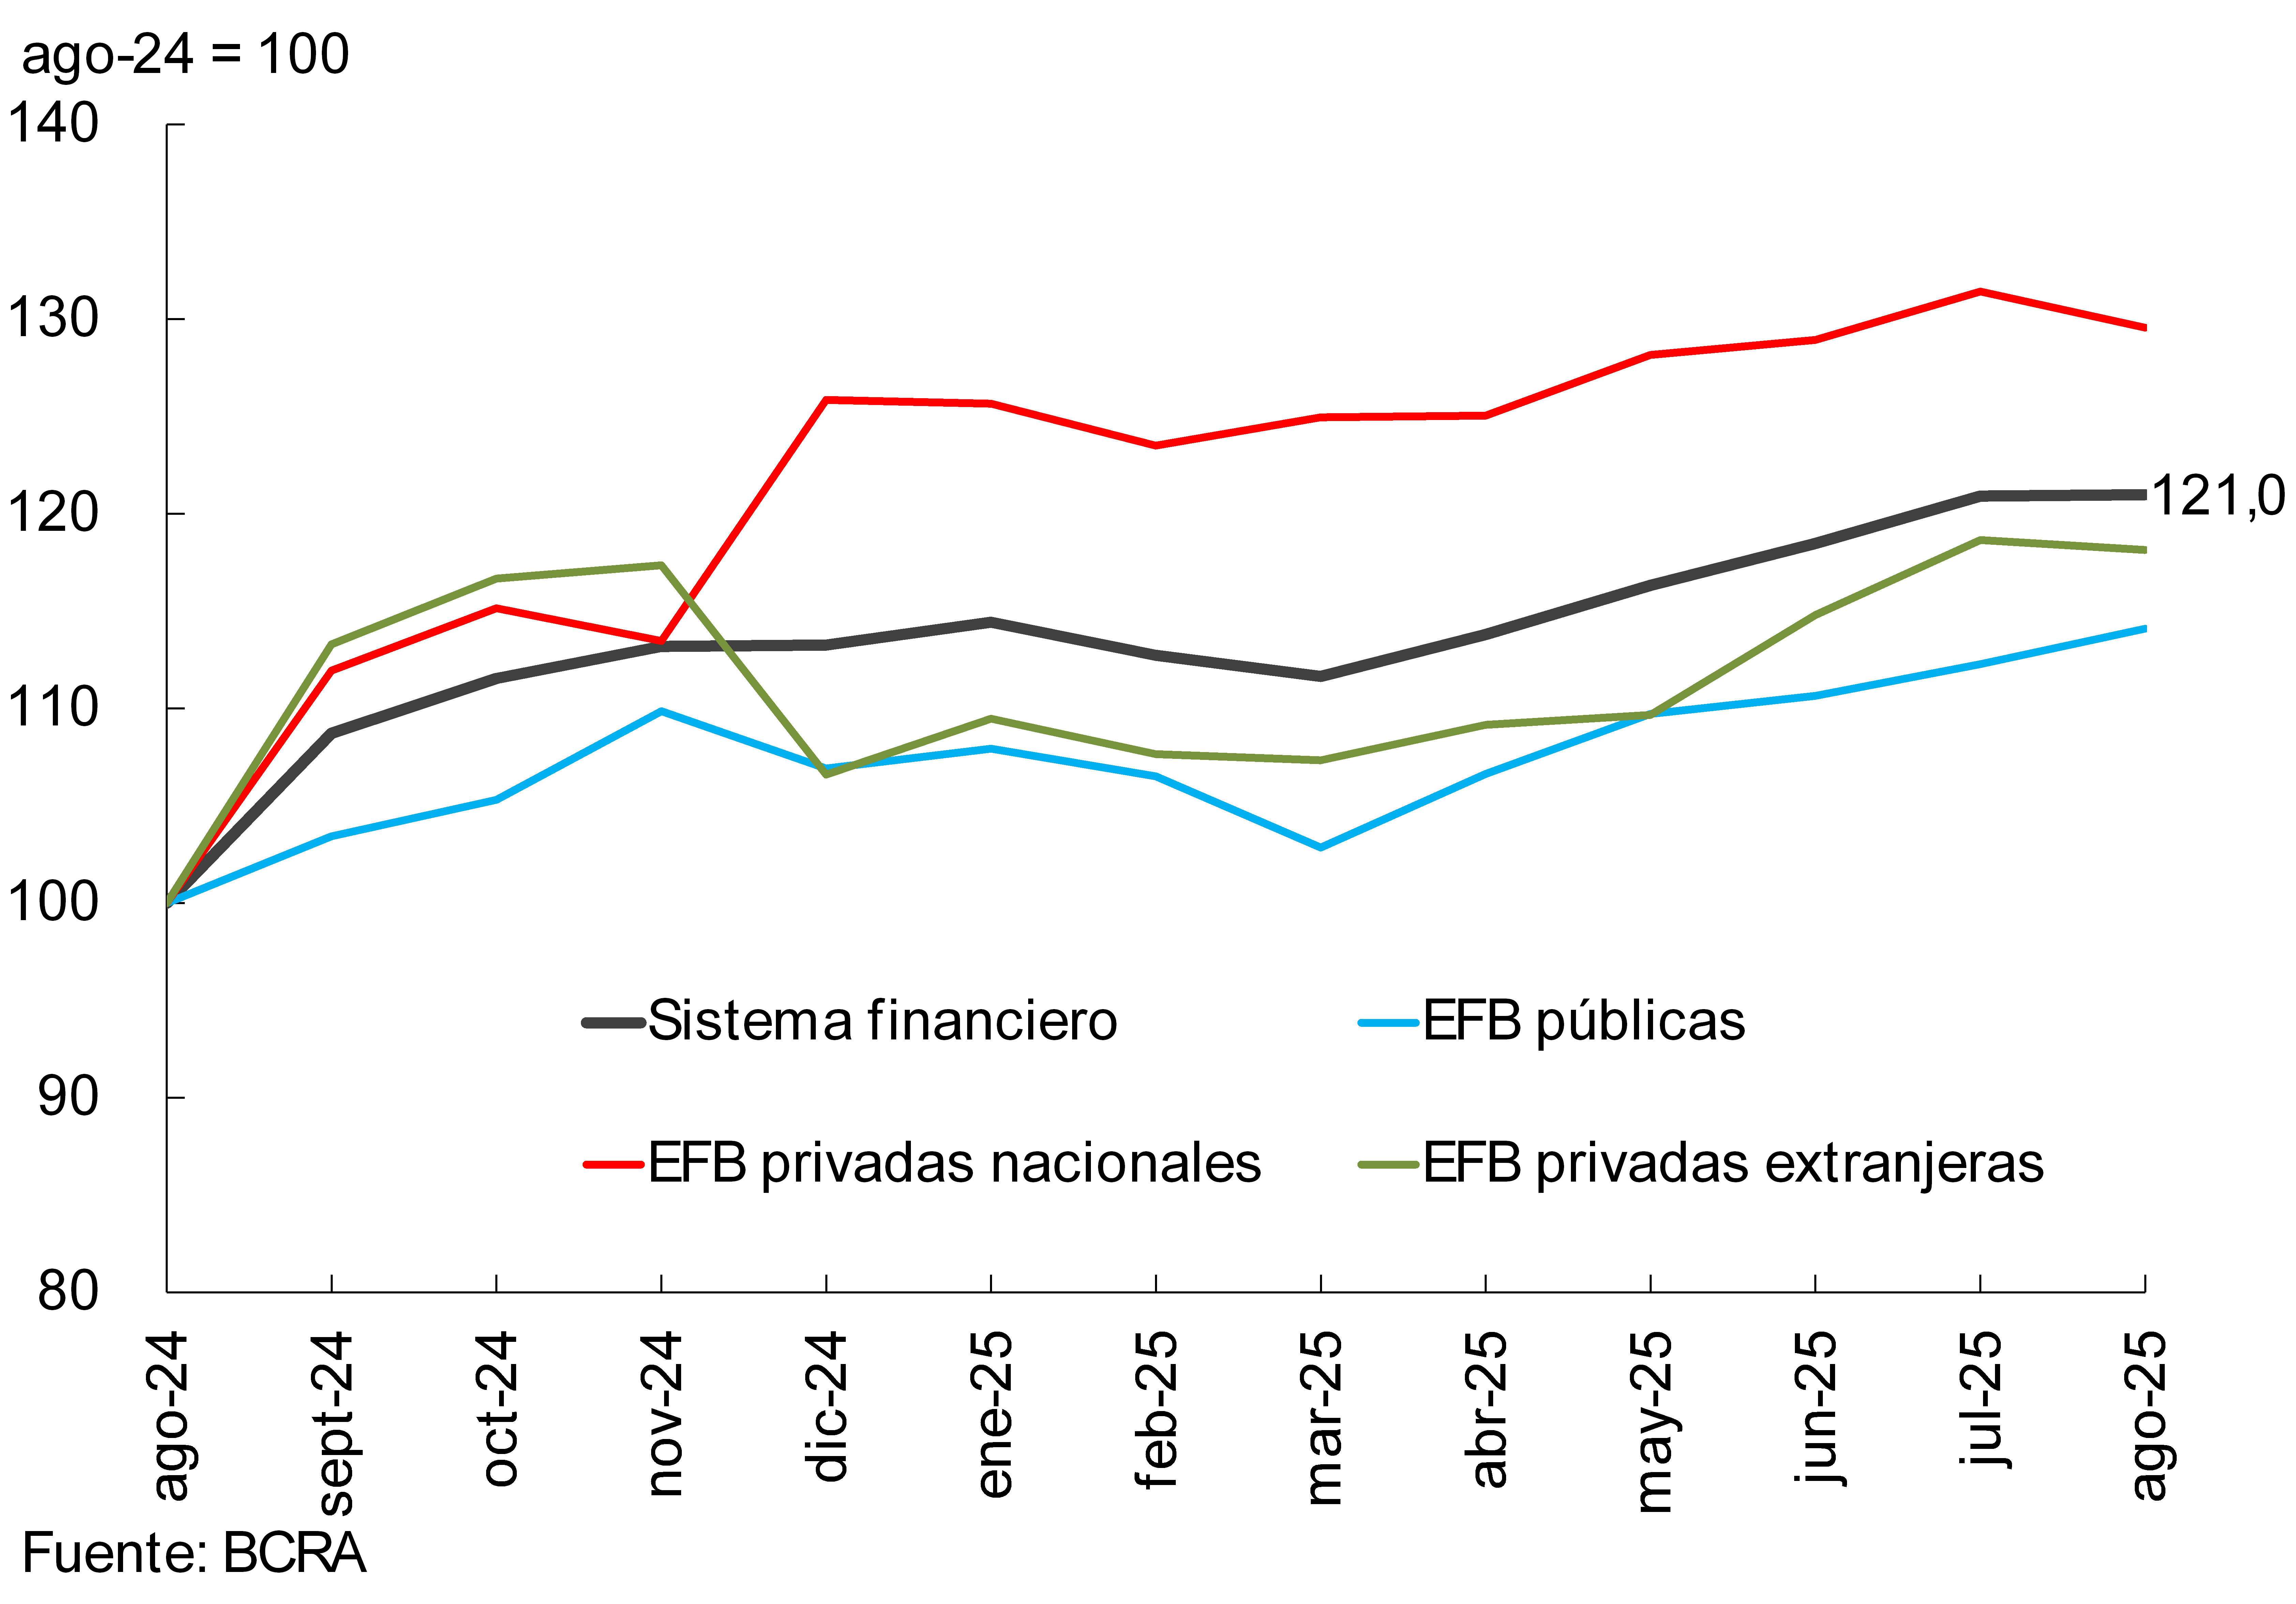
In August, the real balance of financing to the private sector in pesos increased 0.7%, with greater relative dynamism in public banks and EFNBs. Loans with real collateral registered the highest relative monthly growth (2.7% in real terms compared to July, see Graph 1)), followed by consumer lines (0.7% in real monthly terms). For its part, the commercial segment fell in the period (-2.8% in real terms). In a year-on-year comparison, the real balance of credit to the private sector in pesos accumulated an increase of 56%, with increases in all credit assistance and groups of financial institutions.
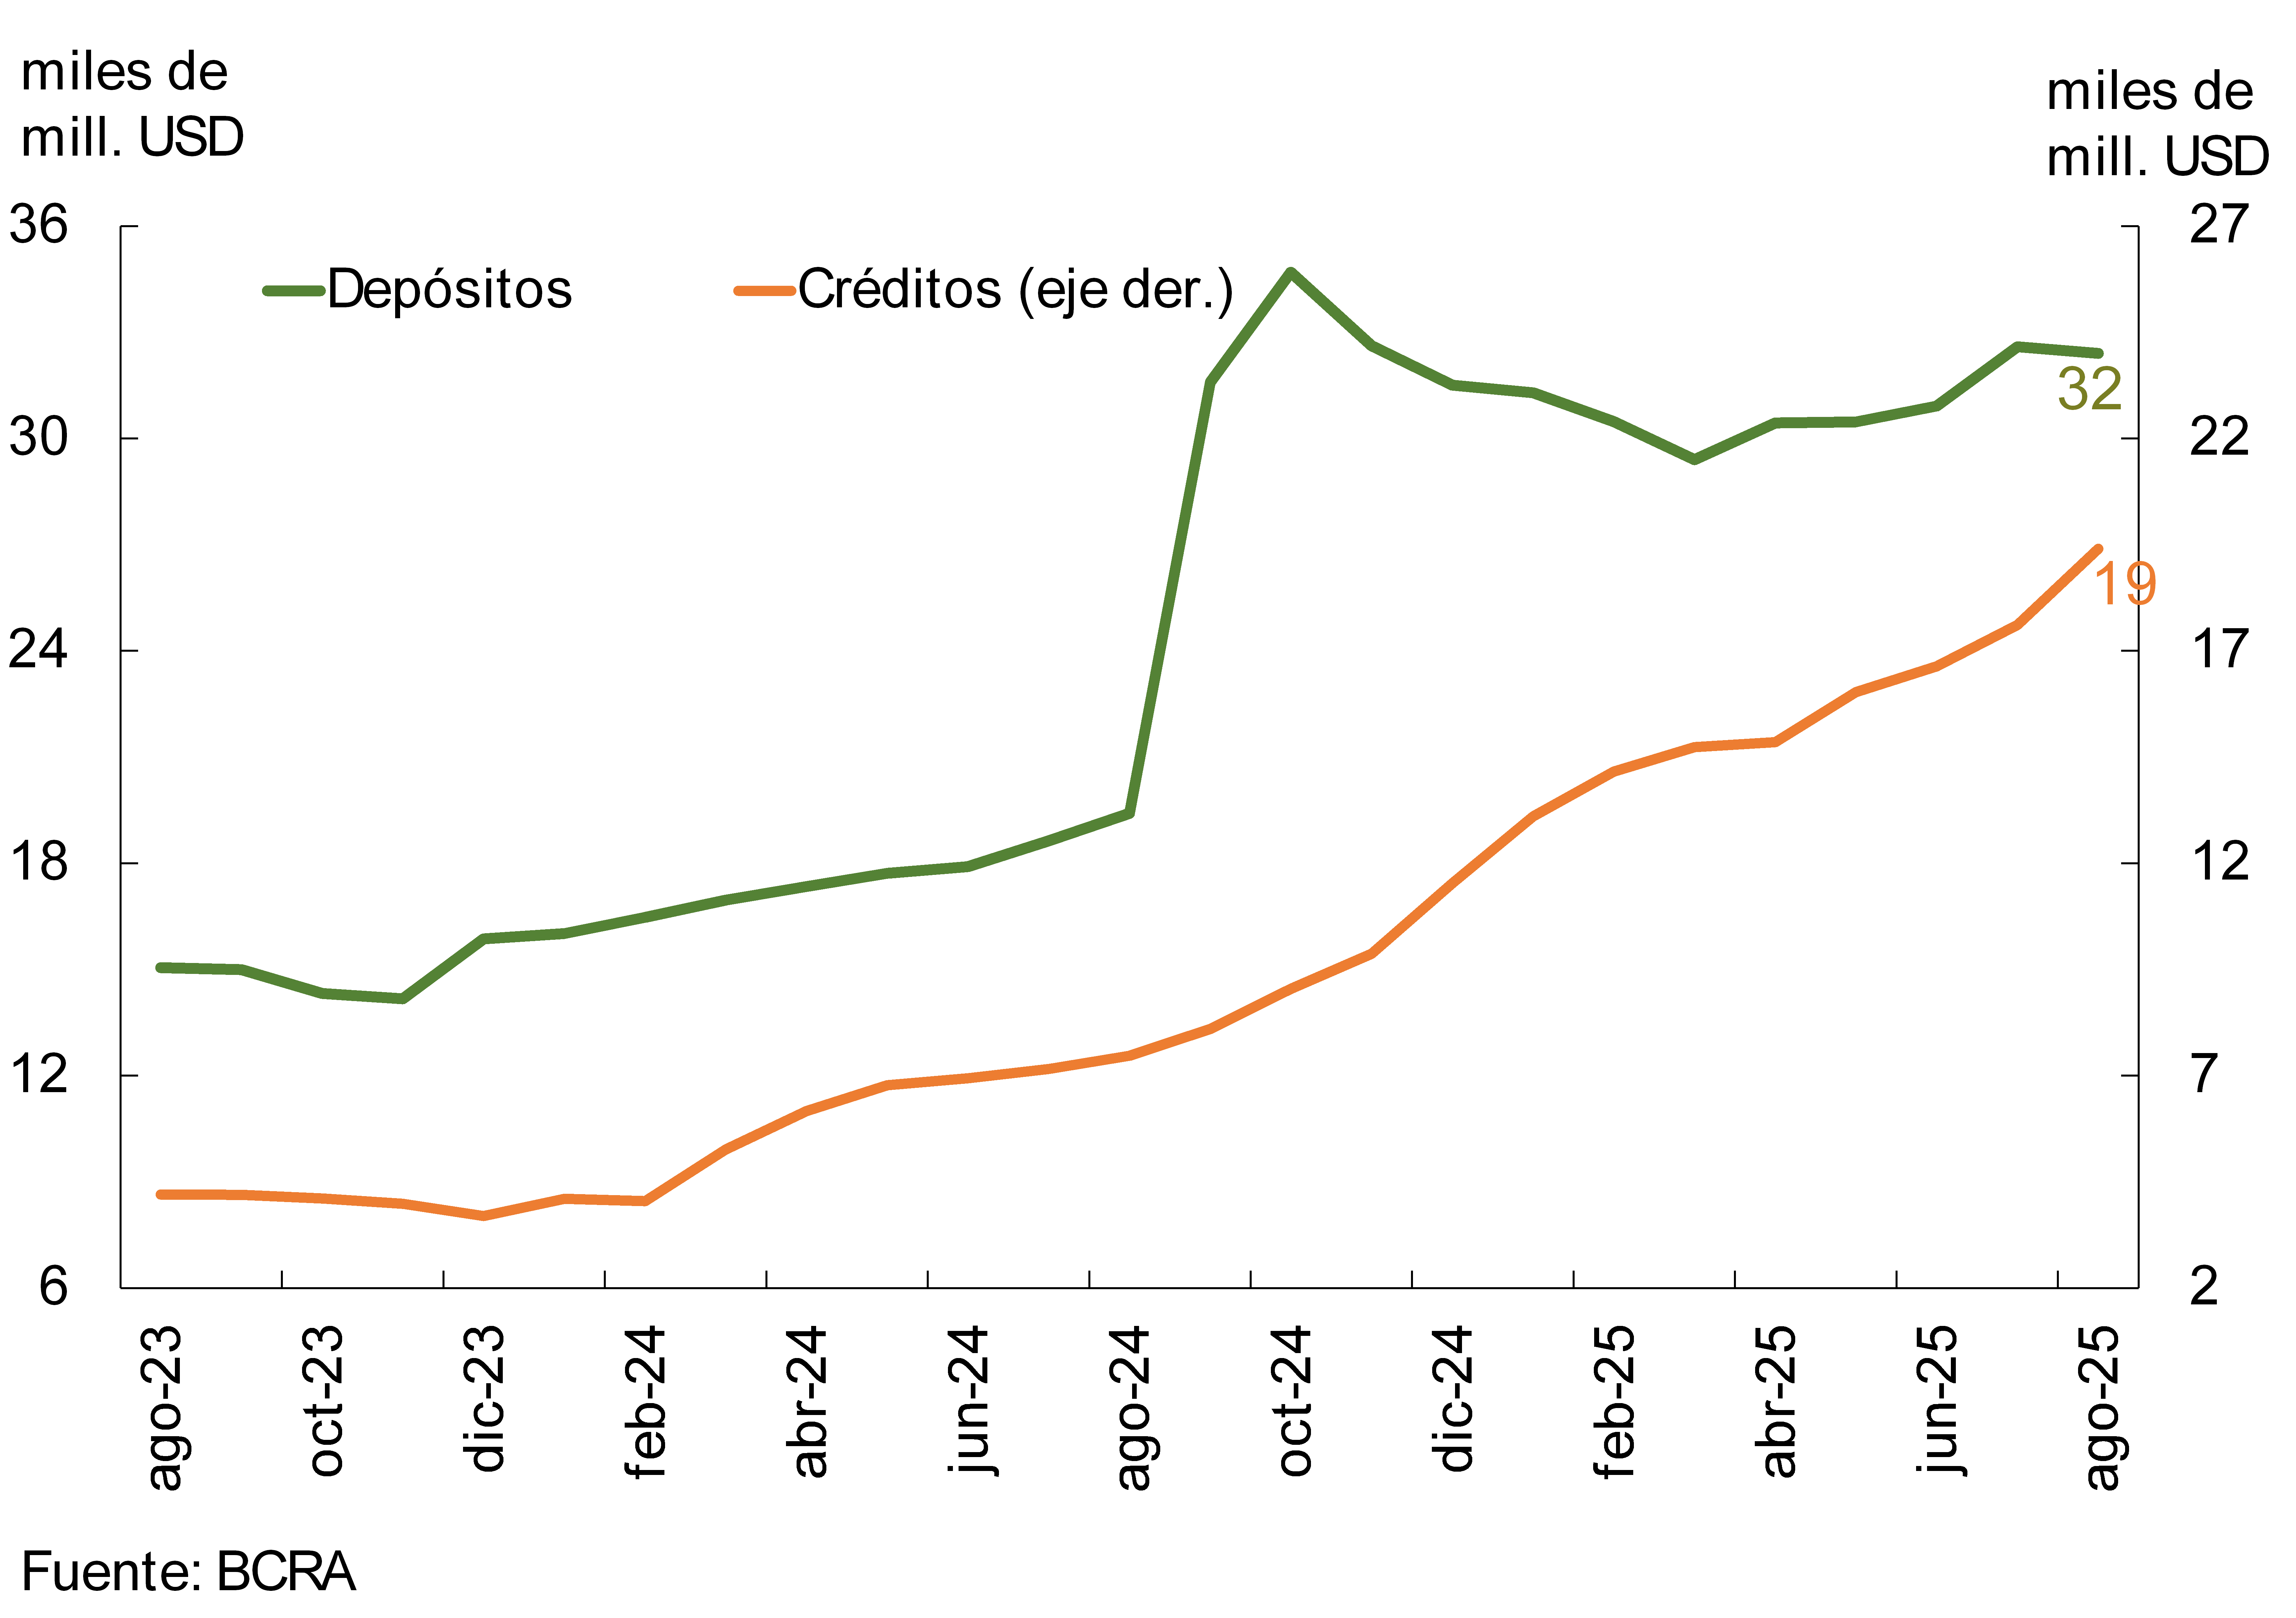
In August, the balance of credit to the private sector in foreign currency increased 10.2% compared to the previous month and 160% in a year-on-year comparison (measured in currency of origin) (see Graph 2). The performance, both monthly and year-on-year, was mainly explained by documents and export pre-financing.
Graph 1 | Real balance of credit to the private sector in pesos*
Monthly changes
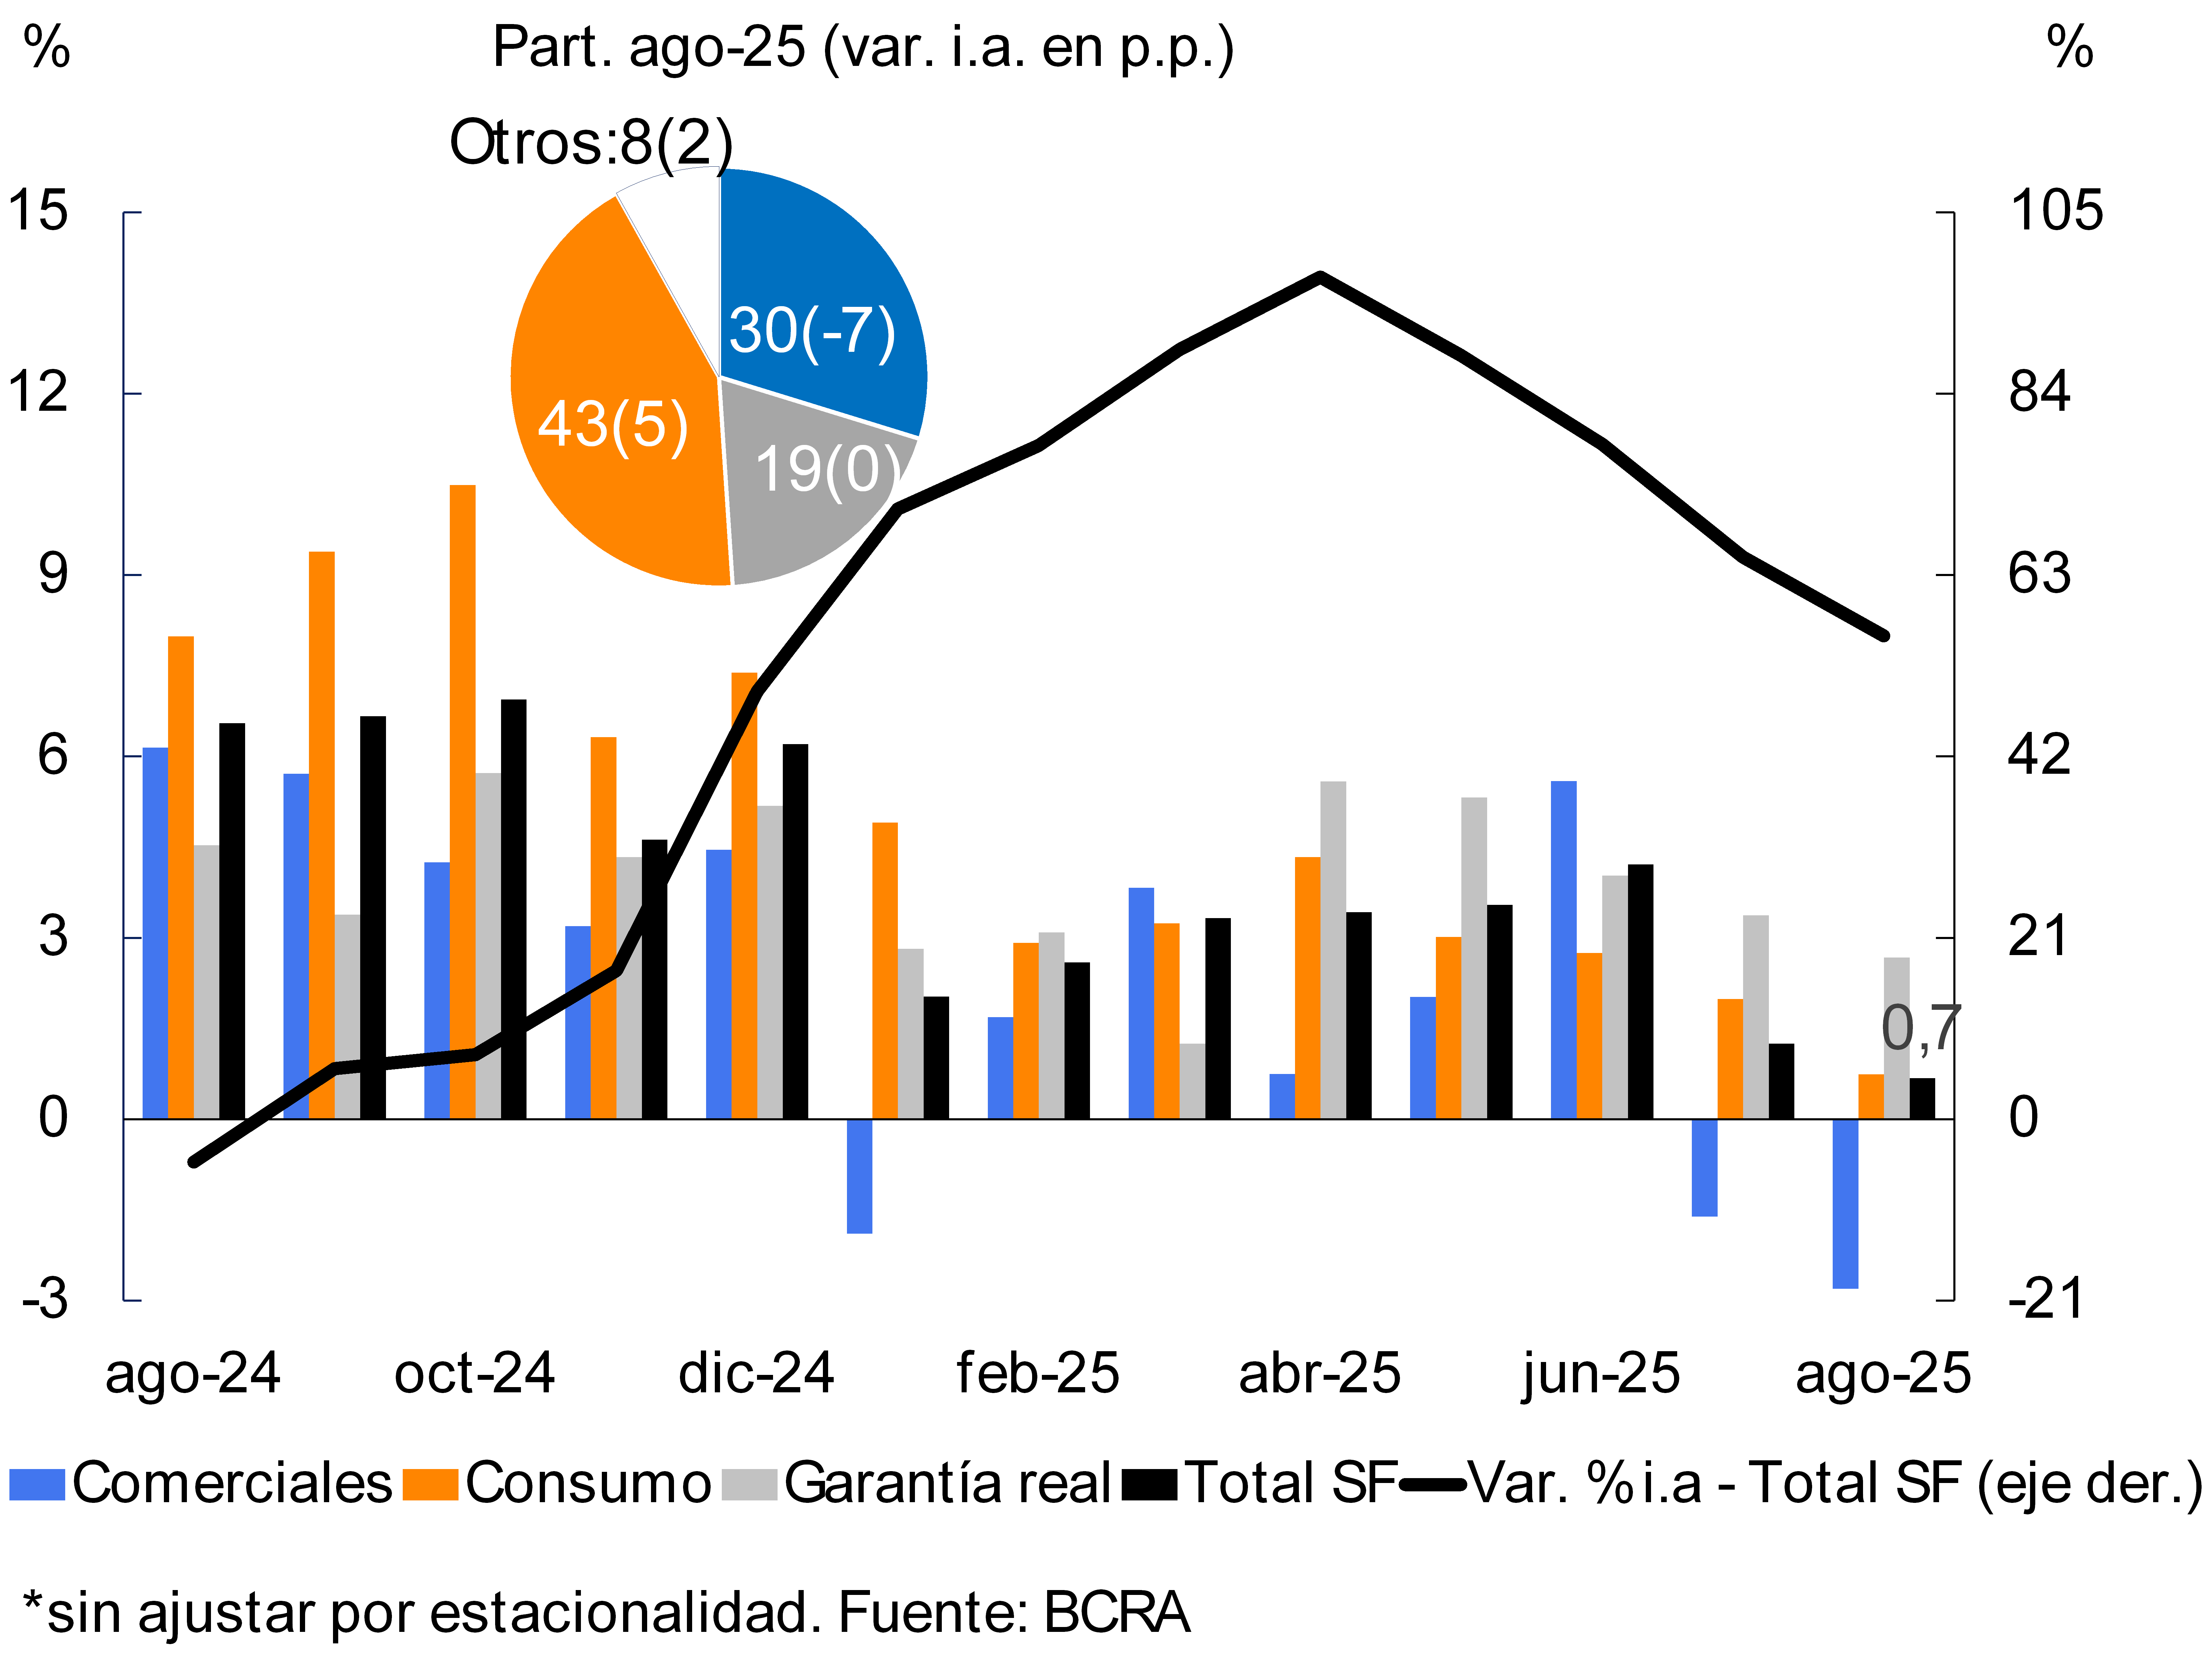
Chart 2 : Foreign currency financial intermediation to the private sector
Considering the items in domestic and foreign currency, the real balance of credit to the private sector grew 1.8% in August. The real balance of loans to households2 increased by 1.2% in the period, highlighting the dynamism of mortgage and personal lines. For its part, the balance of financing to companies increased 0.5% in real terms between the end of the month, driven mainly by the industry and primary production sectors.
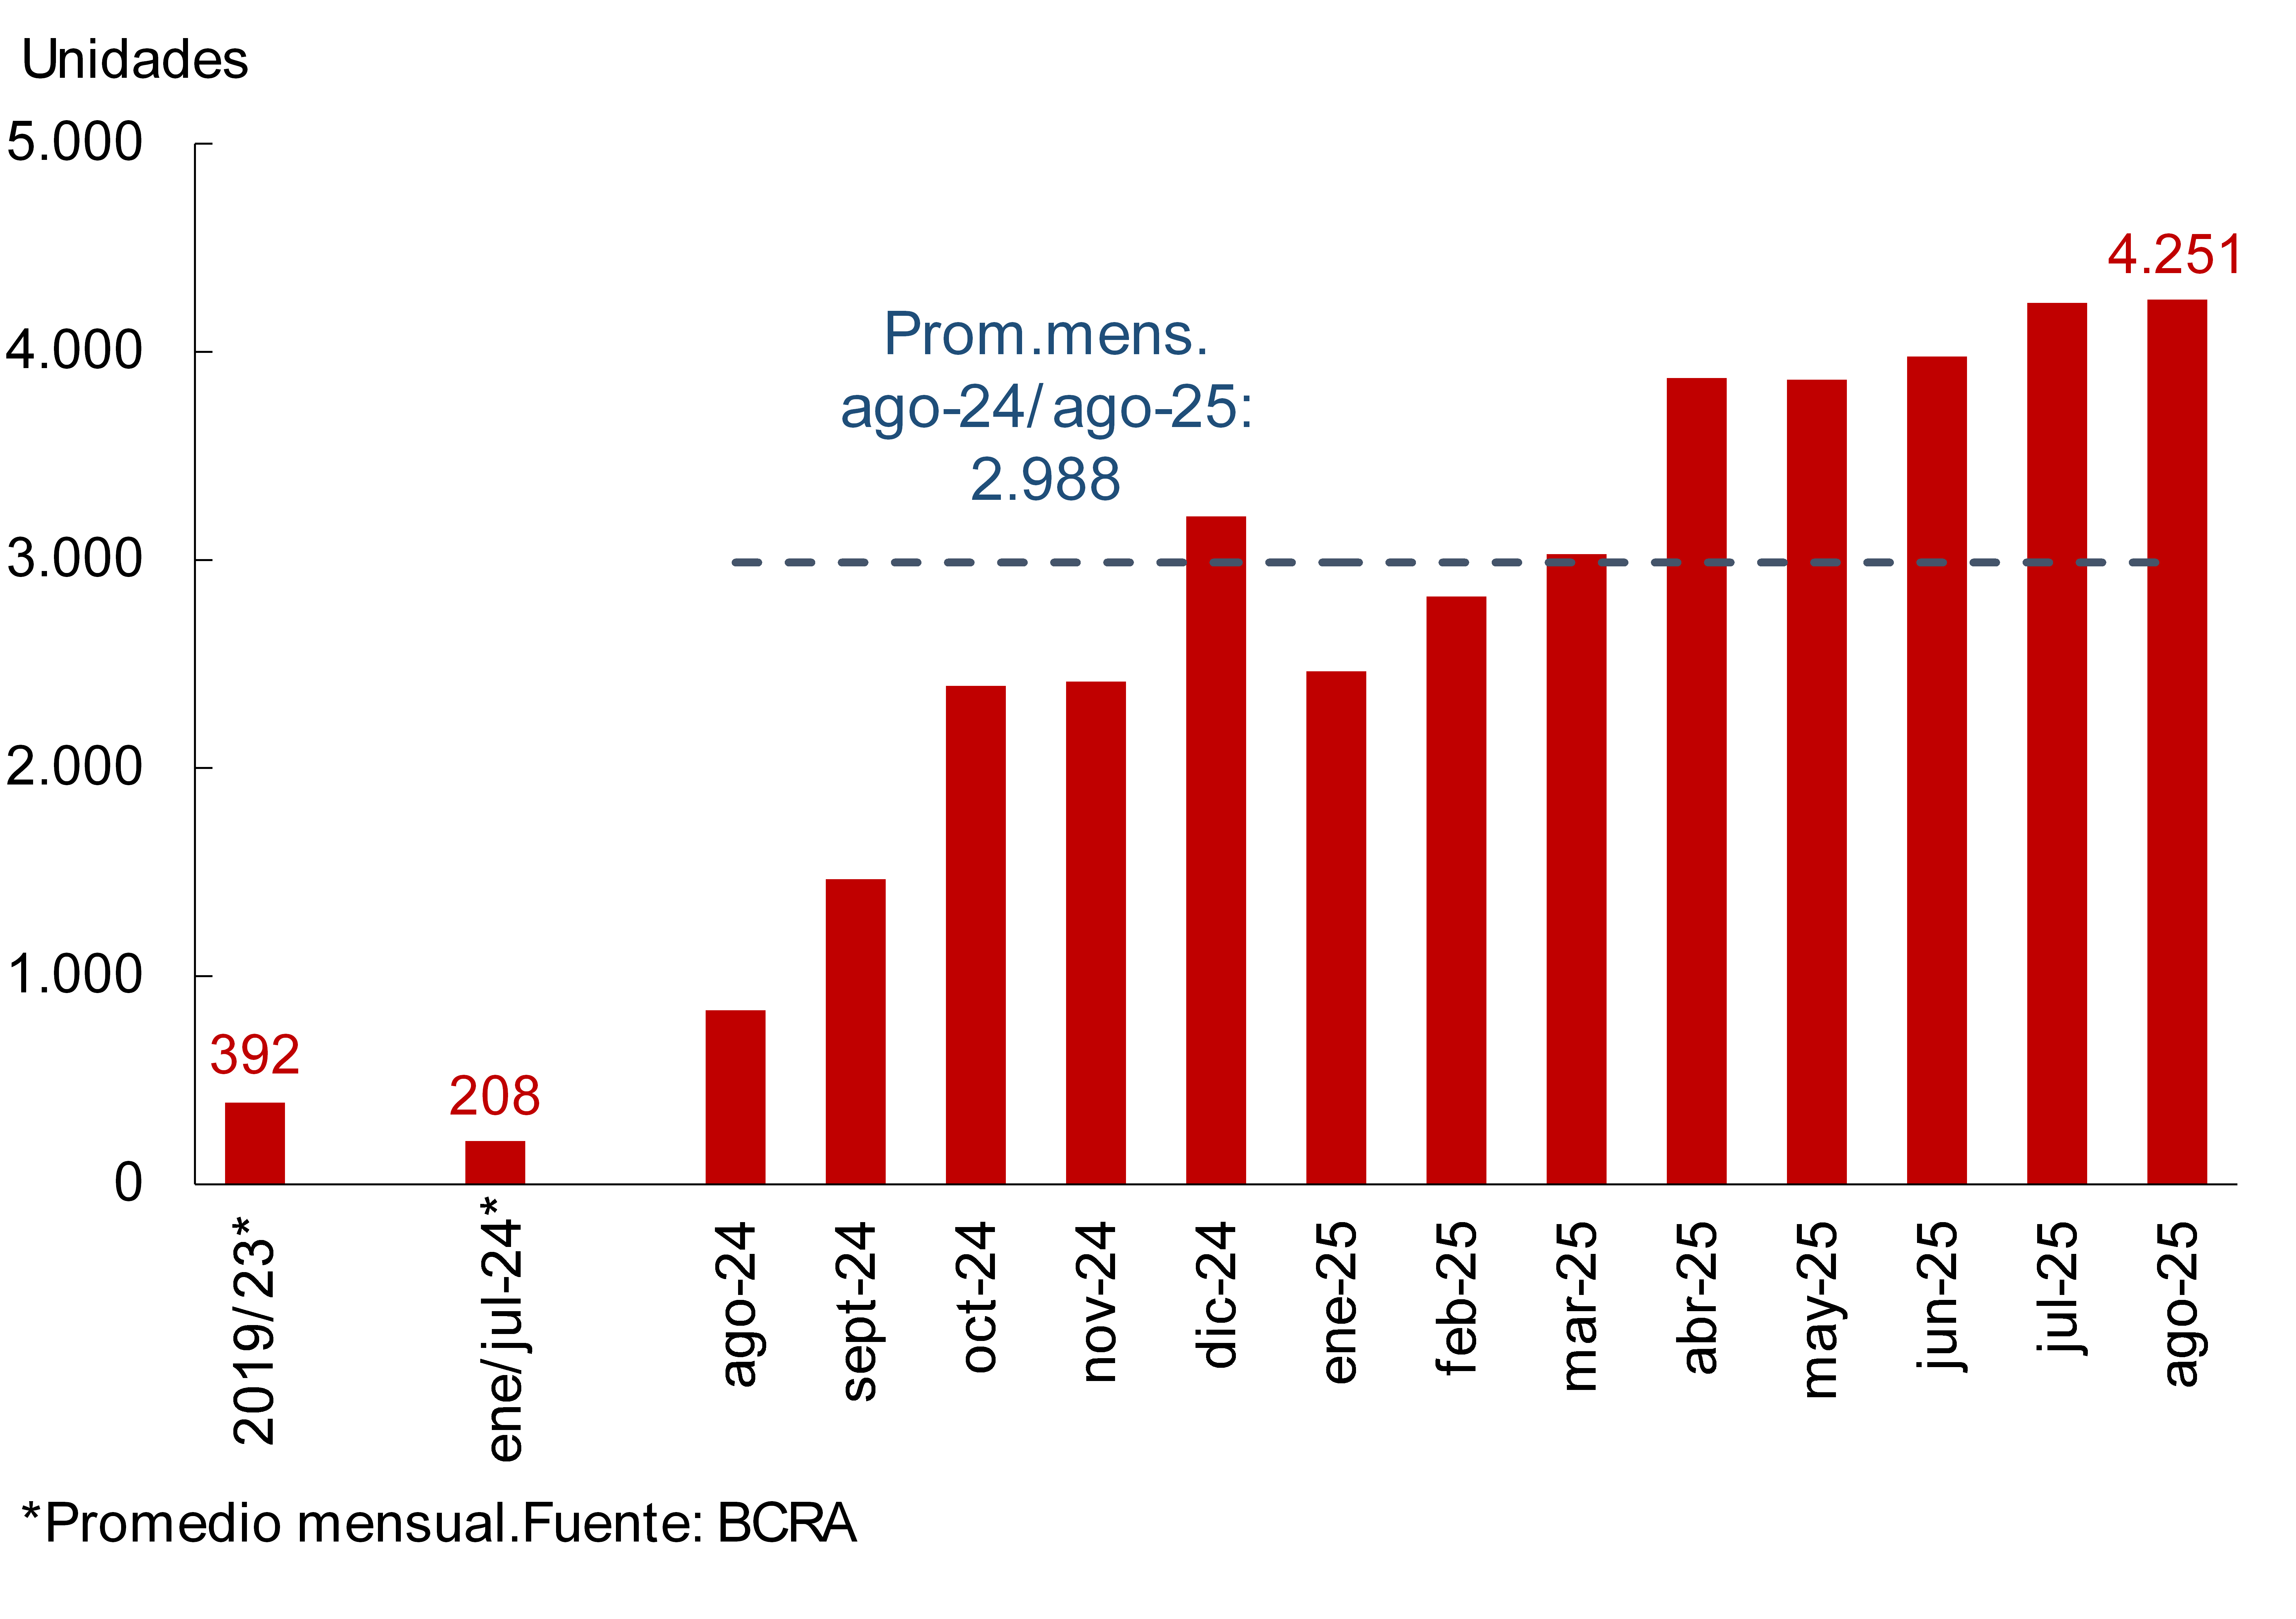
During August, it is estimated that the financial institutions as a whole incorporated around 4,200 new mortgage loan debtors (registrations of individuals), a figure that remains in line with the level recorded the previous month (see Graph 3). In the last 12 months, approximately 38,000 new mortgage debtors have been added to the system, of which 98% belong to the UVA segment. It is currently estimated that the total number of mortgage debtors at the systemic level amounts to 168,630, increasing 16.4% compared to the level of a year ago.
Graph 3 | Estimation of mortgage registrations (individuals)
Financial system
Graph 4: Real balance of private sector deposits in pesos*.
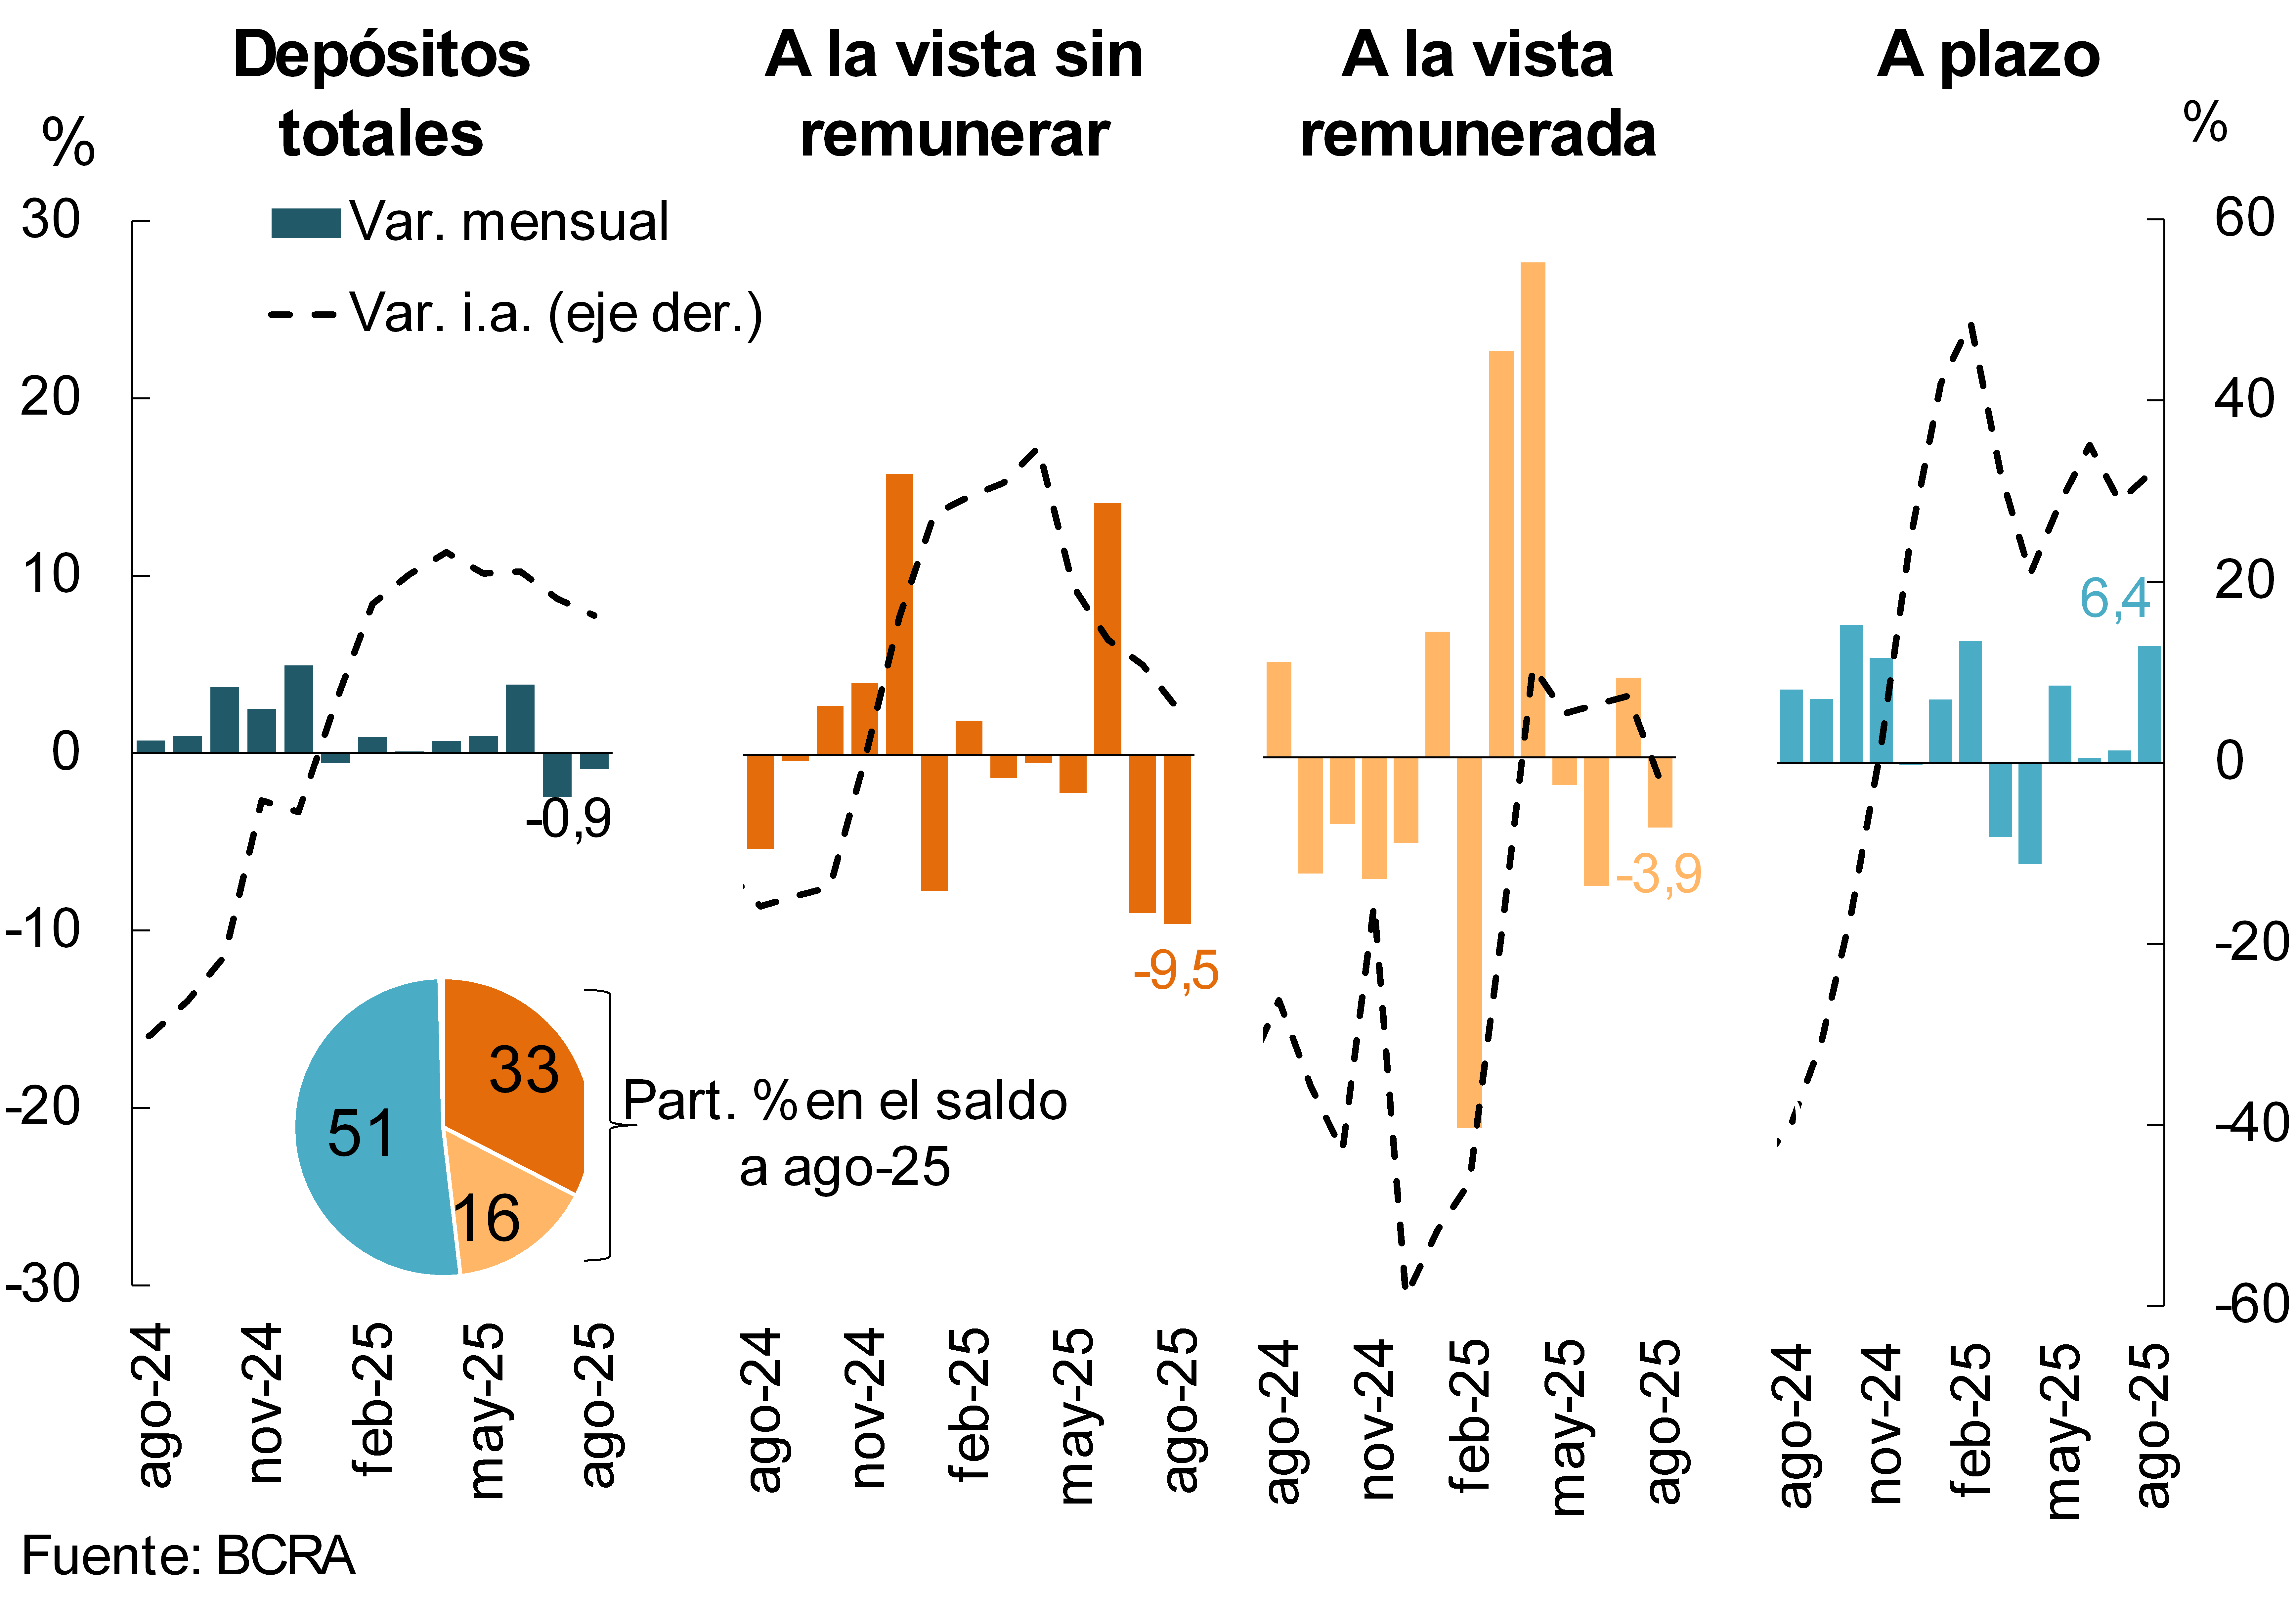
With regard to funding in the financial system, in August the real balance of private sector deposits in pesos decreased by 0.9% (see Chart 4). When disaggregated by type of deposits, there was a heterogeneous behavior in the month: demand deposits fell (both non-interest-bearing and interest-bearing deposits: 9.5% and 3.9% in real terms, respectively), while time deposits increased by 6.4% in real terms. The increase in time deposits was mainly explained by the segment of individuals – agreed at a fixed interest rate – in a context of generalized increases in nominal interest rates. In a year-on-year comparison, the real balance of private sector deposits in pesos accumulated an increase of 15.5%, mainly explained by time deposits.
In August, the balance of private sector deposits in foreign currency fell by 0.6% (an increase of 66.9% YoY (in source currency), see Chart 2). On a cross-sector, currency-driven basis, the real deposit balance decreased 1.1% in the month (up 26.9% real YoY).
II. Evolution and aggregate composition of the balance sheet
In August, the total assets of the financial system in real terms did not show any changes in magnitude compared to the end of July (see Graph 5). In the last 12 months, the total assets of all financial institutions accumulated an increase of 21% in homogeneous currency. Both public and private banks saw a real year-on-year increase in their assets.
Graph 5 | Total assets of the financial
system In real terms
Graph 6 | Composition of assets and funding
Financial system – Participation %
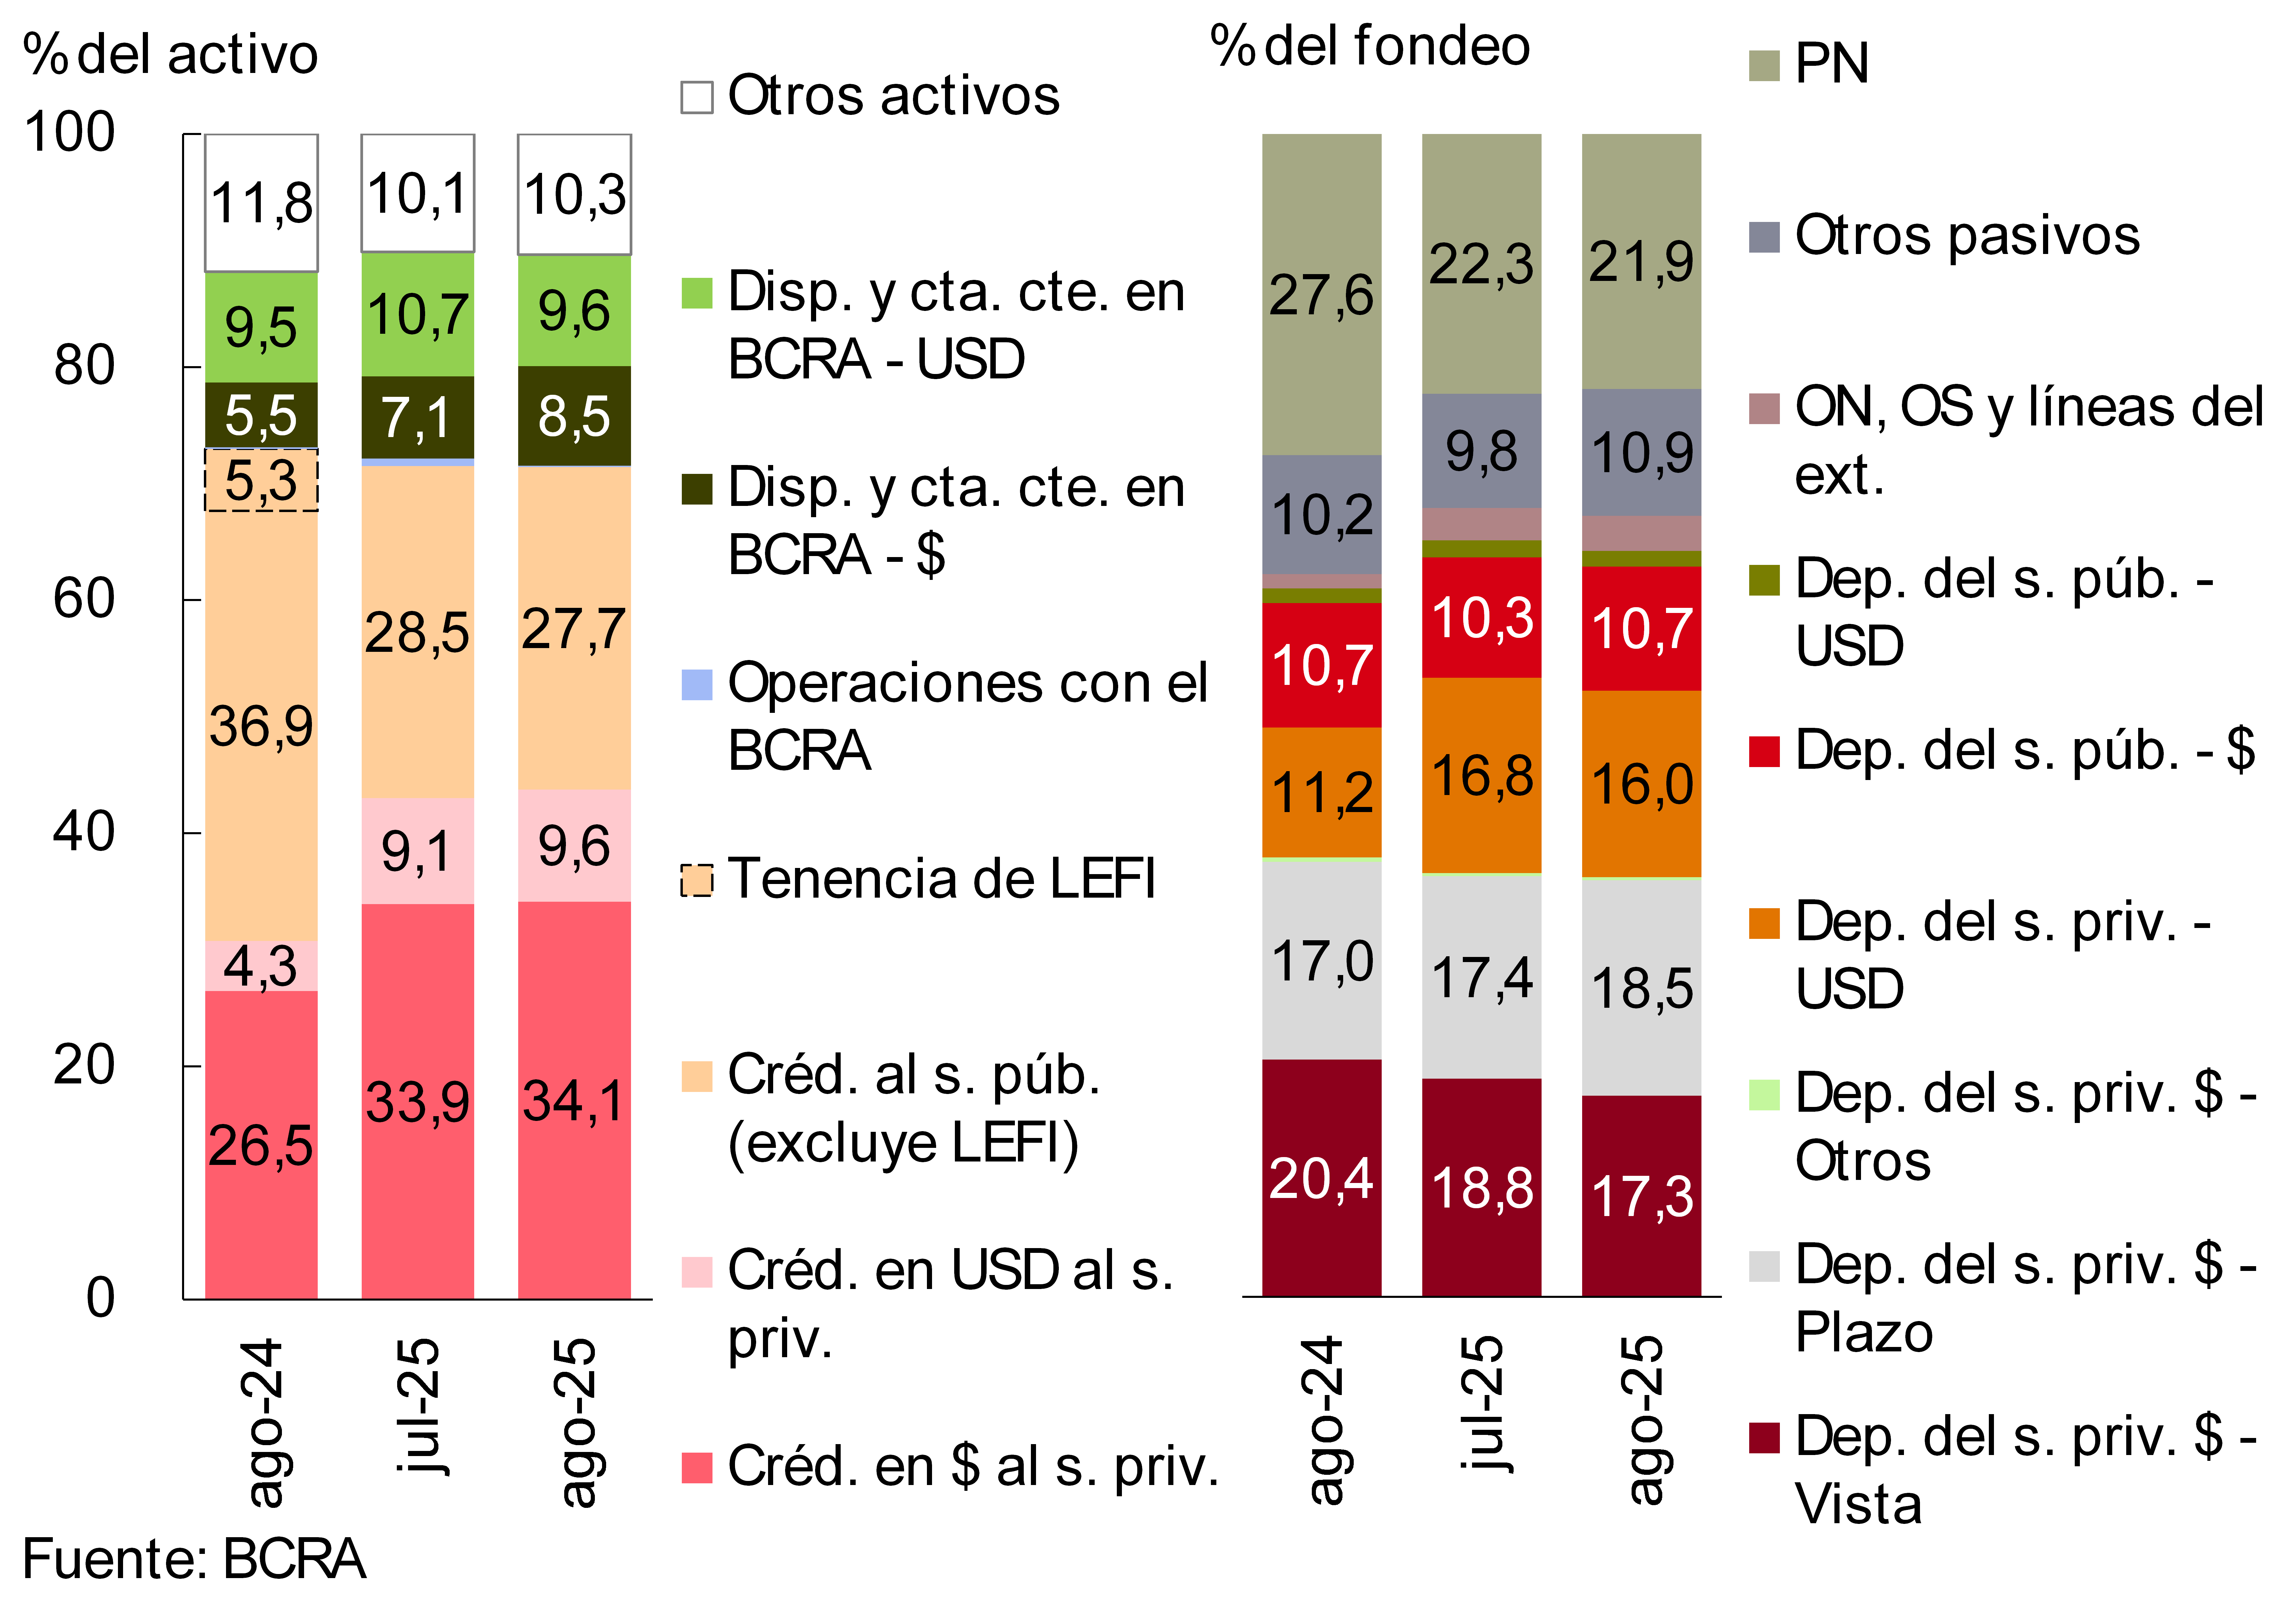
In the month, credit to the private sector continued to increase its share of the total assets of all financial institutions (0.7 p.p. to 43.7%; see Graph 6), mainly due to the performance of the segment in foreign currency. Given that financing to the public sector reduced its relative weight in total assets during the period (-0.8 p.p. to 27.7%), the gap with respect to the relevance of credit to the private sector continued to widen, to 16.1 p.p. of assets. 3 In the month, the weighting within the total assets of the current accounts in pesos of the entities in the BCRA also increased. 4 With regard to aggregate funding, between the beginning of the month the share of time placements in pesos by the private sector grew, while demand deposits in pesos and deposits in foreign currency, both arranged by the private sector, decreased in relevance in the total (see Graph 6).
In August, the estimated systemic spread between assets and liabilities denominated in foreign currency – considering off-balance sheet foreign currency purchase and sale transactions – increased slightly, to 5.9% of the PRC (-5.5 p.p. y.o.y.). As for the segment of items with a CER adjustment clause (or agreed in UVA), the aggregate spread between assets and liabilities narrowed slightly in the period, to 87.6% of the sector’s RPC (-13.8 p.p. below the level of a year ago).
III. Portfolio quality
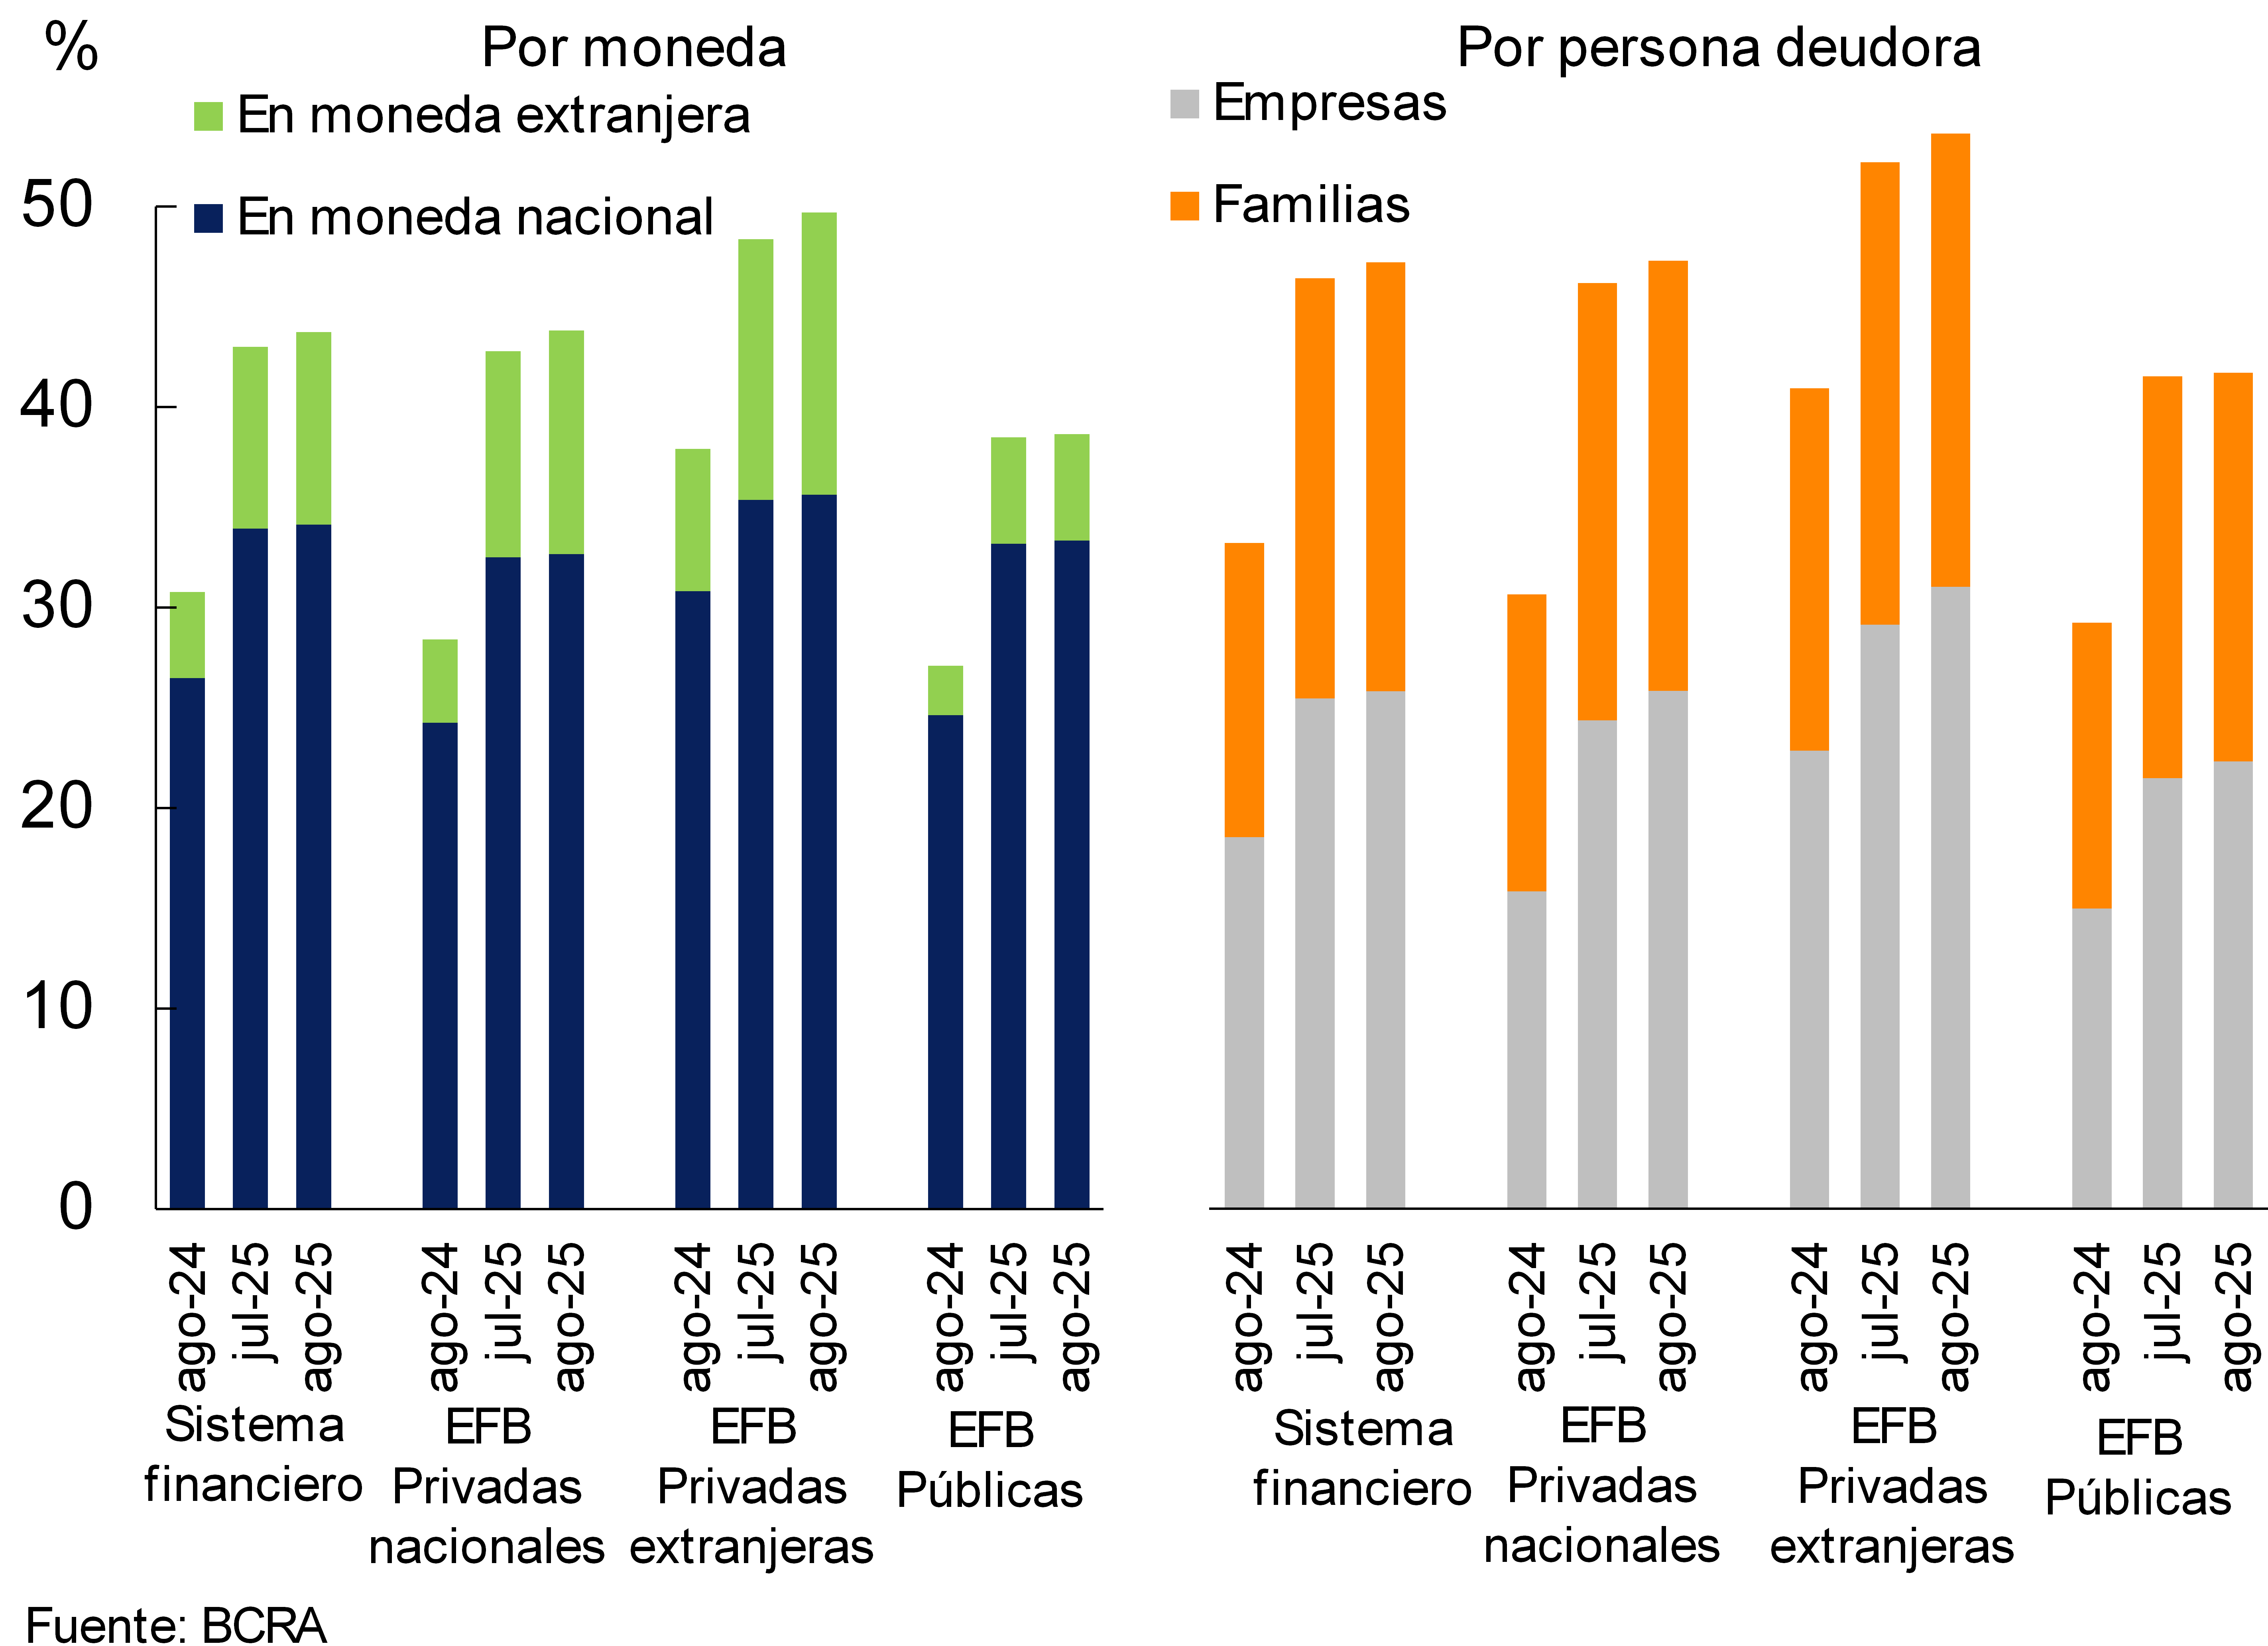
In August, the financial system continued to increase its credit exposure to the private sector. The share of corporate loans in total assets of all entities totaled 23.9% (up 0.3 p.p. compared to July), while for the household segment it amounted to 19.8% (up 0.4 p.p. in the month, see Chart 7). When disaggregated by currency, financing in pesos stood at 34.1% of assets (0.2 p.p. more than in July), while the ratio between loans in foreign currency and total assets reached 9.6% (0.5 p.p. monthly). In year-on-year terms, credit to the private sector accumulated an increase of 13 p.p. in assets (7.7 p.p. for the segment in pesos and 5.3 p.p. for items in foreign currency, see Chart 7).
Figure 7 | Balance of credit to the private sector in terms of assets
Financial system
The non-performing loan ratio for private sector loans reached 3.7% at the systemic level in August, increasing 0.5 p.p. compared to the previous month (see Chart 8). The NPL indicator for loans to households totaled 6.6%, while for financing to companies it stood at 1.4% in the period.
Chart 8: Private sector credit irregularity ratio
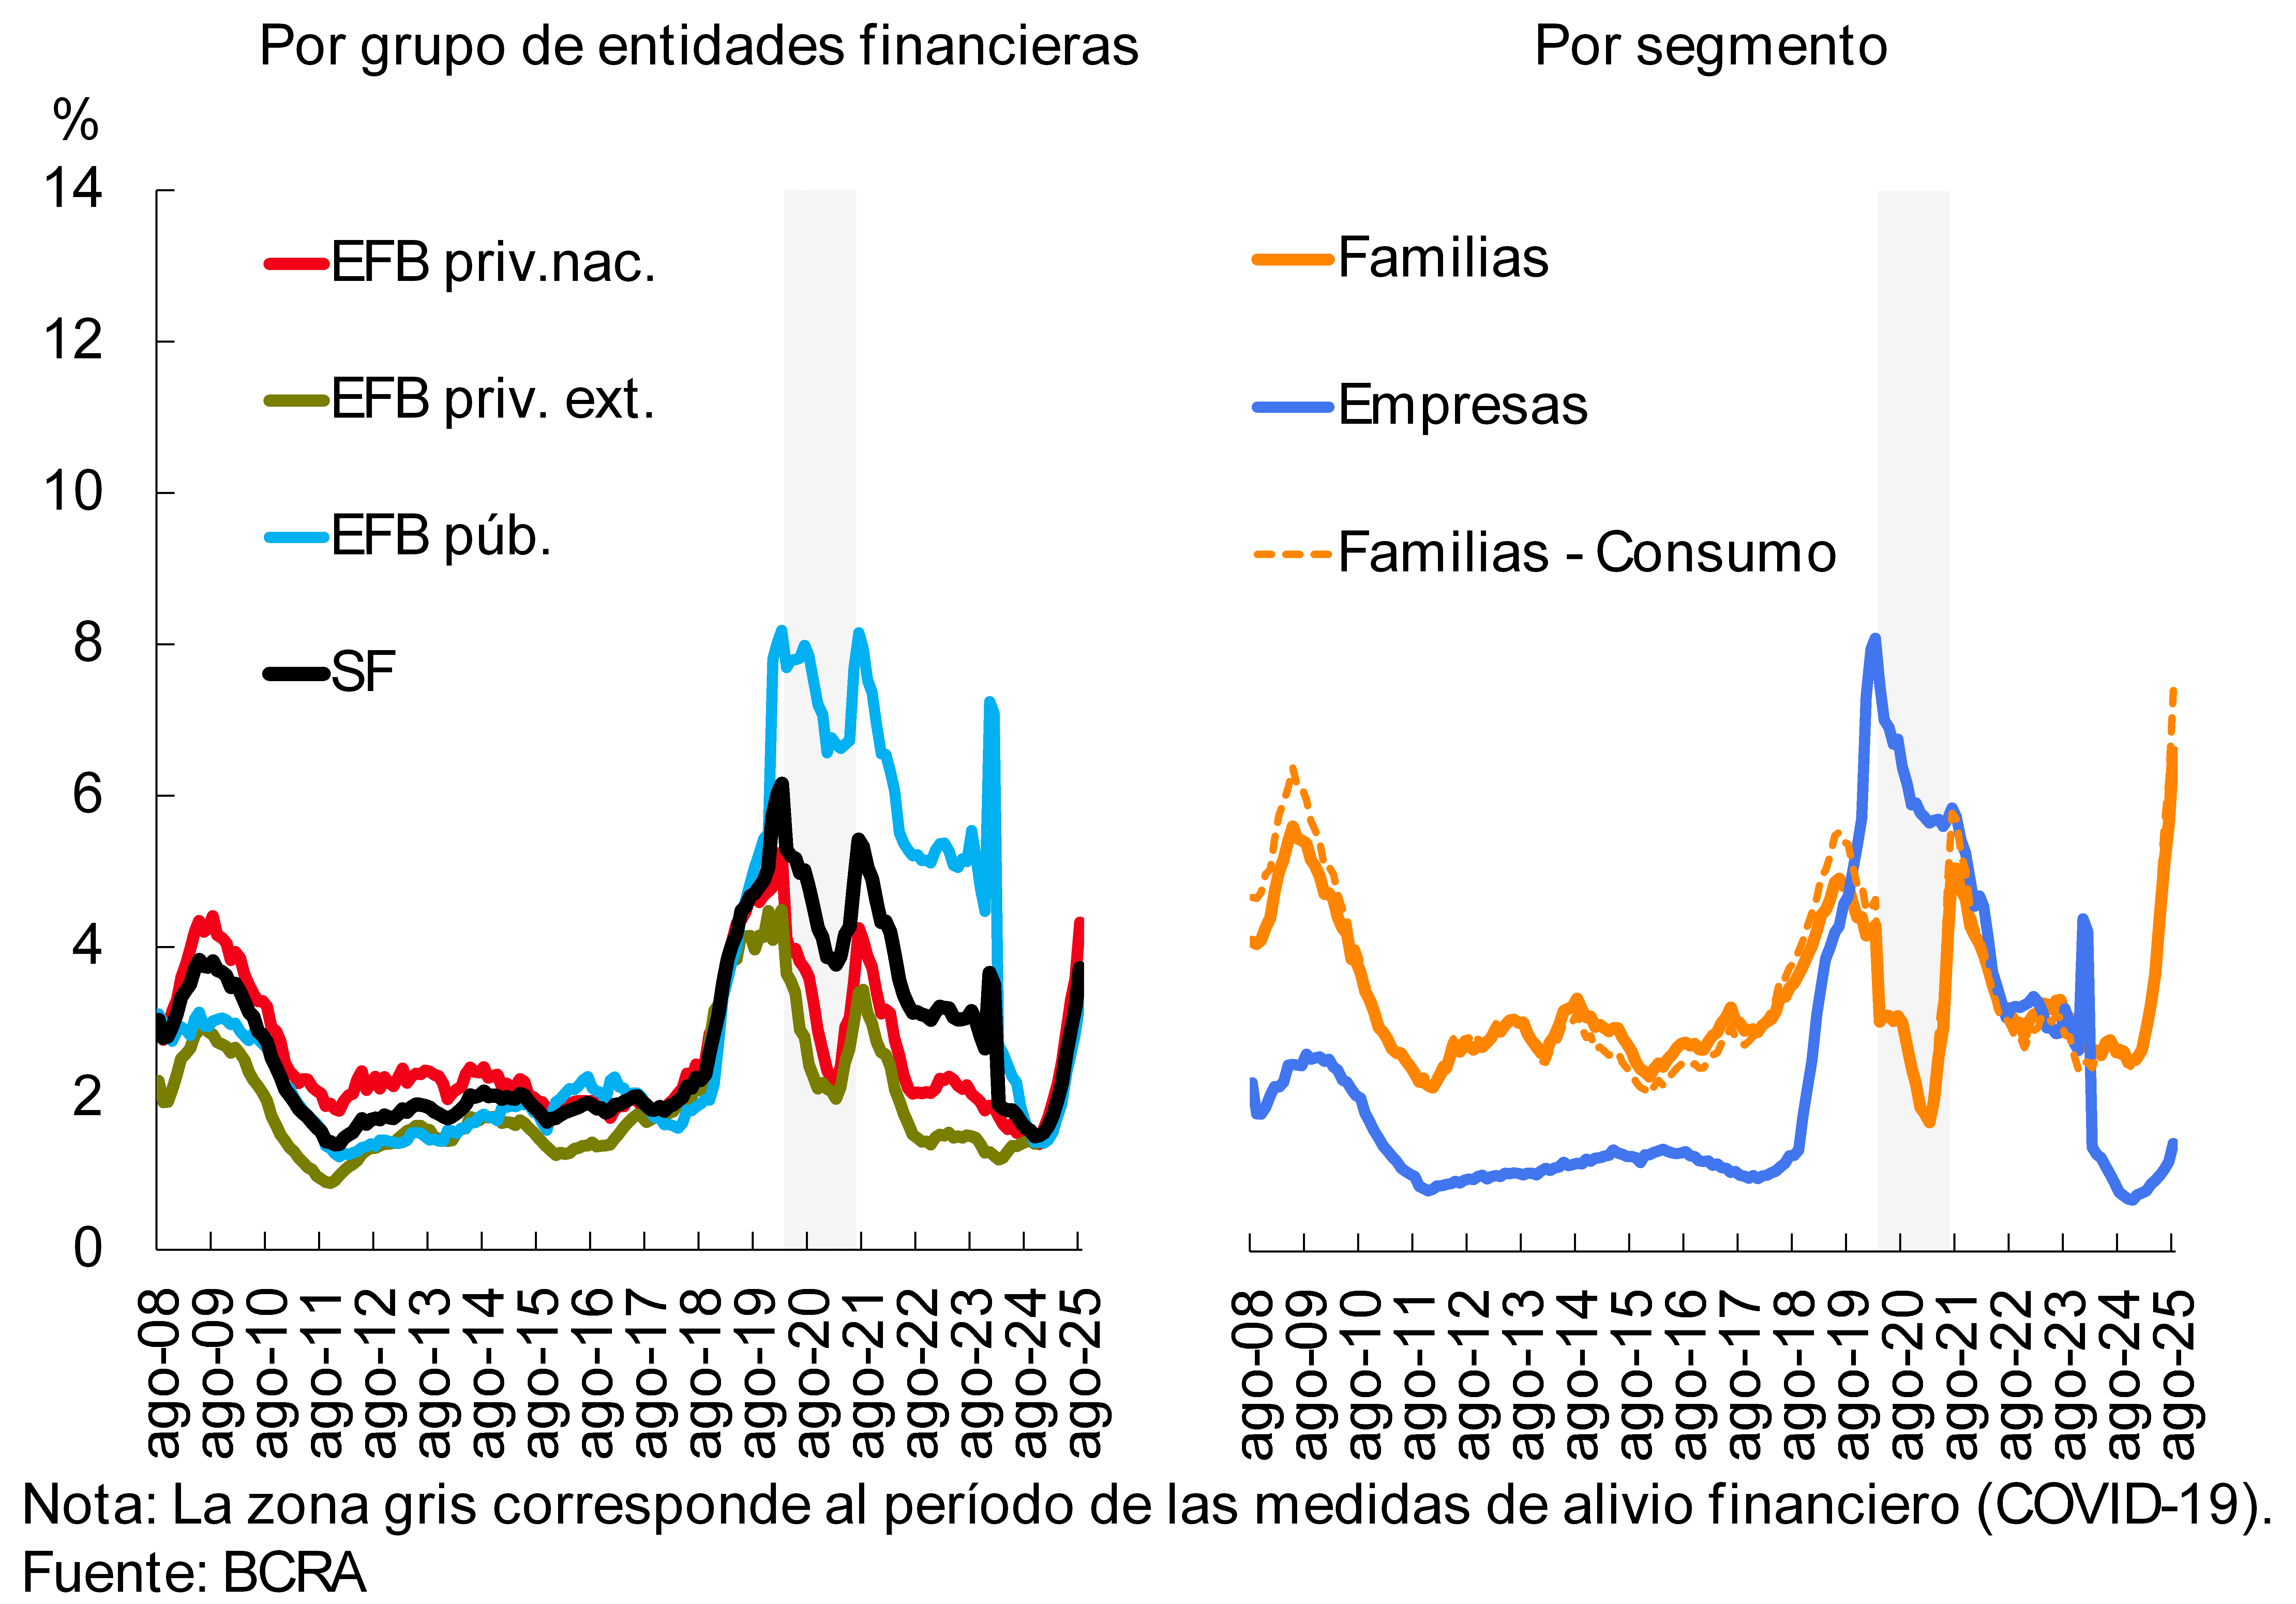
The balance of total forecasts of all financial institutions represented 108% of financing in an irregular situation (6.6 p.p. less than in July) and 4% of the total portfolio to the private sector (0.4 p.p. more in the past month).
IV. Liquidity and solvency
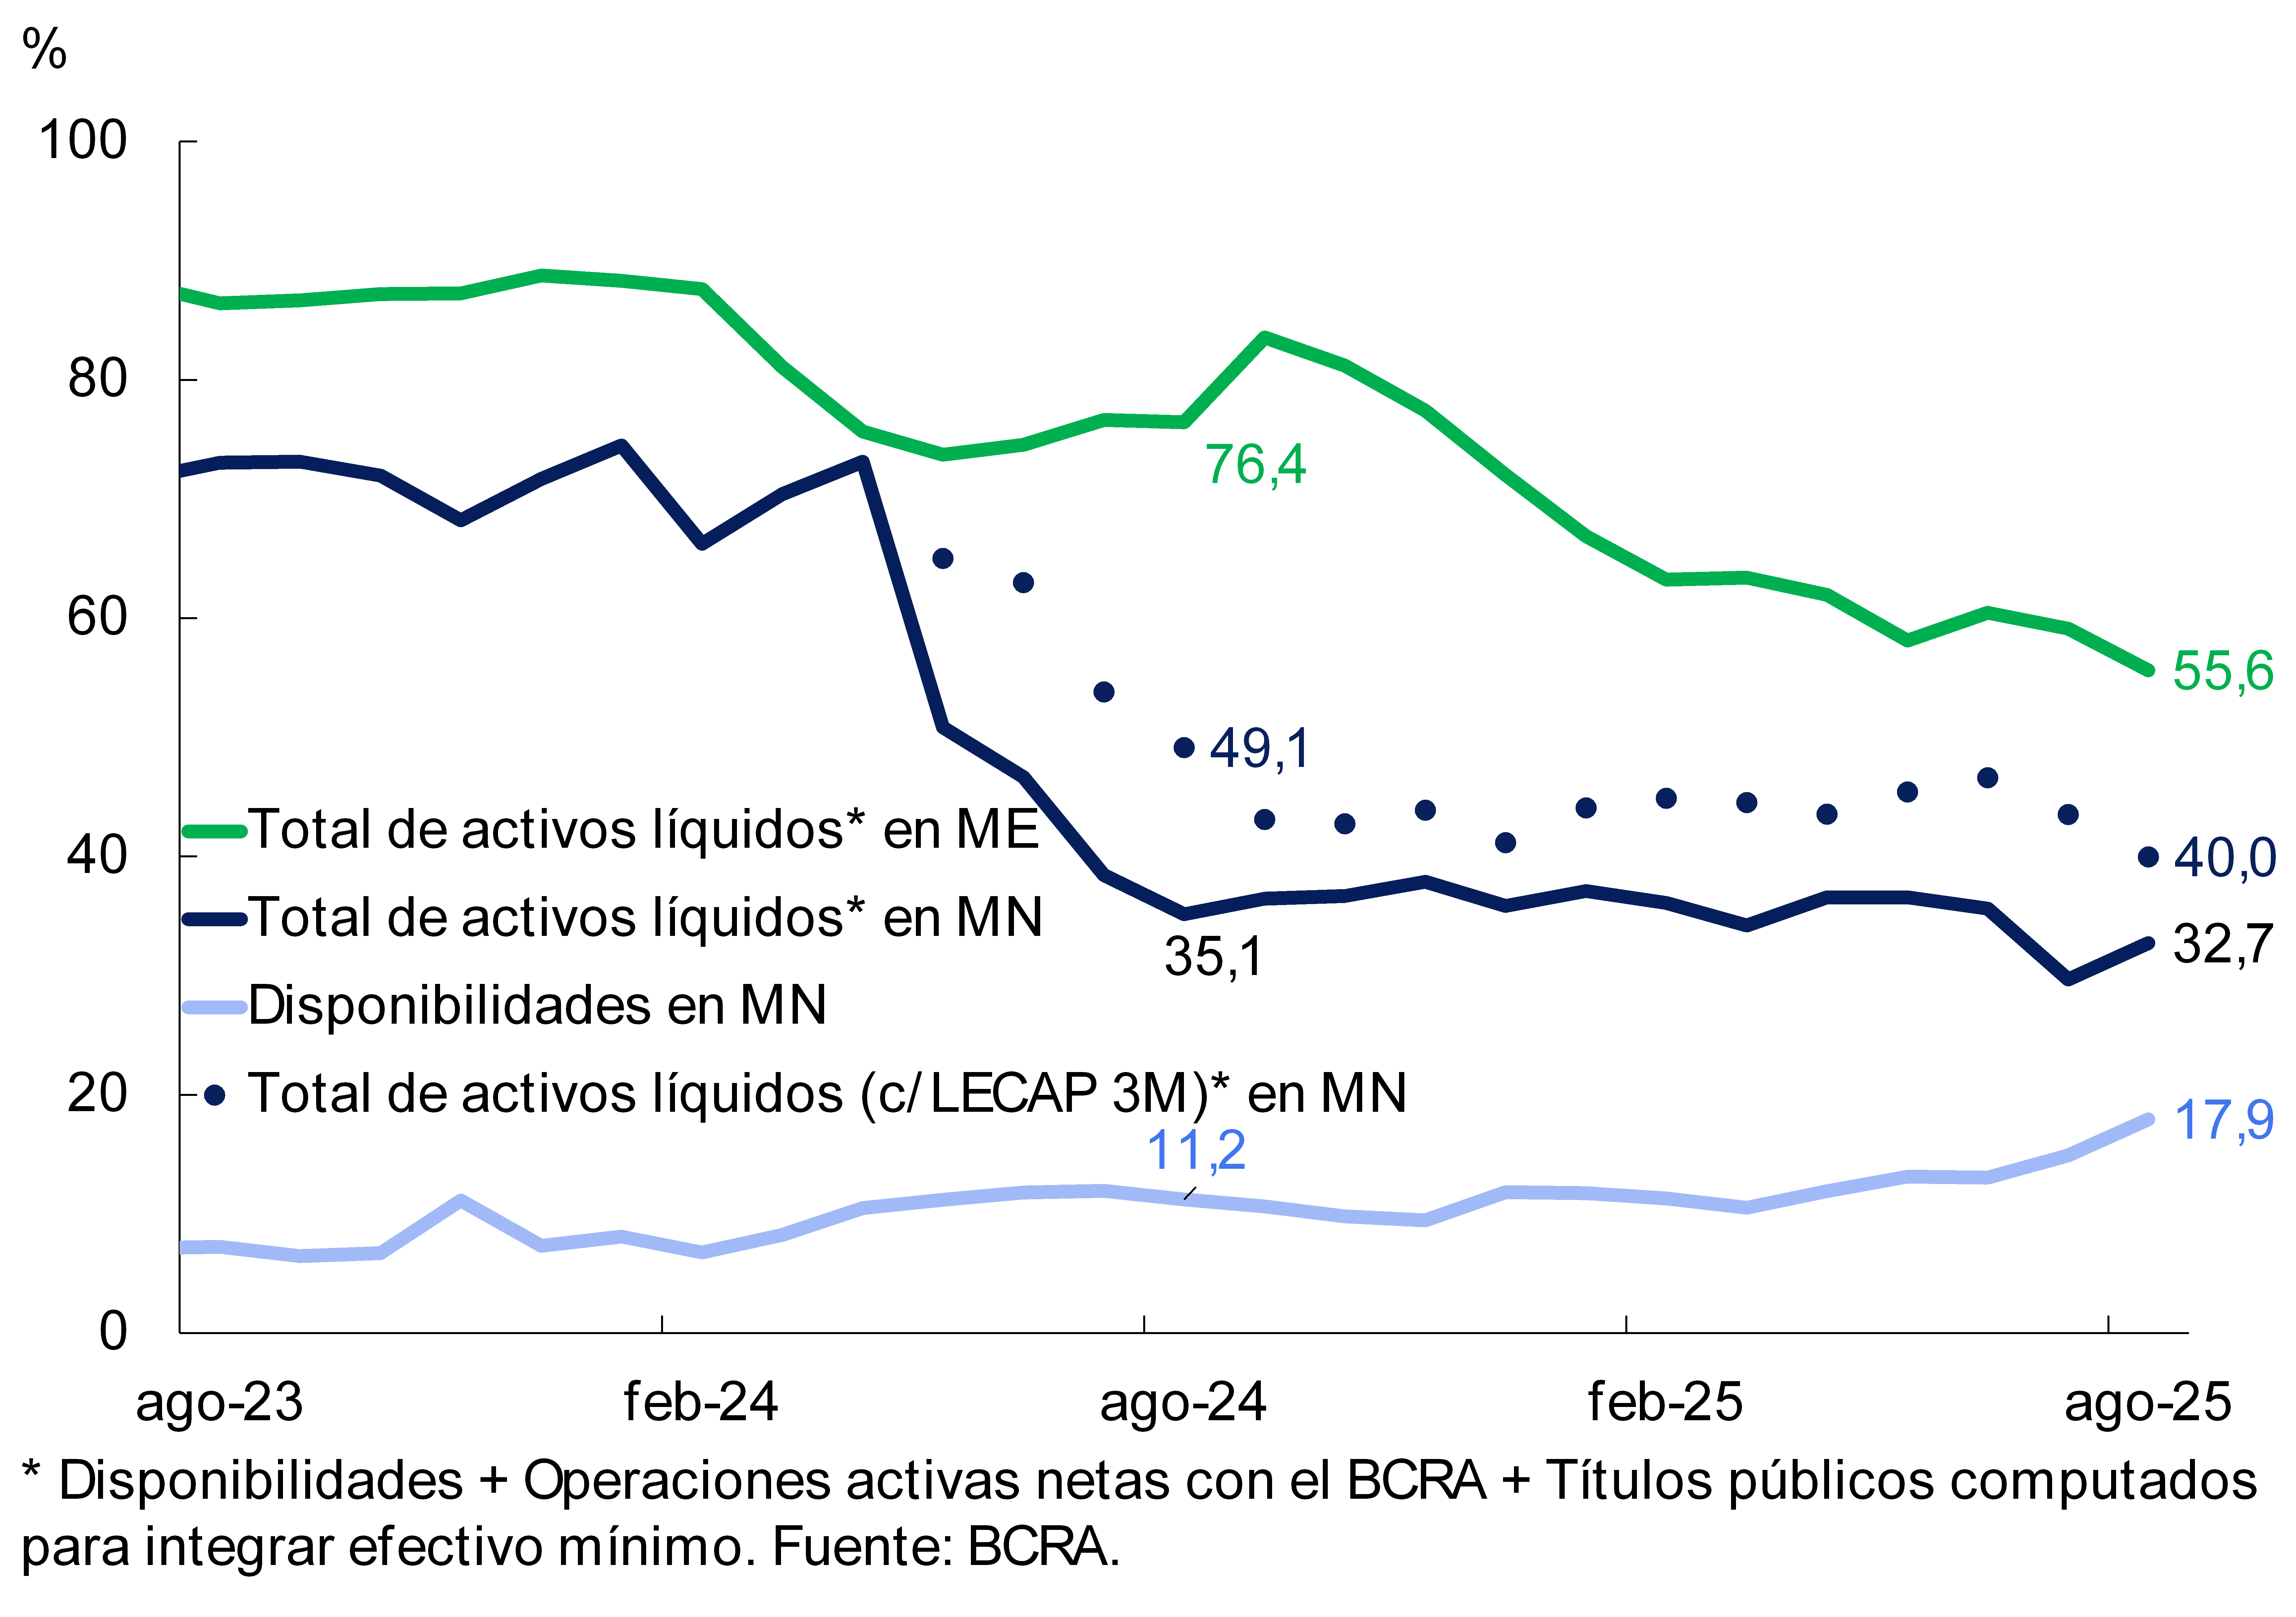
In a context of changes in minimum cash requirements, in August the liquidity ratio in pesos for the financial system, which includes only availabilities, rose to 17.9% of deposits in national currency (increasing 3 p.p. per month and 6.7 p.p. y.o.y., see Chart 9). 5 The broad liquidity indicator in pesos6 totaled 40% of deposits in the same denomination in the period (-3.6 p.p. compared to the value of July and -9.2 p.p. y.a.). As for the foreign currency segment, the liquidity ratio decreased by 3.5 p.p. of deposits arranged in that currency in the month, to represent 55.6% (-20.8 p.p. y.o.y.).
Figure 9 | Liquidity
indicators As a % of deposits in each denomination
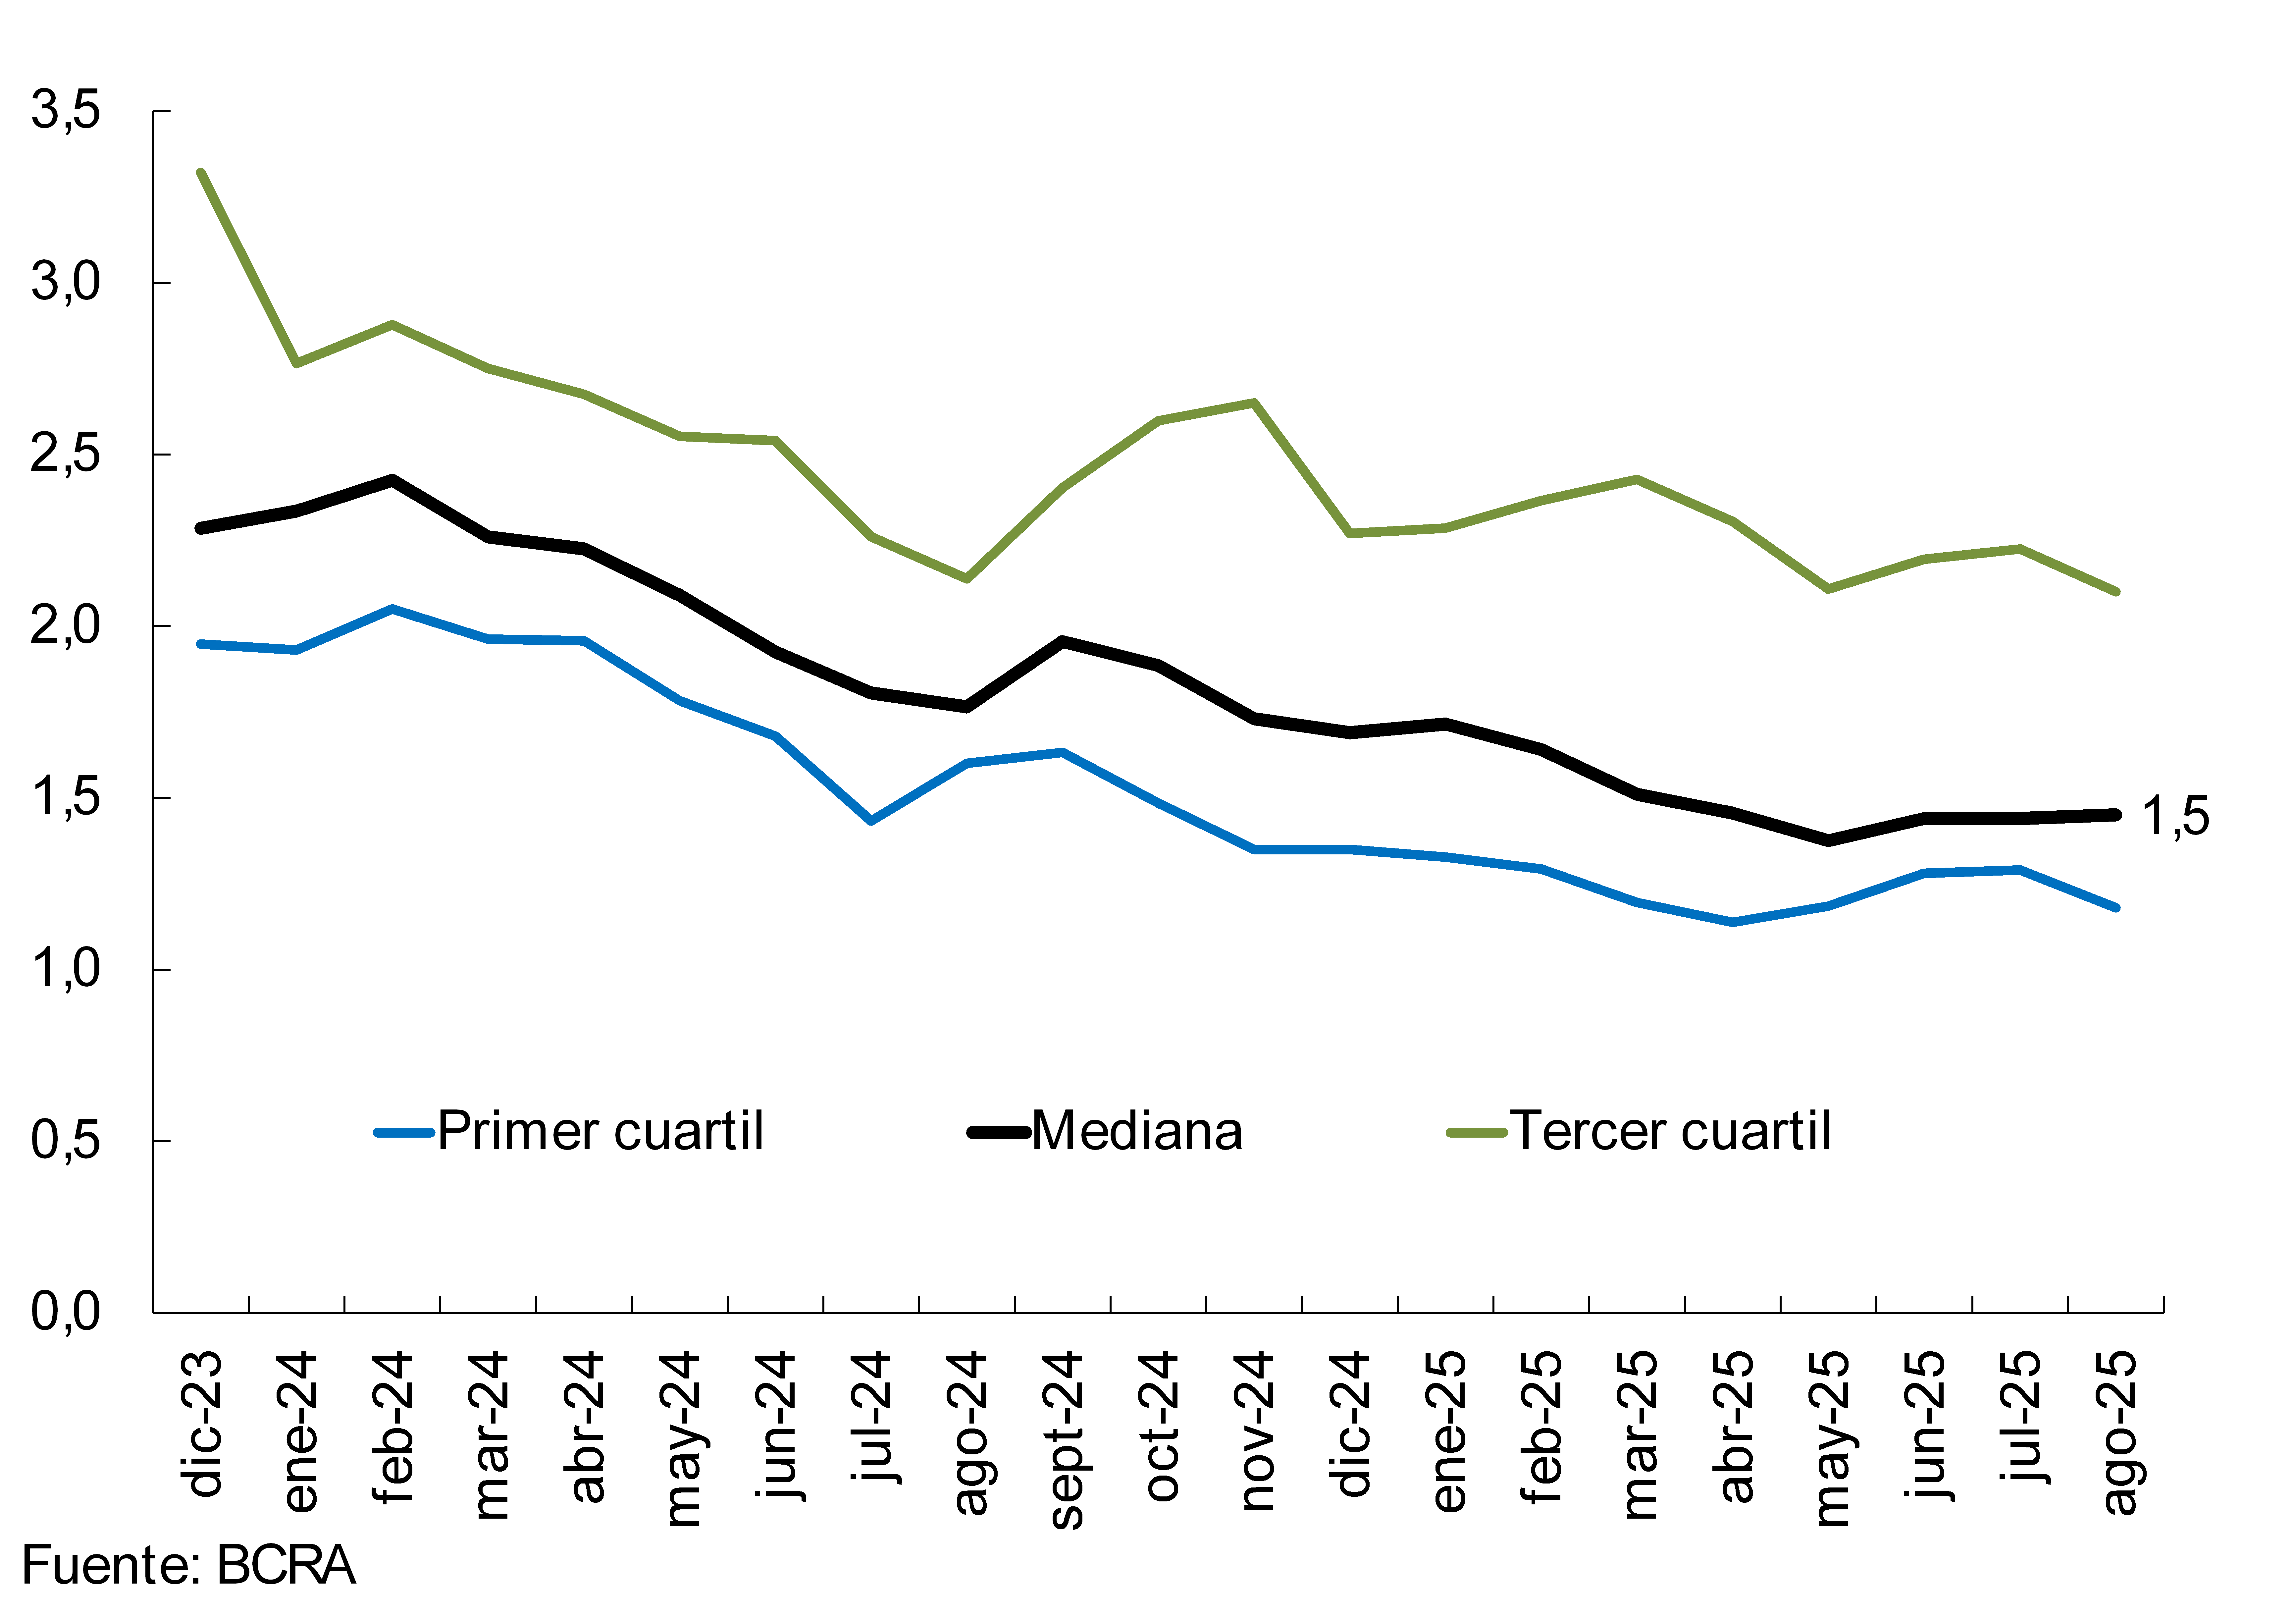
With regard to the Liquidity Coverage Ratio (LCR), in August the median for the group of financial institutions A (subject to verification of the ratio) reached 1.5 (see Chart 10), slightly increasing compared to the level of July (-0.3 YoY). 7
Figure 10 | Liquidity coverage ratio (LCR)
Group A financial institutions – In $+ME
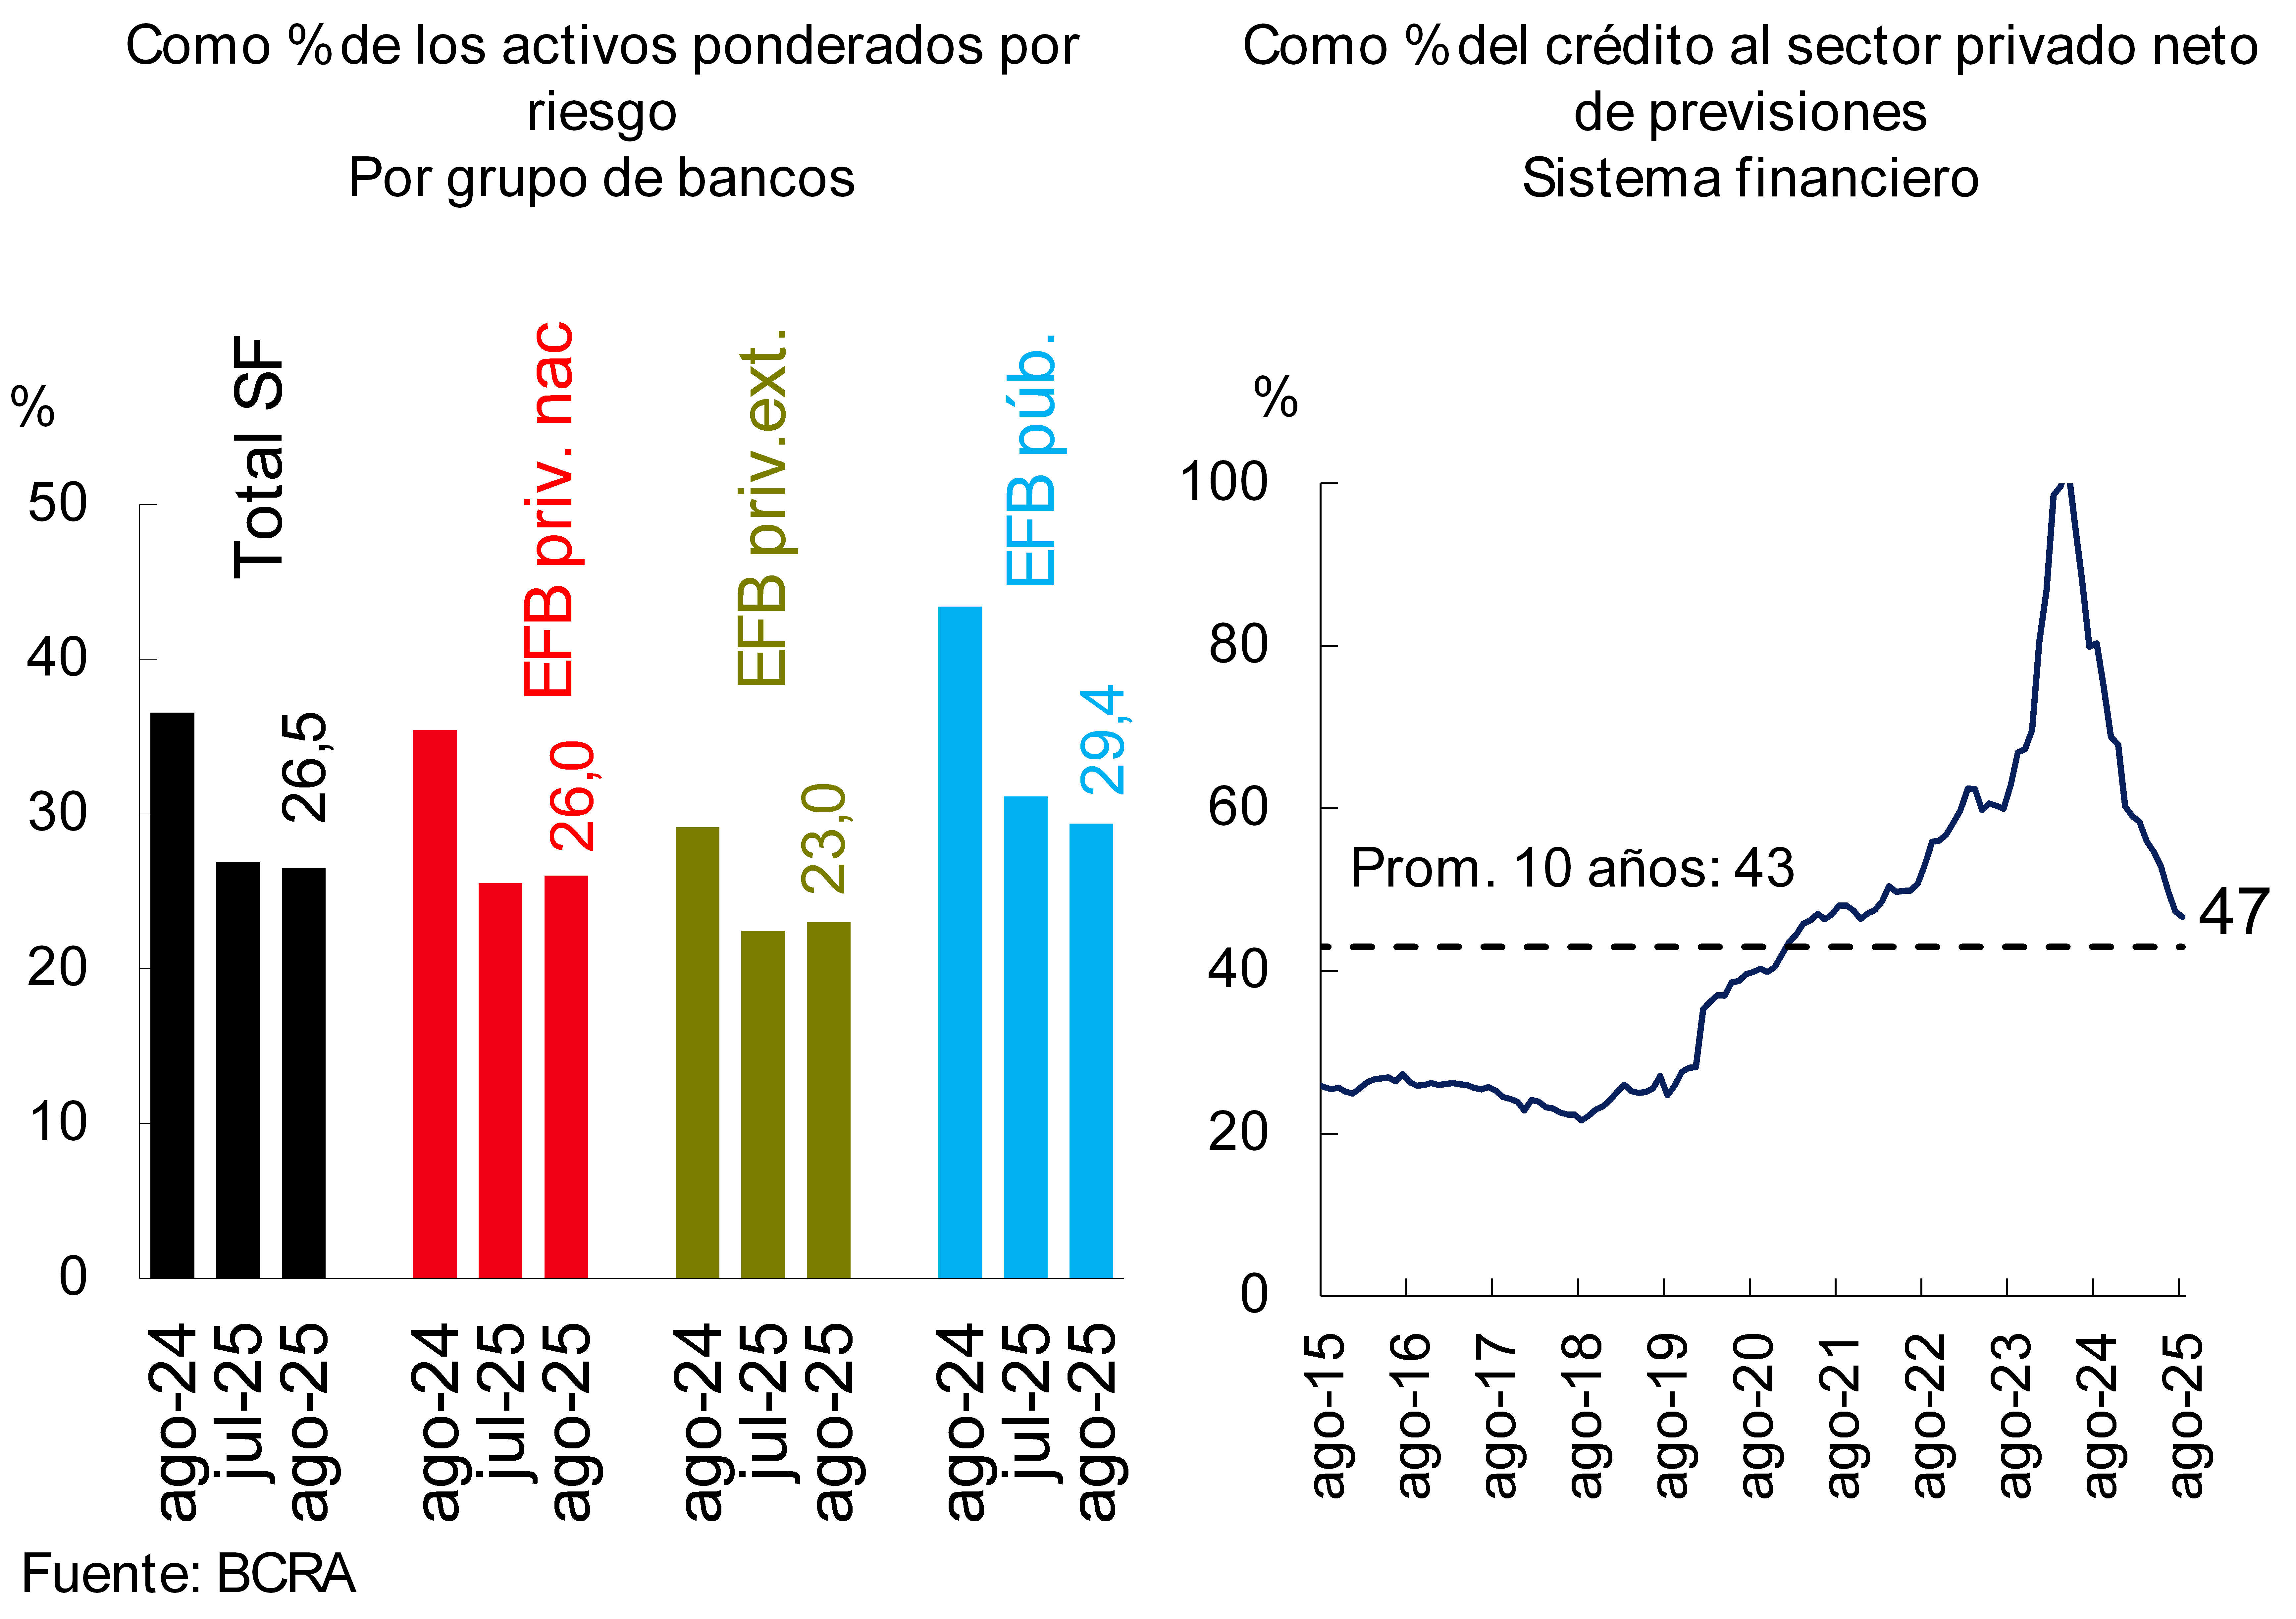
In August, capital integration (PRC) stood at 26.5% of risk-weighted assets (RWA) of the financial system as a whole, 0.4 p.p. less than last month (see Chart 11). The monthly performance was against the backdrop of a slight real (0.3%) reduction in the PRC, combined with a real (1.3%) increase in RWAs. Excess capital (RPC net of the minimum regulatory requirement) with respect to the regulatory requirement totaled 227% in the month for the aggregate of entities (-5.6 p.p. compared to July and -132 p.p. y.o.y.). Regulatory capital represented 46.6% of the balance of financing to the private sector net of forecasts (-0.8 p.p. in the month), remaining above the average of the last 10 years.
Graph 11 : Integration of capital
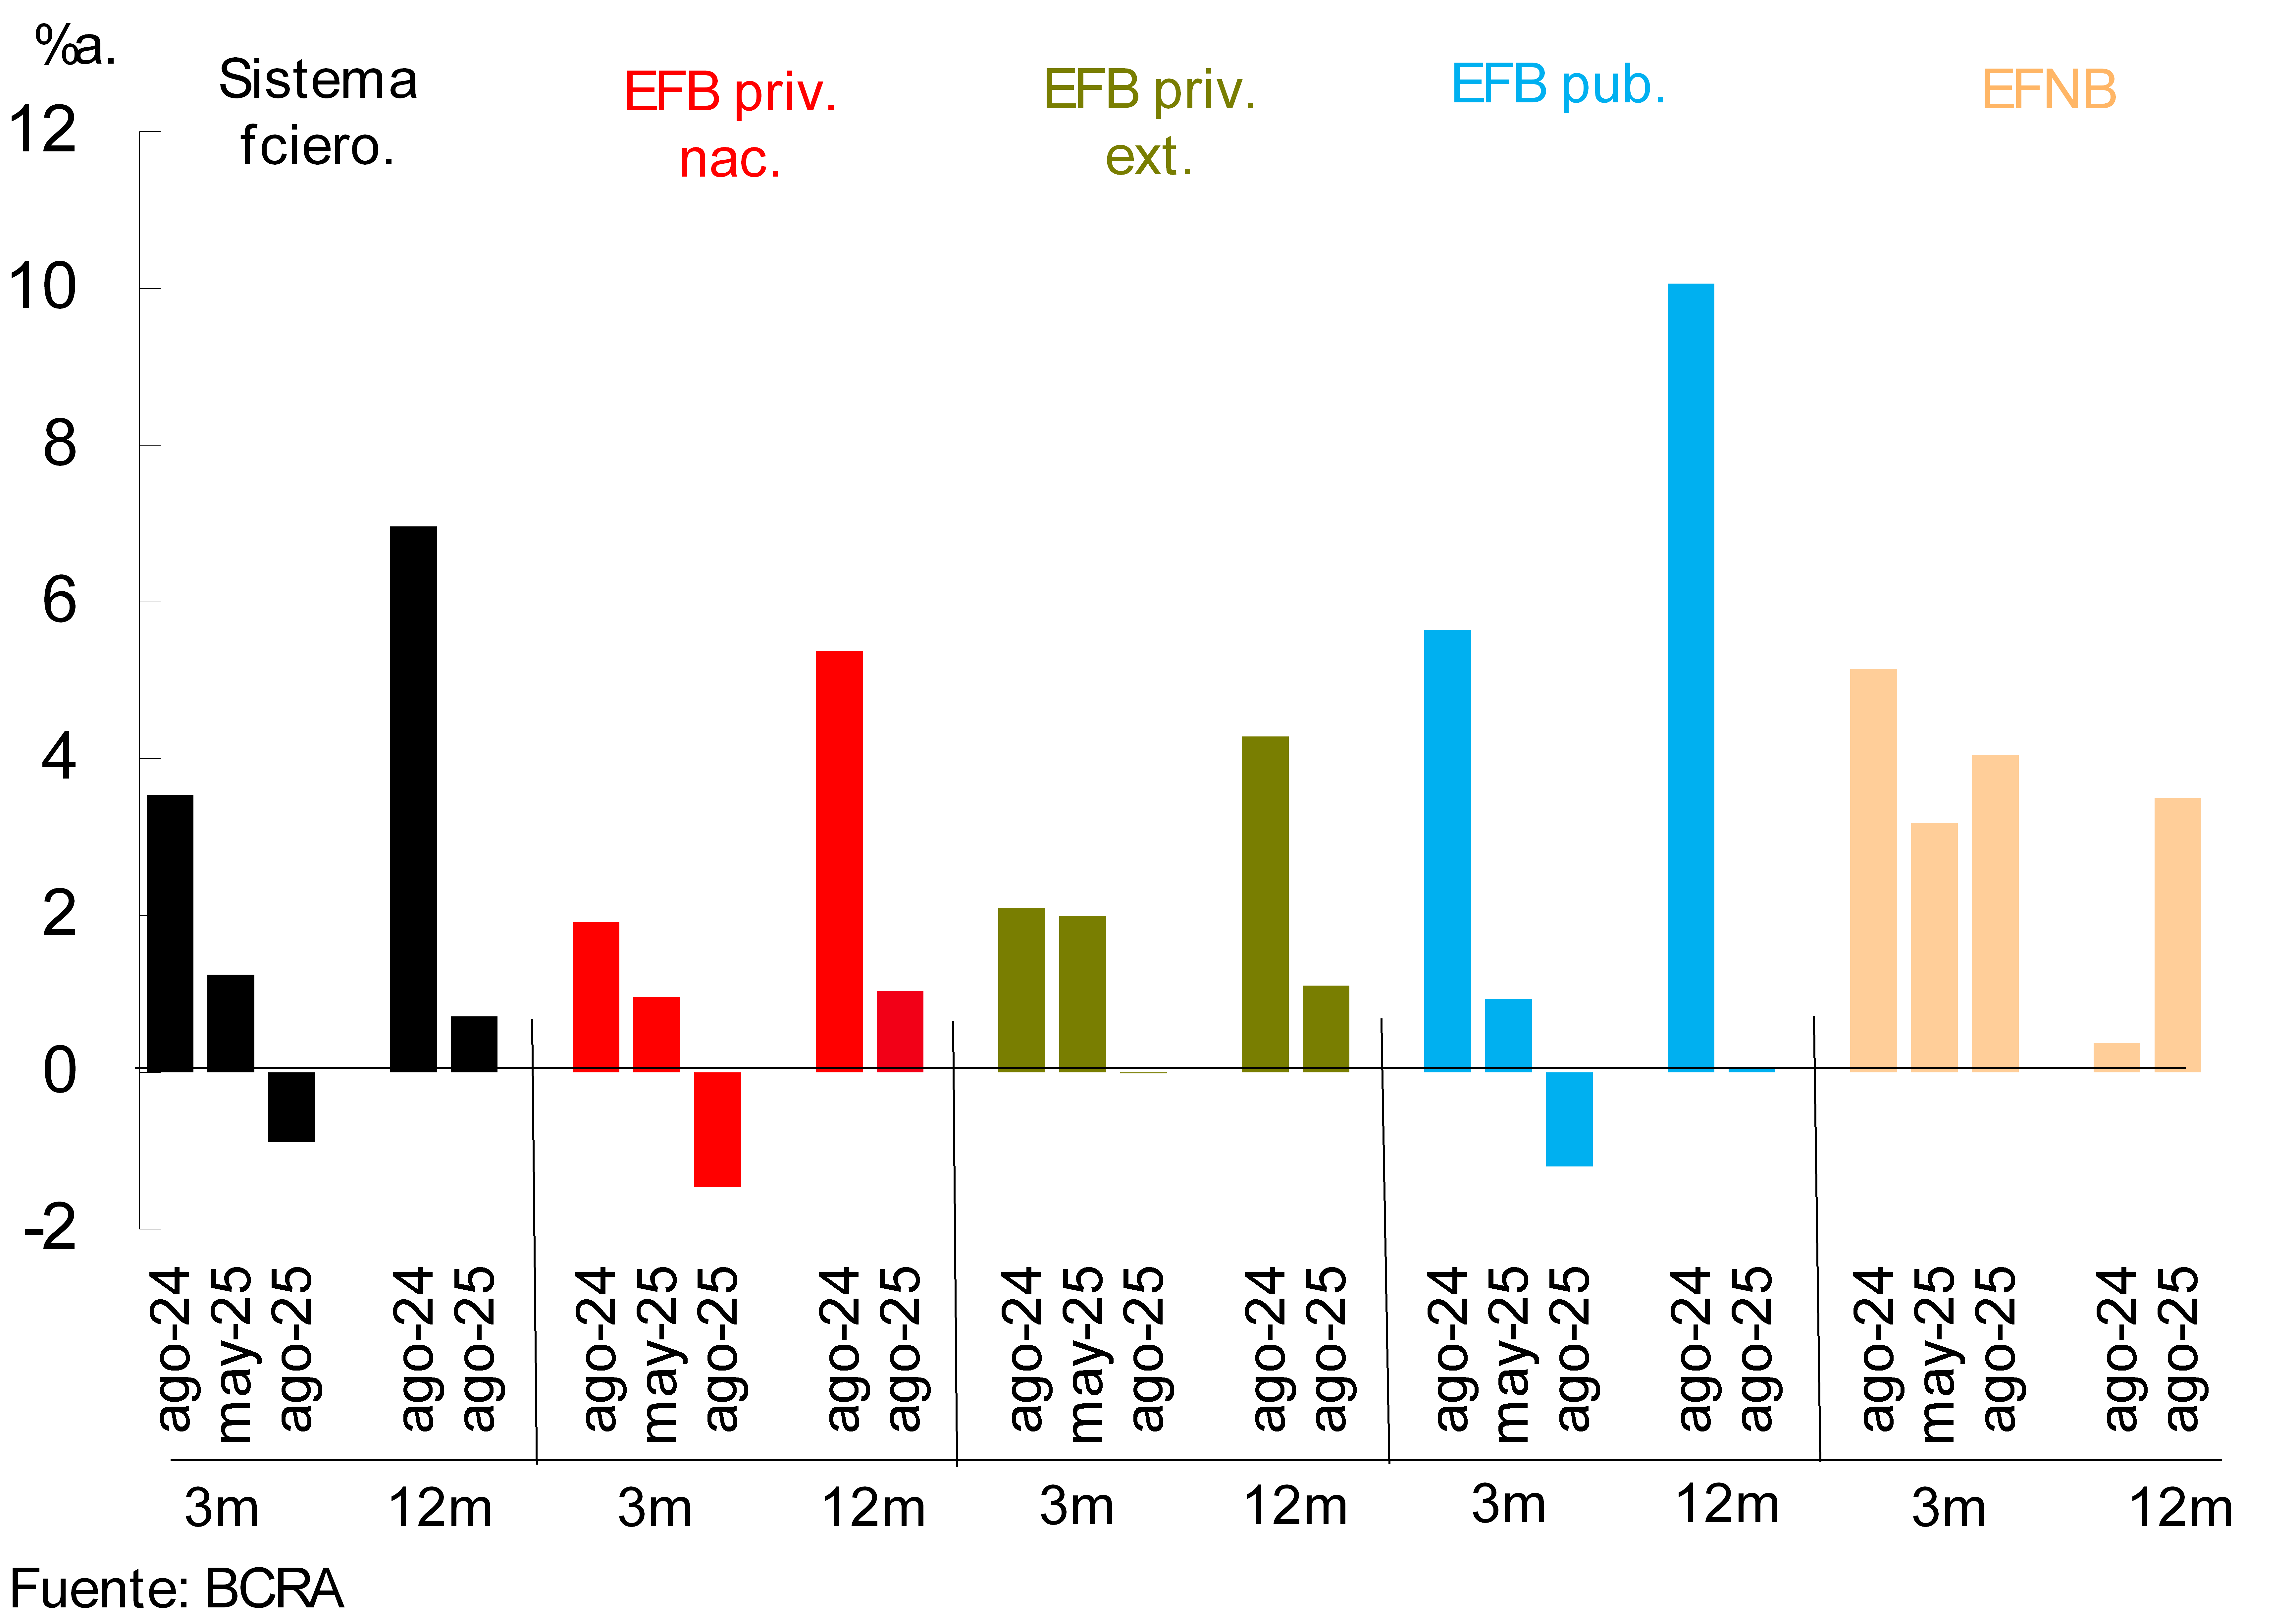
With regard to the profitability of the financial system, in the last 12 months to August, the group of entities presented positive results – comprehensive and measured in homogeneous currency – equivalent to 0.7% of assets (ROA) and 2.9% of equity (ROE). Both indicators were below the levels observed a year ago (see Chart 12). This performance was mainly explained by a reduction in the real comprehensive financial margin (lower gains on CER adjustments, premiums on passes and securities, partially offset by lower interest outflows on deposits and lower losses on monetary results); an effect that was tempered by a decrease in tax and administrative expenses.
Figure 12 | 3 and 12 months
cumulative ROA By financial institution group
V. Payment system
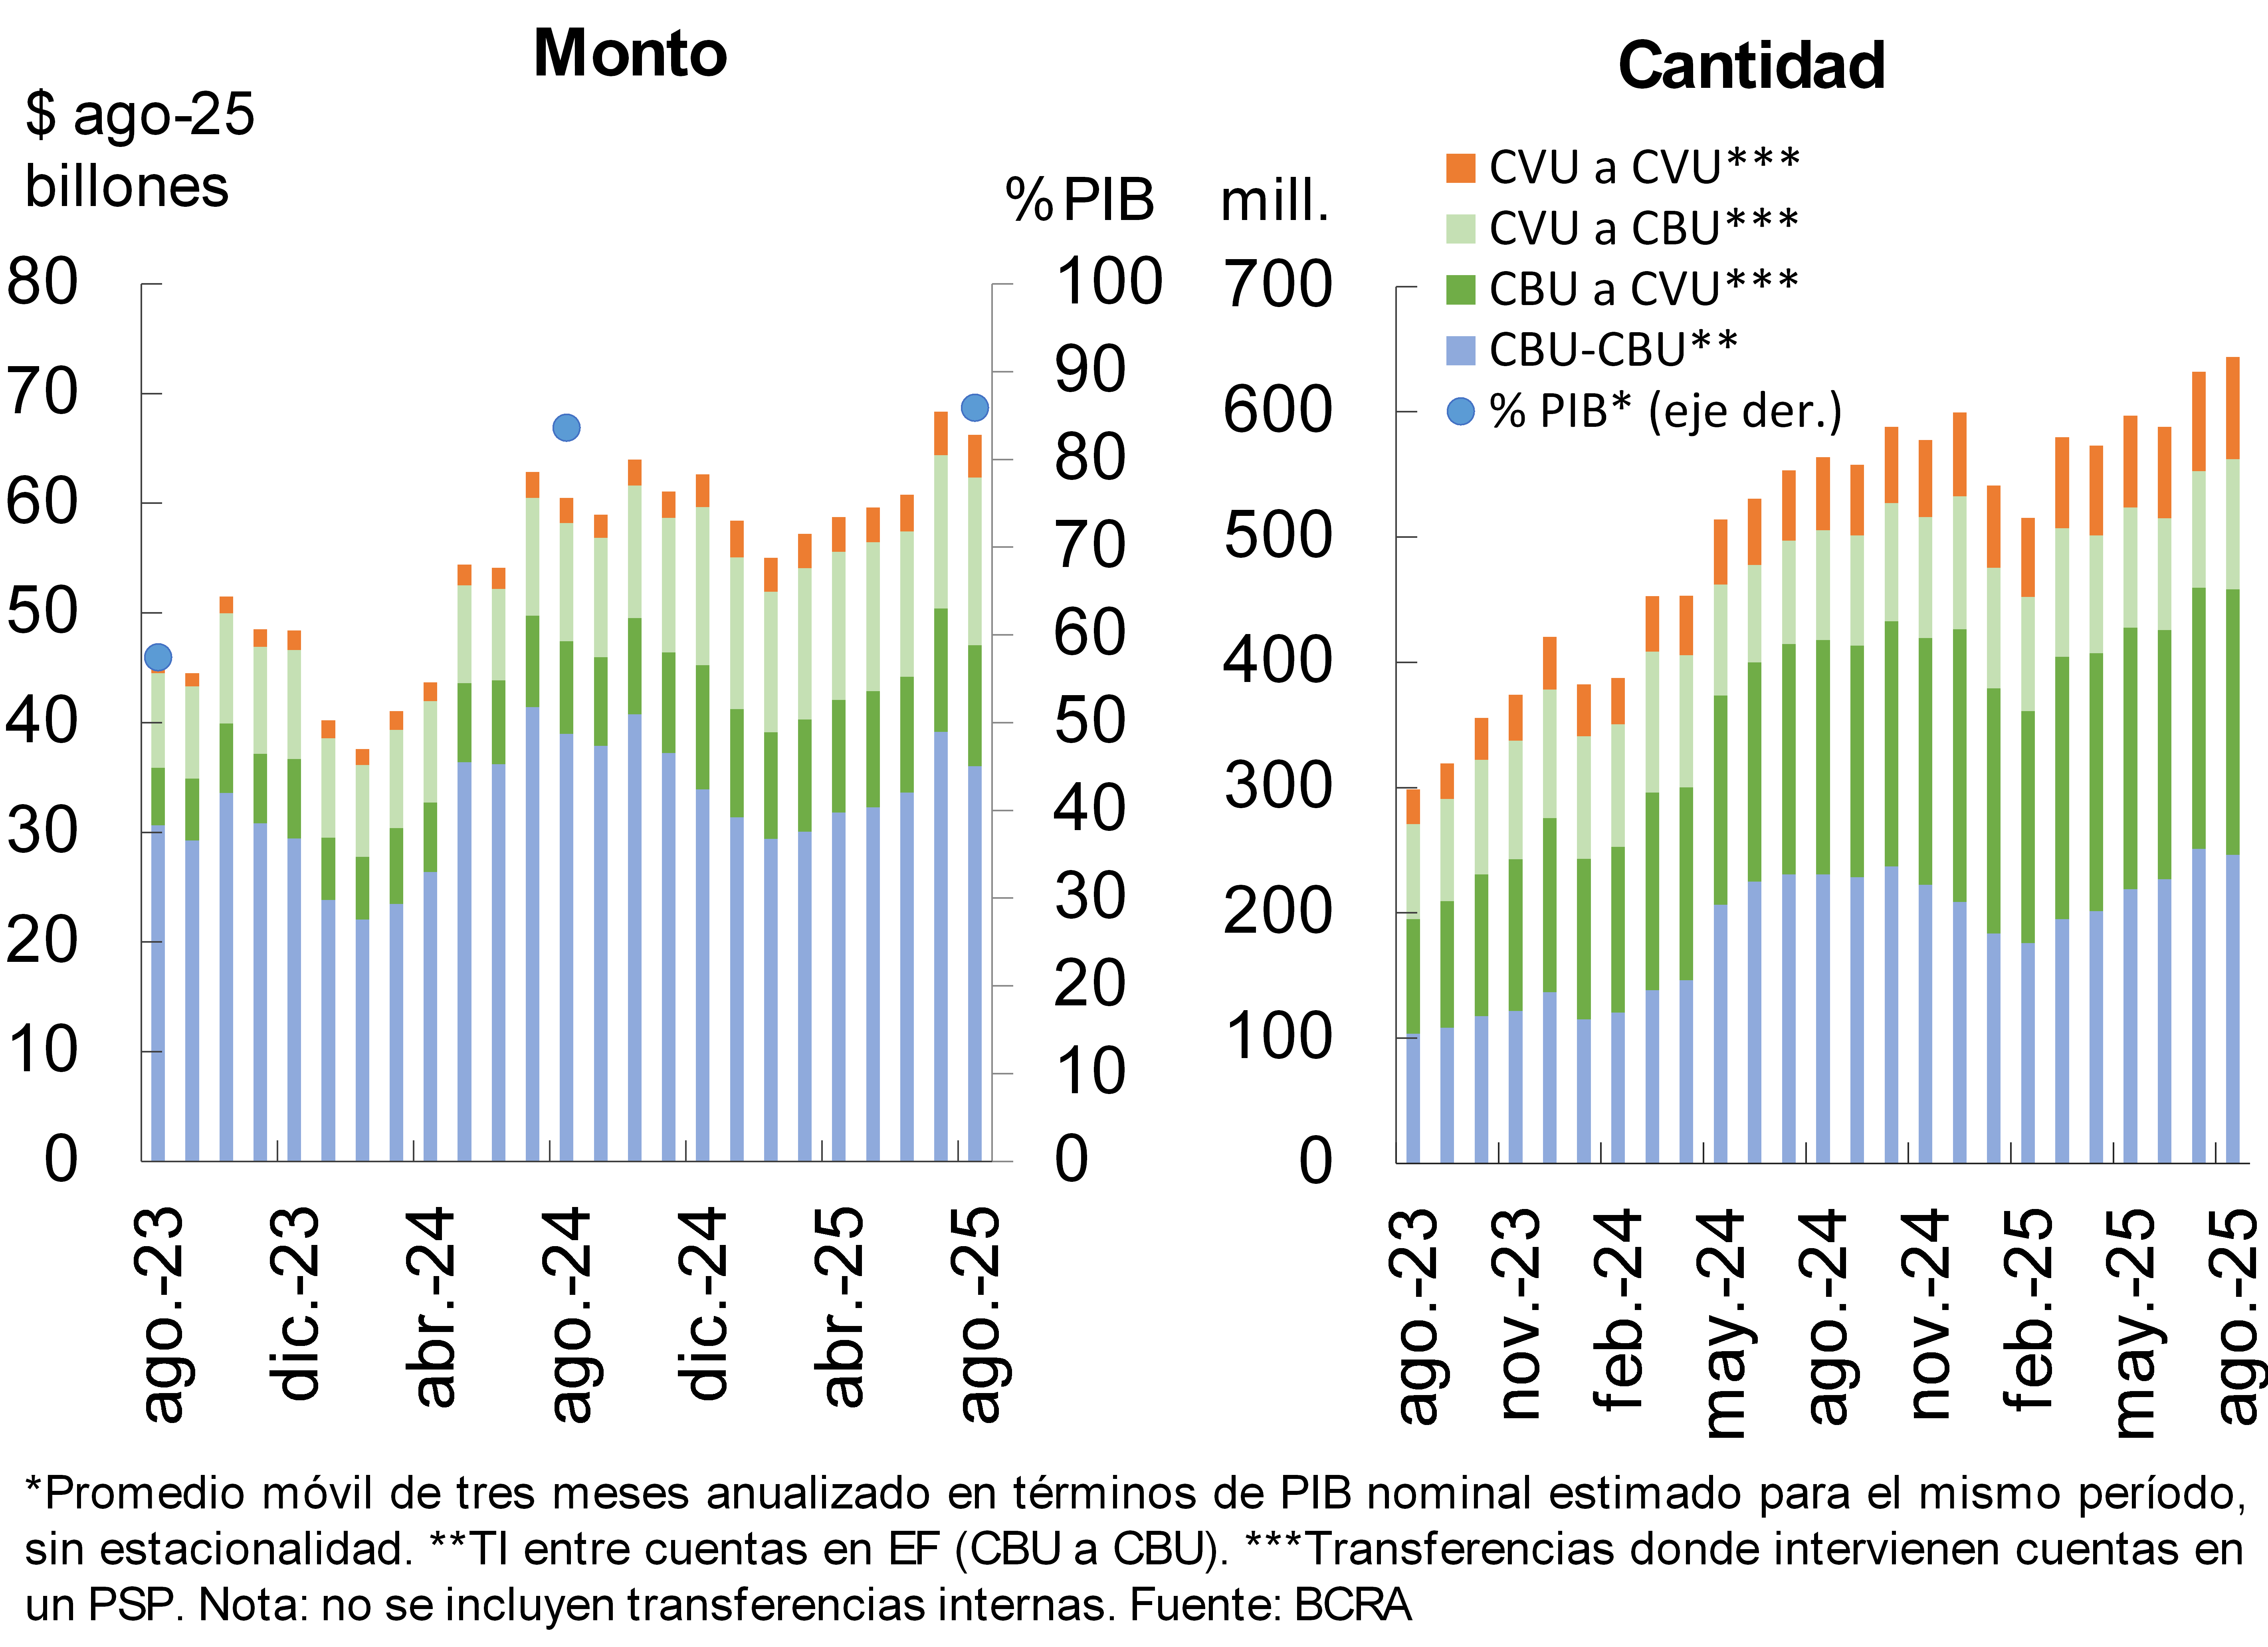
In the month, immediate transfers (TI) increased in amounts (1.9%) and decreased in real amounts (-3.1%). Compared to the same month in 2024, IT grew 9.5% in real amounts and 14.2% in quantities (see Chart 13). When broken down by modality, the greatest year-on-year dynamism of IT – amounts in real terms – was verified in the operations carried out in which CVUs are involved (from CVU to CVU: 70.1%; from CVU to CBU: 41.7% and from CBU to CVU: 30.7%), while IT between two CBUs of different entities exhibited a decrease (-7.6%). 89 It is estimated that the amount of IT traded in the last three months (annualized) represented 85.9% of GDP, increasing 2.3 p.p. y.o.y.
In the month, Payments with Transfers via QR code increased (4.4% in amounts and 1.4% in real amounts). 10 In the year-on-year comparison, there were increases of 57.1% in operations and 73.4% in real amounts. These payments (three annualized months) represented approximately 1.7% of GDP, increasing 0.6 p.p. compared to a year ago.
Chart 13 – Immediate Transfers (IT)
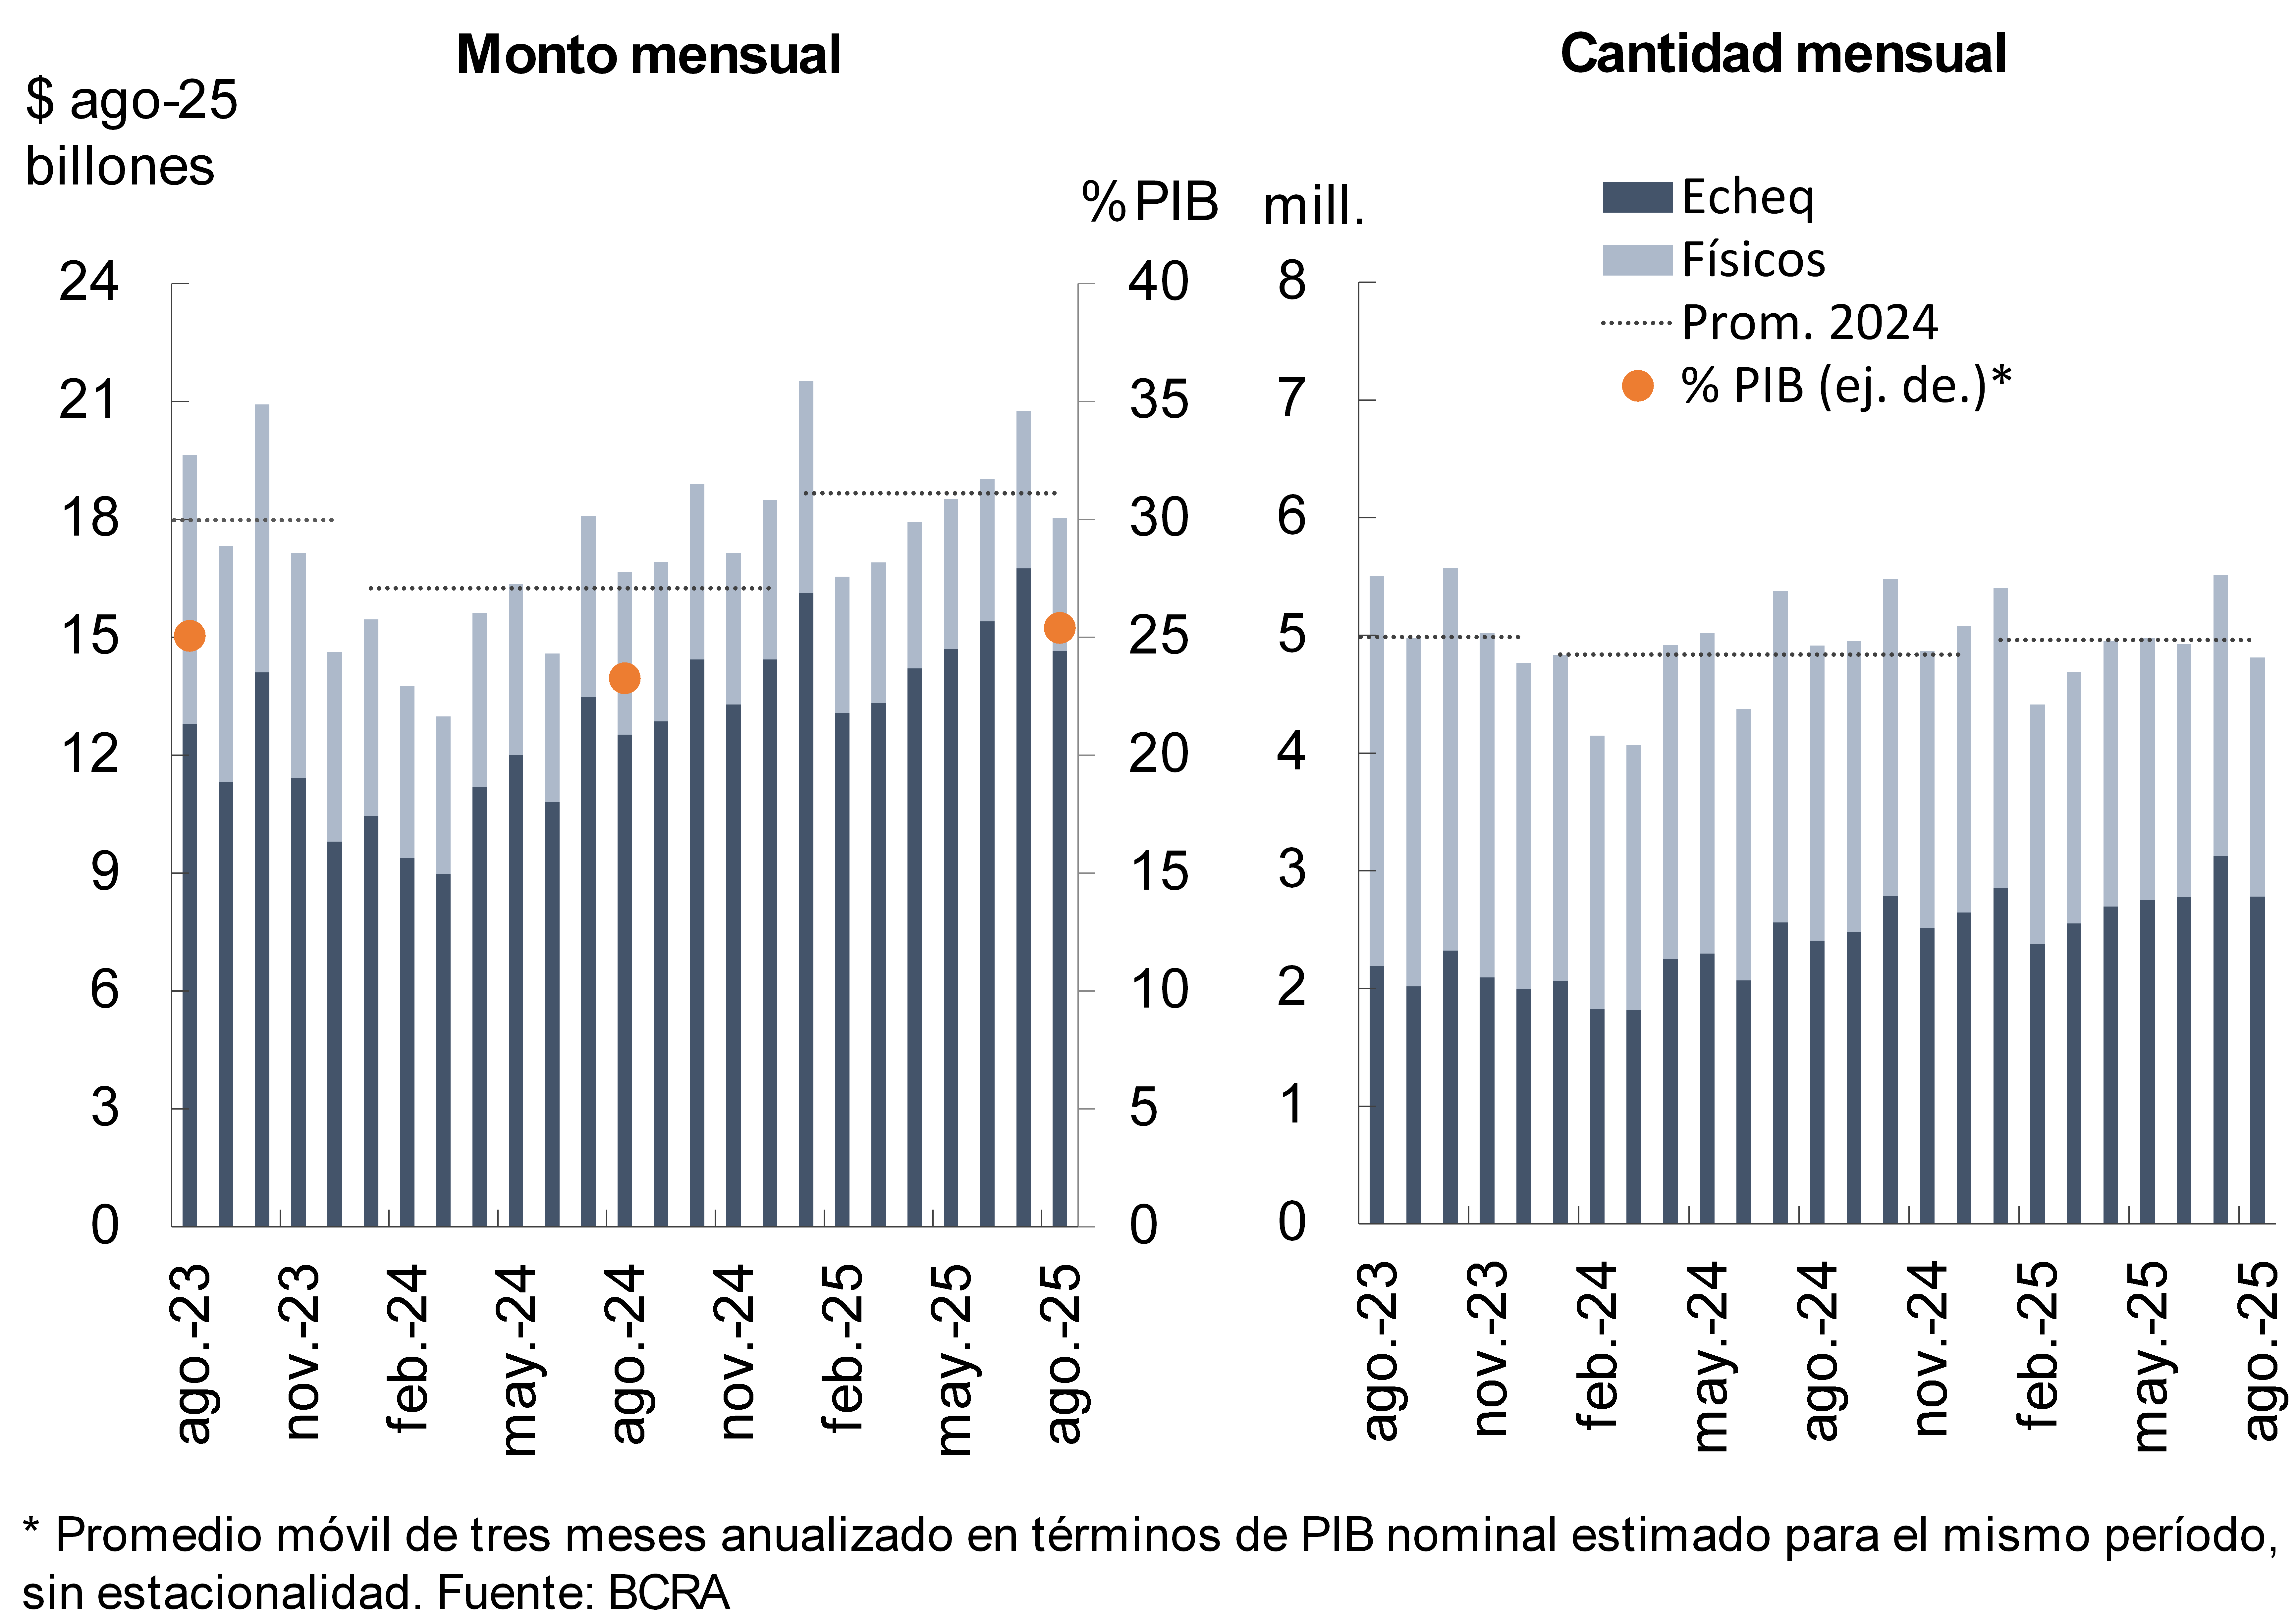
In August, the clearing of checks was reduced compared to July. In the year-on-year comparison, the clearing of checks increased in real amounts (8.3%), while it decreased slightly in amounts (-2.1%, see Chart 14). 11 When distinguishing by format, the compensation of ECHEQs grew 15.6% YoY in quantities and 17% YoY in amounts, while physical checks decreased (-19% YoY in amounts and -18% Real YoY in amounts). As a result, ECHEQs continued to gain ground: as of August, they accounted for 57.8% of the total offset in quantities (+8.8 p.p. y.a.) and 81.2% in amounts (+6 p.p. y.o.y.). Overall, the value of checks cleared in the last quarter (annualized) to August was equivalent to 25.4% of GDP, increasing 2.1 p.p. compared to a year ago. For its part, in August the ratio of checks rejected due to lack of funds over the total cleared stood at 1.49% in amounts and 1.15% in amounts. Both values were slightly higher than those of July (+0.08 p.p. and +0.03 p.p., respectively). Current levels increased in a year-on-year comparison: +0.84 p.p. in quantities and +0.75 p.p. in amounts.
Graph 14 : Check clearing
References
1 Mainly current account at the BCRA, within the framework of the modifications in the minimum cash standard. For more details, see the Regulatory Annex for July and August.
2 Financing to companies includes those granted to legal entities and commercial financing granted to individuals. On the other hand, loans to families are considered to be those granted to individuals, unless they are for commercial purposes.
3 All groups of entities have a higher exposure to the private sector than to the public sector.
4 See footnote 1.
5 See footnote 1.
6 It considers availabilities (cash and current account at the BCRA), net active operations with the BCRA, the balance of the types of public securities that the entities compute as integration of Minimum Cash and the holdings of LECAP maturing in the next 3 months (until June 2025 it considered the fiscal liquidity bills -LEFI-).
7 For the segment in national currency, the ratio stood at 1.6 in August for the median of Group A, 0.1 above the level of July.
8 In year-on-year terms through August, the amount of IT among CVUs increased 39.7%, while those among CBUs grew 6.7%. On the other hand, CBU to CVU operations and vice versa also registered increases (13.5% YoY for the first case and 18.5% YoY for the second).
9 In August, the average value of IT was $102,900.
10 In August, the average value of PCTs through QR codes was $19,300.
11 In August, the average amount of cleared checks was $3.75 million (physical format: $1.67 million; ECHEQs: $5.27 million).
Share on


