I. Financial intermediation activity
As can be seen from the aggregate bank balance,1 the most relevant sources of nominal resources in national currency in August were the increase in public sector deposits and the reduction in the balance of the current accounts that banks have with the BCRA. To a lesser extent, the increase in relatively smaller private sector deposits (less than $20 million) and the reduction in LELIQ holdings contributed. On the other hand, the increase in financing to the private sector and the decrease in the largest private sector deposits (greater than $20 million) were the main uses of funds in pesos for the system’s aggregate during August (see Graph 1).
Graph 1 | Aug-19 Cash Flow Estimate
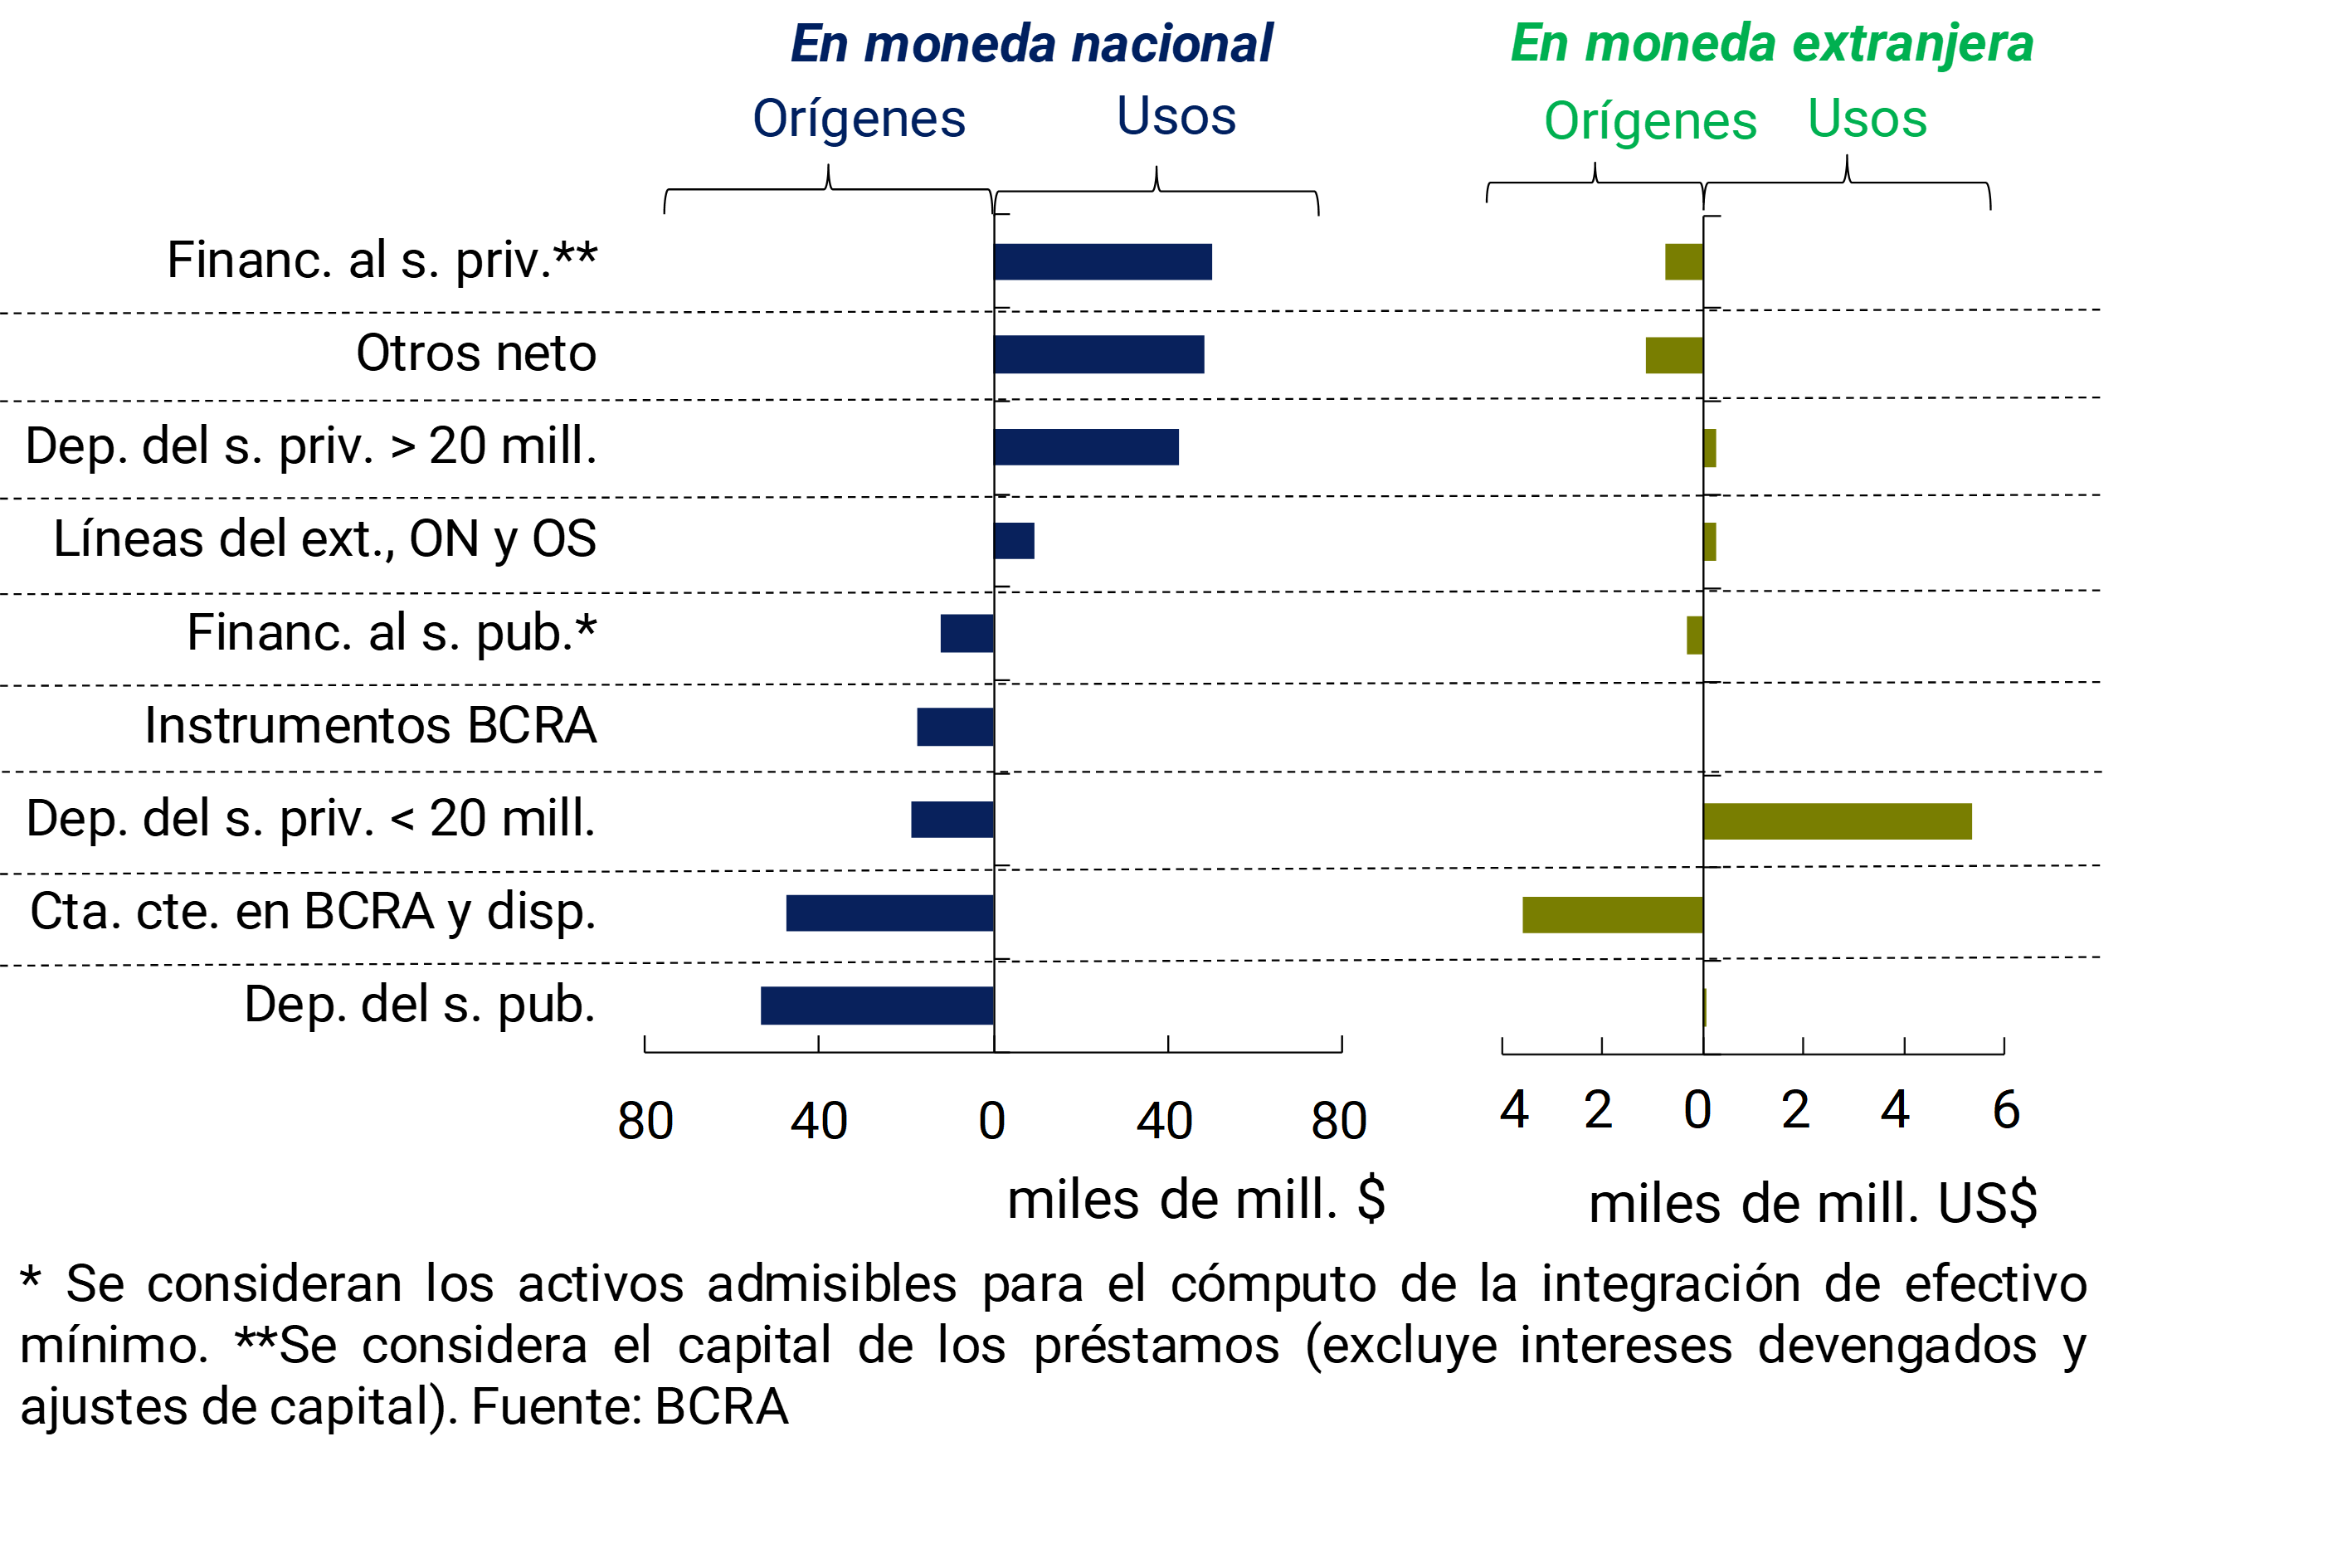
According to the estimate of the monthly flow of funds for items in foreign currency, in August banks faced the withdrawal of deposits from the private sector mainly with the available liquid resources. To a lesser extent, the monthly decline in credit to the private sector was another source of foreign currency resources for banks.
In this context, in August the total of bank assets in national currency fell by 3.8% in real terms (without significant changes in nominal terms) and by 13.3% for items in foreign currency (in currency of origin). Thus, given the increase between peak months of the nominal peso-dollar exchange rate,2 the total assets (expressed in pesos) of the financial system increased by 1% in real terms (5% nominal) in August (-13.8% real y.o.y.).
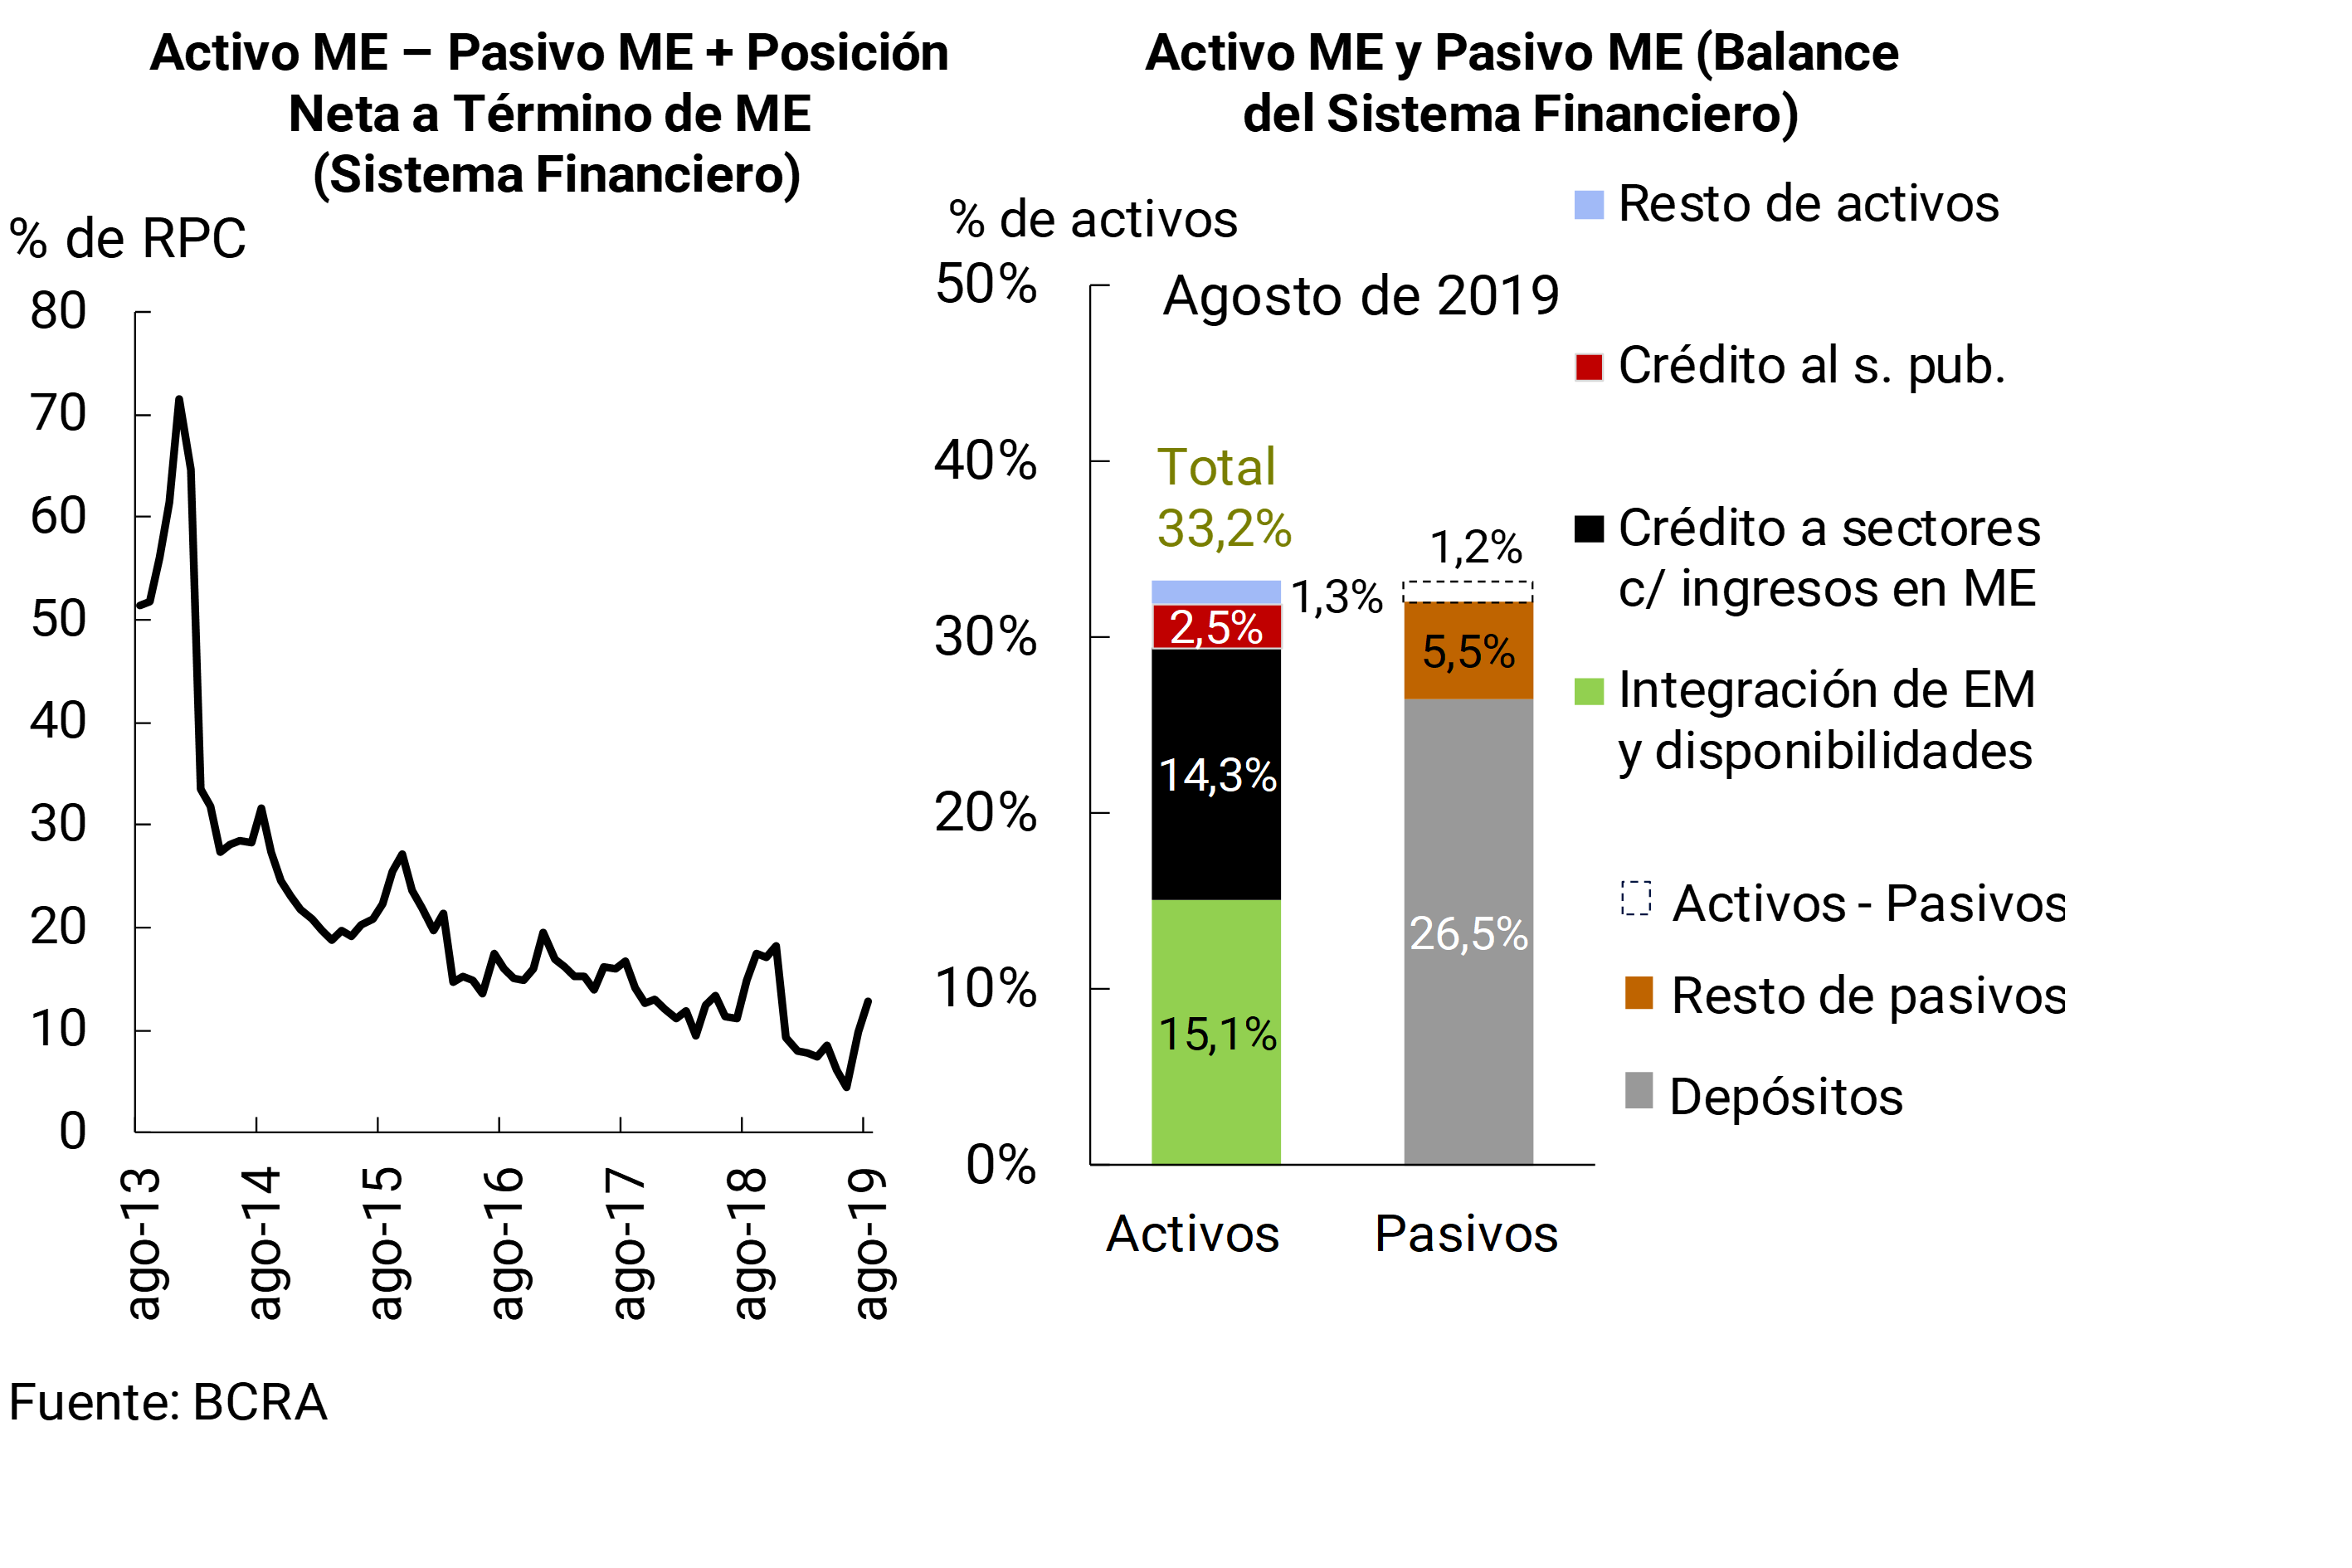
In August, the share of assets and liabilities in foreign currency in the balance sheet of the financial system increased. This performance was mainly explained by the evolution of the exchange rate. In the month, foreign currency assets accounted for 33.2% of the total (+3.3 p.p. more than in July), while liabilities in the same denomination accounted for 32% of total funding (+2.8 p.p. in the month). 88% of the assets in foreign currency were represented by liquidity and credit to debtors with income in the same denomination, while 80% of the funding in foreign currency was explained by deposits (see Chart 2). On the other hand, including forward purchase and sale operations of foreign currency, as of August the spread of assets and liabilities in foreign currency was equivalent to 12.8% of regulatory capital, 3 p.p. more than in July and 2.1 p.p. lower in a year-on-year comparison.
Graph 2 | Assets and Liabilities in Foreign Currency – Financial System
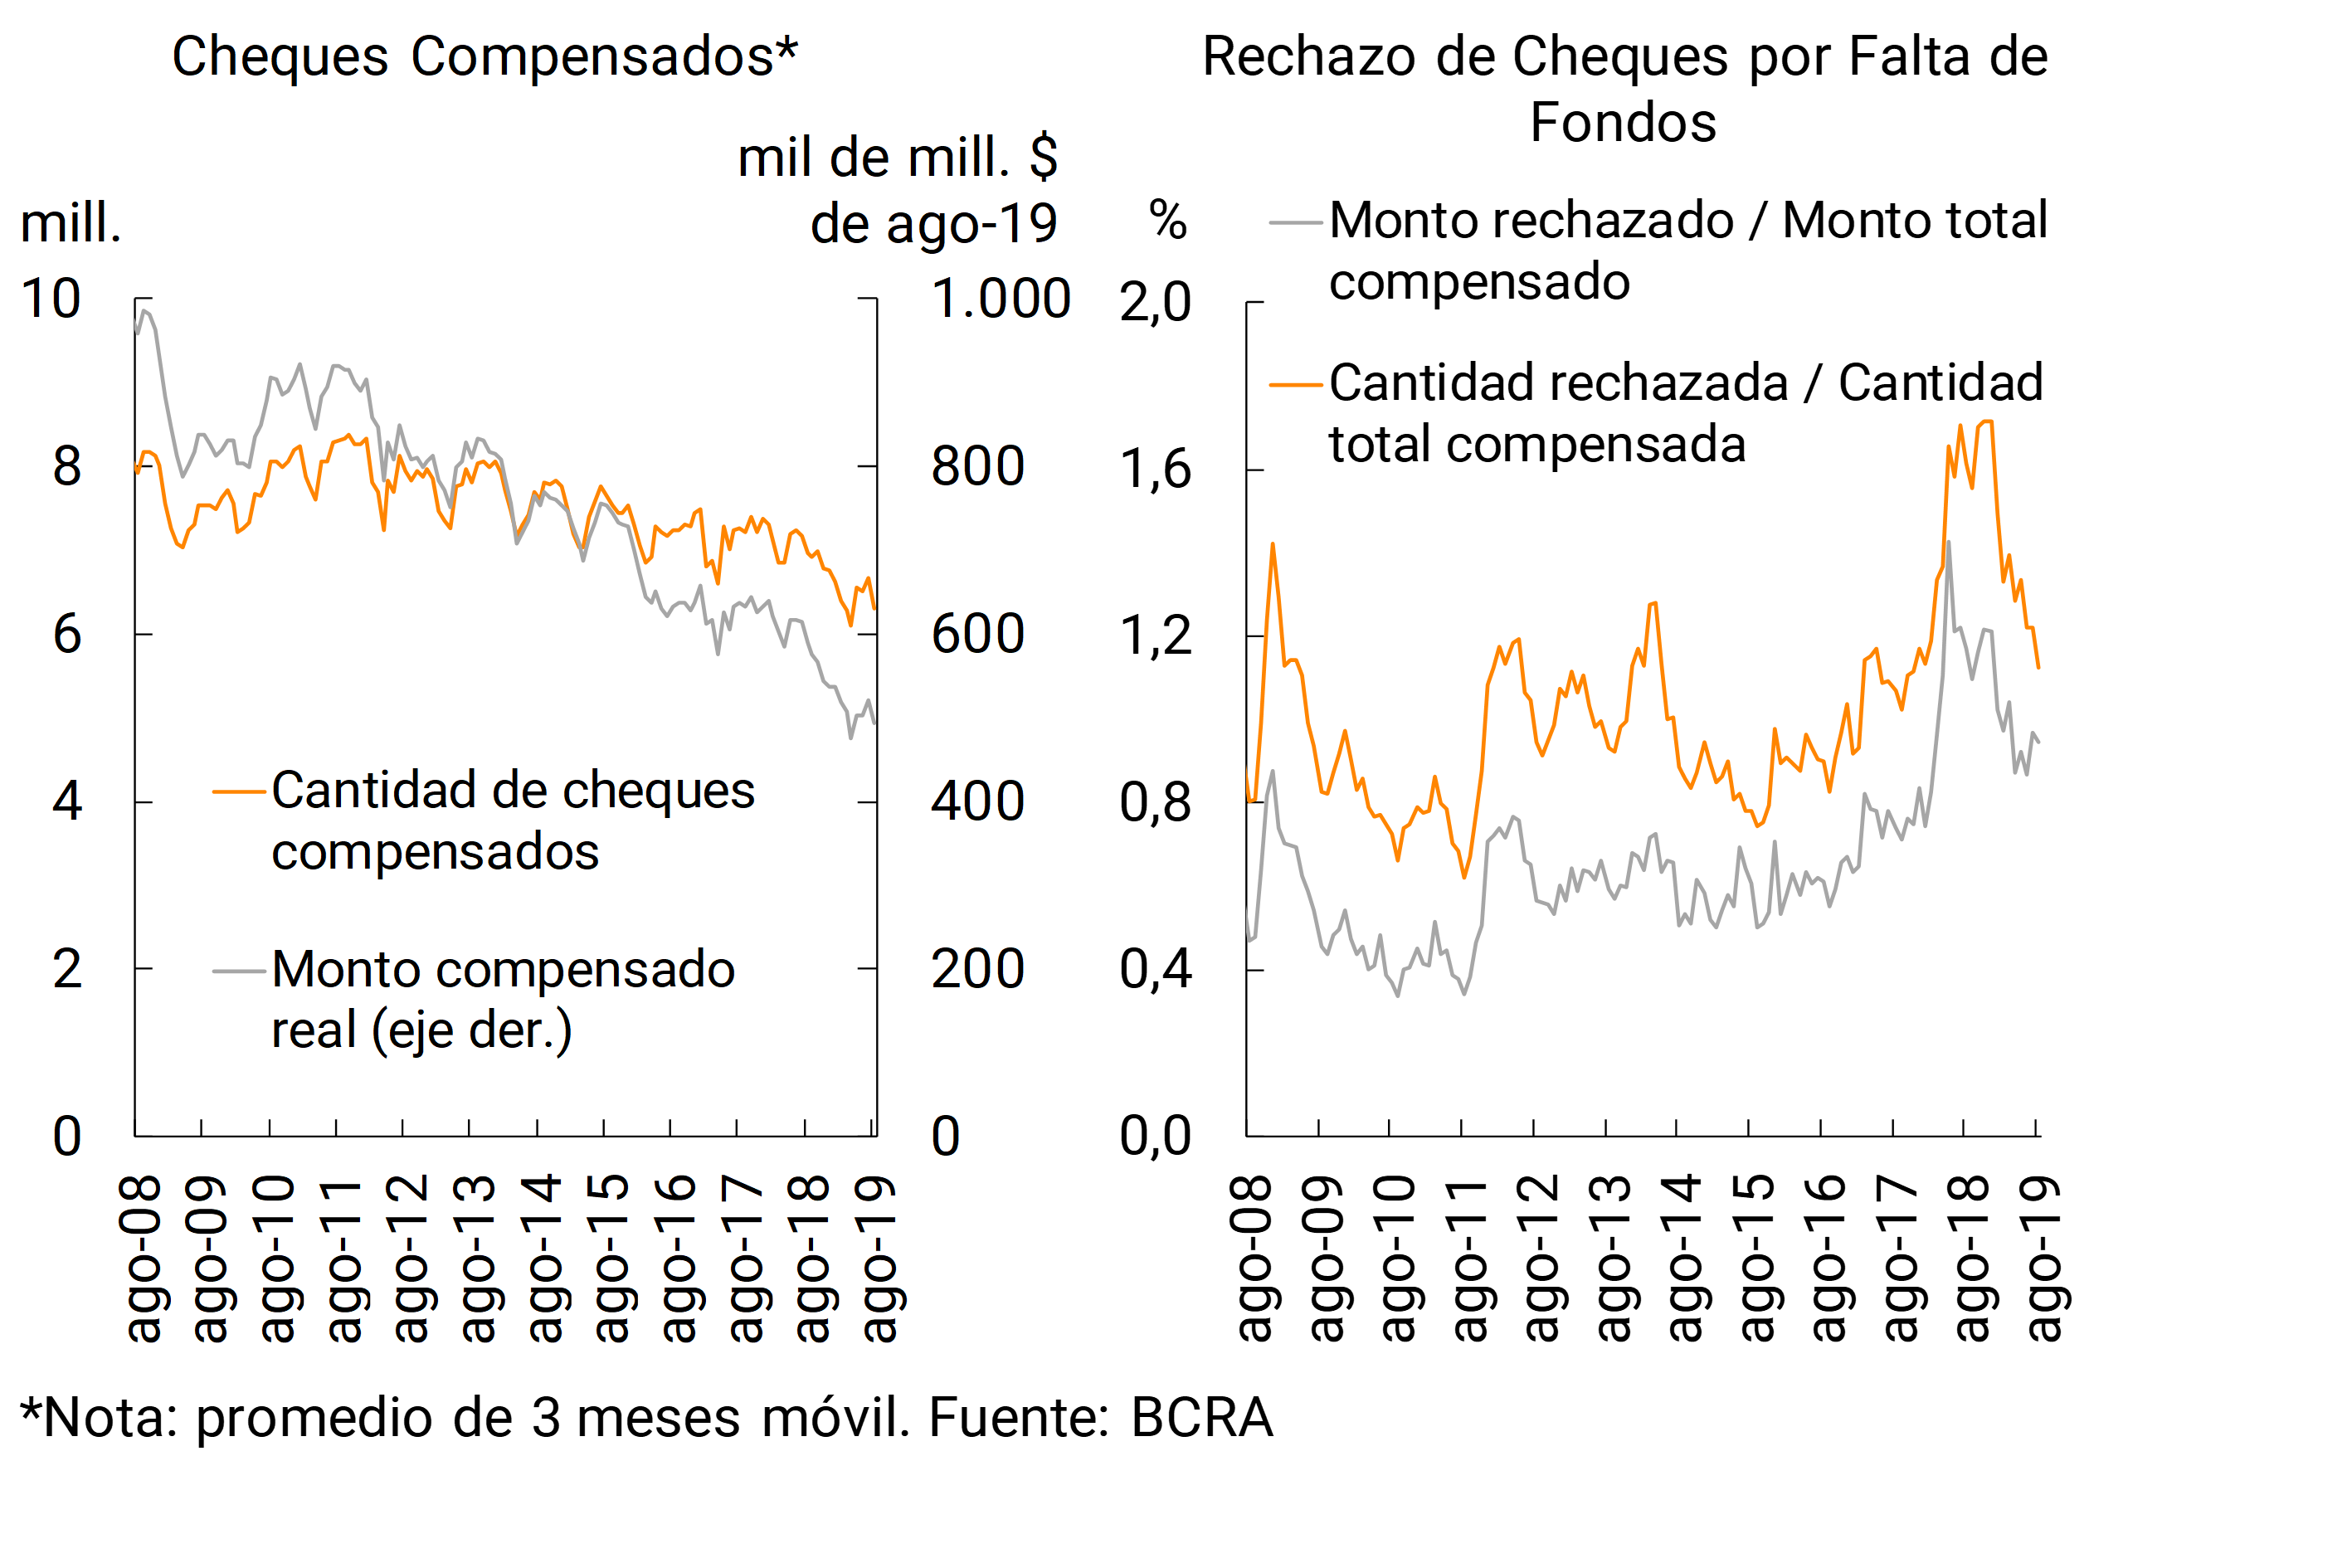
In relation to the operations of the Payment System carried out in August, the daily average of immediate transfers increased 3.7% for amounts in real terms (14.8% y.o.y.) and 5.1% considering the amounts (54.9% y.o.y.) (see Graph 3). For its part, the clearing of checks fell in the month, in line with the downward trend observed in recent years. In August, the number and amount of rejection of checks due to lack of funds remained at levels similar to those of the previous month (1.1% in quantities and 0.9% in amounts, -0.1 p.p. and -0.02 p.p. less than in July respectively), decreasing in a year-on-year comparison (-0.5 p.p. in quantities and -0.2 p.p. in values, see Figure 4).
Graph 3 | Immediate Funds Transfers – Daily Average
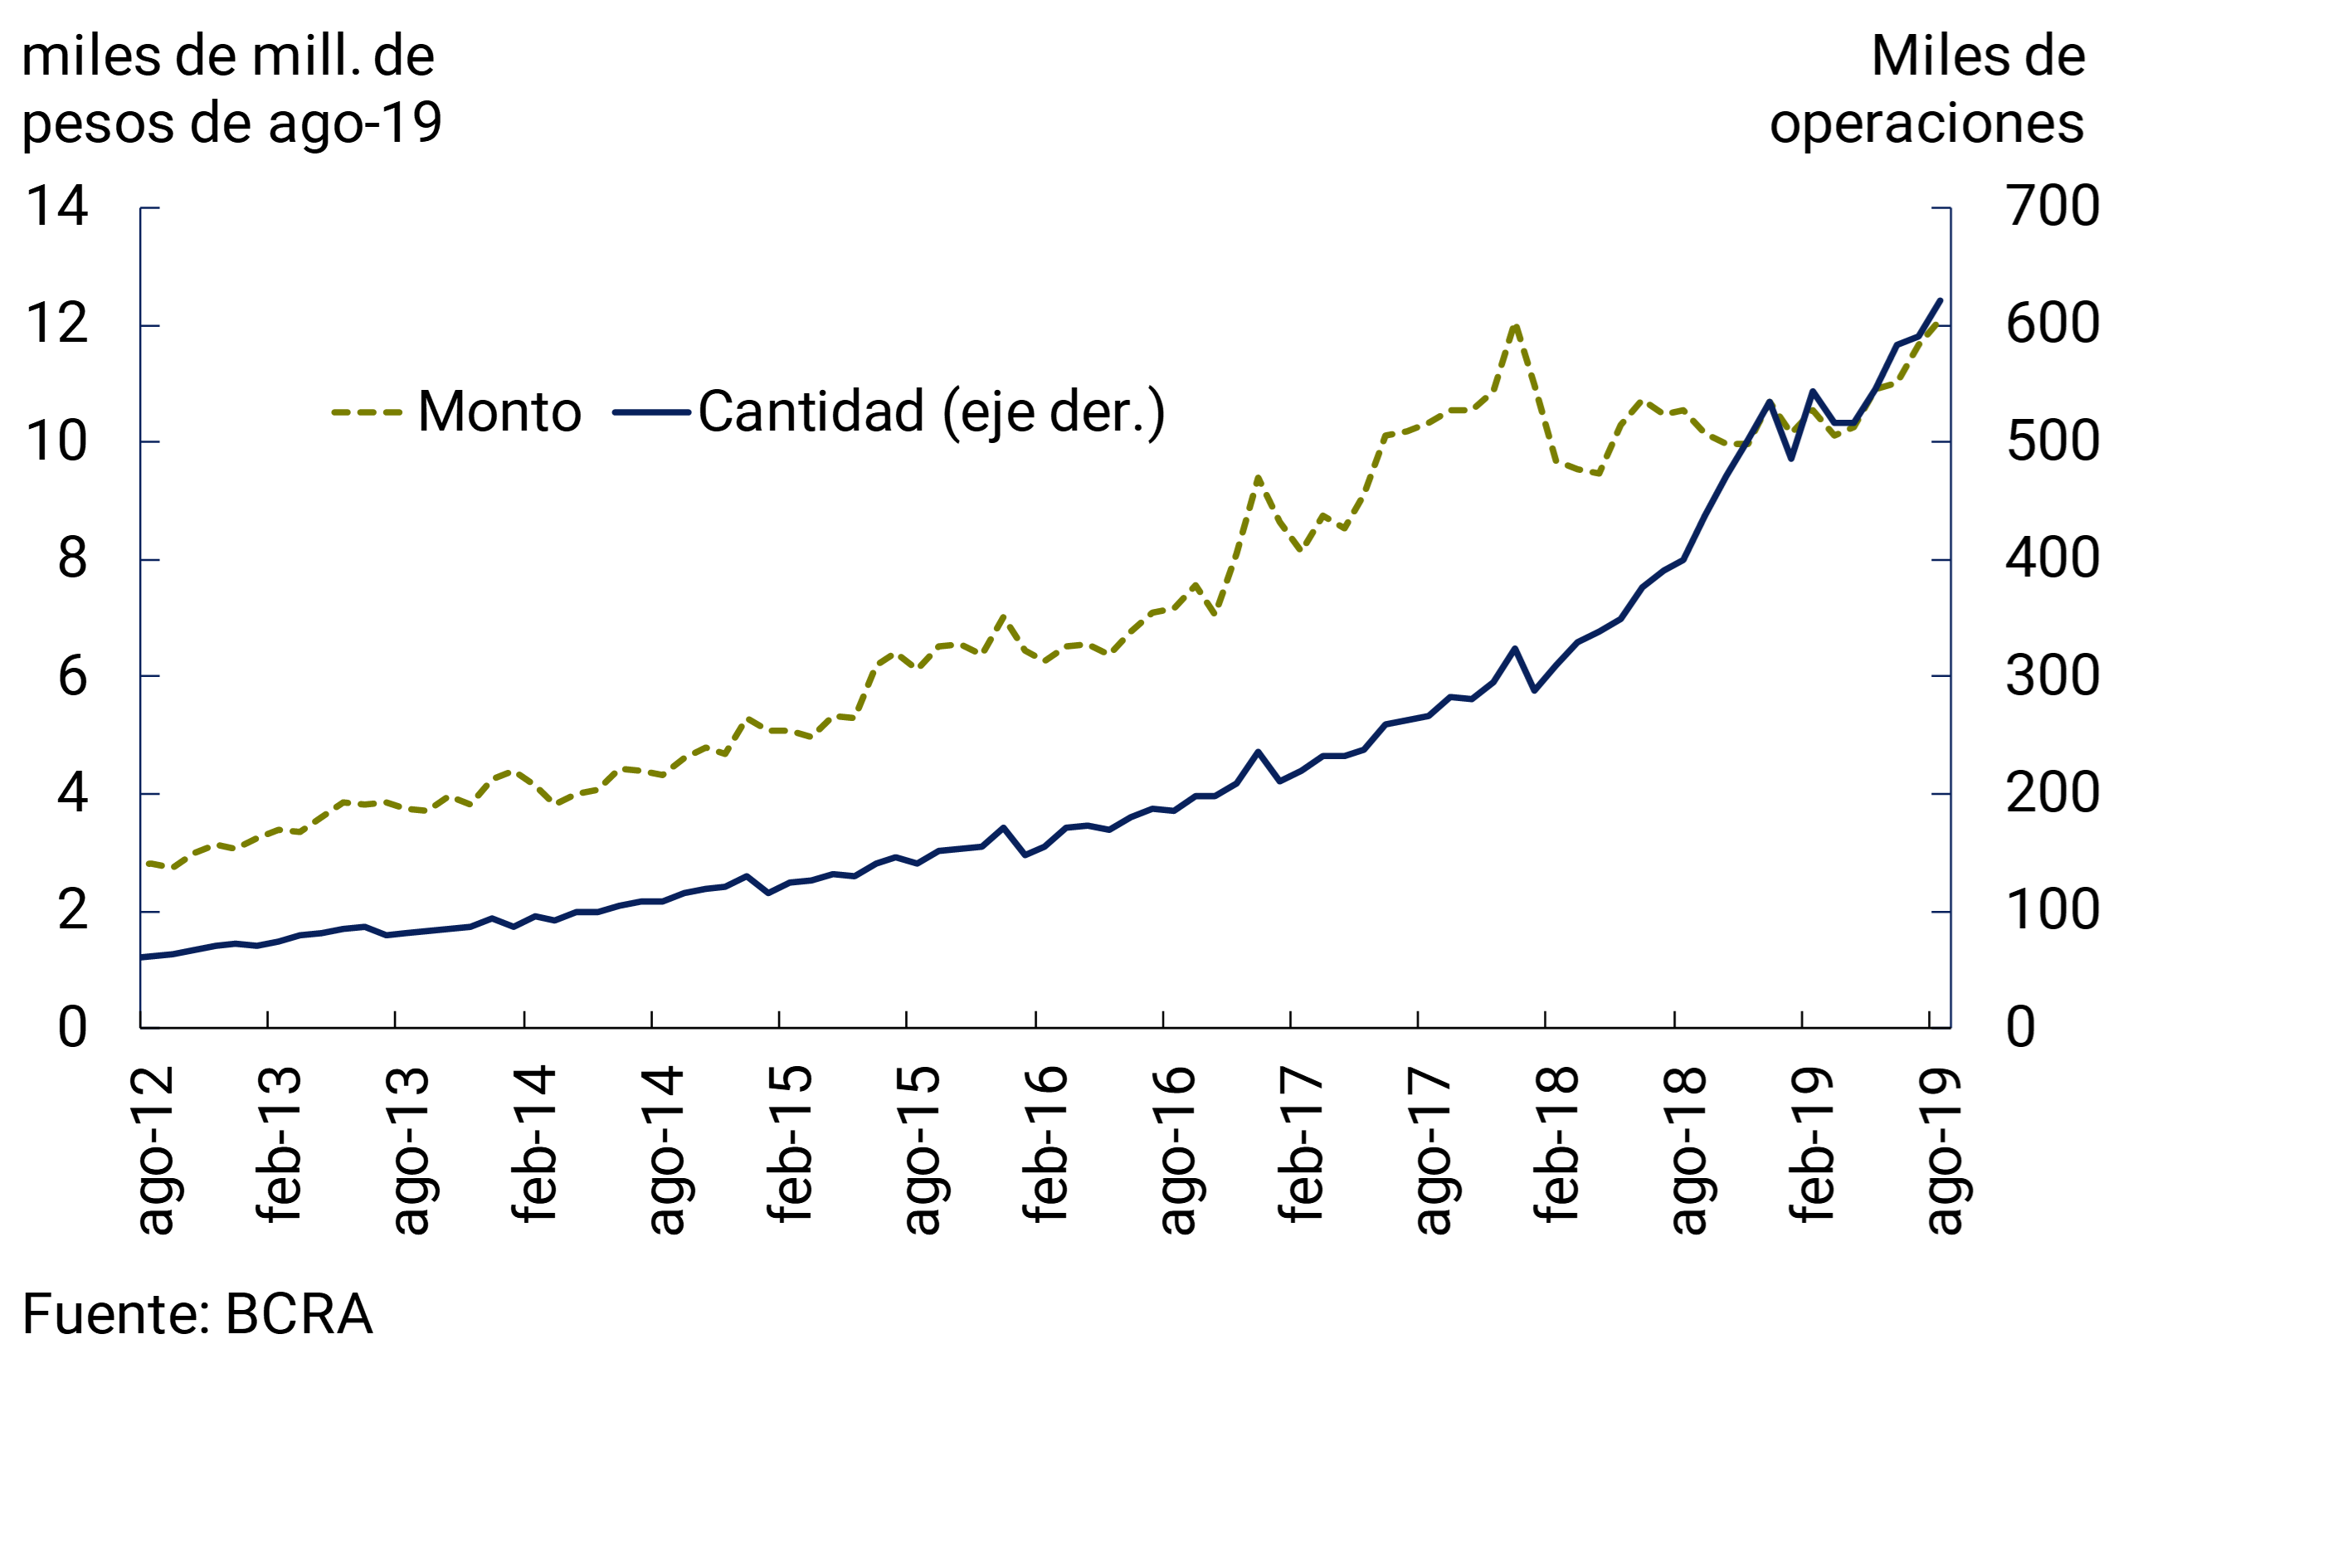
Figure 4 | Check Clearing and Rejection
II. Deposits and liquidity
The balance of deposits in pesos in the private sector fell 4.7% in real terms in August (-1% nominal). This performance was mainly explained by the decrease in relatively larger time deposits (generally of legal entities3) which, in part, was offset by the increase in demand accounts of the same size. This was reflected in the composition of private sector deposits in pesos (see Chart 5). For their part, private sector deposits in foreign currency fell 17.3% compared to last July (in foreign currency), mainly due to the performance evidenced since August 12.
Graph 5 | Estimated Composition of the Private Sector Deposit Balance in Pesos – Financial System
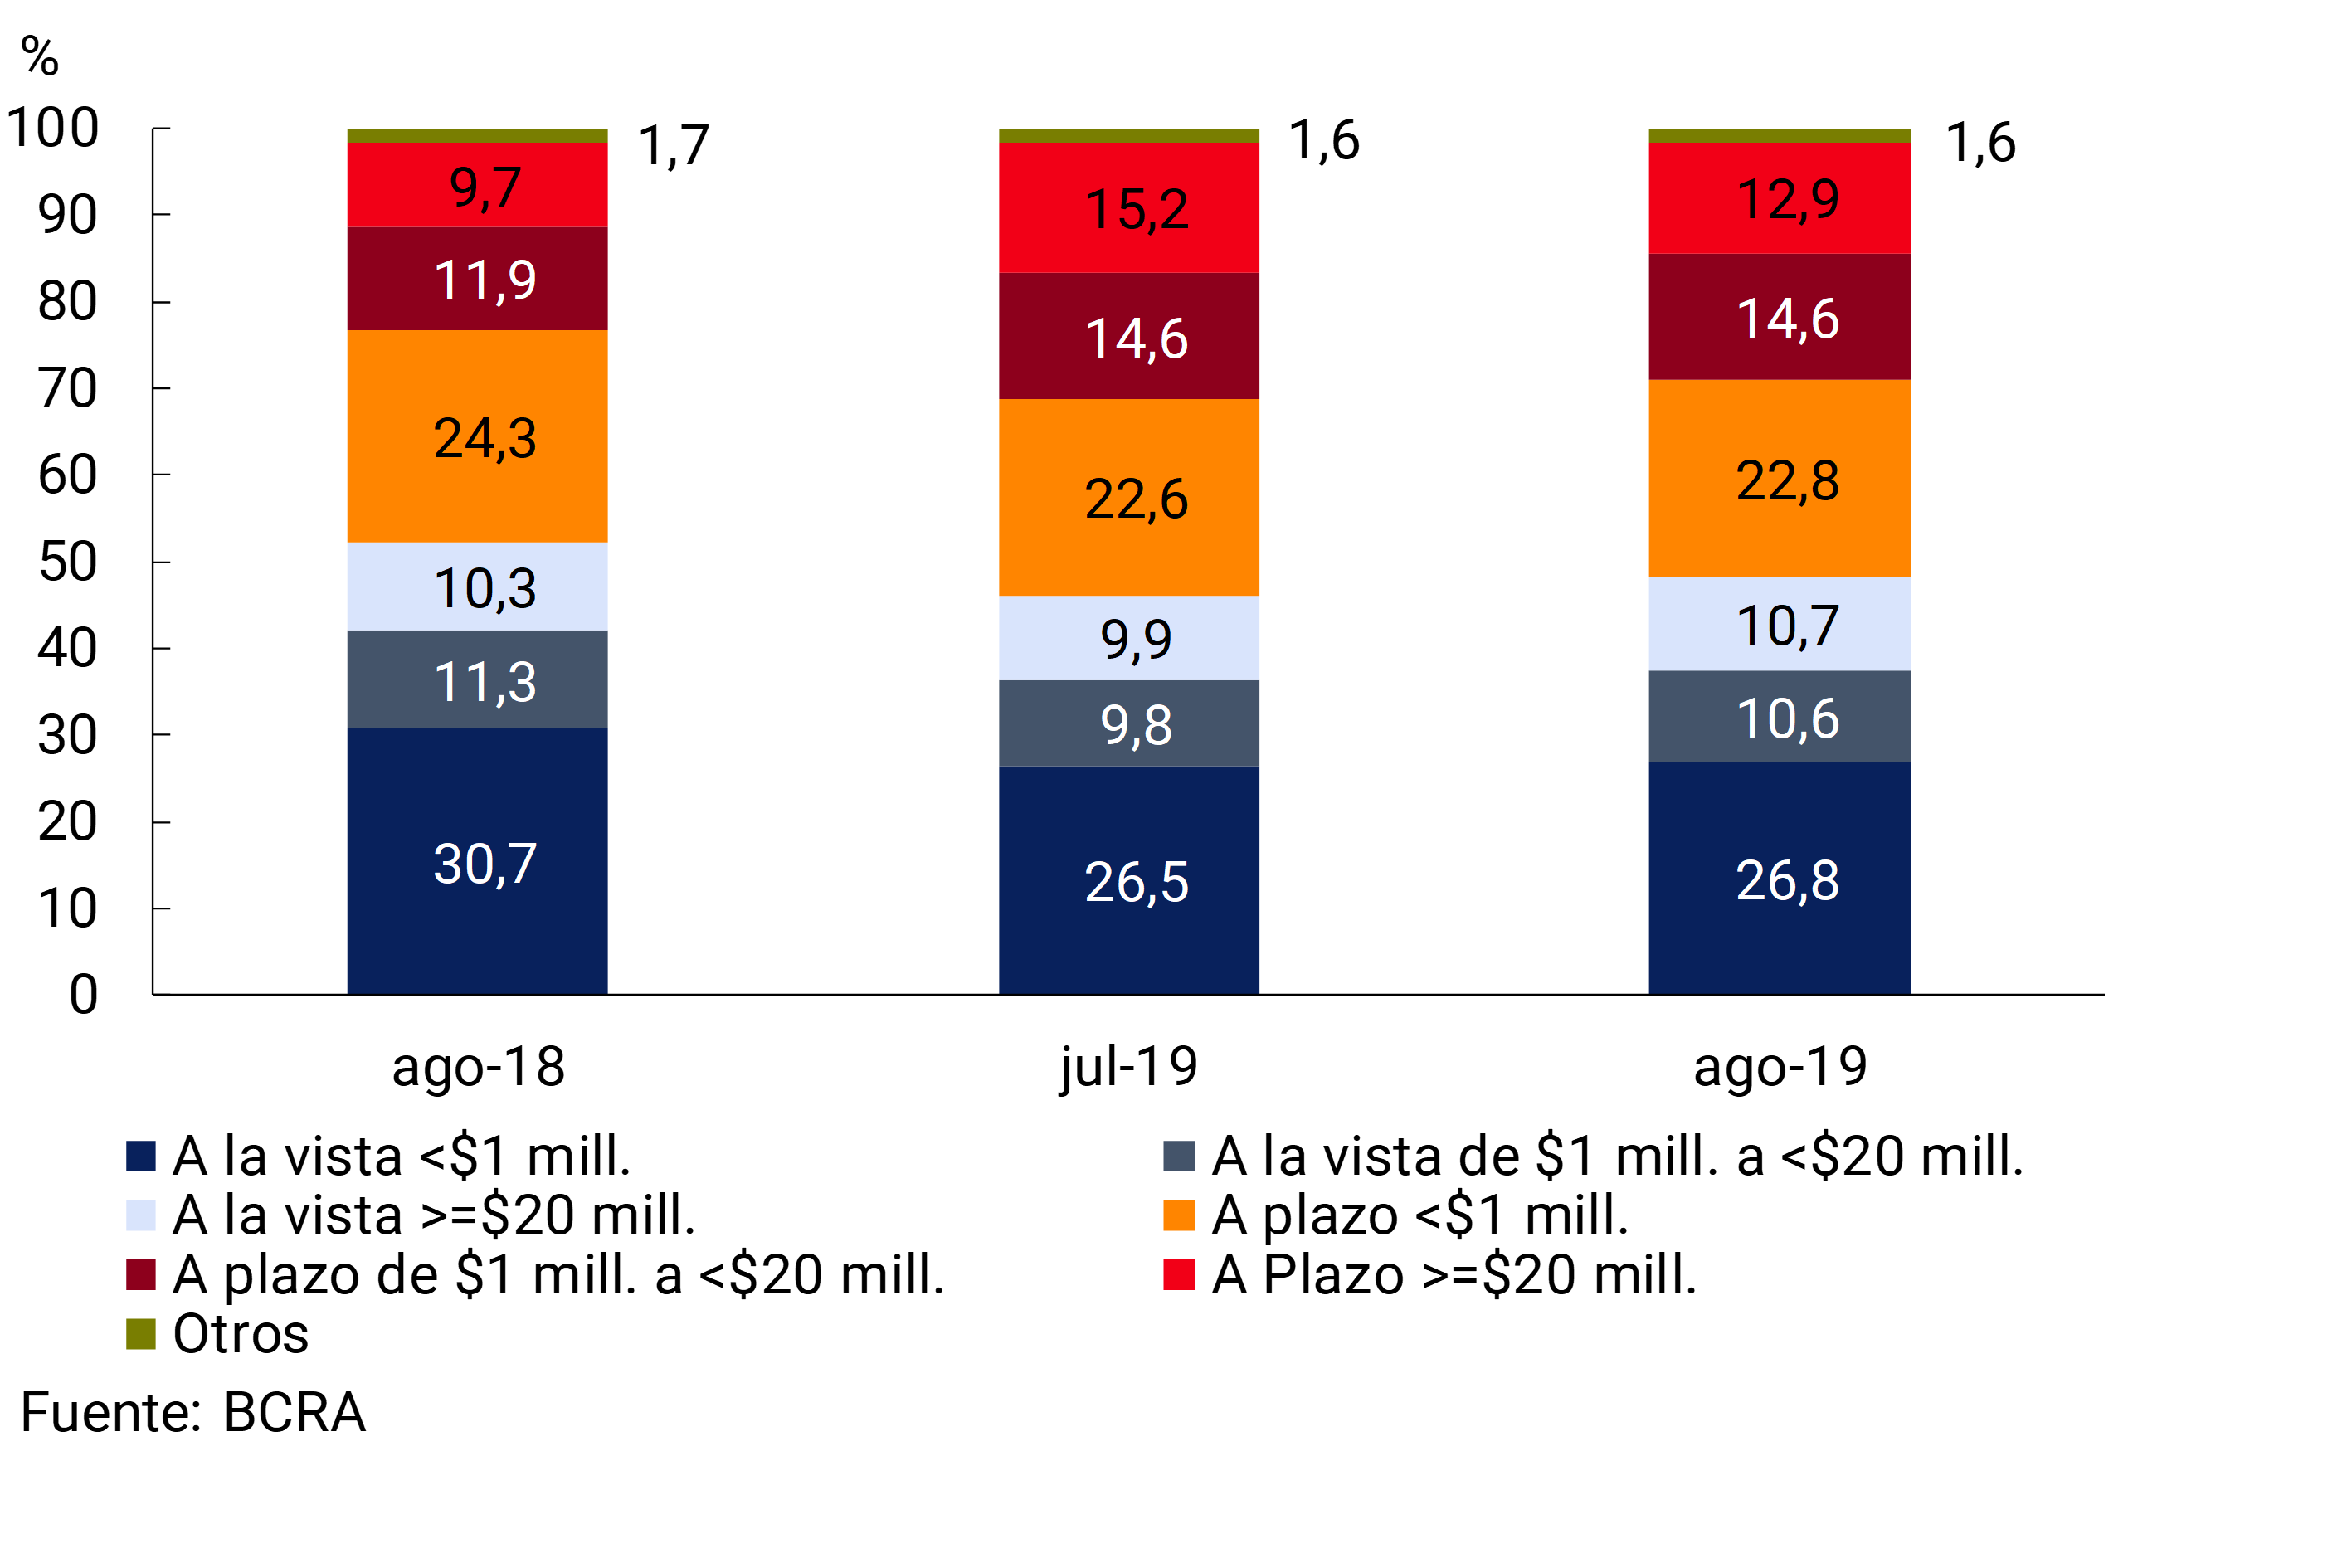
In a year-on-year comparison, the balance of private sector deposits in pesos increased 44.4% in nominal terms and fell by 6.5% in real terms, with an increase in term loans (57.9% YoY in nominal terms and 2.2% YoY in real terms) and a fall in demand accounts in real terms (-14% YoY in real terms). Public sector deposits in national currency also fell in real terms compared to August 2018. Thus, the balance of total deposits in pesos increased by 26.5% YoY in nominal terms and fell by 18.1% YoY in real terms. On the other hand, total deposits in foreign currency fell by 8.1% YoY (in currency of origin) and by 5.7% YoY those arranged by the private sector.
In this context, the balance of total deposits of the private sector represented 60.5% of the total funding – liabilities plus net worth – of the financial system, 0.9 p.p. less than last month.
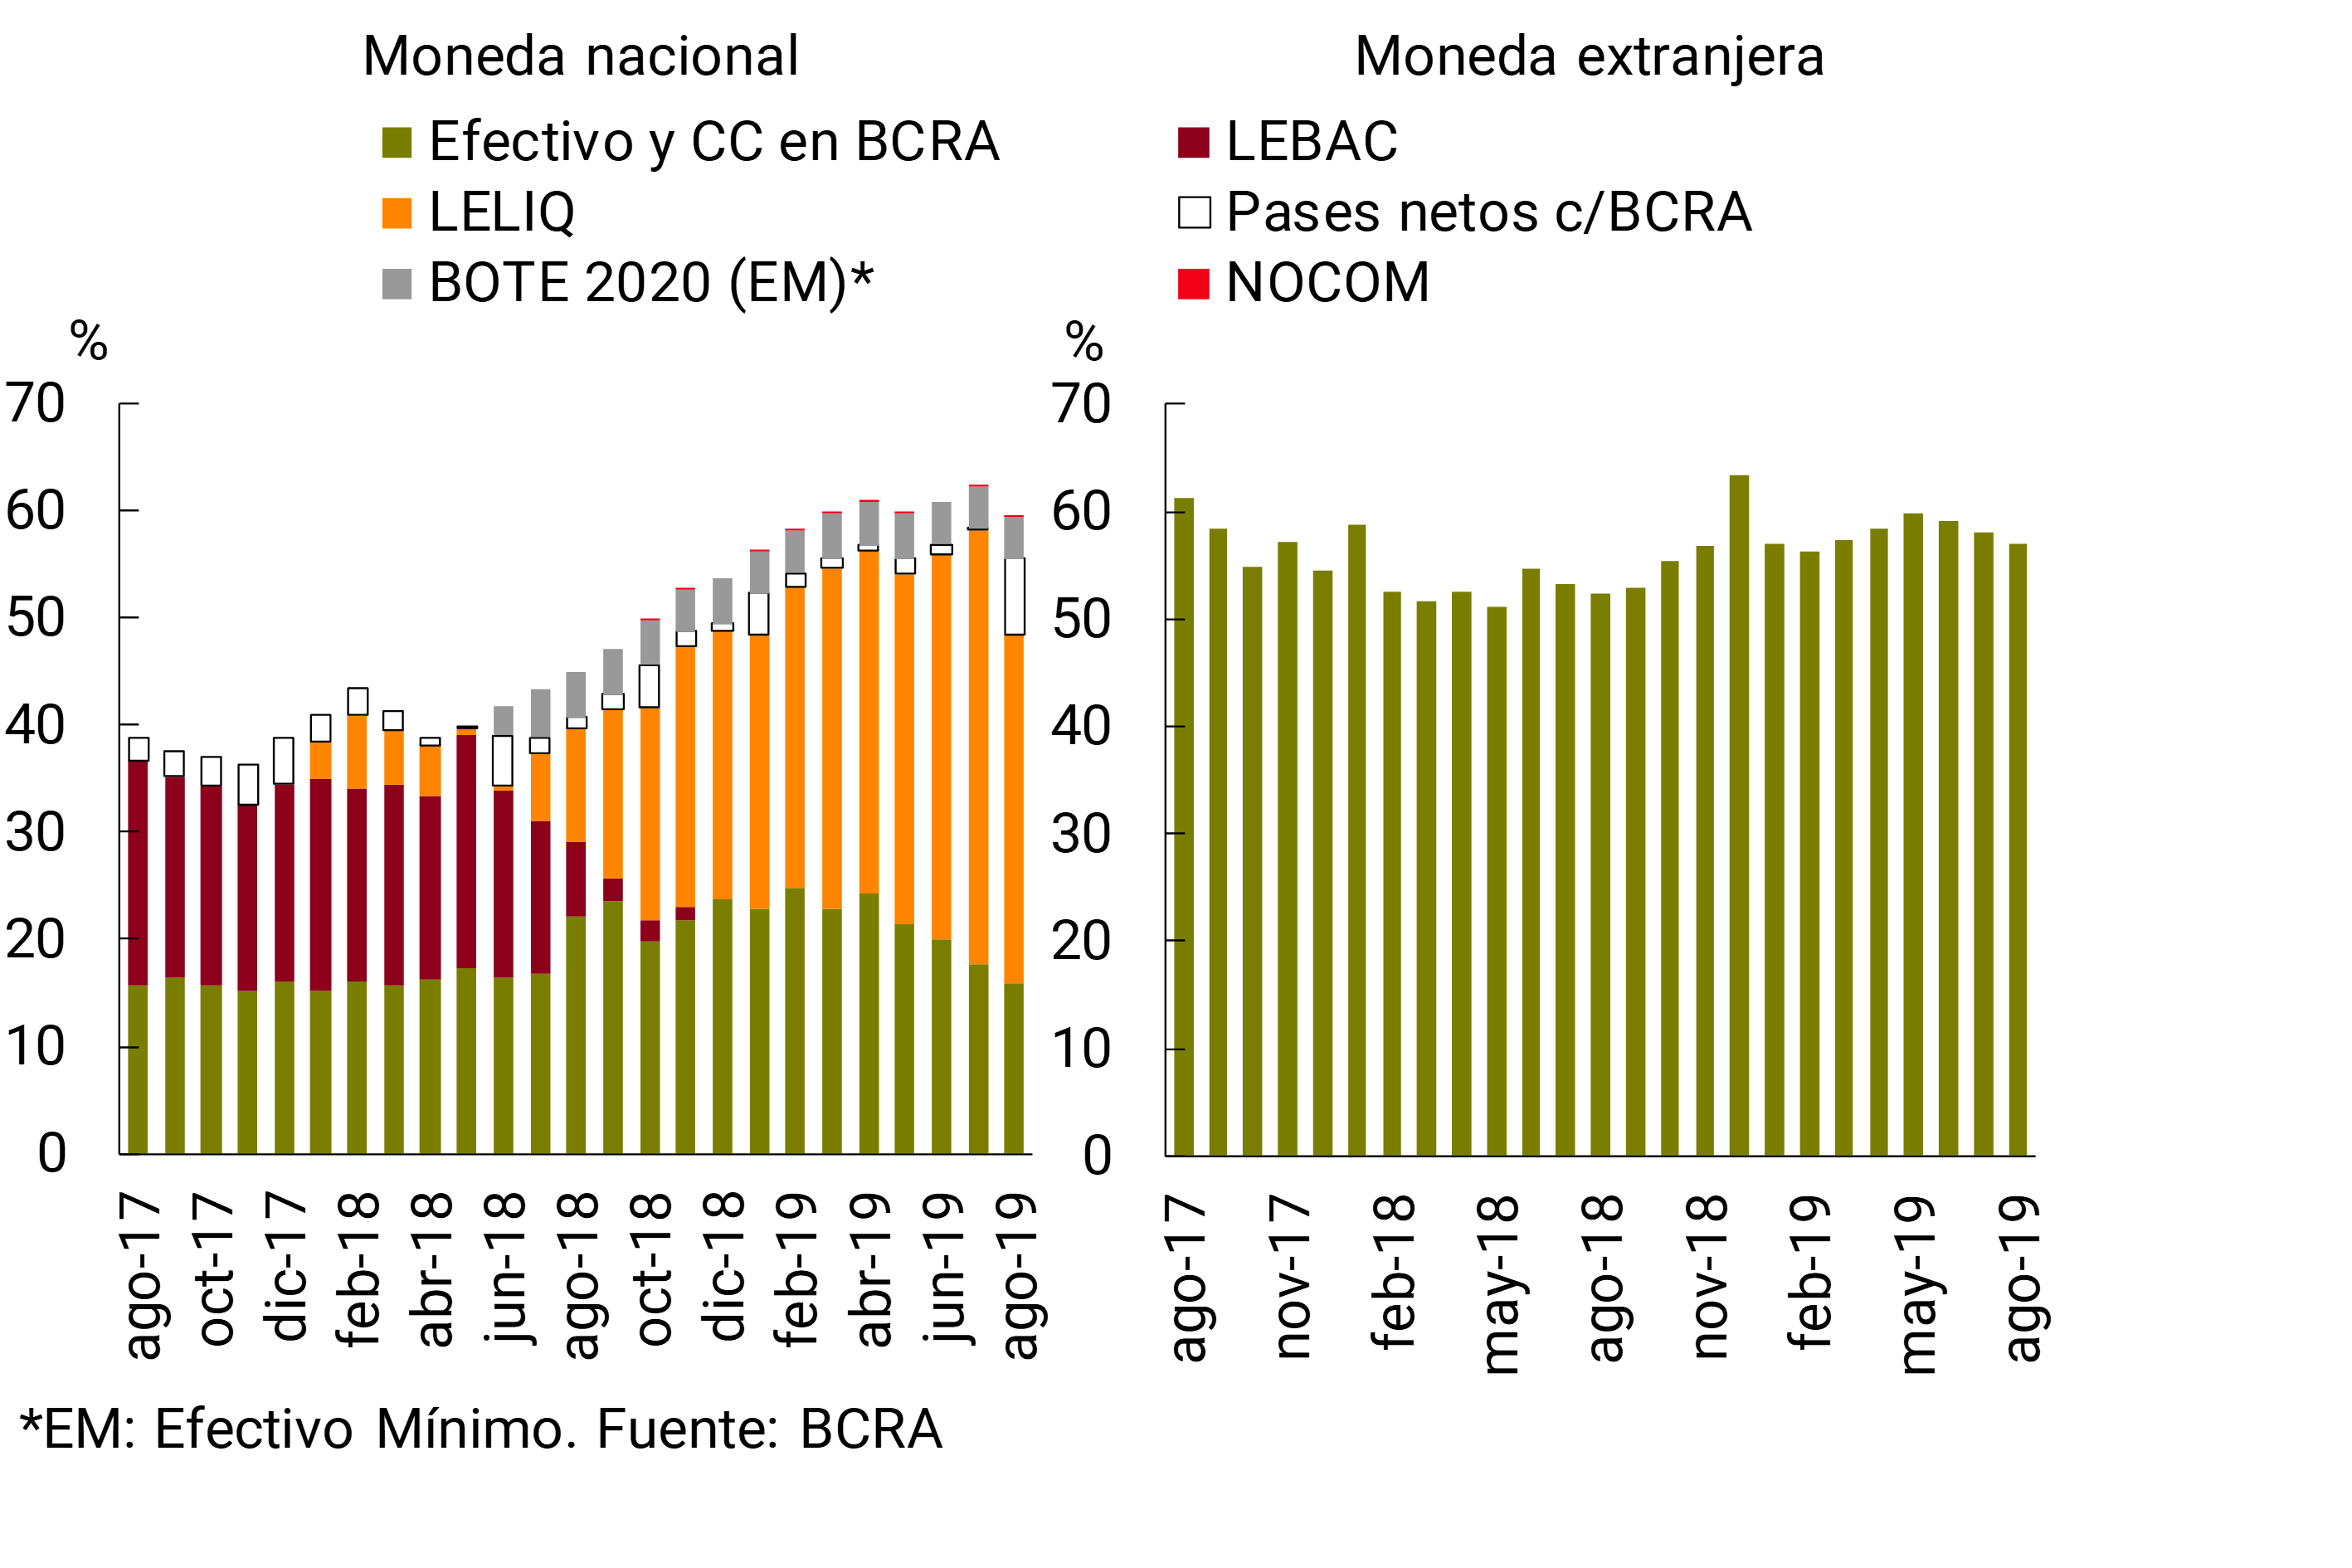
Liquidity coverage for the financial system remained high in August. Broad liquidity indicator4 represented 58.5% of total deposits in the month (59.4% for items in pesos and 57% in the foreign currency segment), 2.3 p.p. lower than the July figure and 11.2 p.p. higher than the level of August 2018 (see Chart 6). In relation to the composition of liquidity in national currency, in August the participation of LELIQ and the current account decreased, and the relevance of the passes with the BCRA increased. The year-on-year increase in the broad liquidity ratio was verified in the segment in pesos (+14.5 p.p. y.o.y.) and in the segment in foreign currency (+4.5 p.p. y.o.y.).
Graph 6 | Liquidity of the Financial System
III. Credit and Portfolio Quality
In August, the balance of credit in pesos to the private sector fell 0.8% in real terms compared to the previous month (+3.1% nominal). 5 Financing through advances and credit cards showed real increases in the period, while the remaining credit lines decreased. On the other hand, loans in foreign currency fell 4.6% in the month (see Chart 7), mainly explained by the performance of export pre-financing and cards.
Figure 7 | Private Sector Credit Balance by Currency*
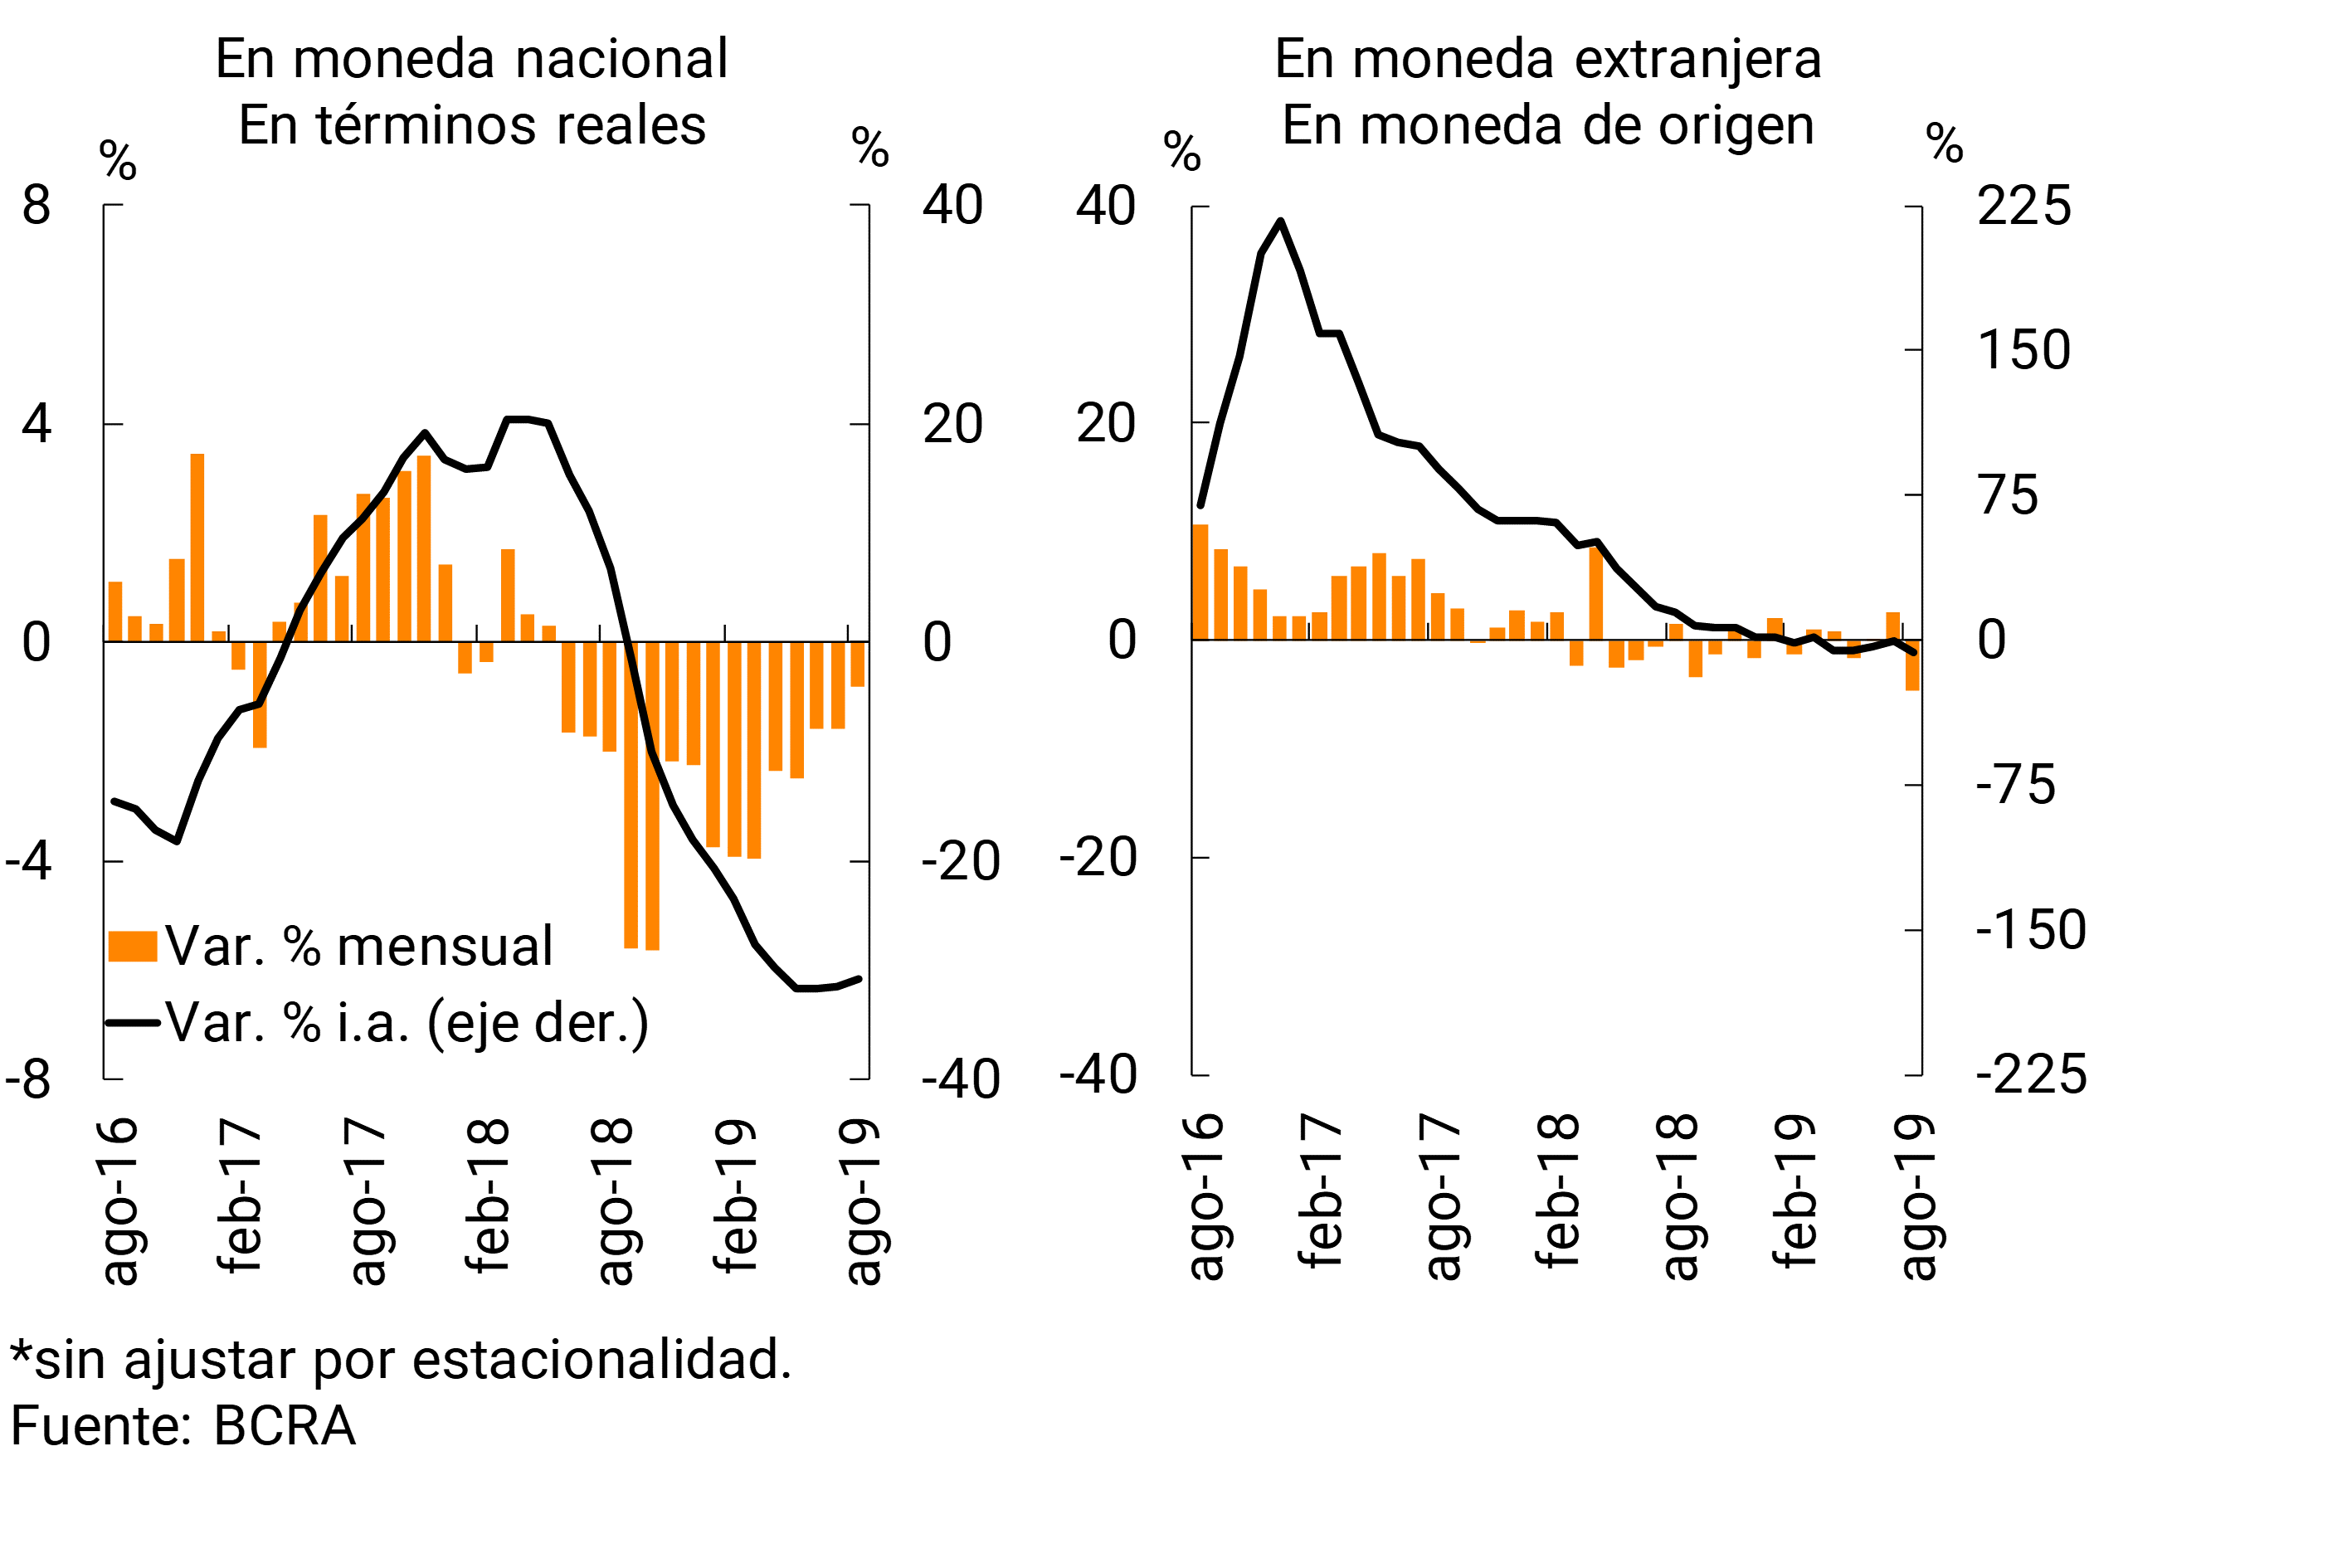
In the last twelve months, the balance of financing in pesos to the private sector fell by 30.7% in real terms (increase of 7% nominal YoY), with a greater relative drop in documents and pledges. Meanwhile, the balance of loans in foreign currency decreased 6% YoY.
The total credit balance to companies – including domestic and foreign currency – increased 13.9% in real terms compared to July (+18.4% in nominal terms), a performance mainly explained by the re-expression of loans in foreign currency in the context of the depreciation of the peso against the dollar in the period. 6 In a year-on-year comparison, total financing to firms accumulated a fall of 22.2% in real terms. For its part, total financing to households – in domestic and foreign currency – fell 2.3% in real terms in the month (+1.6% in nominal terms) and 23.6% in real year-on-year terms.
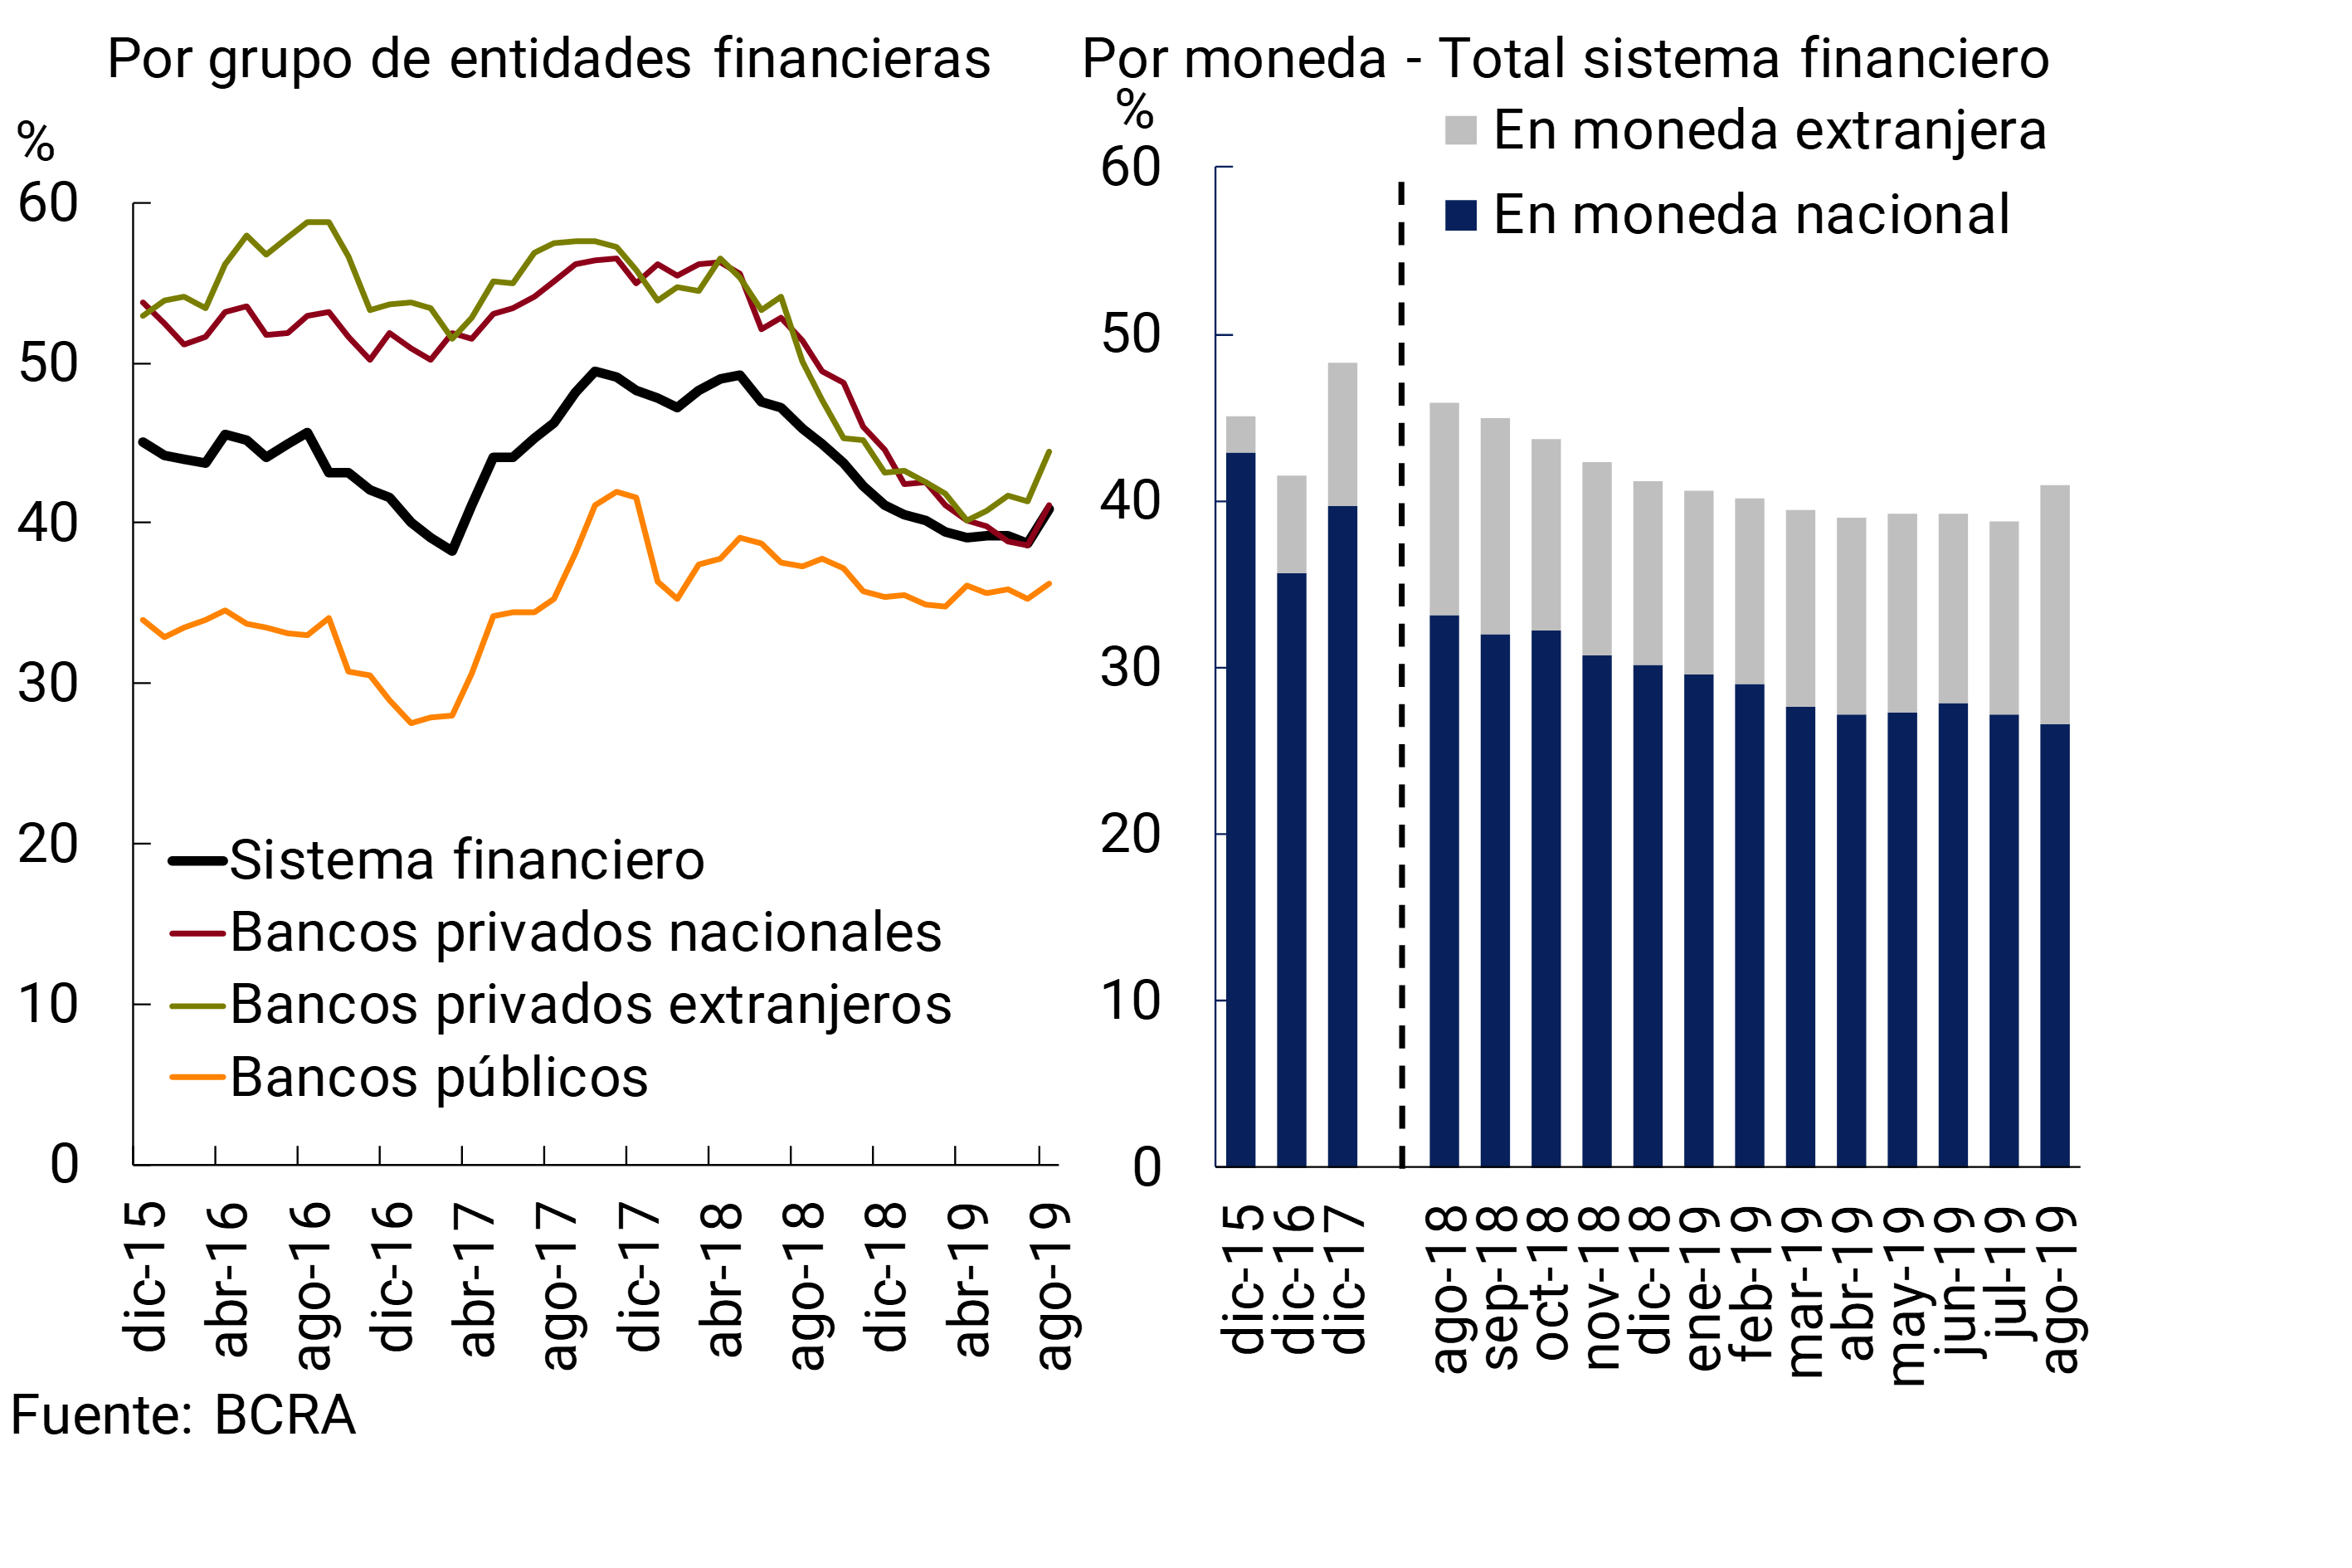
Influenced by the aforementioned effect on the exchange rate, total bank financing to the private sector in terms of the assets of the financial system increased by 2.1 p.p. in the month, to 40.9% (see Chart 8). In the last twelve months, this indicator accumulated a fall of 4.9 p.p., mainly due to the performance of national and public private banks.
Figure 8 | Private Sector Credit Balance / Total Assets
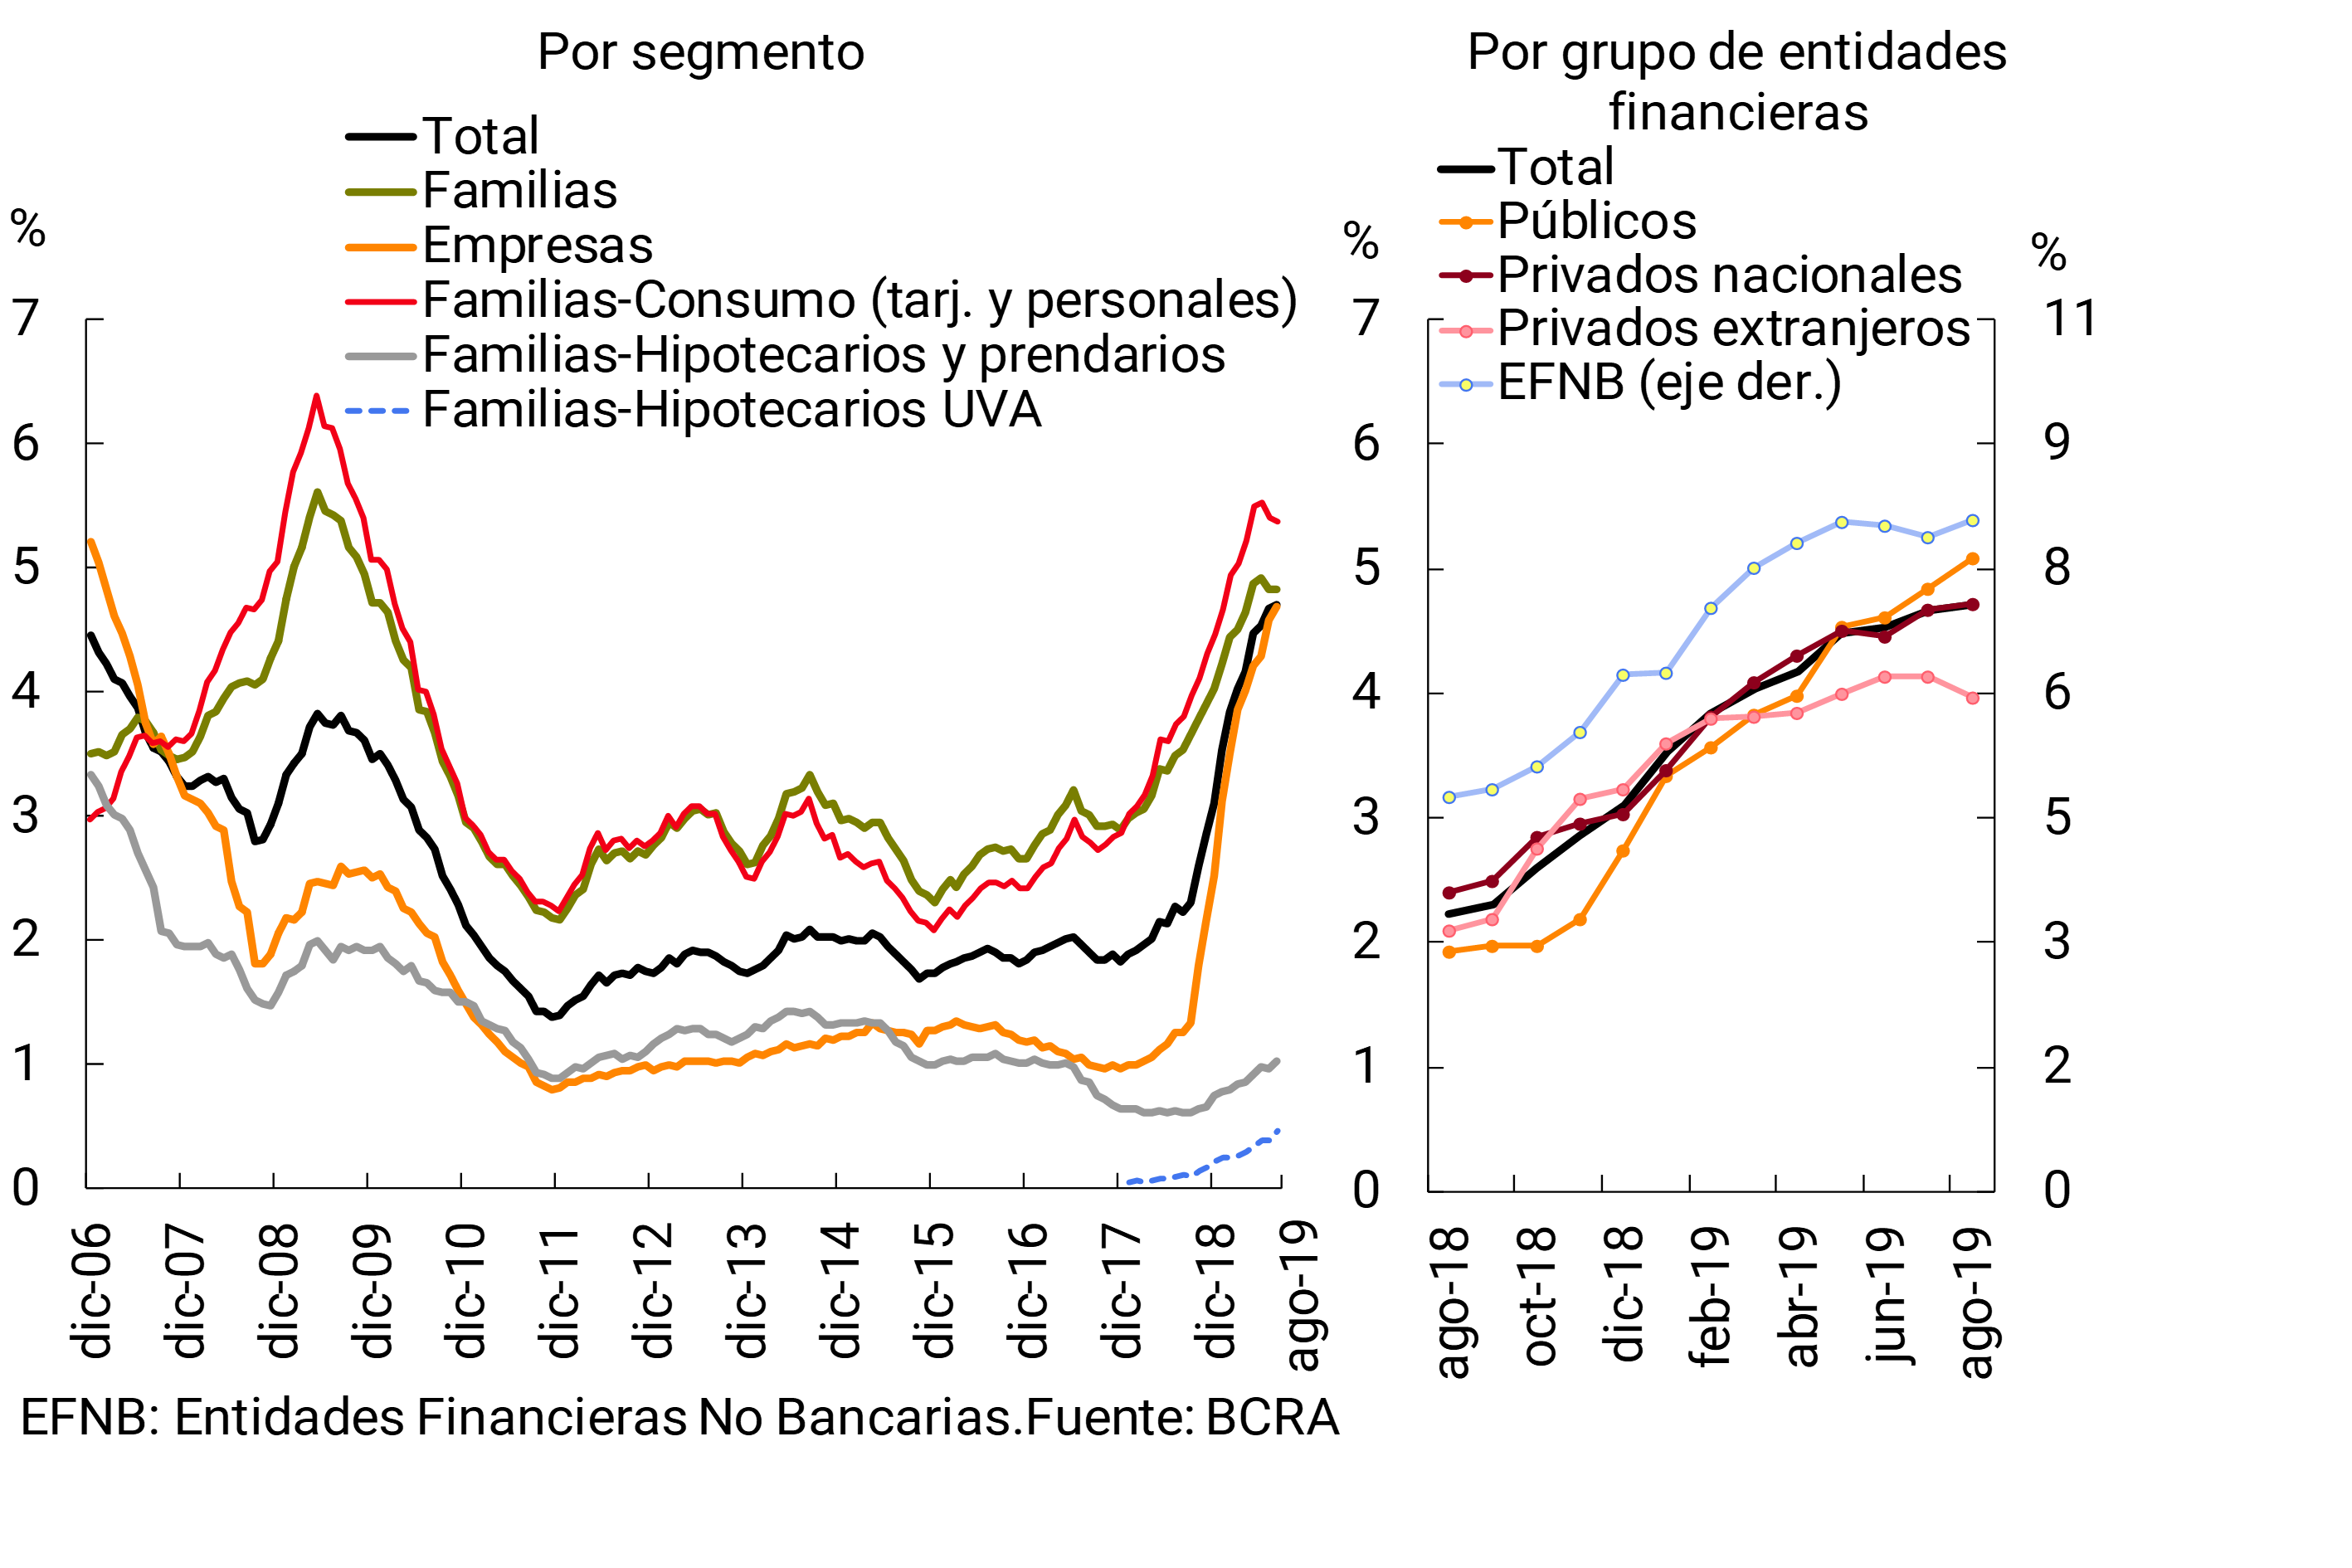
The non-performing ratio of credit to the private sector remained unchanged during August, standing at 4.7% (+2.5 p.p. y.o.y.) (see Graph 9). Differentiating by group of financial institutions, in the month this indicator increased slightly in public banks and non-bank financial institutions, while it decreased in foreign private banks and remained unchanged in national private banks. Non-performing loans to companies stood at 4.7% of the portfolio (+3.4 p.p. y.o.y.). For its part, the irregularity coefficient of loans to households remained at 4.8% in the period (+1.3 p.p. y.o.y.). The default rate on mortgage loans to households remained at low levels: 0.46% for those denominated in UVA and 0.79% for the rest. 7
Figure 9 | Irregularity of Credit to the Private Sector – Irregular financing / Total financing (%)
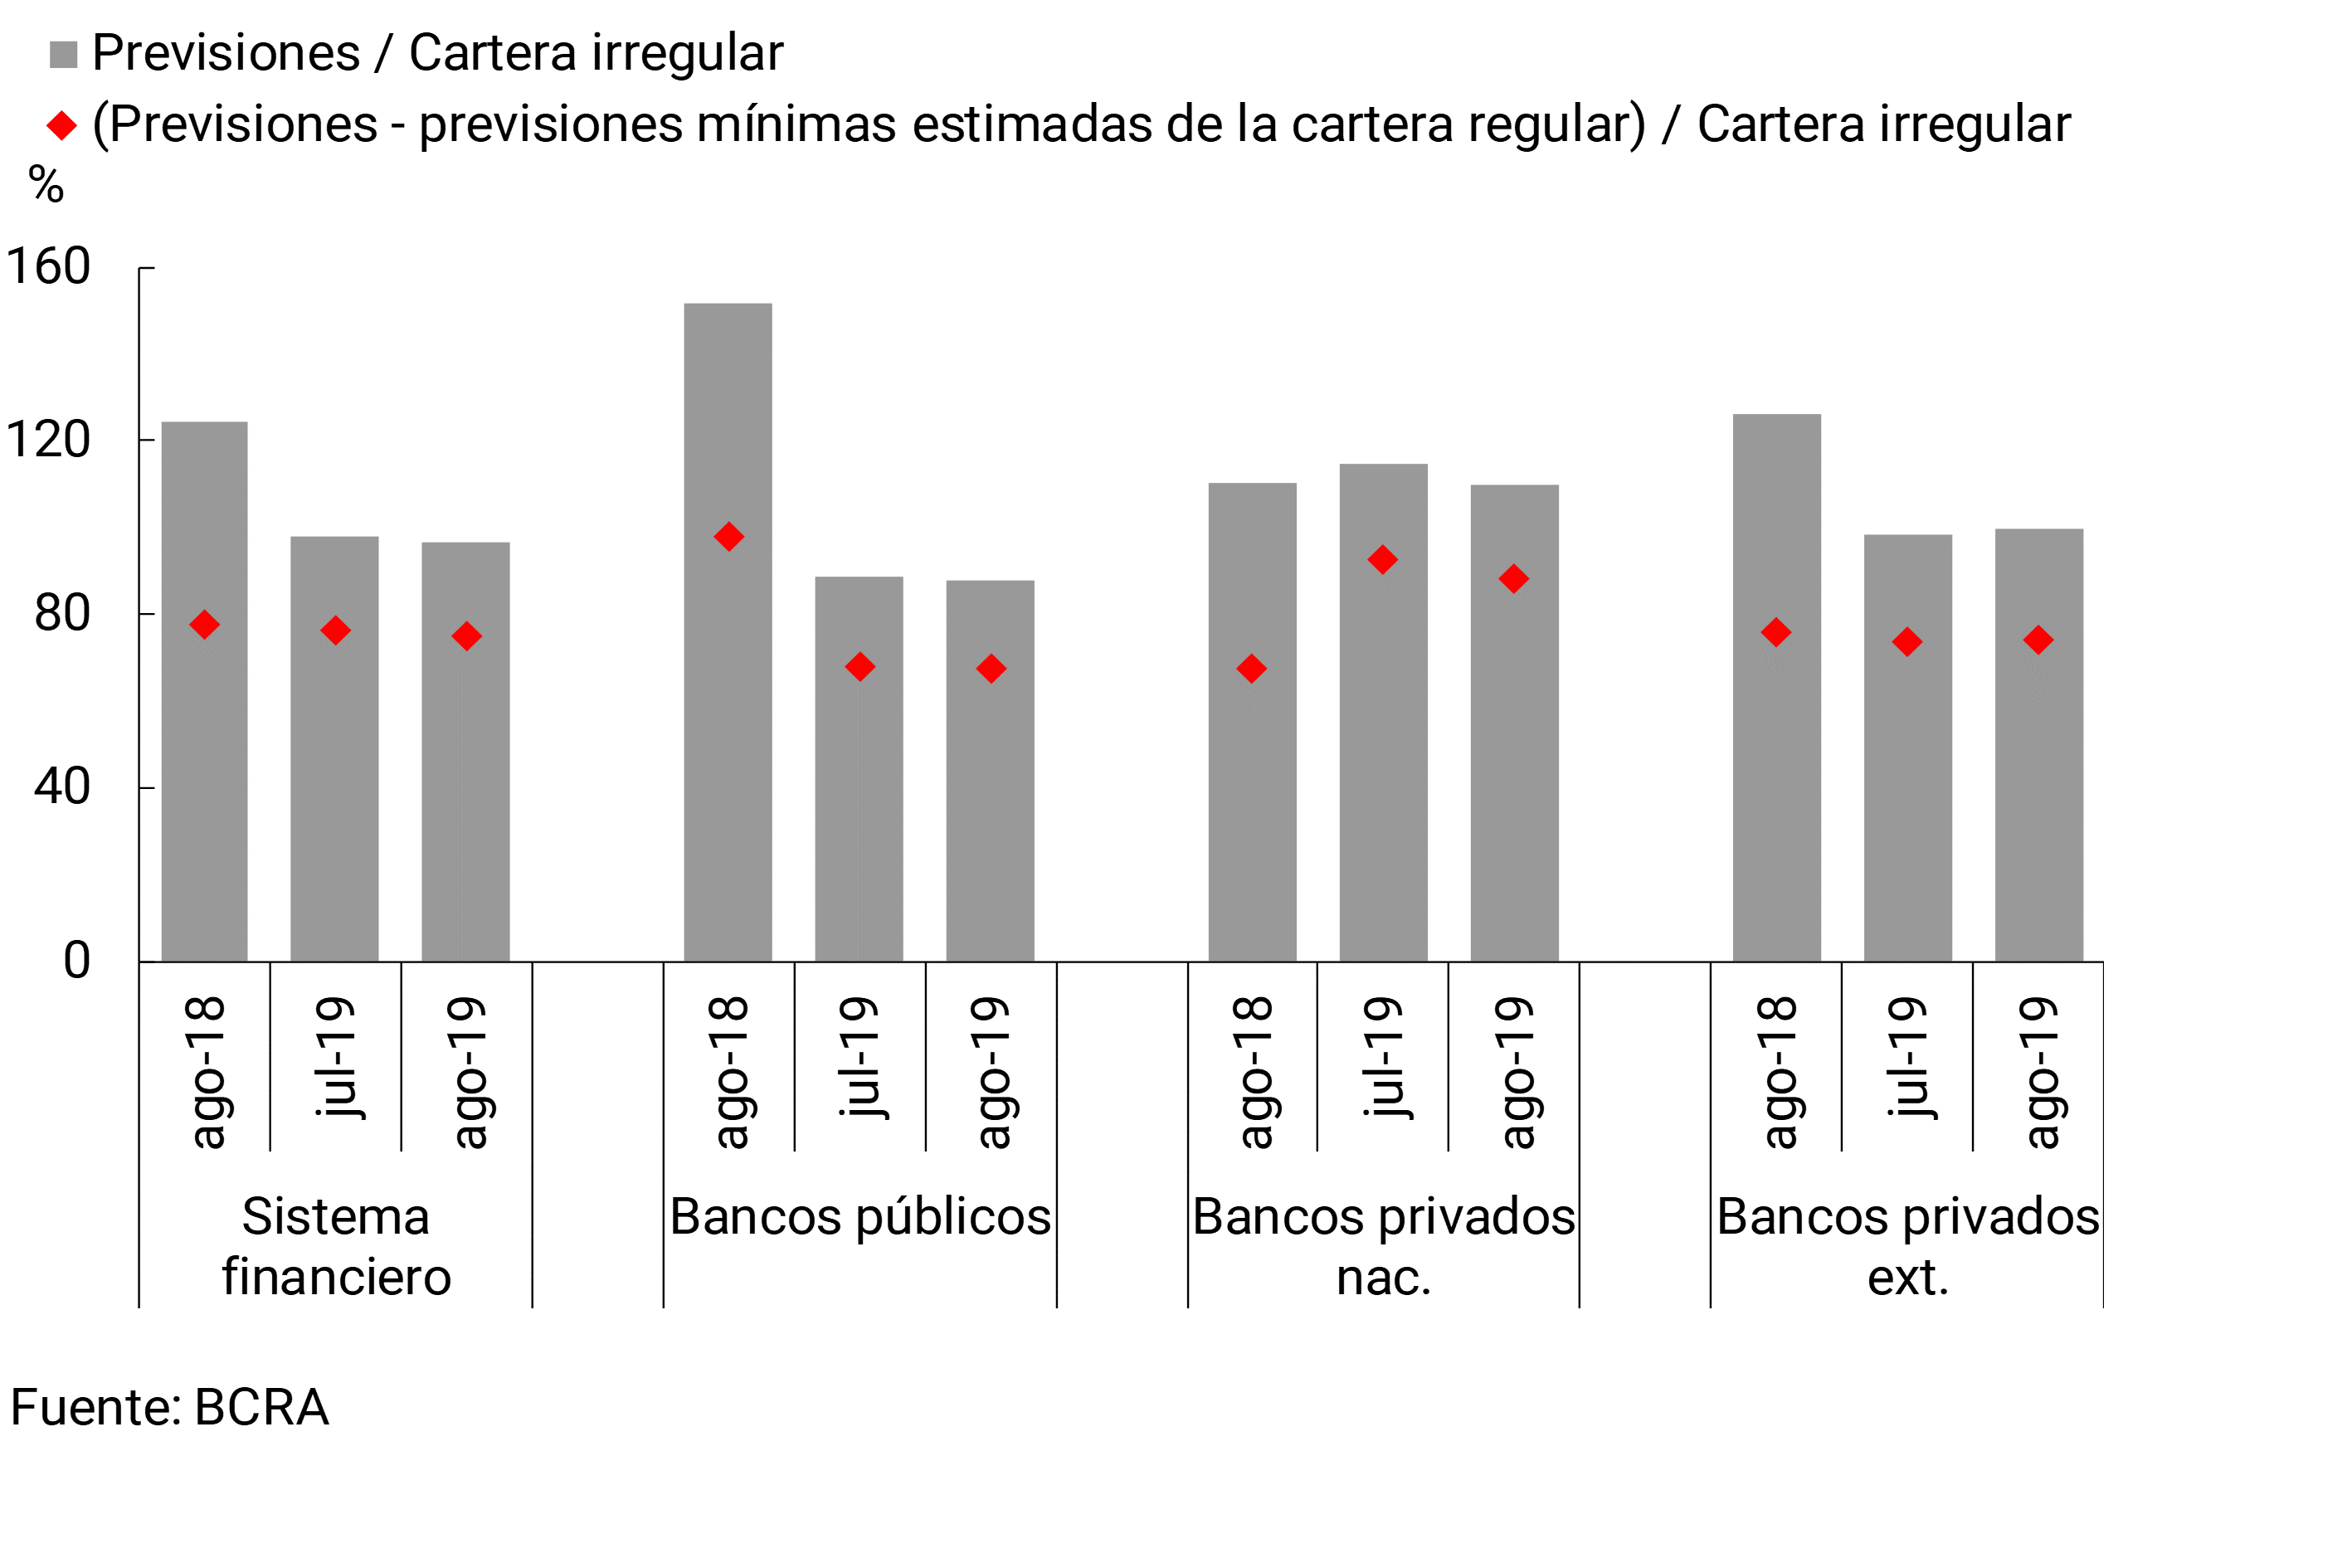
In August, the balance of the forecasts net of the estimate of the minimum forecasts constituted on the portfolio in regular situation represented 75% of the non-performing portfolio (see Graph 10), in line with the records observed in previous months. Taking into account the balance of total accounting forecasts (those awarded to both the regular and irregular portfolios), the forecast accounted for 96% of the loans in an irregular situation to the private sector, slightly below the value of the previous month. On the other hand, it is estimated that the irregular portfolio not covered by forecasts was equivalent to 5% of the Computable Patrimonial Liability (CPR) in August (11.4% of the excess regulatory capital), increasing 0.7 p.p. compared to July.
Figure 10 | Forecasting of the Financial System
The exposure of all financial institutions to the public sector remained at 9.5% of assets during August (-2 p.p. y.o.y.). Public banks reduced their exposure to this sector in the month, while private banks increased it. Considering the balance of public sector deposits, this sector continued to be a net creditor of the financial system: -2.9% of total assets in the period (+4.2 p.p. y.o.y.).
IV. Solvency
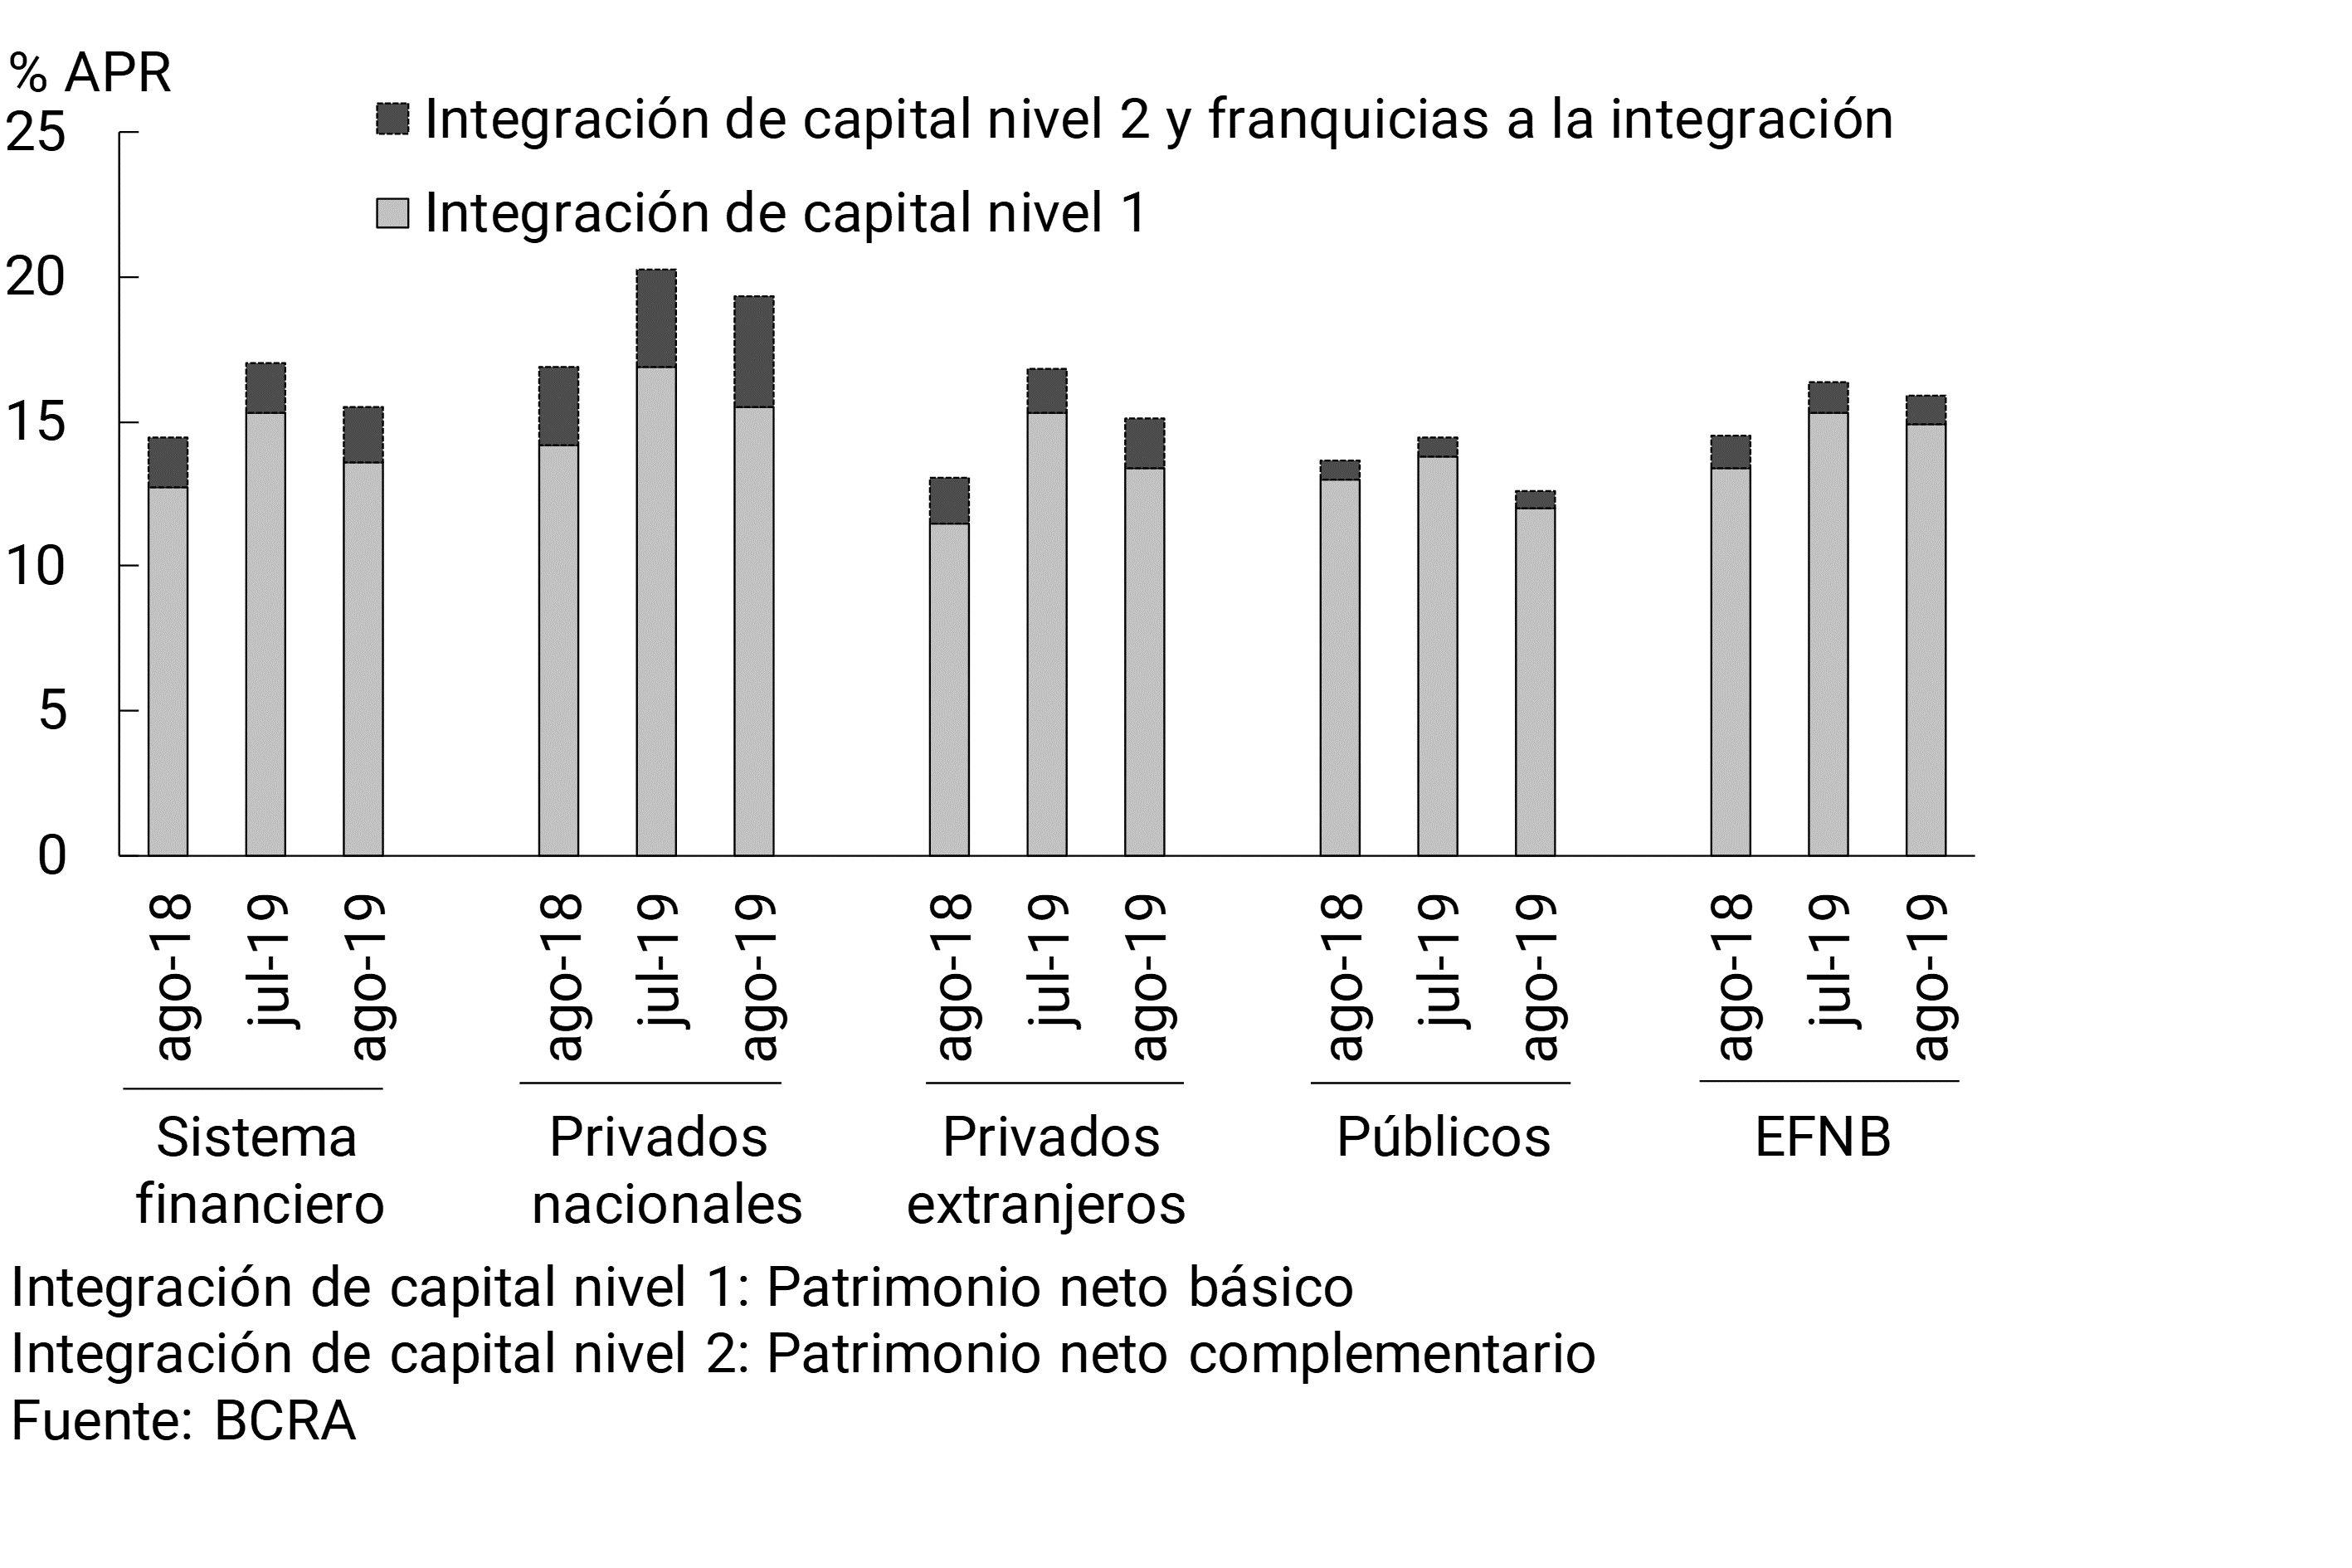
The solvency indicators of the aggregate of banks remained at high levels in August. The capital integration (PRC) of the financial system totaled 15.5% of risk-weighted assets (RWA) in the month, 1.5 p.p. below the July figure, although 1.1 p.p. higher in a year-on-year comparison (see Chart 11). The monthly decrease in the indicator was mainly due to a higher relative increase in RWAs8 relative to the PRC. Tier 1 capital continues to account for most of the sector’s PRC – 87% at the aggregate level. 9 In the month, the ratio between the PRC and the minimum regulatory capital requirement was 177% for the financial system.
Figure 11 | Integration of regulatory capital
In August, nominal gains in the financial system were equivalent to 2.5%y/annualized (ROA) and 23.3%y/y/equity (ROE). In the 12 months to August, banks as a whole accumulated a nominal ROA of 4.2% and a nominal ROE of 39.1% (see Chart 12). 10
Figure 12 | Profitability of the Financial System
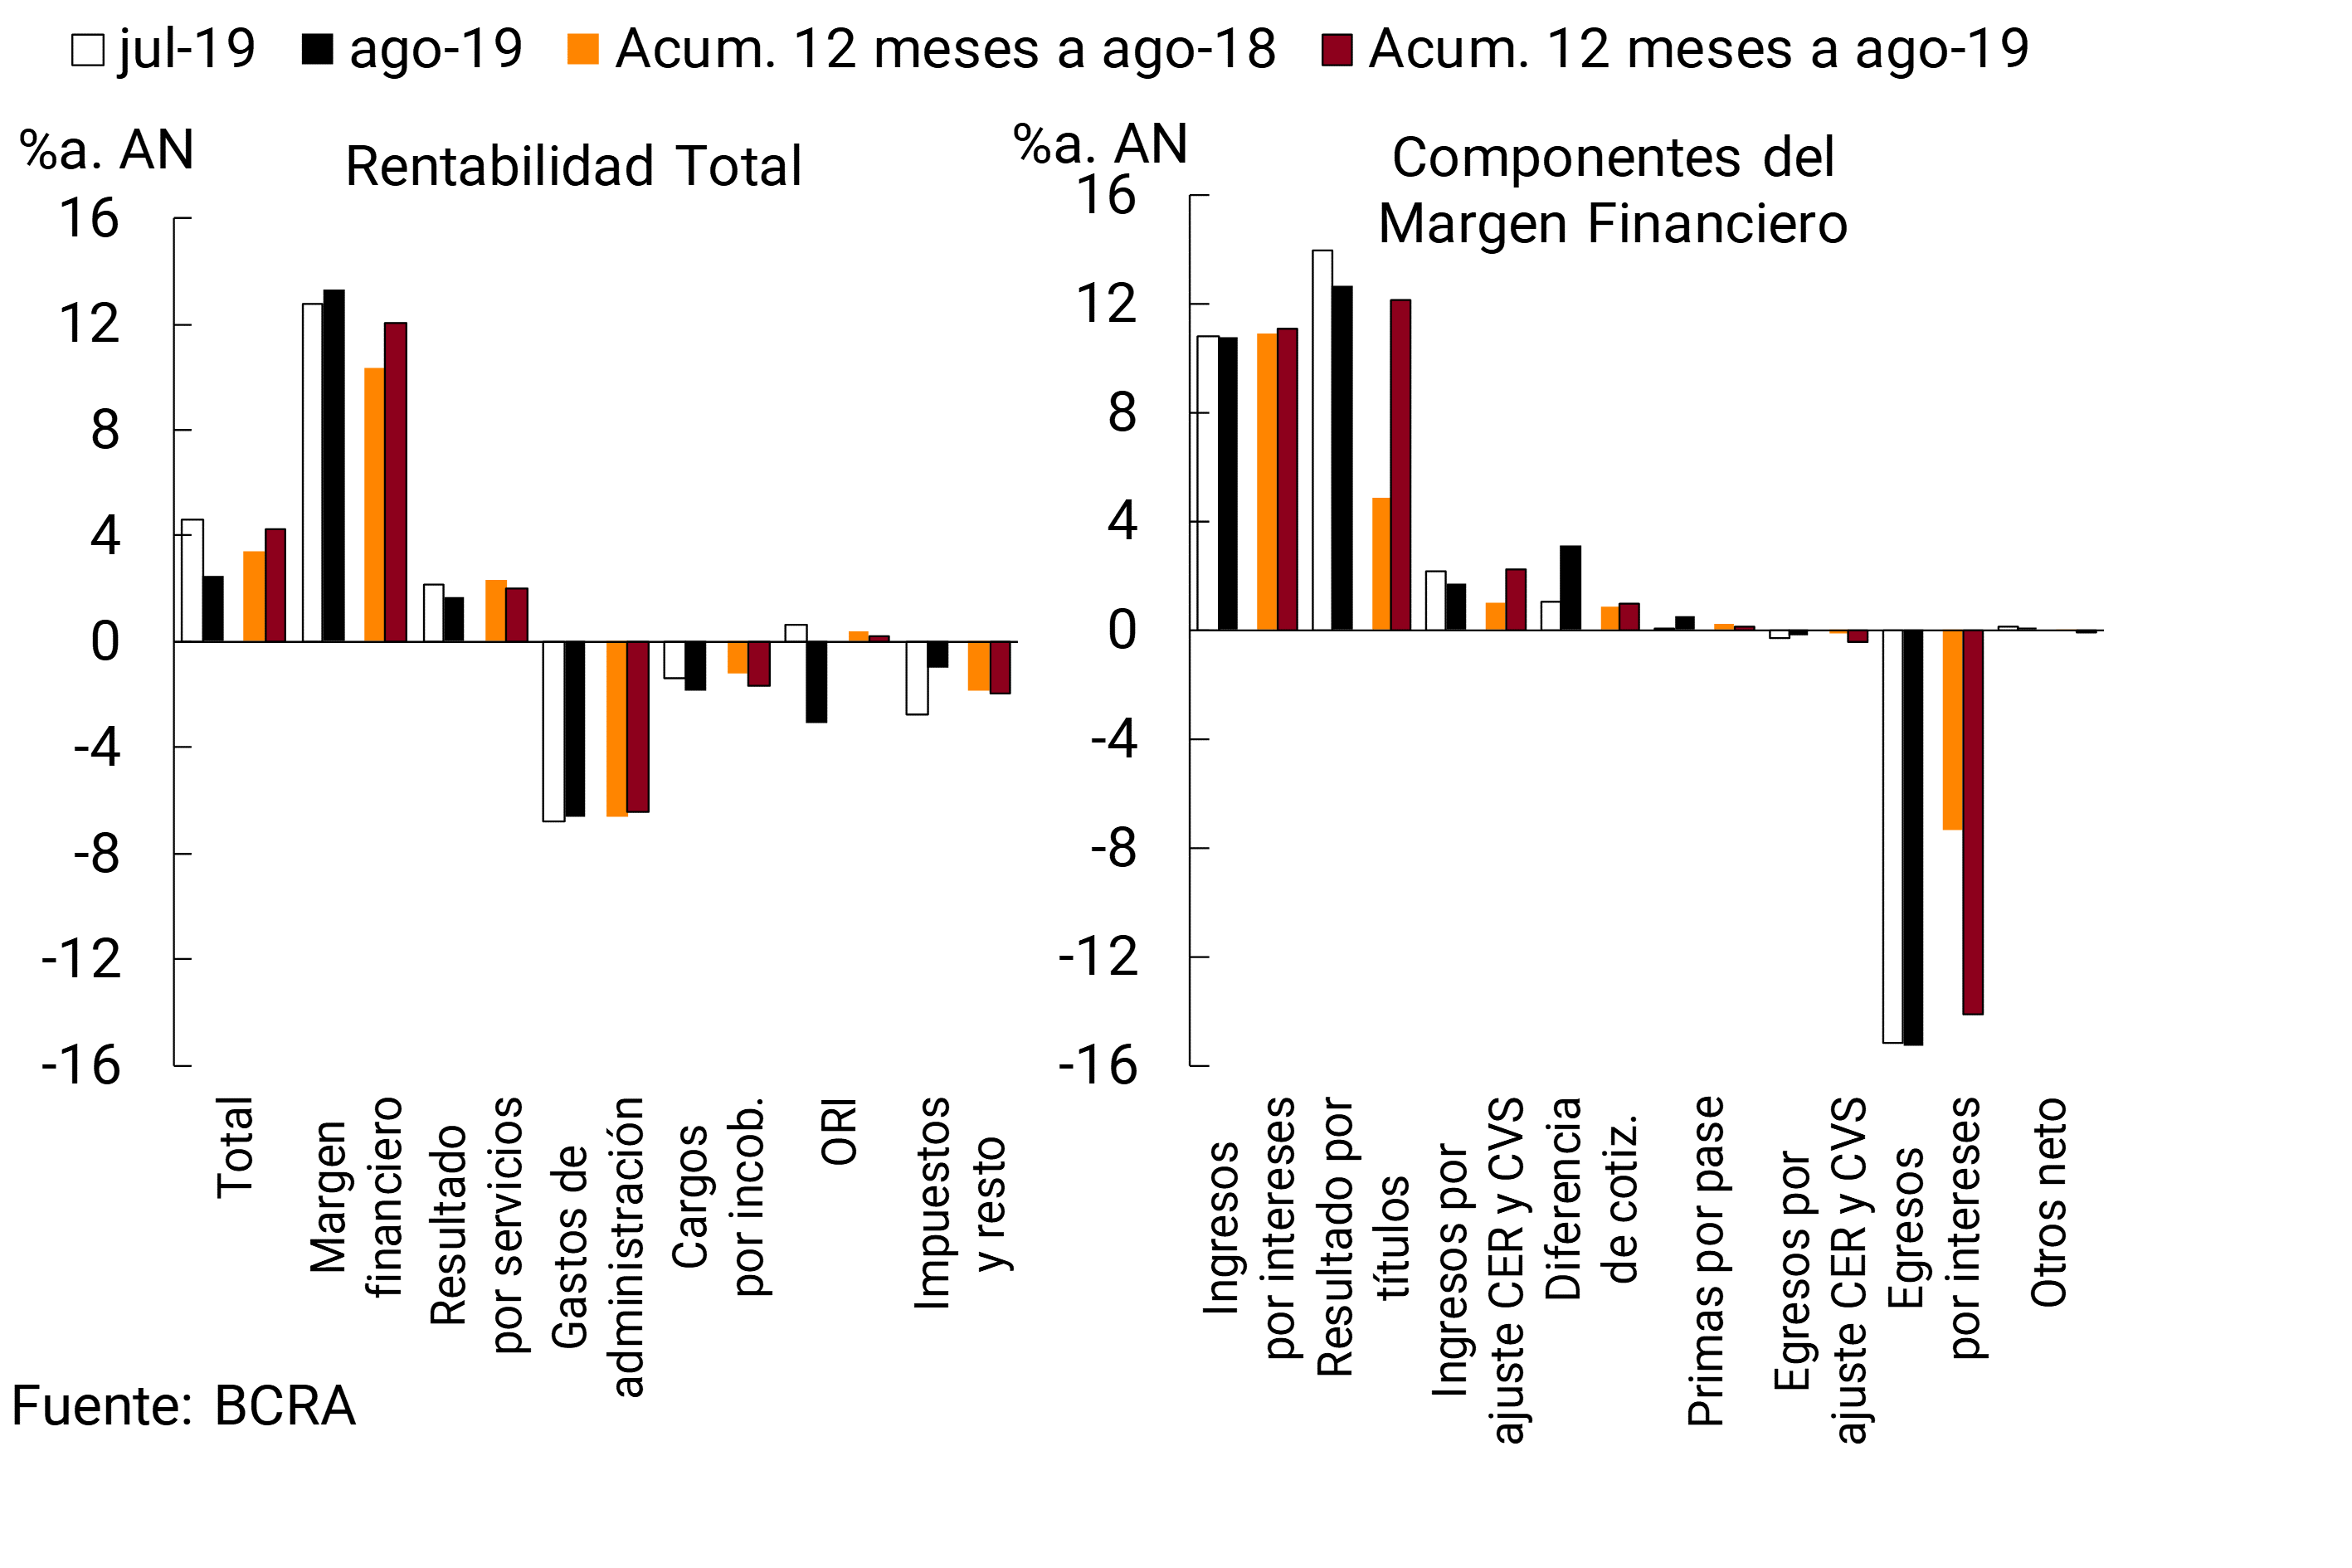
In the month, the financial margin of the banks as a whole represented 13.3% of assets, 0.5 p.p. more than in the previous month. Higher gains from share price differences and pass premiums were partially offset by a decline in equity gains. In the cumulative period between September 2018 and August 2019, the financial margin reached 12% of assets, 1.7 p.p. more in a year-on-year comparison.
Net income from services in the financial system fell 0.4 p.p. of assets compared to July to 1.7% y/y in August. In the accumulated in the last 12 months, results for services totaled 2% of assets, falling 0.3 p.p. y.o.y.
In the month, administrative expenses represented 6.6% y. of assets and uncollectibility charges stood at 1.8% yra. of assets. In the 12 months to August, administrative expenses were equivalent to 6.4% of assets (-0.2 p.p. y.o.y.), while uncollectibility charges reached 1.7% of assets (+0.5 p.p. y.o.y.).
In August, the banks as a whole accrued losses in ORI equivalent to 3% of assets. 11 In the last 12 months, the ORI represented 0.2% of assets.
References
1 Considering differences in balance sheet balance.
2 The peso-dollar exchange rate increased 34.7% between the end of July and August.
3 Mainly Mutual Funds (FCI)
4 Availability, integration of minimum cash and BCRA instruments, in national and foreign currency.
5 Includes principal adjustments and accrued interest.
6 Information extracted from the Central Debtors (national and foreign currency). Loans to residents abroad are not included. Adjustments in principal and accrued interest are considered. Business financing is defined here as that granted to legal entities and commercial financing channeled to individuals. On the other hand, loans to families are considered to be those granted to individuals, unless they are for commercial purposes.
7 As of August, out of a total of 102,377 mortgage financing in UVA granted to individuals in the financial system (73% generated by public banks, 16% by national private banks and 11% by foreign private banks), 623 were in an irregular situation.
8 Largely due to the re-expression of risk assets in foreign currency in the context of the monthly increase in the exchange rate.
9 Tier 1 capital is the capital with the greatest capacity to face unexpected losses, composed mainly of common shares and earnings.
10 The results consider the other comprehensive results (ORI) item.
11 Mainly by financial instruments at fair value with changes in ORI, partially offset by positive exchange differences due to the translation of financial statements.
Share on


