I. Financial intermediation activity
Financial intermediation between all financial institutions and the private sector increased in September. Taking into account the most significant changes in the system’s aggregate balance sheet for items in national currency – expressed in homogeneous currency – liquidity in the broad sense fell in the month and both the real balance of public and private sector deposits increased. These movements were mainly offset by an increase in the real balance of credit to the private sector. Meanwhile, in the segment of items in foreign currency – expressed in currency of origin – there was a decrease in the balance of financing to the private sector and a growth in public sector deposits, variations that led to an increase in the liquidity of the aggregate financial system.
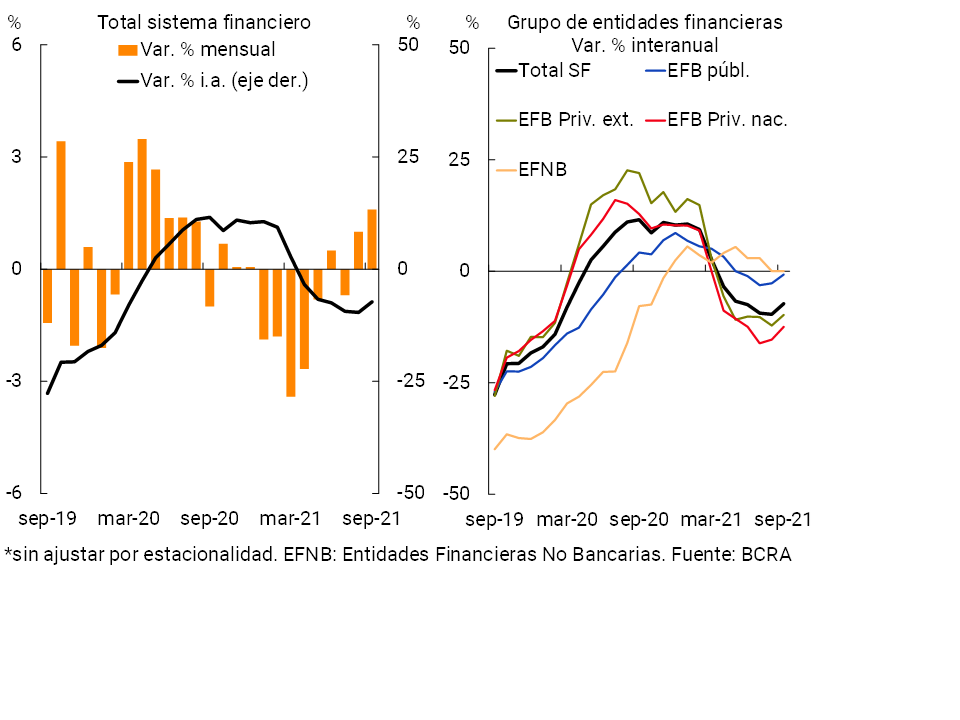
In September, the balance of financing to the private sector in national currency increased by 1.6% in real terms (+5.1% nominal; see Chart 1)2. The monthly increase was generalized among credit lines (especially pledges and documents) and among groups of financial institutions (with greater relative dynamism in national and public private financial institutions)3. Thus, the balance of credit in pesos to the private sector closed the third quarter of the year with a real growth of 1.9% (+11.3% nominal) compared to the immediately previous period, reversing the negative variations observed in the previous two quarters. However, in year-on-year terms, there was a 7.3% real drop (+41.3% nominal), mainly explained by private financial institutions.
Graph 1 | Credit balance to the private sector in pesos
In real terms*
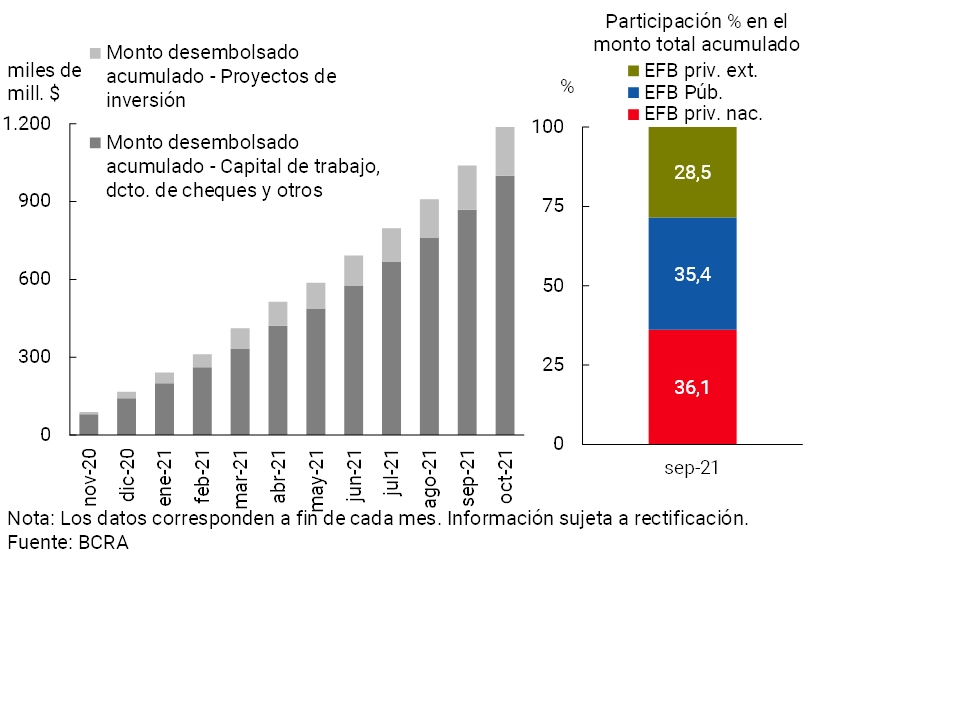
Throughout the year, the Financing Line for Productive Investment in MSMEs4 (LFIP) became one of the main instruments promoted by the BCRA to stimulate credit to the private sector. Since its implementation in mid-October 2020 and until the end of October 2021, accumulated disbursements of almost $1.2 billion (of which 15.9% correspond to investment projects) were made through the LFIP, distributed among approximately 183,700 companies. Domestic private financial institutions accounted for 36.1% of the total disbursed, public financial institutions 35.4% and foreign financial institutions the rest (See Graph 2).
Graph 2 | Financing Line for Productive Investment (LFIP) of MSMEs
At the same time, through the line of financing at subsidized interest rates for companies registered in the “Emergency Assistance Program for Work and Production” (ATP)5, as of October, nearly 20,900 loans have been granted for more than $14,300 million.
Within the framework of the credit lines aimed at small taxpayers and self-employed people through the “Zero Rate Credit 2021” Program, since its implementation (last August) until the end of October, $30,563 million6 have been granted (to which are added about $66,500 million from the 2020 edition).
In September, the balance of financing to the private sector in foreign currency fell by 6.3% – in foreign currency – compared to the previous month, with a greater relative drop in pre-financing for exports. In this context, the total credit balance (in domestic and foreign currency) to the private sector increased by 0.2% in real terms in the period (+3.8% nominal), falling by 10% in real year-on-year terms.
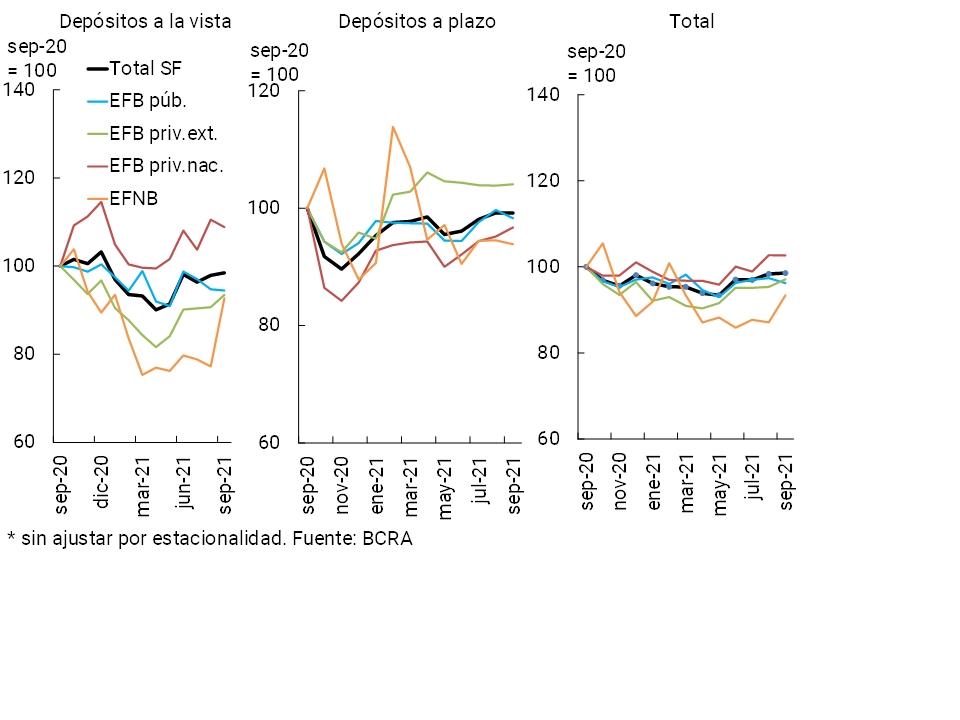
In relation to the funding of the financial system’s aggregate, the balance of deposits in pesos in the private sector increased by 0.2% in real terms (+3.7% nominal) in September, driven mainly by foreign private financial institutions and non-banking institutions (see Chart 3). The balance of demand accounts increased by 0.6% in real terms (+4.1% nominal) compared to the previous month, while the real balance of time deposits remained unchanged in the period (+3.5% nominal). Within the latter segment, there was an increase in term investments (8.5% in real terms in the month), which was offset by a fall in fixed terms, mainly explained by the segment denominated in UVA (-12.6% in real terms). In this context, in the third quarter, the balance of deposits in pesos of the private sector accumulated an increase of 1.5% in real terms, with increases in both demand and term loans.
Graph 3 | Balance of private sector deposits in pesos
In real terms*
Considering the items in foreign currency, in the month the balance of deposits in that denomination decreased by 0.2% (in currency of origin). Total private sector deposits (in domestic and foreign currency) decreased 0.3% in real terms compared to August (+3.1% nominal).
In a year-on-year comparison, the balance of deposits in pesos in the private sector fell by 1.5% in real terms (+50.2% nominal), with slight decreases in the real balance of demand accounts and time deposits. The balance of public sector deposits in pesos also accumulated a decrease of 4.4% y.o.y. in real terms (+45.7% y.o.y. nominal). As a result, the balance of total deposits in pesos (considering both sectors) accumulated a fall of 1.7% YoY (+49.9% YoY nominal). Finally, taking into account all currencies and sectors, the real balance of total deposits fell by 3.7% YoY (+46.9% YoY nominal).
II. Evolution and aggregate composition of the balance sheet
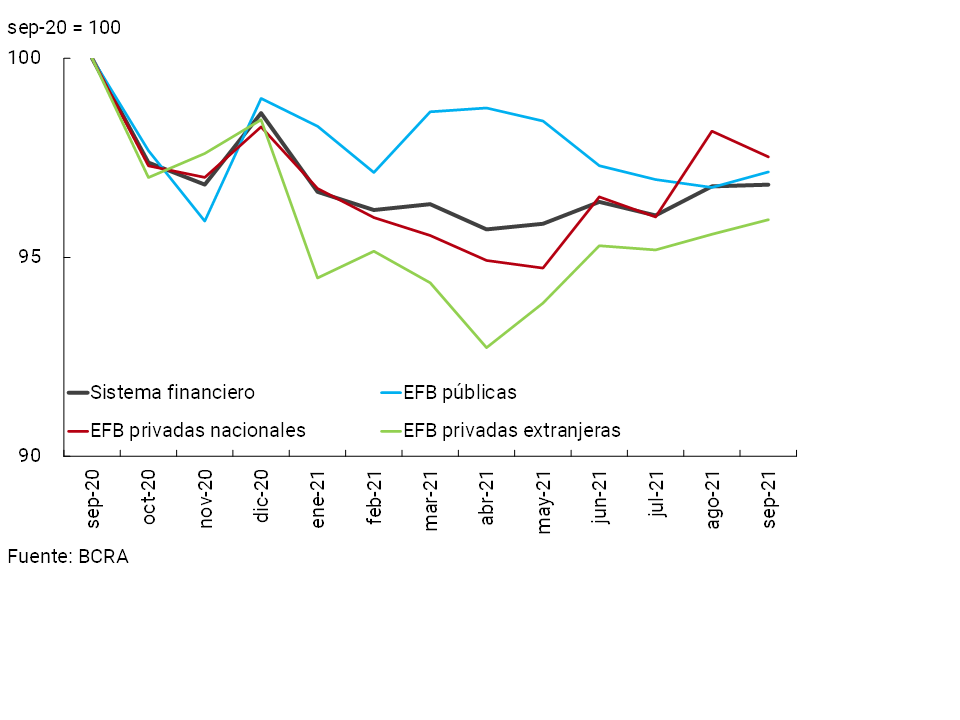
In September, the balance of total assets of the aggregate financial system remained unchanged from August (see Chart 4). In the period, there were disparate performances among the groups of financial institutions: increases in public and private foreign institutions, and a fall in the rest of the entities. In year-on-year terms, the assets of the financial system accumulated a reduction of 3.2% in real terms.
Figure 4 | Total assets of the financial system
In real terms
With respect to the main components of the total assets of the financial system, in September the weighting of credit in pesos to the private sector increased slightly (see Chart 5). On the other hand, the holding of BCRA instruments and credit in foreign currency to the private sector decreased their relative importance in total assets. When distinguishing assets by currency, the proportion of items adjustable by CER (including those denominated in UVA) increased slightly during the period, while assets in pesos (without adjustment) and in foreign currency reduced their relative importance.
Graph 5 | Composition of total assets
Financial system – Share %
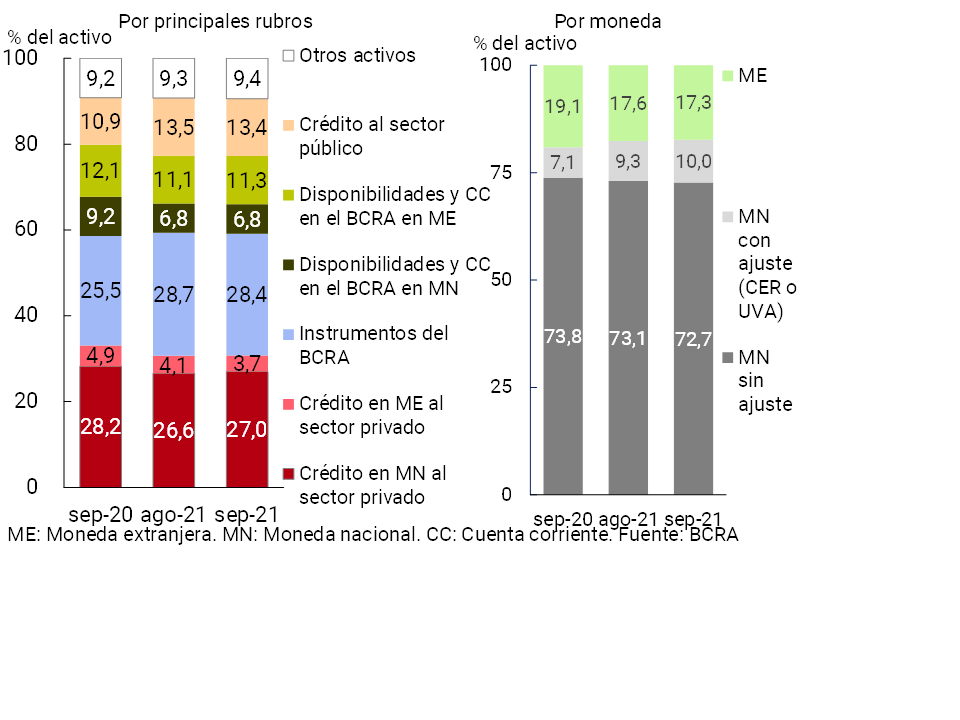
With regard to the composition of the financial system’s funding, the weighting of public sector deposits in national currency increased slightly during the month and that of private sector deposits in foreign currency decreased (see Chart 6). The participation of the rest of the items that make up the funding did not show significant changes with respect to August. On the other hand, items in pesos without an adjustment clause increased their relevance in the total, while those denominated in foreign currency and those with adjustment for CER or UVA reduced their relative weight.
Graph 6 | Total system funding composition
In % of total funding (liabilities + equity)
In September, the financial system continued to register a limited exposure to foreign currency items within the framework of current regulations. It is estimated that the spread between assets and liabilities in this denomination stood at 10% of regulatory capital7, increasing 2.1 p.p. compared to last month and remaining unchanged compared to the level of a year ago (see Chart 7). On the other hand, considering the items with a CER adjustment clause (including those in UVA), it is estimated that the spread between assets and liabilities represented 59.5% of the regulatory capital, increasing both in monthly and year-on-year terms (6.2 p.p. and 10.9 p.p., respectively).
Figure 7 | EM Assets – EM Liabilities + EM Forward Position (financial system)
III. Portfolio quality
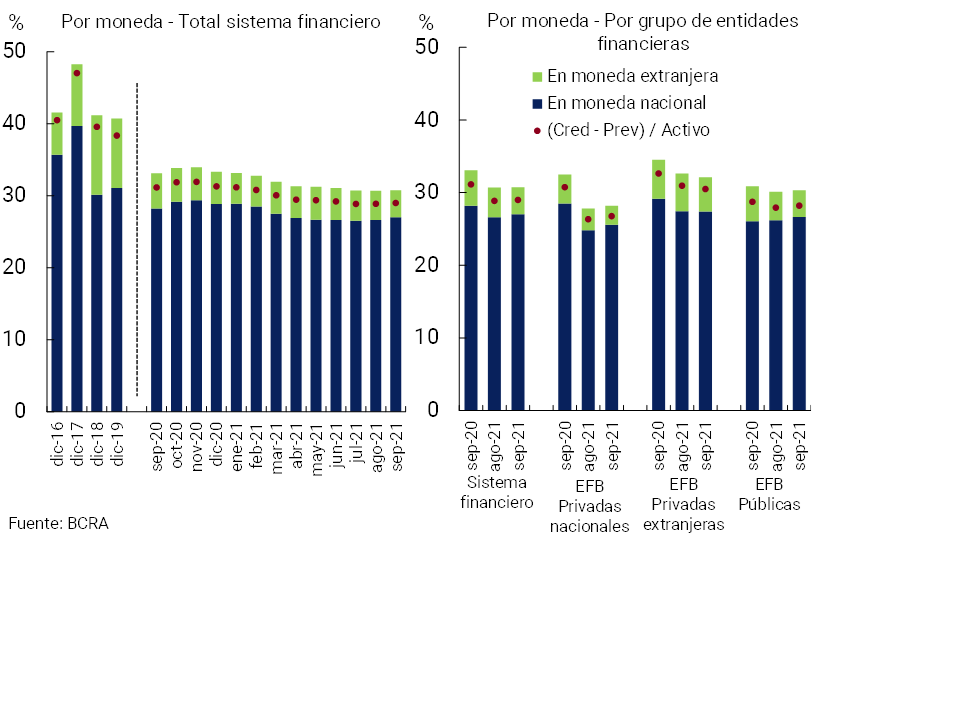
In September, the financing of the financial system to the private sector in terms of total assets (gross exposure to this sector) stood at 30.8%8, without significant changes compared to August (-2.3 p.p. y.o.y.). This indicator increased slightly in all groups of entities, with the exception of foreign private entities. When considering financing in pesos, this ratio stood at 27% in the month for the aggregate system, 0.4 p.p. above August and -1.2 p.p. in a year-on-year comparison (see Chart 8). The share of credit to the private sector in foreign currency in total assets fell in the month to 3.7% (-1.1 p.p. y.o.y.).
Figure 8 | Credit balance to the Private Sector / Assets
The irregularity ratio of credit to the private sector stood at 5% in the month, falling 0.3 p.p. compared to August. This decrease was due to the increase in total credit and the fall in the balance in an irregular situation, both in real terms9. The performance of the irregularity ratio in the last two months occurred after the increase verified between February and July of this year in the framework of the targeting of financial relief measures taken during the pandemic10. The monthly decrease in the irregularity ratio was verified both in the business lending segment and in the household lending segment (see Graph 9).
Figure 9 | Irregularity of credit to the private sector
Irregular financing / Total financing (%)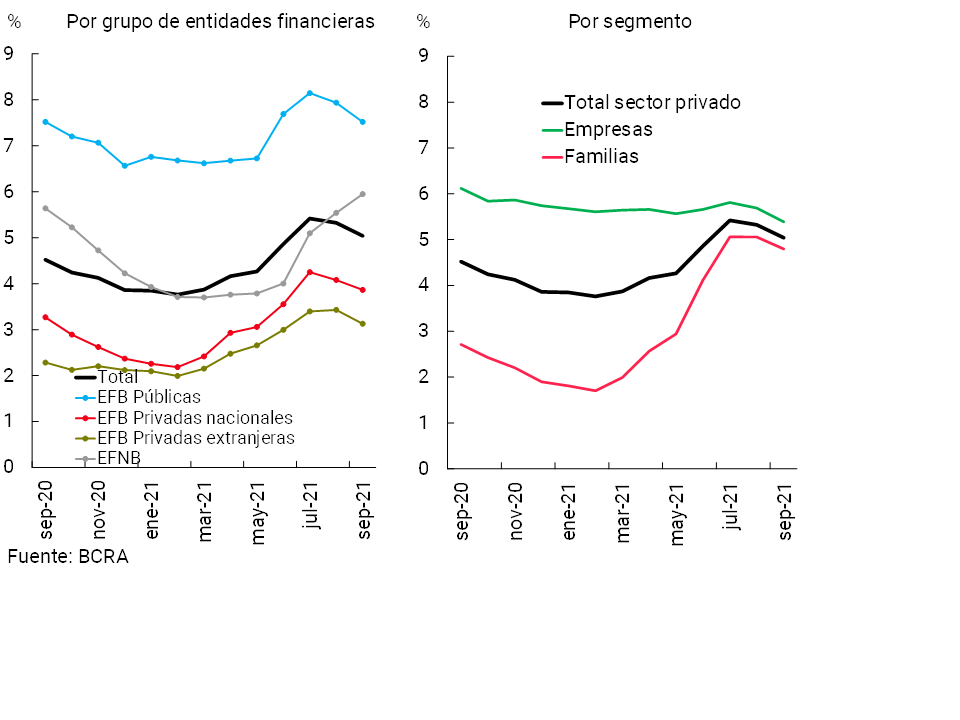
In September, the irregularity of financing to households stood at 4.8% of total credit to this segment (see Graph 10), 0.3 p.p. below the level of the previous month (+2.1 p.p. y.o.y.). The monthly performance was mainly driven by the fall in the delinquency of loans instrumented via credit cards. For its part, the non-performing loan indicator for companies stood at 5.4% in the period, also 0.3 p.p. below the value of August (-0.8 p.p. y.o.y.). The monthly reduction was verified in all credit assistance with the exception of export pre-financing.
Figure 10 | Irregularity of credit to the private sector
Irregular financing / Total financing (%)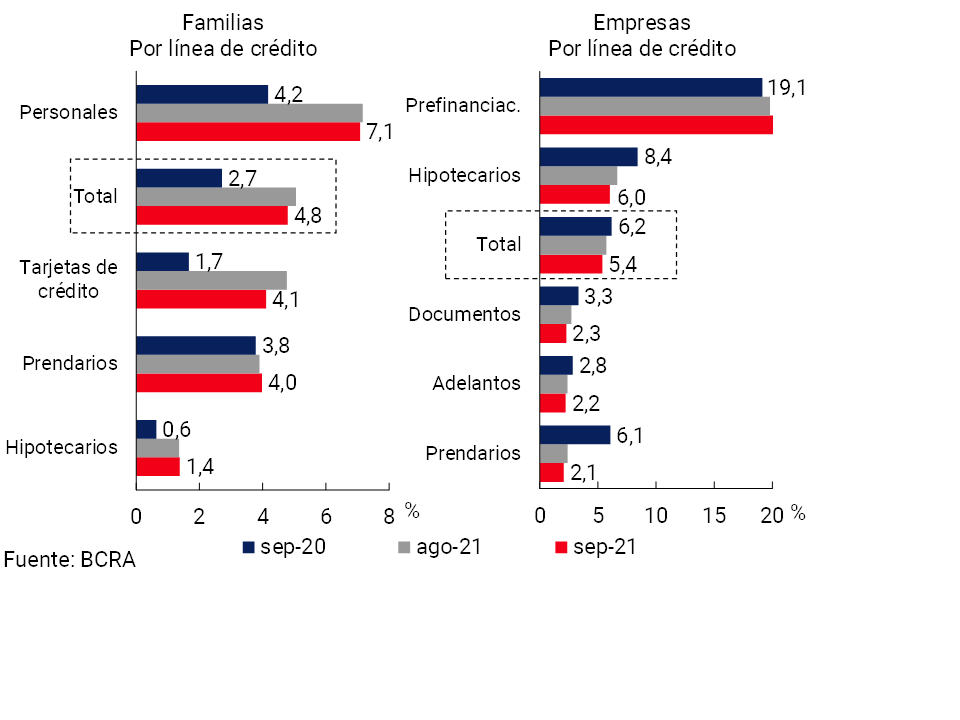
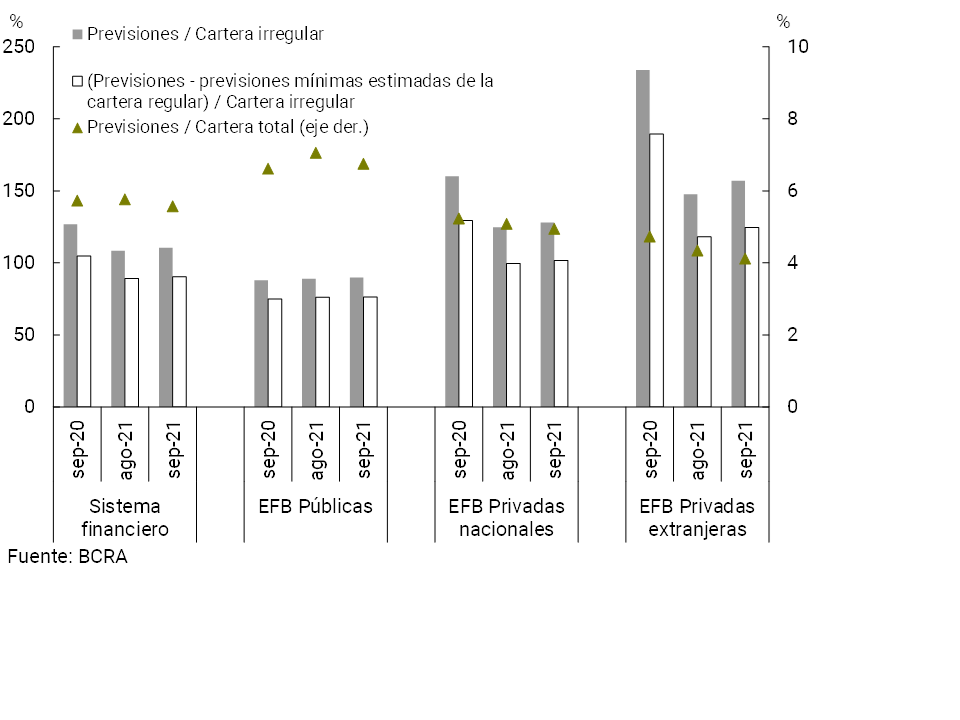
By the end of the third quarter, the aggregate financial system’s total forecasts accounted for 5.6% of total credit to the private sector, 0.2 p.p. lower than the level of both last month and September 2020 (see Chart 11). The total forecasts in terms of the irregular portfolio stood at 110.5% in the month at the systemic level, 2.2 p.p. more than the previous month (-16.3 p.p. y.o.y.). It is estimated that in September the balance of regulatory forecasts attributable to the non-performing portfolio (following the criteria of the minimum regulatory forecasts for uncollectibility risk) represented 90.4% of said portfolio for the aggregate of entities.
Figure 11 | Credit to the private sector and forecasts
By Entity Group
IV. Liquidity and solvency
In September, broad liquidity11 of the financial system increased by 0.2 p.p. of total deposits to 68.8% (-0.3 p.p. in the month to 65% for items in pesos and +2.8 p.p. monthly to 86.3% for the foreign currency segment, see Chart 12). Regarding the composition of liquid assets, between the end of the month the weighting of net passes with the BCRA and of national public securities eligible for minimum cash integration increased, while the relevance of LELIQ12 holdings decreased. In year-on-year terms, the broad liquidity indicator increased by 2.8 p.p. at the systemic level.
Figure 12 | Liquidity of the financial system
In % of deposits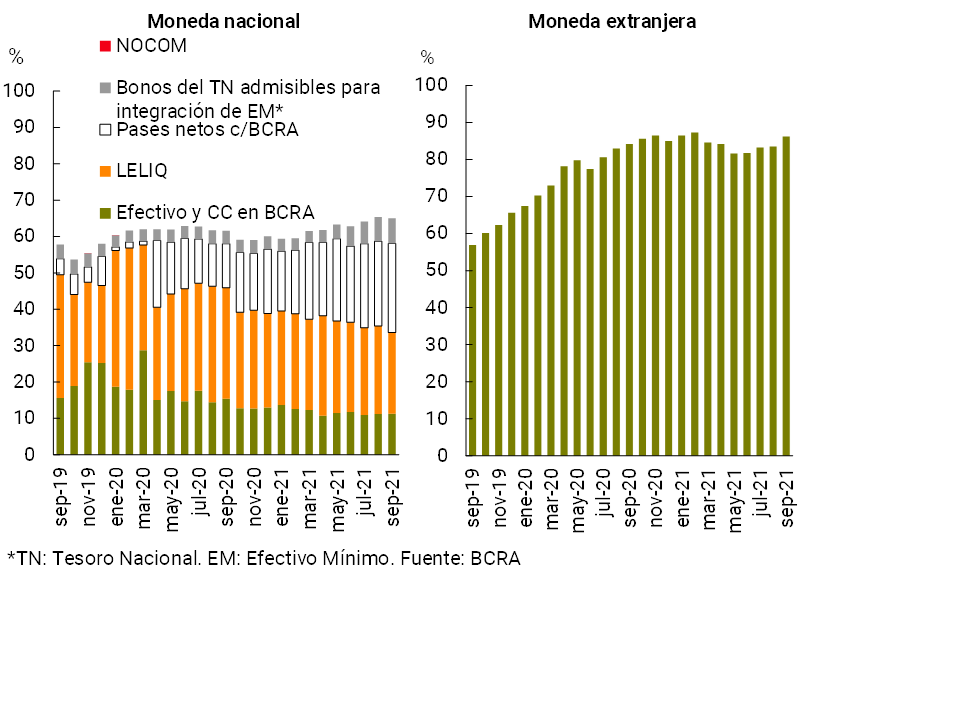
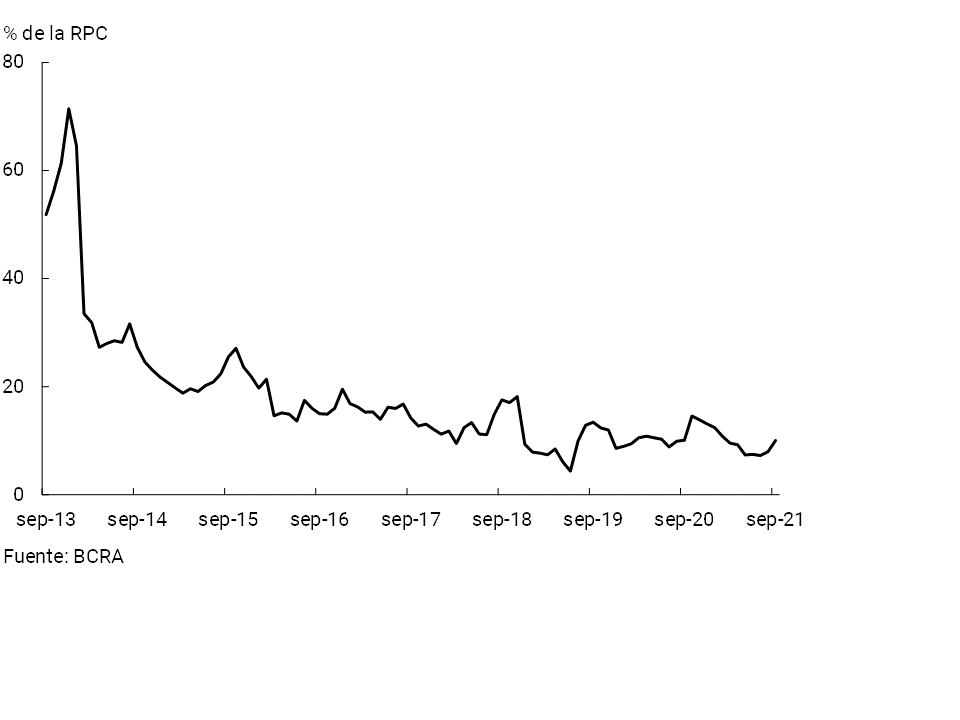
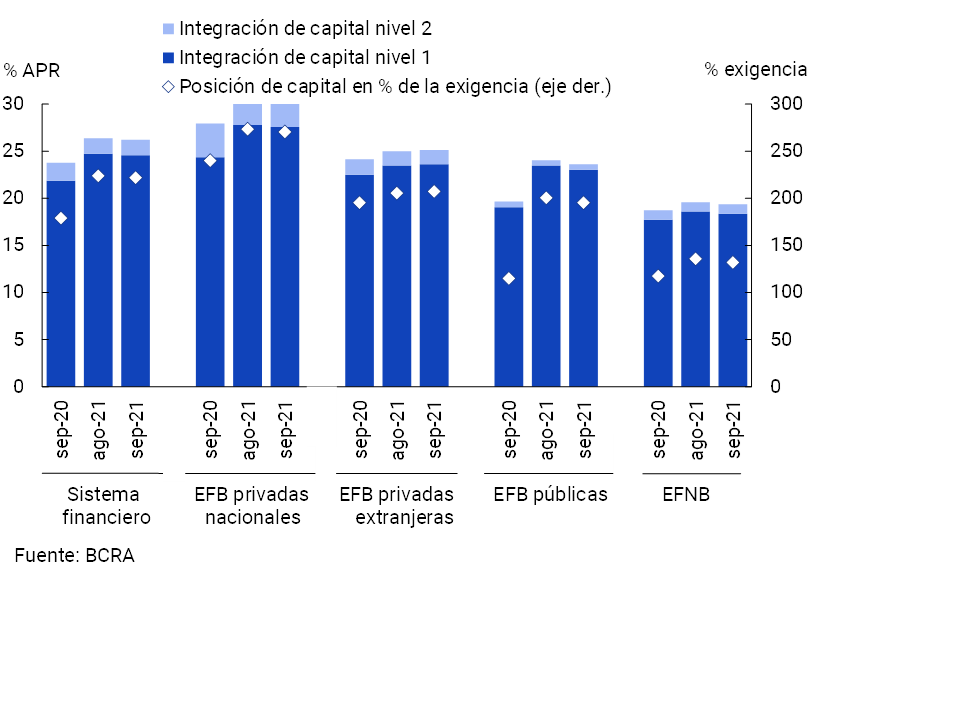
In September, the aggregate regulatory capital ratios of the financial system fell slightly, remaining at high levels in relation to the average of the last 5 years. The capital integration (RPC) of all entities decreased 0.2 p.p. of risk-weighted assets (RWA) compared to the August figure, to 26.2% (+2.4 p.p. y.o.y., see Chart 13). The surplus capital position (CPR net of the minimum regulatory capital requirement) in terms of the regulatory requirement for the sector aggregate totaled 222% in the month, 2 p.p. less than in August (+42.9 p.p. y.o.y.). For its part, the leverage ratio13 totaled 13.2% at the systemic level in September, 0.4 p.p. and 1.3 p.p. more than in the previous quarter and in the same period of 2020, respectively. Thus, the current level of the leverage ratio continued to comfortably exceed the minimum locally required threshold of 3%, which is in line with international recommendations on the matter.
Figure 13 | Integration of regulatory capital
By financial institution group
At the end of the third quarter, all financial institutions continued to have a high degree of coverage against the credit risk assumed. In particular, the ratio between the surplus capital position and credit to the private sector net of forecasts stood at 32.9% for the financial system as a whole in the month, 7.1 p.p. more in a year-on-year comparison and well above the average of the last 10 years (14.1%).
With regard to the internal generation of capital in the financial system, the total comprehensive monthly results in homogeneous currency were equivalent to 0.6% annualized (y.) of assets (ROA) and 4% y. of net worth (ROE), down from the August figures. For the third quarter, the sector’s profitability indicators were slightly higher than those of the previous period, being below those evidenced in 2020 (see Chart 14).
Figure 14 | Comprehensive total profit in homogeneous currency of the financial system
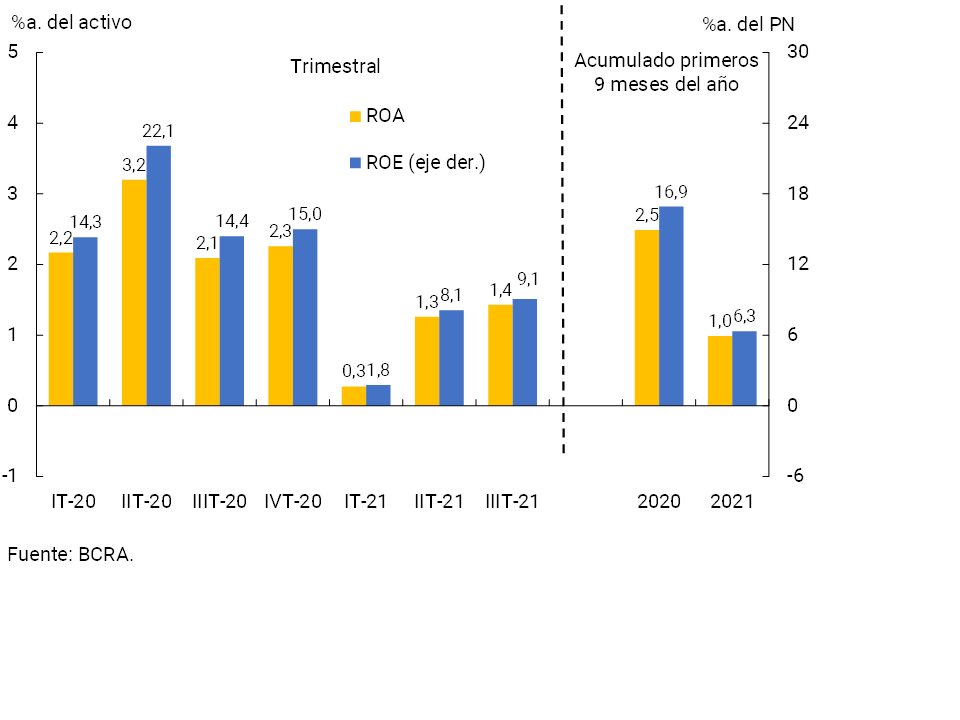
In the accumulated of the first 9 months of the year, the sector accrued an ROA of 1%y. and an ROE of 6.3%y., 1.5 p.p. and 10.6 p.p. below those recorded in the same period of 2020. The main factors that explained the performance were associated with greater losses due to currency adjustments (linked to the evolution of the price index), increase in the cost of funding for deposits in pesos, lower interest income in pesos and a greater relevance of tax burdens. These effects were partially offset by higher revenues, both from premiums for passes and securities, as well as by lower income tax accruals and reduced charges for uncollectibility, among others.
V. Payment system
In recent months, transfers of funds through electronic channels continued to show a positive performance.
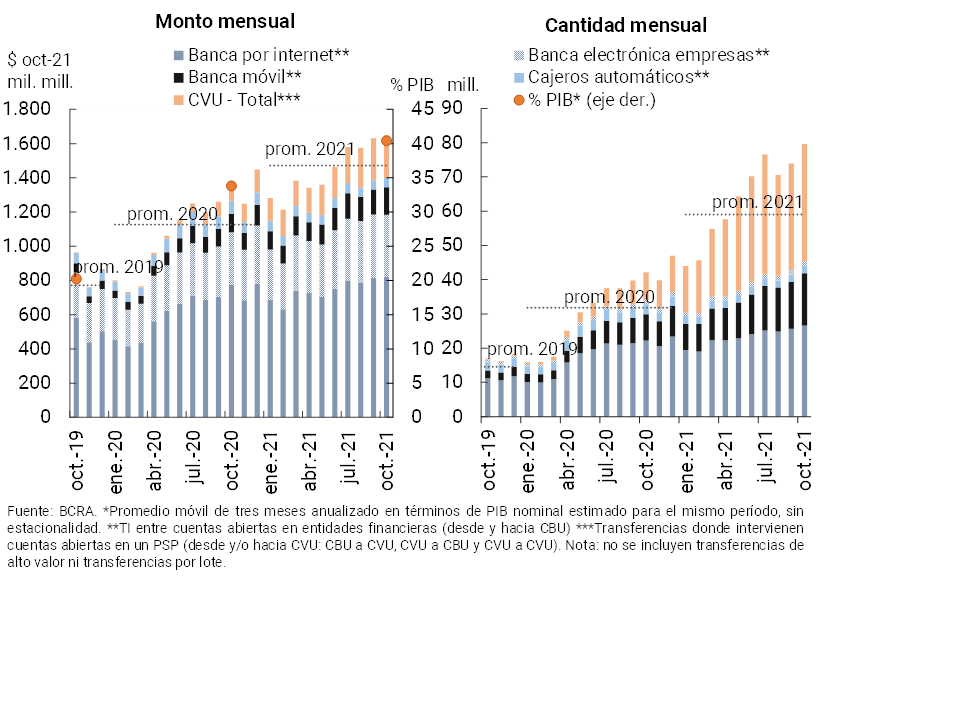
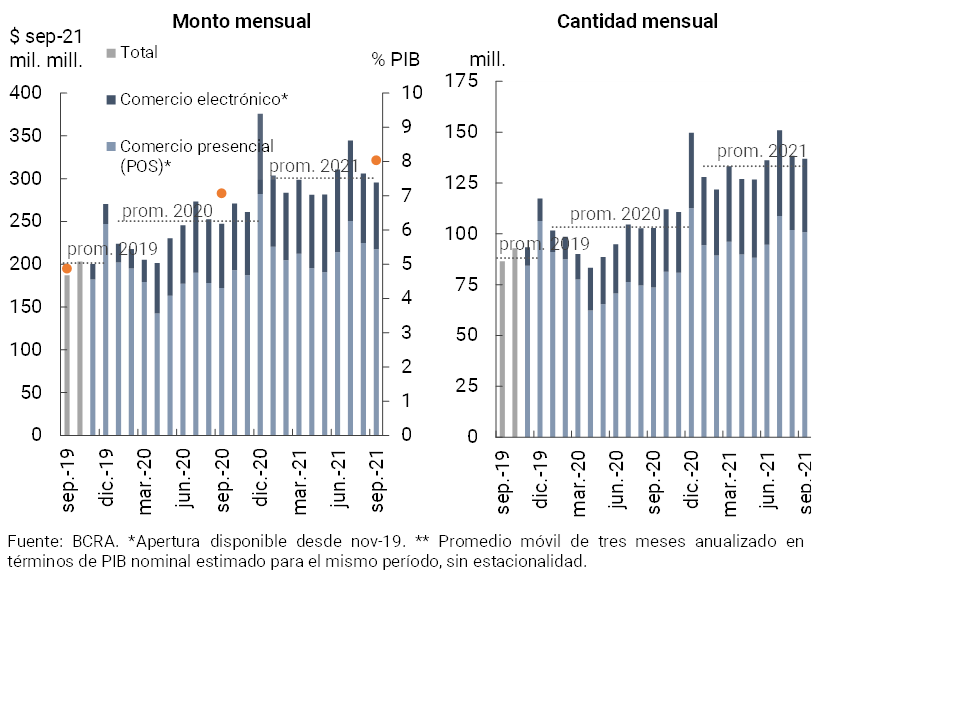
In October, immediate transfers increased compared to the previous month, both in amounts (+7.8%) and in real amounts (+1.7%). This behavior was observed both in transactions between accounts opened in financial institutions (between CBUs) and in transactions involving accounts in payment service providers (PSPs, from and/or to CVUs). In year-on-year terms, immediate transfers expanded 89% in amounts and 19.2% in real terms in amounts. It is estimated that as of October, immediate transfers represented 40.4% of GDP (+6.6 p.p. compared to the same month of the previous year, see Graph 15)14. The year-on-year performance of transfers involving PSP accounts (+102% YoY in real amounts and +320% YoY in amounts) and those made through mobile banking (+101% in amounts and +48% in real amounts) was highlighted15. The growth of transfers through digital means of payment – such as mobile banking – and the increased use of electronic wallets16 – with the intervention of CBU and/or CVU – account for a deepening of the process of digitization of means of payment that has been evident since the beginning of the pandemic17.
Figure 15 | Instant Transfers (TI)
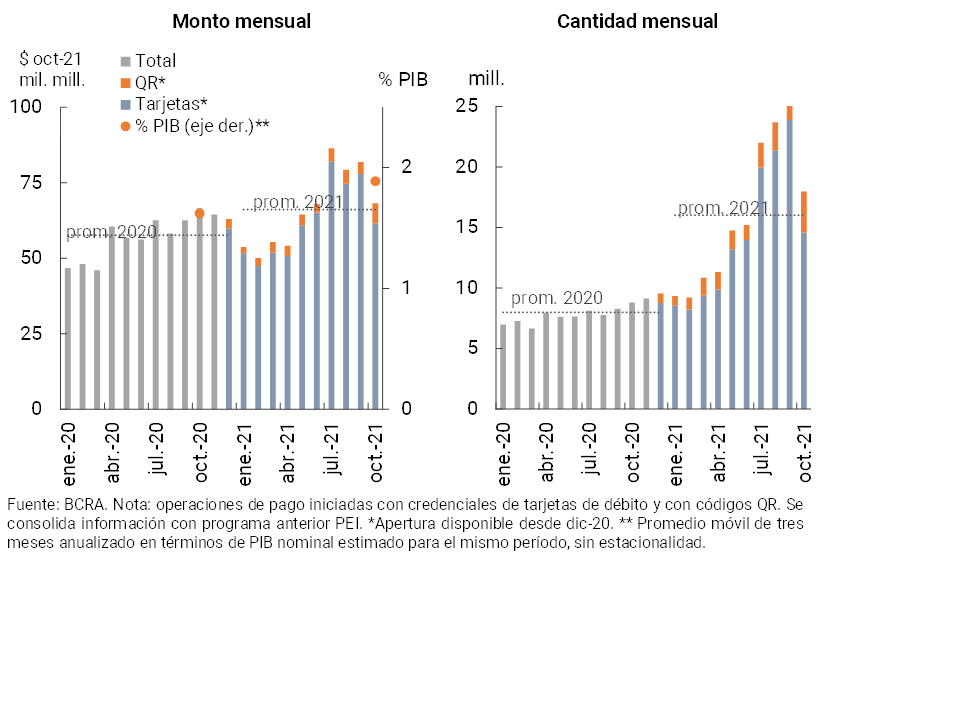
Payments with transfer18, which in terms of amounts are equivalent to only 5% of the values processed through immediate transfers, decreased in October mainly due to card operations. Payments made with QR increased significantly in the period, partially tempering the monthly performance of total payments with transfer19. Compared to the same month of the previous year, transfer payments (total) increased in amounts (+104%) and in real amounts (+2.4%, see Chart 16). Thus, it is estimated that this payment modality increased slightly in terms of GDP in a year-on-year comparison to represent 1.9% (+0.3p.p. y.o.y.).
Figure 16 | Transfer payments
Initiation methods
During September (latest available information) debit card transactions – face-to-face and electronic – decreased (see Graph 17). Despite the monthly performance, in year-on-year terms, debit card operations grew significantly (33% in amounts and +19.5% in real terms). This behavior was reflected in both face-to-face and electronic operations20. Thus, as of September, it is estimated that debit card transactions accounted for 8% of GDP (1 p.p. more than in the same month of the previous year).
Figure 17 | Debit card transactions
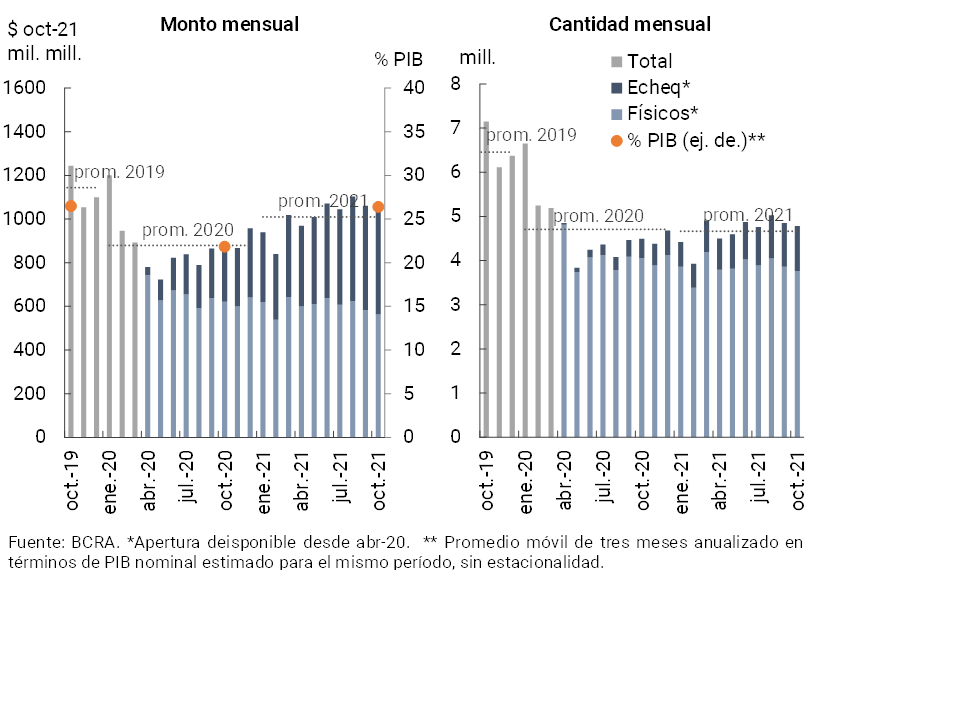
In October, the clearing of checks was reduced compared to the previous month, presenting a disparate behavior according to type of check: fewer operations (and values issued) in the physical format and growth in quantities in the electronic version (without changes in magnitude in terms of the amount traded). Thus, in October the ECHEQs continued to increase their weighting in total compensation to represent 21.3% in amounts (+11.5p.p. y.a.) and 45.8% in real amounts (+17.3p.p. y.o.y., see Chart 18). Reflecting the outstanding contribution that the ECHEQs had in the last year (+131% y.o.y. in quantities and +92.2% in real amounts), the total clearing of checks increased compared to the same period in 2020 (+6.5% in quantities and 19.6% in real in amounts). It is estimated that the amount of checks cleared in terms of GDP totaled 26.4% as of October (+ 4.6 p.p. y.o.y.).
Figure 18 | Check clearing
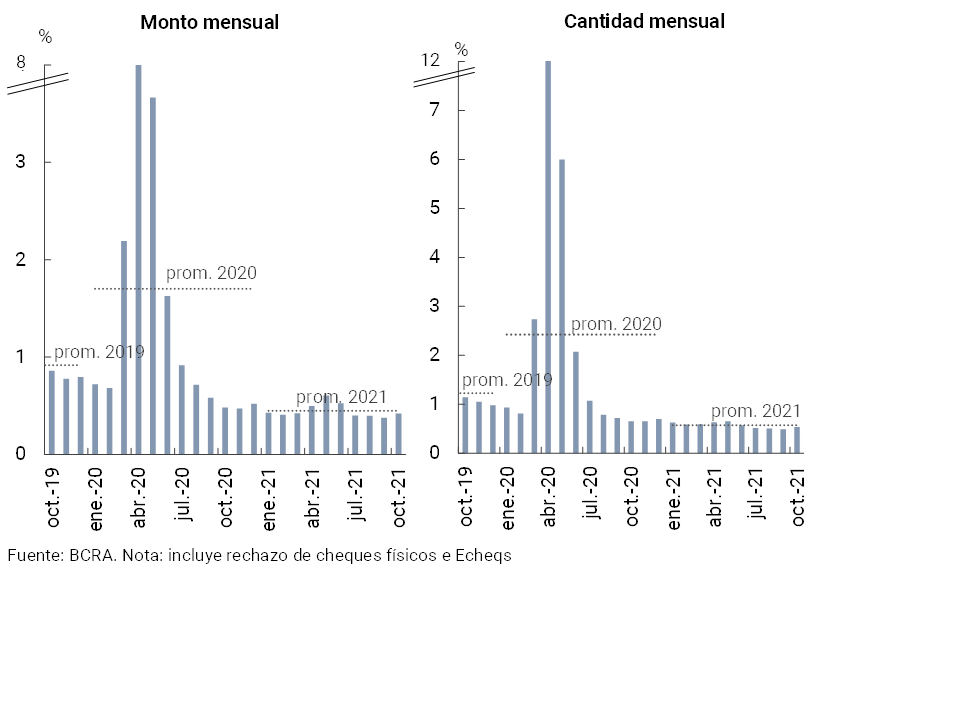
In October, the ratio of rejection of checks due to lack of funds in terms of the total compensated continued at limited levels21. In this context, the indicator increased slightly compared to the previous month (+0.05p.p. to 0.54% in quantities and +0.04p.p. to 0.42% in amounts, see Graph 19), although it remains at levels below the average for 2021. The current levels for this indicator were below those evidenced 12 months ago, both in quantities (-0.12p.p.) and in amounts (-0.06p.p.)
Figure 19 | Bounce checks due to insufficient funds
Back to top
References
1Differences in balance sheet balances expressed in homogeneous currency. Information extracted from the Monthly Accounting Information Regime (September 2021 latest information available at the time of publication of this Report)
2 Includes principal adjustments and accrued interest.
3 Throughout the Report, when reference is made to groups of private (national and/or foreign) and public financial institutions, it corresponds to banking entities. Non-bank entities will be referred to as “EFNBs”.
4 For more details, see Ordered Text “Line of financing for the productive investment of MSMEs”.
5 See Communication “A” “7082” and Communication “A” “7102”.
6See Communication “A” “7342”.
7 Including forward purchase and sale transactions of foreign currency classified off-balance sheet.
8 This ratio reached 29% if the accounting balance of forecasts is netted.
9 The balance in an irregular situation was even reduced in nominal values in the month.
10 See Communication “A” “6938”, Communication “A” “7107”, Communication “A” “7181”, Communication “A” “7245” and Point 2.1.1. of the Ordered Text “Financial Services in the Framework of the Health Emergency Provided for by Decree No. 260/2020 CORONAVIRUS (COVID-19)”. To date, the only measure in force for debtors is the transfer at the end of the life of the credit of the unpaid installments of the assistance granted to those who are employers covered by REPRO II (being left out of the reclassification process).
11 Considers availability, integration of minimum cash and BCRA instruments, in national and foreign currency.
12 It should be recalled that in terms of minimum cash, in September the increase in the maximum deduction of the requirement for financing granted within the framework of the “Ahora 12” Program came into force, which went from 6% to 8% of deposits (see Communication “A” “7334”). In turn, in the month the reduction of the minimum cash requirement for the equivalent of 60% of the financing agreed through the 0% rate credit line to single-tax persons 2021 also came into force (see Communication “A” “7342”).
13 Recommended by the Basel Committee—defined as the ratio of the highest quality regulatory capital to a broad measure of exposures.
14 When considering annualized amounts of the last three months.
15 MB’s operations include transfers through electronic wallets.
16 The BCRA provided that financial institutions and payment service providers that offer payment accounts (PSPOCP), which provide the service known as “digital wallet” or similar, must allow wallet holders to associate the demand and payment accounts of which they are holders or co-holders based on their CBU, CBU or ALIAS – indistinctly. See Communication “A” “7363”).
17 For more details, see “Financial Inclusion Report (FII)”.
18 Transfer payments represent a set of operations independent of immediate transfers. They correspond to payments initiated with debit card credentials and with open QR codes, while consolidating information previously presented as Immediate Electronic Payment (PEI)
19 The BCRA provided that financial institutions and PSPOCPs must enable QR codes for current accounts and payment accounts of legal entities. See Communication “A” “7362”).
20 The greater openness of the economy due to the relaxation of the measures adopted during COVID-19 corresponds to a greater relative dynamism in face-to-face operations.
21 Considers physical checks as electronic.
Share on


