I. Financial intermediation activity
Financing to the private sector in national currency increased again in November, thus accumulating four consecutive months with positive real monthly variations. This performance continues to be driven both by the lines channelled to companies and those linked to household consumption.
In accordance with the main variations – in homogeneous currency – of the balance of the financial system on items in pesos1, in November the balance of credit to the private sector and the public sector increased. These movements took place in a scenario of a fall in liquidity in the broad sense of the set of financial institutions. On the other hand, in the segment of items in foreign currency2 , a decrease in financing to the private sector and in the liquidity of the aggregate of the financial system was observed. These last variations were mainly offset by a reduction in the balance of deposits to the private sector in the same denomination.
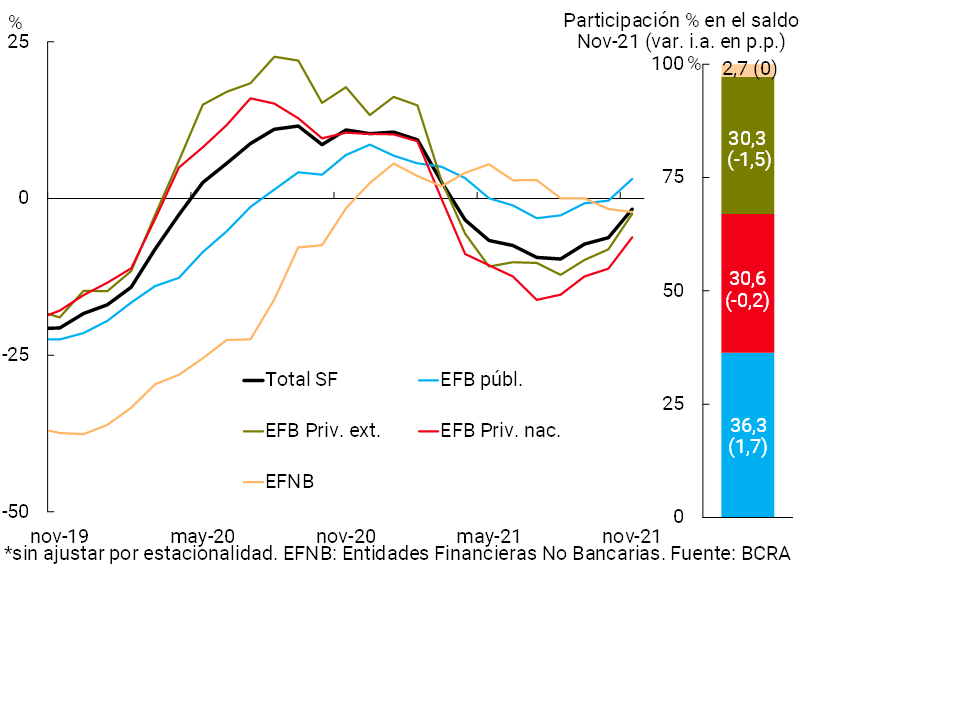
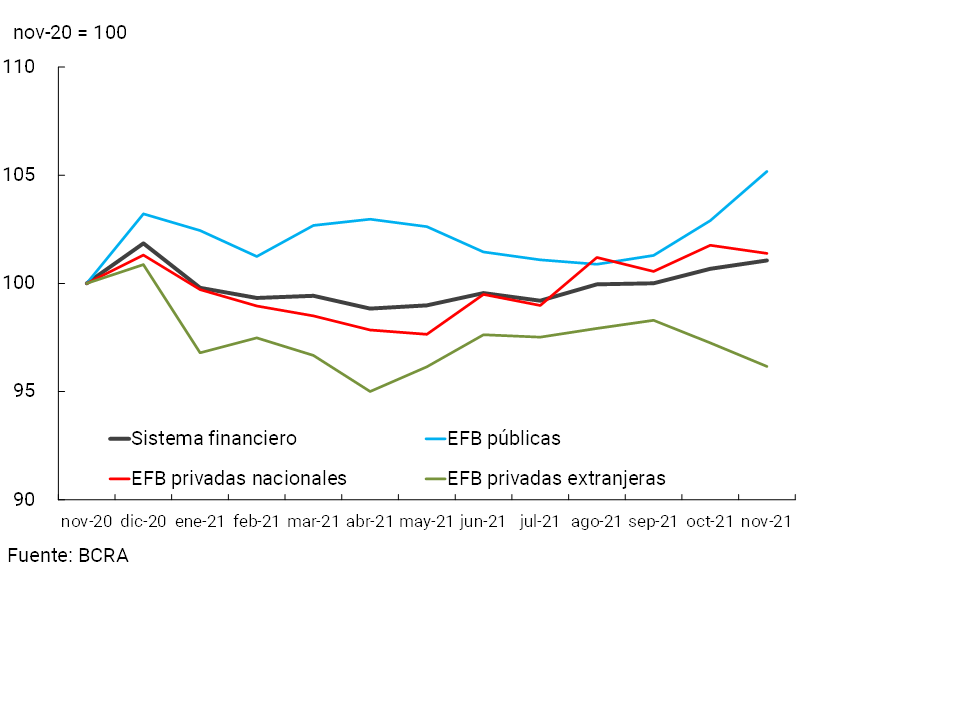
In November, the balance of financing to the private sector in national currency increased by 4.9% in real terms compared to the previous month (+7.5% nominal)3 (see Chart 1). All credit lines showed a real increase in the period, with greater relative dynamism in the corporate segment (advances, documents and pledges) and in cards. Although the increase in credit in the month was verified in all groups of financial institutions, the financing channeled by foreign and national private entities verified the highest real growth in the period (5.8% and 5.5% real respectively). In year-on-year terms, in November the balance of financing in pesos to the private sector of the financial system fell by 1.7% in real terms (+48.5% nominal), with a recomposition in the year-on-year rate of change in most groups of financial institutions (see Chart 2)4.
Graph 1 | Credit balance to the private sector in pesos
In real terms*
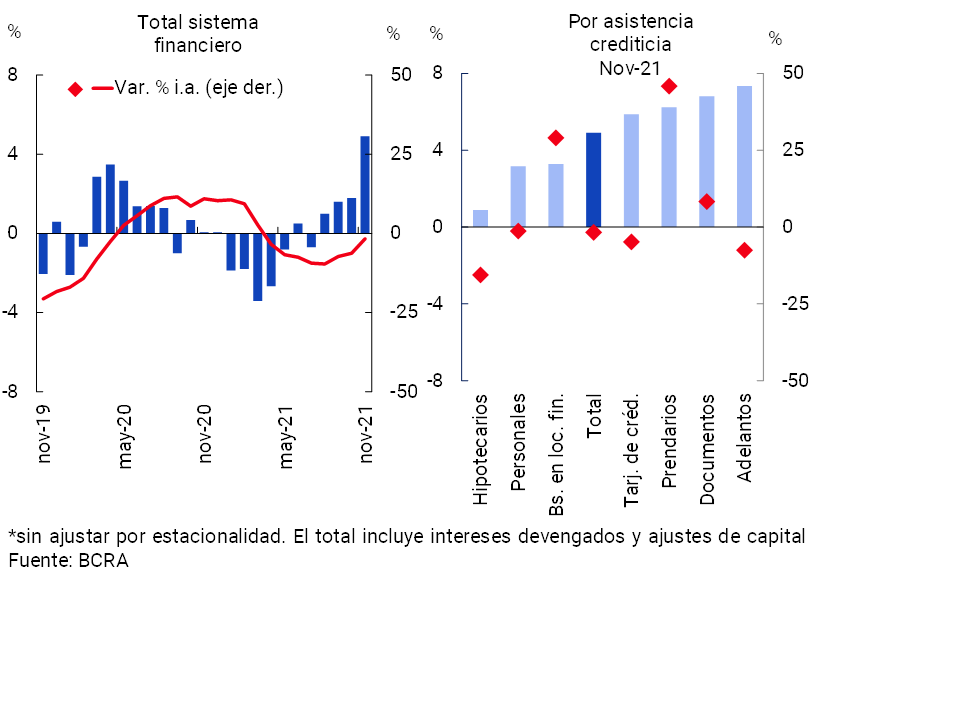
Graph 2 | Credit balance to the private sector in pesos
In real terms* – Year-on-year changes
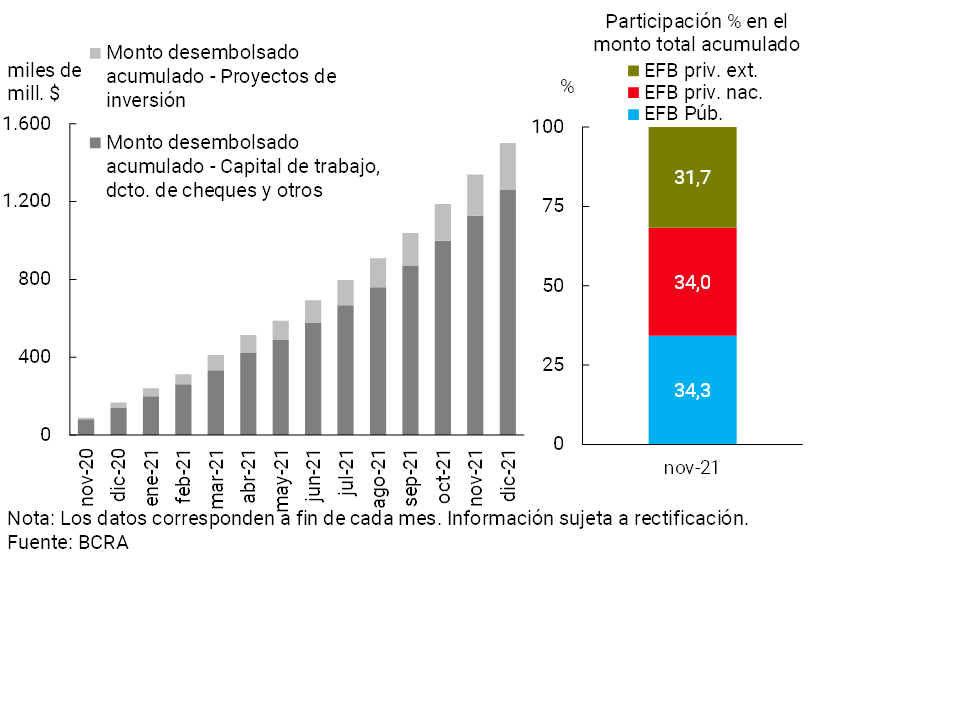
Within the framework of the various credit stimulus measures implemented by the BCRA, at the end of December more than $1.5 billion had been disbursed through the Financing Line for Productive Investment of MSMEs5 (LFIP) (see Graph 3), distributed among more than 209,300 companies. Public financial institutions accounted for 34.3% of the total granted, followed by national private institutions (34%) and foreign private institutions (31.7%).
Graph 3 | Financing Line for Productive Investment (LFIP) of MSMEs
Through the line of financing at subsidized interest rates for companies enrolled in the “Emergency Assistance Program for Work and Production” (ATP)6, more than 20,900 loans have been granted, totaling disbursements of close to $14,200 million at the end of 2021.
At the same time, the “Zero Rate Credit 2021” Program accumulated disbursements of more than $38,900 million until the beginning of January 2022, which were implemented through 333,903 loans7. In this way, considering the 2020 Zero Rate Program and the 2021 Program, more than $104,200 million of loans granted to date were accumulated.
On the side of the segment in foreign currency, in November the balance of credit to the private sector in this denomination fell 13.6% compared to October – in currency of origin – with a generalized fall in all groups of financial institutions. In this context, the total credit balance (including domestic and foreign currency) to the private sector increased by 2.7% in real terms in the month (5.2% nominal), decreasing 6.2% in real terms year-on-year.
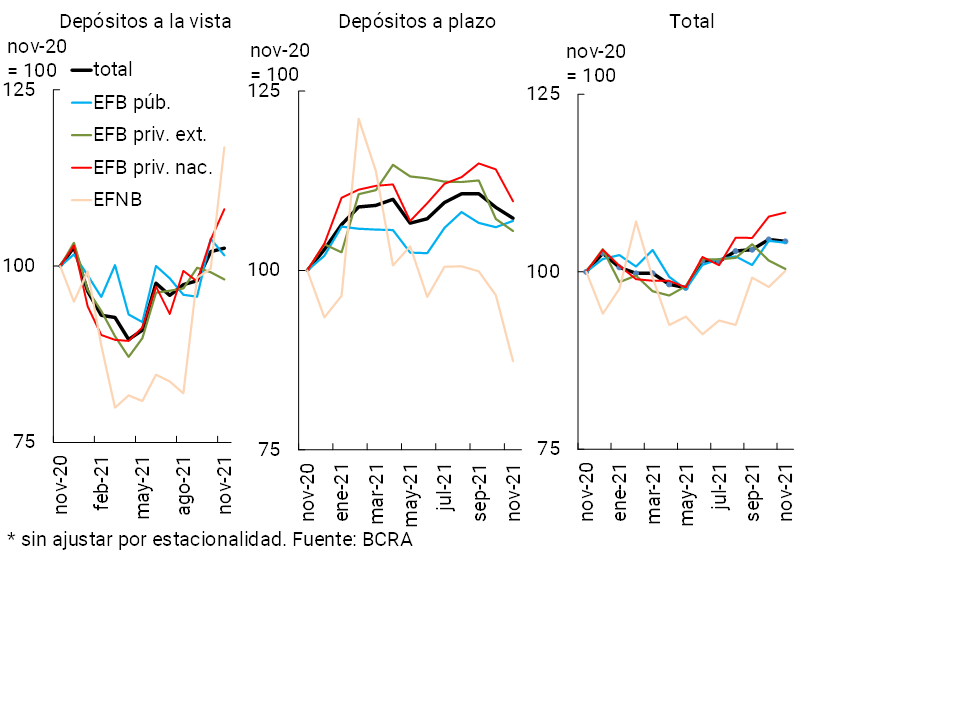
When considering the funding of the financial system aggregate, in November the balance of deposits in pesos of the private sector fell by 0.3% in real terms (+2.2% nominal), with mixed performances among the different groups of financial institutions (see Chart 4). This evolution was mainly driven by time deposits, which fell by 1.4% in real terms (+1.1% nominal)8. Demand accounts increased by 0.5% in real terms in the period (+3% nominal).
Figure 4 | Balance of private sector deposits in pesos
In real terms*
For its part, the balance of deposits in foreign currency of the private sector fell 4.7% – in currency of origin – in November. Thus, total private sector deposits (in domestic and foreign currency) decreased 1.3% in real terms compared to the previous month (+1.2% nominal).
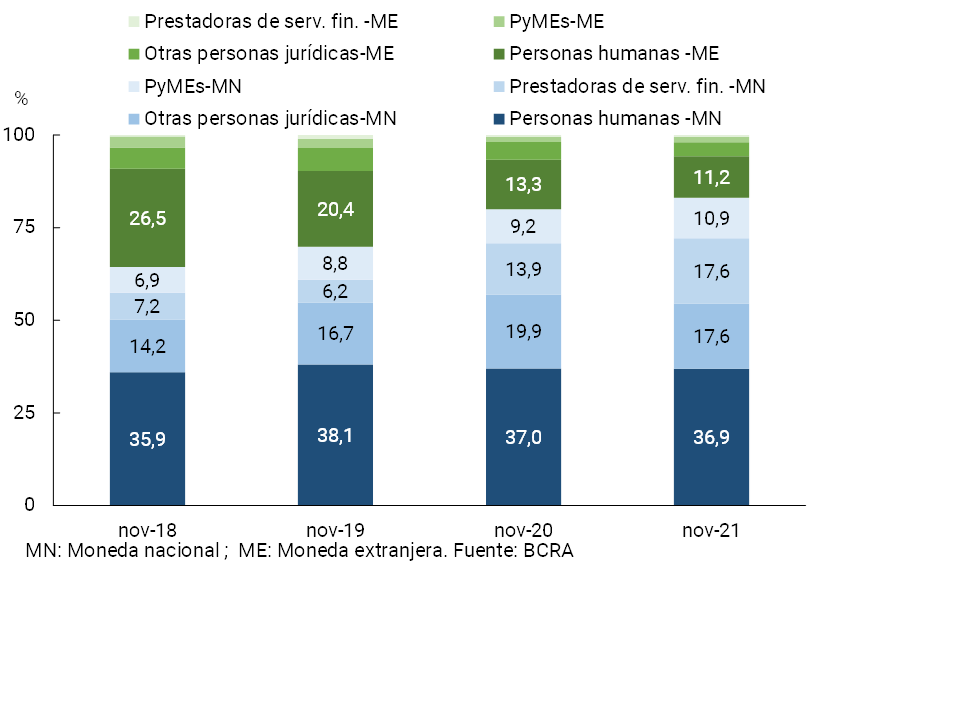
When disaggregating private sector deposits by currency and type of customer, in the last four years there has been an increase in the relevance of those in national currency (see Graph 5). In particular, deposits in pesos of financial service providers showed the largest relative increase during this period (totaling 17.6%)9. In contrast, deposits in foreign currency were losing importance in the total, a performance driven mainly by the lower placements of individuals in that denomination (reaching 11.2%). On the other hand, without showing major changes in recent years, deposits in national currency from individuals continue to concentrate most of the deposits of the private sector (up to 36.9%).
Graph 5 | Private sector deposit balance by type of depositor – Financial system – Share %
In order to continue strengthening the conditions of monetary, exchange rate and financial stability, the BCRA recently redesigned its monetary policy instruments. In this framework, it was decided to increase the interest rate of the LELIQ to 28 days term, going from 38% to 40% nominal annual. At the same time, it increased the maximum limit of holding LELIQ to 28 days for up to an amount proportional to the balance of private sector time deposits that each financial institution holds the previous month. For its part, a new LELIQ was created with a 180-day term, with a fixed rate of 44% nominal annual and the passive passes to 7 days are gradually eliminated. Finally, in order to reflect the rise in the monetary policy interest rate on the return of time deposits in pesos, the minimum limits of interest rates on fixed terms were raised: 39% nominal annual for 30-day placements by individuals, and 37% nominal annual for the rest of depositors10.
In a year-on-year comparison, the balance of deposits in pesos in the private sector increased by 4.3% in real terms (+57.6% nominal), with increases in both time deposits (+7.3% real or +62.1% nominal) and demand deposits (+2.5% real or +54.9% nominal). The balance of public sector deposits in national currency grew 9.3% YoY in real terms (+65.2% YoY nominal). Thus, total deposits in pesos of the private and public sectors accumulated an increase of 5.6% y.o.y. (+59.6% y.o.y. nominal). Thus, the real balance of total deposits (all currencies and both sectors) of the aggregate of the financial system increased by 2.3% YoY in real terms (+54.5% YoY in nominal terms).
II. Evolution and aggregate composition of the balance sheet
In November, the total assets of the financial system grew 0.4% in real terms, with an increase in public banking financial institutions and falls in the rest of the groups of entities (see Chart 6). In the last twelve months, the sector’s assets increased by 1.1% in real terms.
Graph 6 | Total assets of the financial system
In real terms
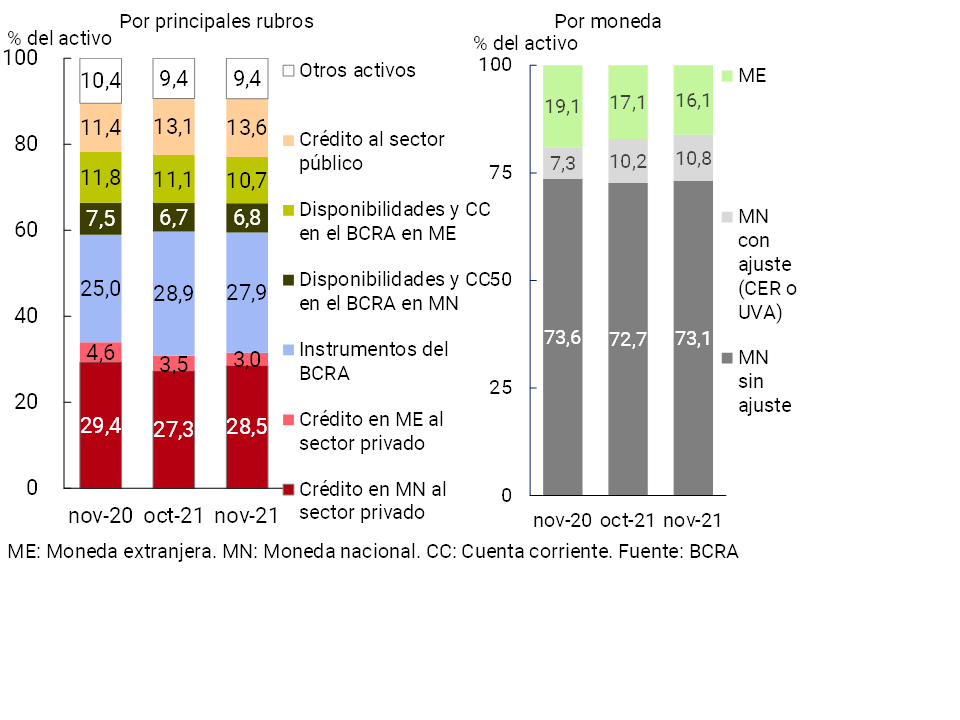
In terms of the composition of the total assets of the financial institutions as a whole, in November the relative importance of the balance of credit in pesos to the private sector and, to a lesser extent, of financing to the public sector increased. In contrast, the rest of the main items that make up the asset reduced their participation in the total (see Graph 7). When differentiating by currency, the relevance of assets in national currency (without and with CER adjustment) increased in the month, while the share of assets in foreign currency continued to decrease.
Figure 7 | Composition of total assets
Financial system – Share %
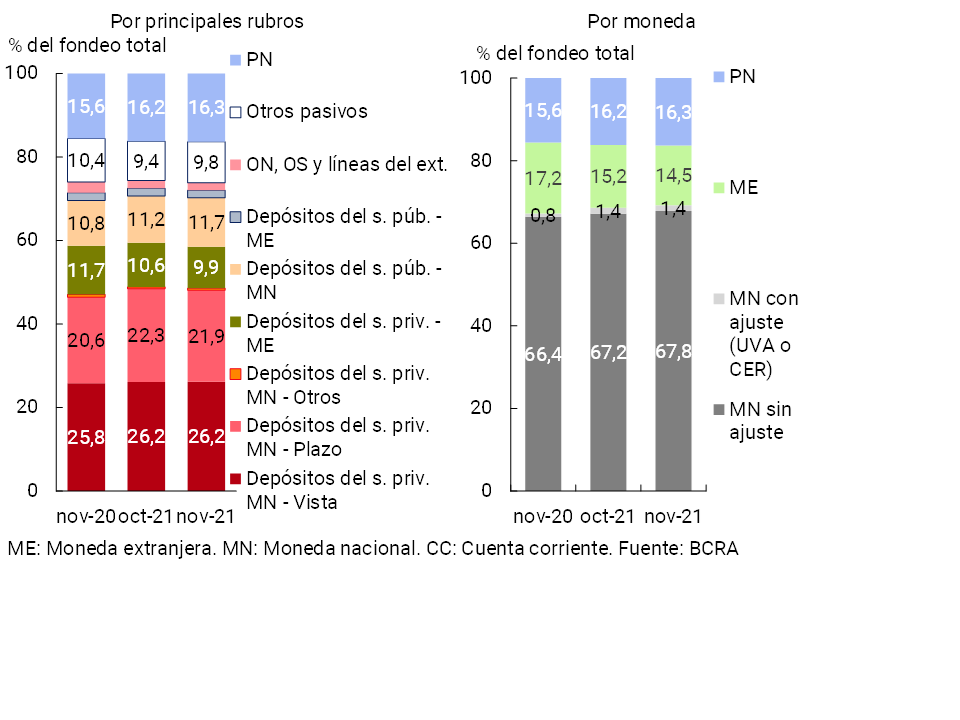
With regard to the weighting of the main items that make up the funding of the financial system aggregate, in November there was an increase in deposits in pesos in the public sector and a decrease in time deposits in national currency in the private sector and in total deposits in foreign currency in the aforementioned sector (see Chart 8). In this context, the relative importance of items in pesos without an adjustment clause increased during the month, reducing the weight of the segment in foreign currency.
Figure 8 | Total system funding composition
In % of total funding (liabilities + equity)
The spread between assets and liabilities in foreign currency11 of the financial system decreased 0.5 p.p. of regulatory capital in November, to 12.9% (-1 p.p. y.o.y.). For its part, it is estimated that in the month the spread of the items with CER adjustment clause (and/or UVA) represented 65.7% of the regulatory capital at the systemic level, increasing both in monthly and year-on-year terms (+3.9 p.p. and +16.8 p.p. respectively).
III. Portfolio quality
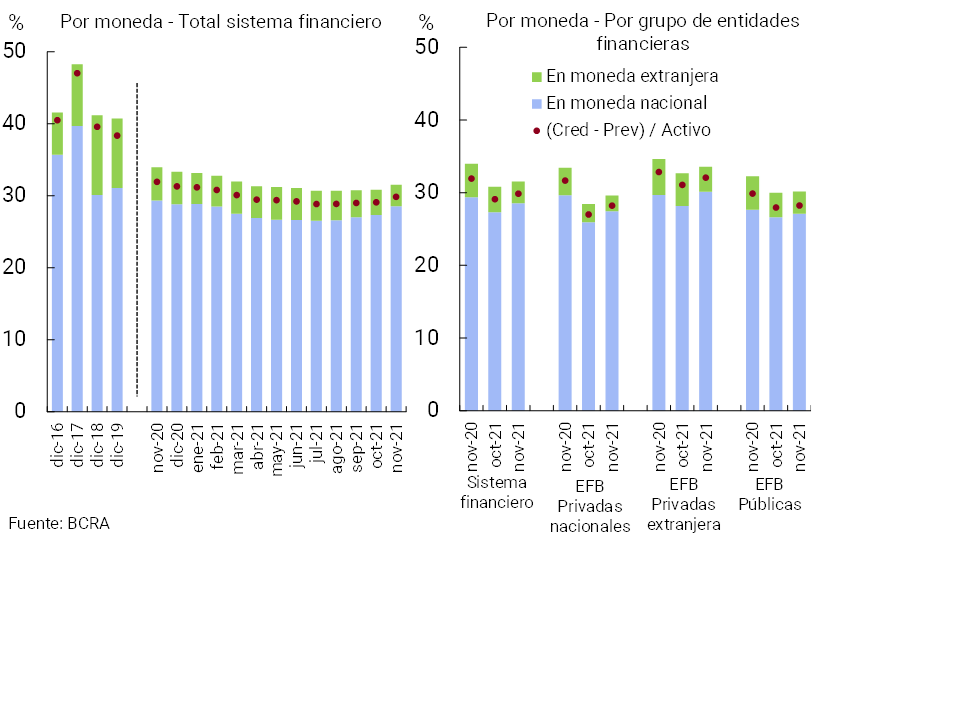
In November, the financial system’s exposure to the private sector increased. Credit to households and companies reached 31.5% of assets (see Chart 9), 0.7 p.p. more than last October (the highest monthly increase in the last 12 months), and -2.4 p.p. compared to the same period in 2020. The monthly dynamics were mainly reflected in private banking financial institutions and was explained by the segment in local currency, which increased its weighting in total assets by 1.2 p.p. at the systemic level to 28.5% (financing in foreign currency reduced its relative weight by 0.5 p.p. of assets in the month, to 3%).
Graph 9 | Credit balance to the Private Sector / Assets
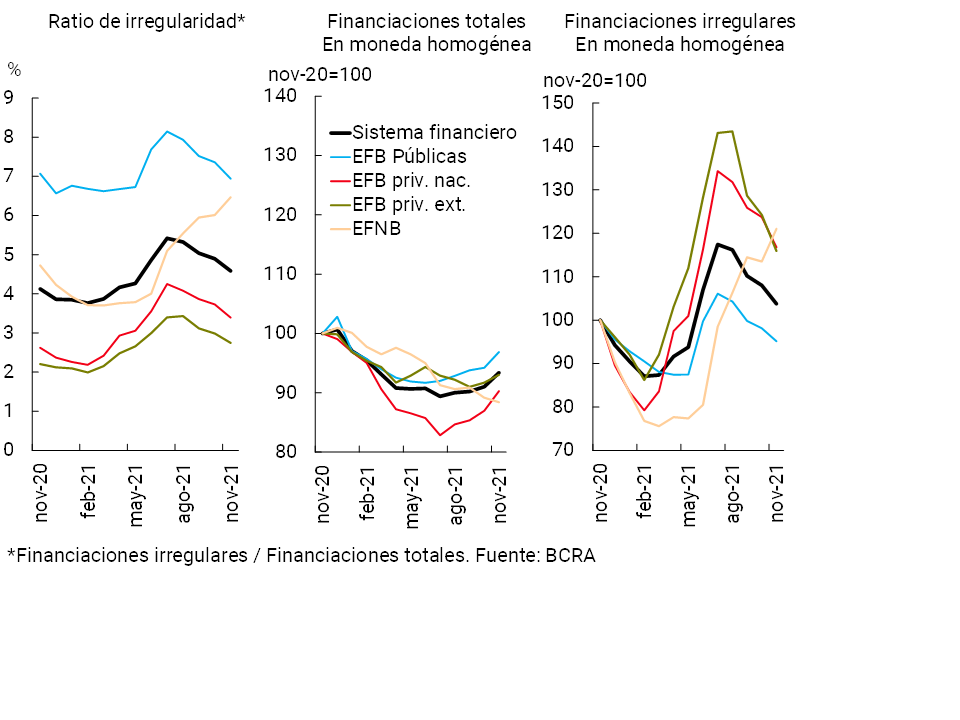
In November, the private sector delinquency indicator totaled 4.6% for the aggregate of entities, 0.3 p.p. less than last month. The monthly performance of this ratio reflected the combined effect of a decrease in the irregular balance (-1.5% nominal and -4% real) and an increase in the total balance of financing to the private sector (+5.1% nominal and +2.6% real, see Chart 10). The dynamics of credit quality occur in the current context of targeting financial relief measures12. With the exception of the EFNBs, all groups of financial institutions reduced their irregularity ratio in November.
Figure 10 | Irregularity of credit to the private sector
By Entity Group
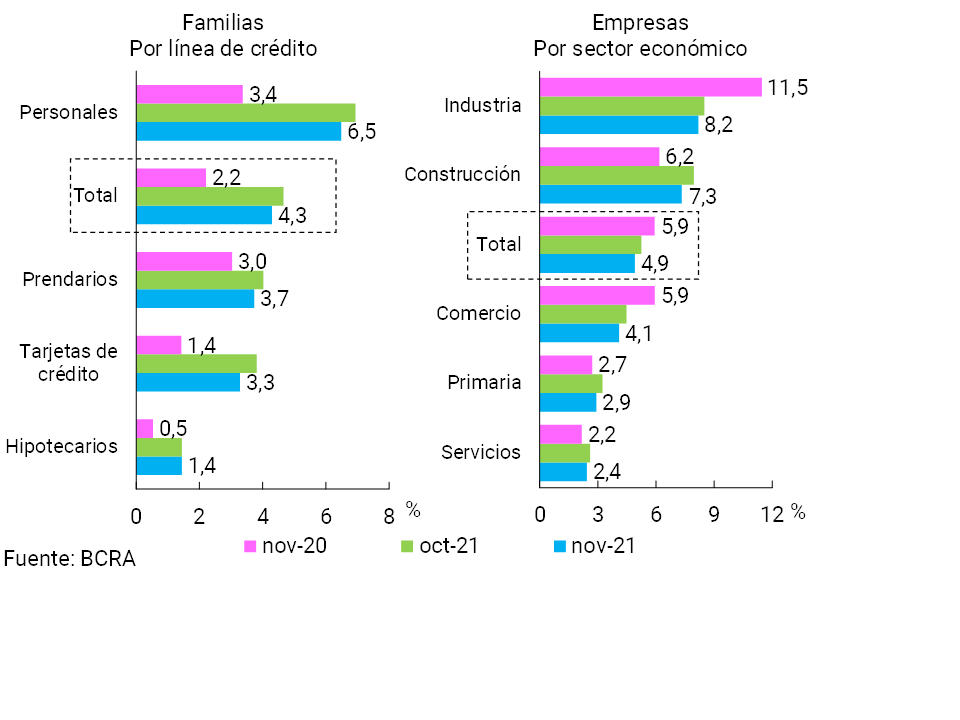
The indicator of irregularity of loans to households fell by 0.4 p.p. on a monthly basis to a total of 4.3% at the systemic level (+2.1 p.p. y.o.y.), a generalized performance among different credit lines (see Graph 11). The NPL indicator for corporate loans also fell in the month: -0.3 p.p. to 4.9% for the aggregate of entities (-1 p.p. y.o.y.). The credit quality of firms improved on a monthly basis in all economic sectors (see Chart 11).
Figure 11 | Irregularity of credit to the private sector
By type of debtor
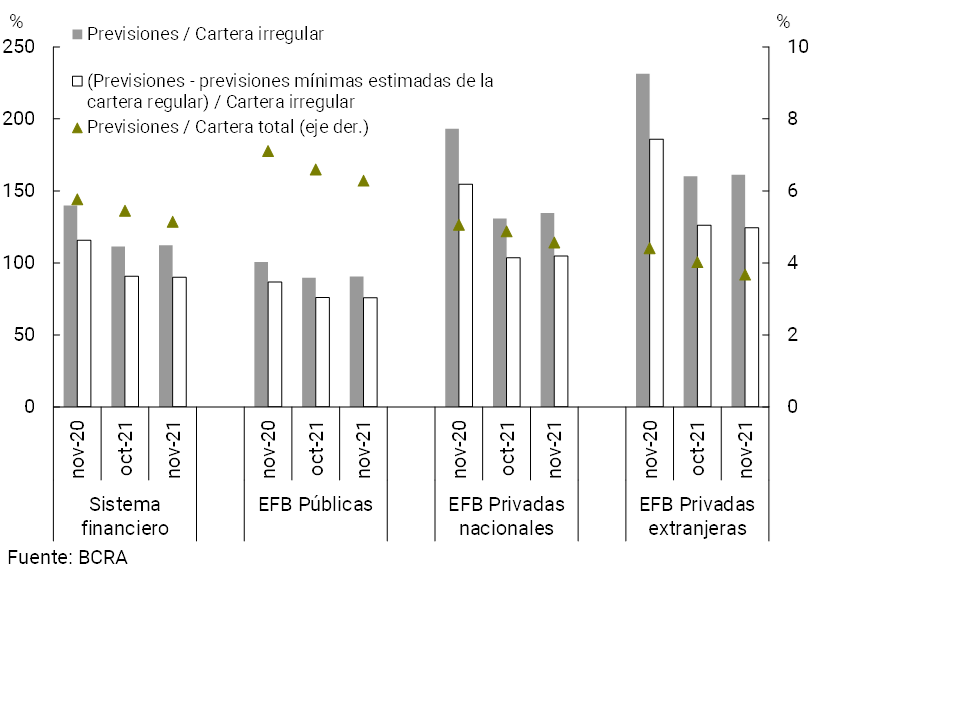
The forecast for the sector continued to be high (see Graph 12). In November, the total forecasts represented 5.1% of total credit to the private sector (-0.3 p.p. monthly and -0.6 p.p. y.o.y.) and 112.1% of the non-performing portfolio of this sector for the aggregate of entities (+0.9 p.p. monthly and -27.6 p.p. y.o.y.). On the other hand, the forecasts attributable to the private sector’s irregular portfolio (following the criteria of the minimum regulatory forecasts for uncollectibility risk) totaled 90% of said portfolio in the month at the systemic level.
Figure 12 | Credit to the private sector and forecasts
By Entity Group
IV. Liquidity and solvency
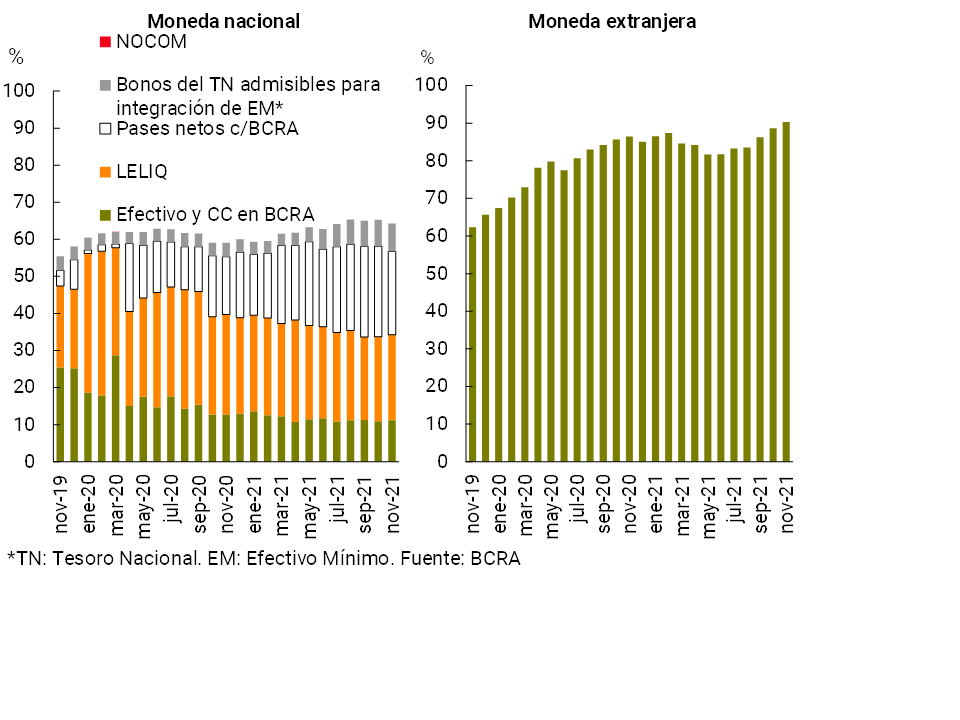
In November, the financialsystem’s broad sense liquid assets 13 accounted for 68.5% of total deposits (64.3% for items in pesos and 90.3% for the foreign currency segment, see Chart 13), 0.8 p.p. less than in October (-1 p.p. and +1.7 p.p. for items in local currency and foreign currency, respectively). Considering the composition of liquidity for the segment in national currency, it was observed that in the month the relevance of the holdings of LELIQ, the balances of the current accounts that the entities have in this Institution and the national public securities eligible for minimum cash integration increased slightly, while the weighting of net passes with the BCRAdecreased 14. In a year-on-year comparison, the broad liquidity indicator (for the total of items in domestic and foreign currency) increased 4.3 p.p. at the aggregate level.
Figure 13 | Liquidity of the financial system
In % of deposits
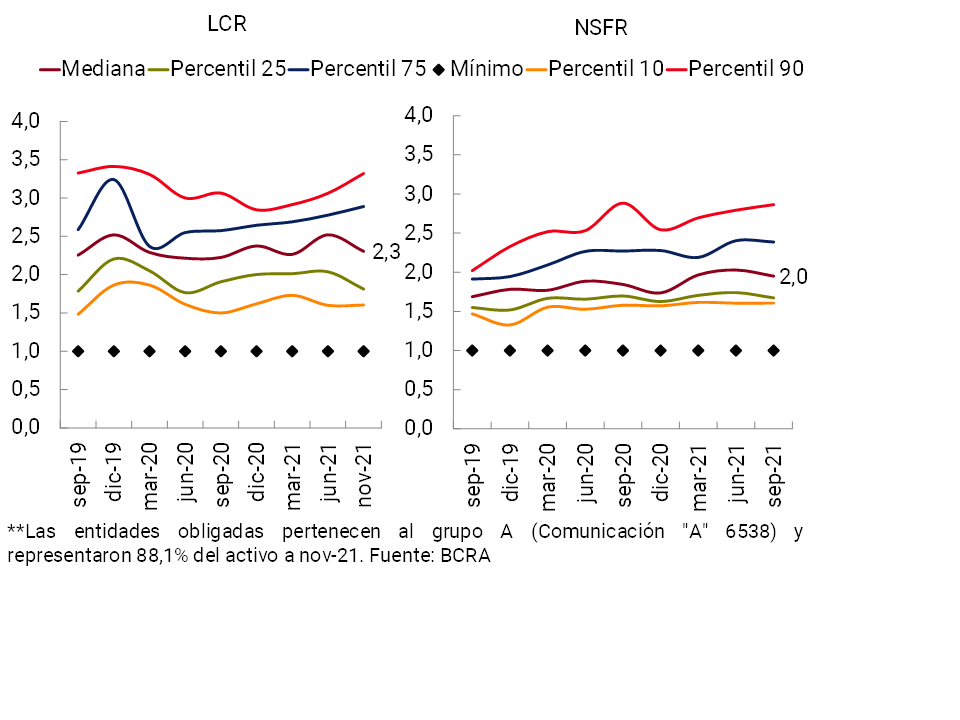
With regard to the liquidity ratios that follow the Basel Committee’s recommendations, the month noted that the group of entities obliged to comply with these requirements (Group A) continued to see levels well above the minimum required at the local level. As of November, the median Liquidity Coverage Ratio (LCR) stood at 2.3 (see Chart 14), while the median Stable Net Funding Ratio (NSFR) totaled 2 in September (latest available information), compared to a minimum of 1 for both indicators15.
Figure 14 | Basel liquidity indicators
Solvency indicators remained elevated in November, at a level slightly below those of October. Capital integration (RPC) decreased 0.5 p.p. of risk-weighted assets (RWA) for the sector as a whole, to 25.7% (+2.5 p.p. y.o.y., see Chart 15), in a context in which lending grew significantly compared to the previous month. It should be remembered that more than 94% of the regulatory capital is made up of Tier 1 Capital, with a greater capacity to face potential losses. In turn, the surplus capital position (difference between RPC and the minimum regulatory capital requirement) totalled 216% of the regulatory requirement for all institutions in the month, 5.7 p.p. less than in October (+38.5 p.p. y.o.y.).
Figure 15 | Integration of regulatory capital
By financial institution group
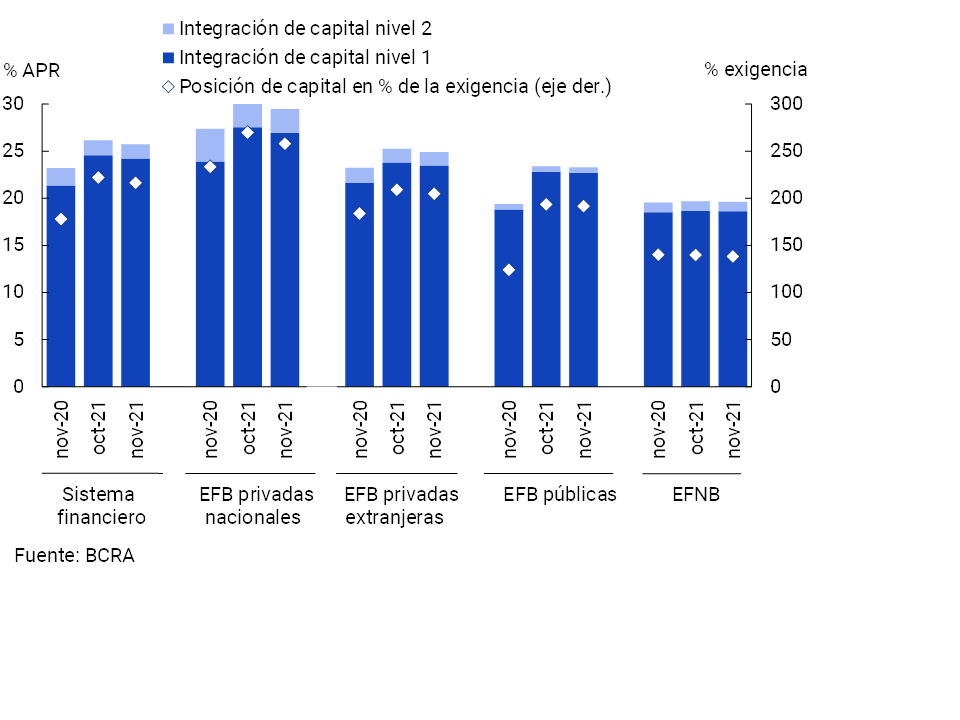
In this context, the ratio between the excess regulatory capital position and credit to the private sector net of forecasts16 stood at 31.7% at the systemic level in November, 1 p.p. below last month’s figure and 5.8 p.p. higher than in November 2020. At the aggregate level, the current value of this indicator is well above the average of the last 10 years – 14.5%.
In relation to profitability indicators, in November the sector accrued a positive comprehensive total result in homogeneous currency, thus accumulating in the 11 months of 2021 profits equivalent to 1.1% annualized (a.) of assets (ROA) and 7% y. of equity (ROE) (see Chart 16). These levels were lower than those evidenced in the same period of 2020 (-1.1 p.p. and -7.9 p.p. in terms of assets and equity, respectively).
Figure 16 | Comprehensive total profit in homogeneous currency of the financial system
By financial institution group
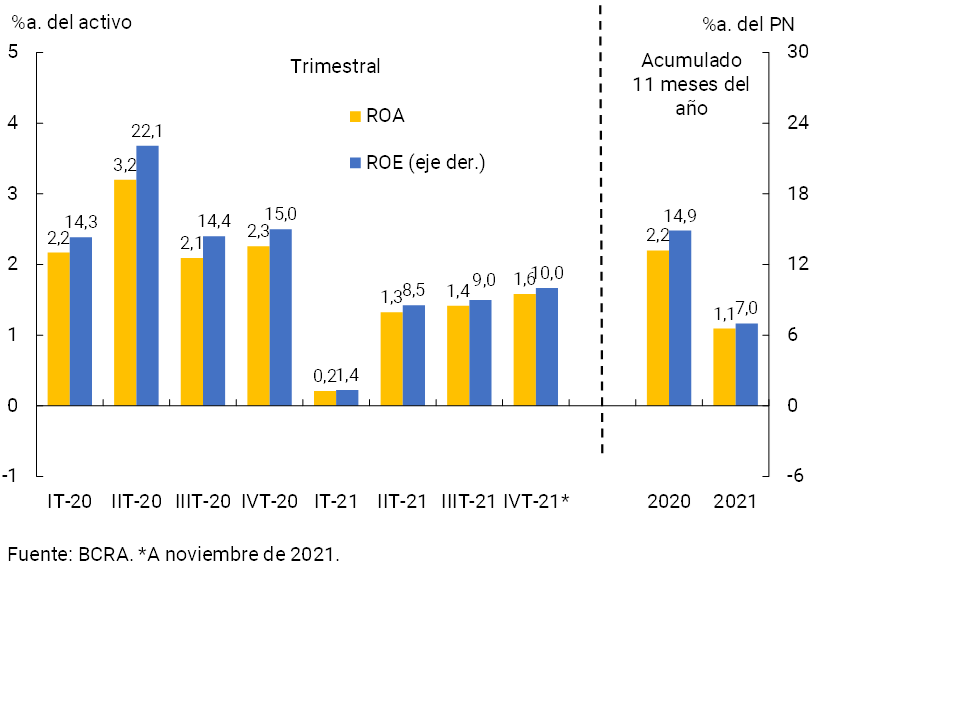
Among the main factors that explained the year-on-year reduction in ROA (or ROE) accumulated in 11 months were the higher monetary losses (adjusted for inflation), the increase in the cost of funding deposits in pesos and the reduction in interest income in pesos. For its part, this dynamic was partially offset by higher income from premiums for passes and securities17, a decrease in charges for uncollectibility and a lower accrual of income tax, among others.
V. Payment system
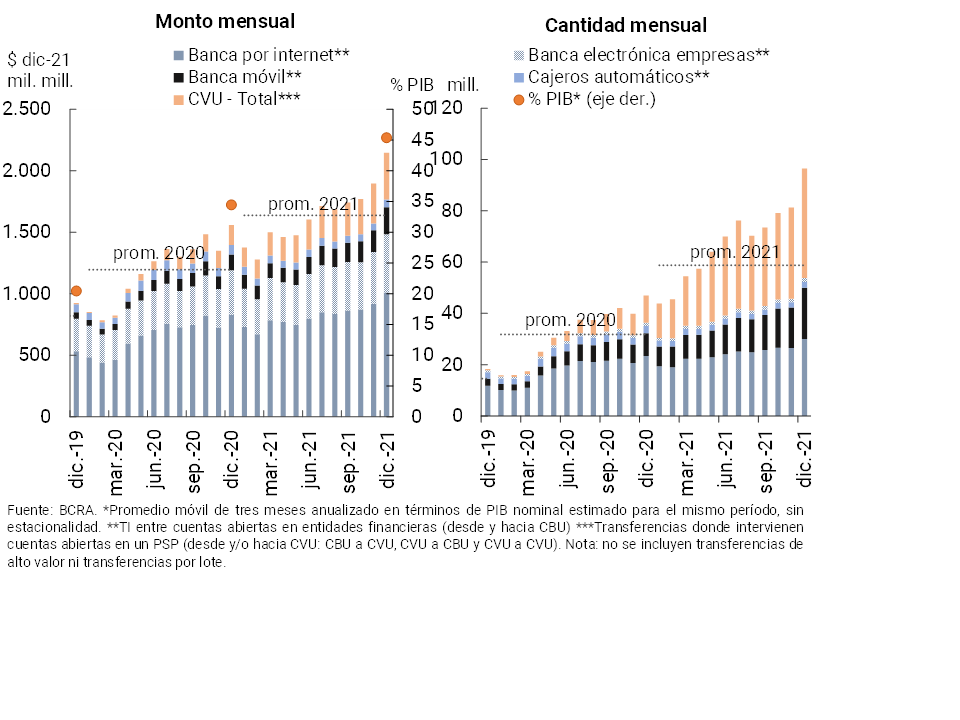
In December, immediate transfers increased compared to the previous month in amounts (+18.7%) and in real amounts (+13.3%), partly due to seasonal factors typical of the end of the year. This behavior was explained by the increases in transactions between accounts opened in financial institutions (between CBUs) and in transactions involving accounts in payment service providers (PSPs, from and/or to CVU). In year-on-year terms, immediate transfers expanded 105.5% in amounts and 37.7% in real terms in amounts. It is estimated that by December immediate transfers represented 45.4% of GDP18 (+10.9 p.p. compared to the same month of the previous year, see Graph 17)19.
Figure 17 | Instant Transfers (TI)
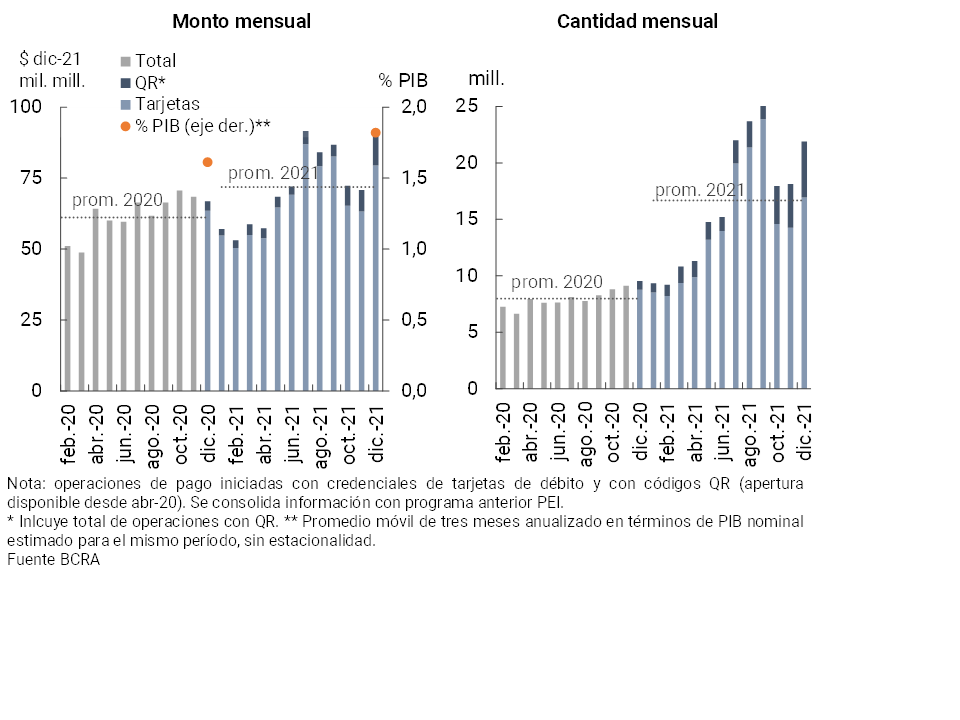
In December, payments with transfer20 increased significantly (see Graph 18), both in amounts (+20.8%) as well as in amounts (+27% in real terms), reflected in its two modalities: cards and QR. Compared to the same month of the previous year, total payments with transfer increased 128.4% in terms of the number of transactions and 34.5% in real terms with respect to the amounts operated. It is estimated that as of December, transfer payments represented 1.8% of GDP (+0.2 p.p. compared to the same month of the previous year. Specifically, payments initiated through QR within the framework of the Transfers 3.0 scheme have been growing at a remarkable rate in recent months. Full interoperability between wallets and acceptors is enabling greater use of digital payments by users. Thus, from the end of last November and mid-January (latest available information) interoperable transactions with codes reached 2.01 million operations (carried out for a total of $3,509 million)21.
Figure 18 | Transfer payments
Initiation methods
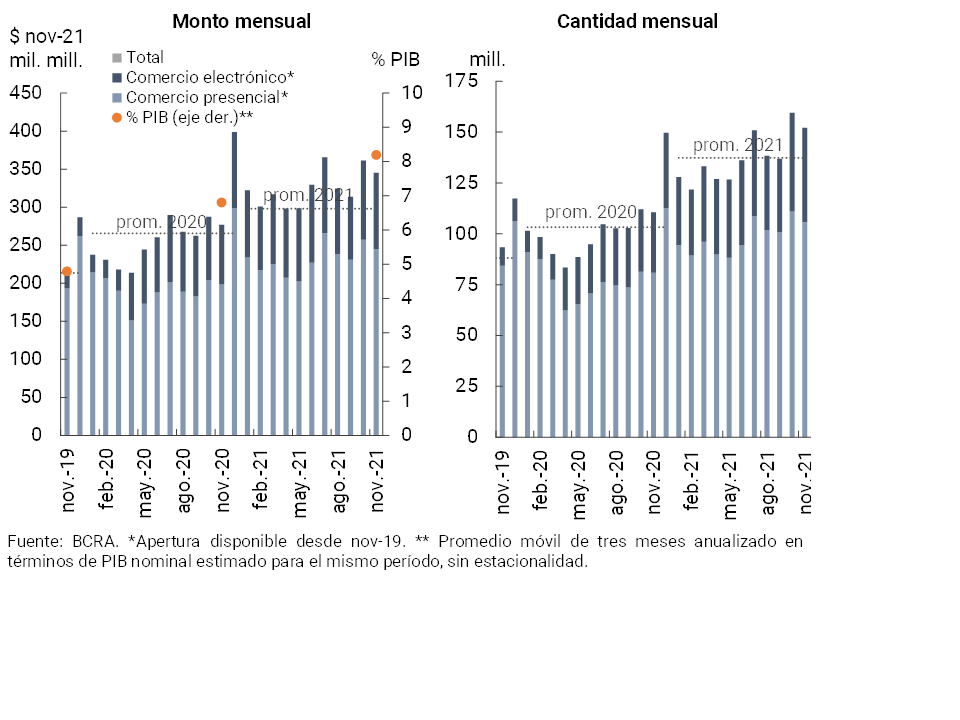
Partly associated with seasonal reasons, debit card transactions – face-to-face and electronic – decreased on November22 compared to October (latest available information): -4.6% in amounts and -4.5% in real terms (see Chart 19). Despite the monthly performance, in year-on-year terms these operations expanded significantly (+37.5% in quantities and +24.6% in real terms), showing greater dynamism in those carried out digitally. In this way, electronic transactions continued to increase their relative participation, representing 30.6% in the month in terms of the number of operations and 29.1% in amounts. It is estimated that as of November, the total volume of debit card transactions represented 8.2% of GDP (1.4 p.p. more than in the same month of the previous year).
Figure 19 | Debit card transactions
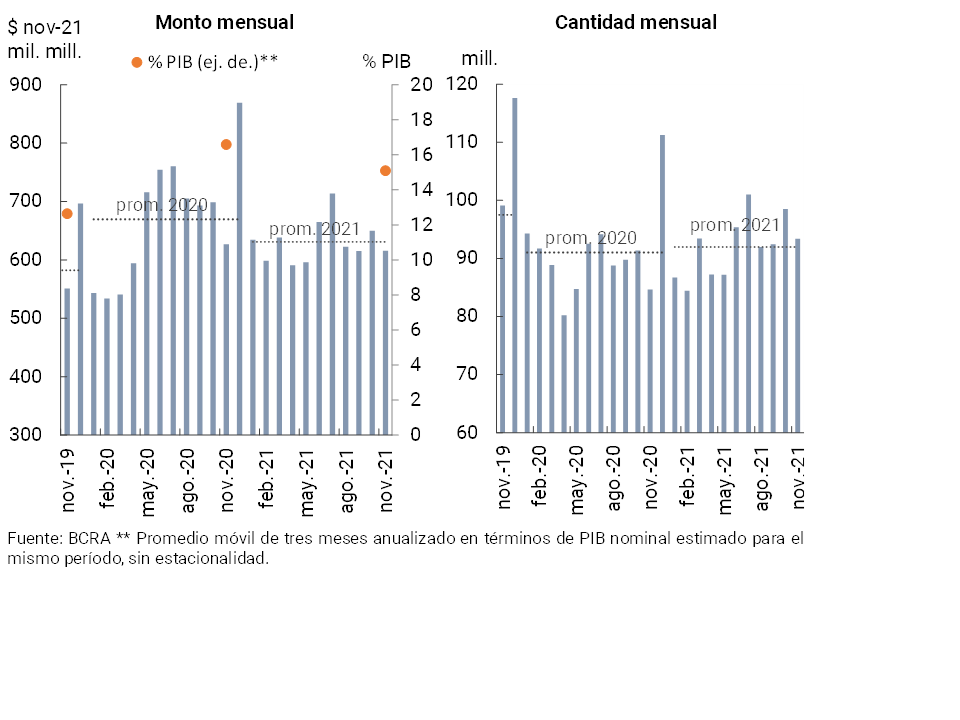
Partly due to seasonal factors, in November (latest available information), ATM withdrawals decreased compared to the previous month in quantities (+5.2%) and in real amounts (+5.3%). In year-on-year terms, ATM withdrawals expanded 10.3% in quantities and decreased 1.8% in real amounts23. It is estimated that in November the value of cash withdrawals via ATM represented 15.1% of GDP24 (-1.5 p.p. compared to the same month of the previous year, see Graph 20).
Figure 20 | ATM cash withdrawals
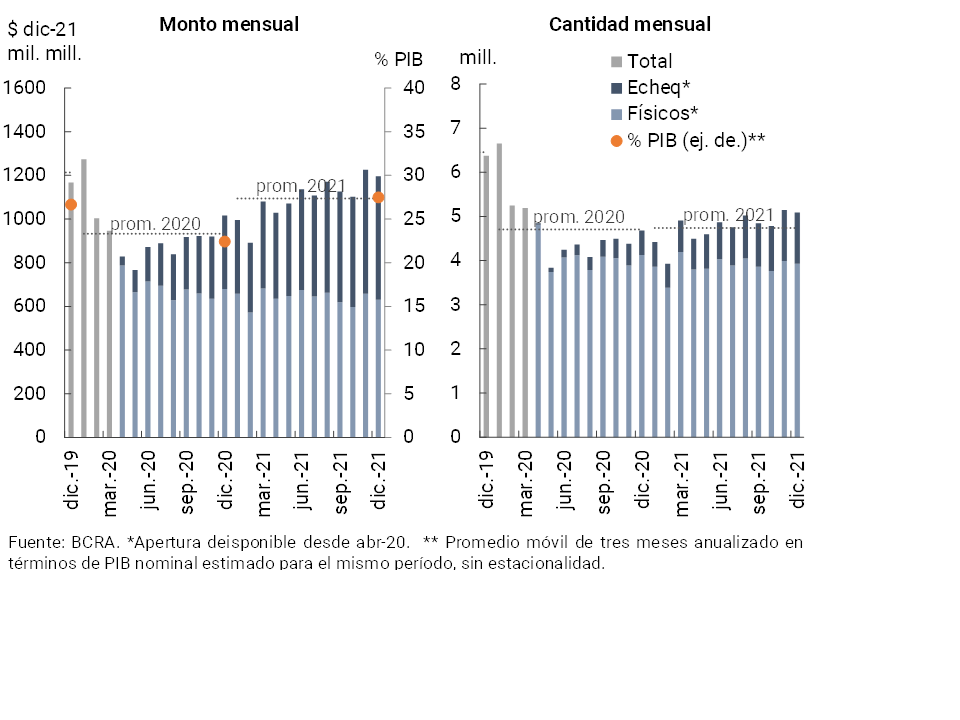
In December, the clearing of checks decreased compared to the previous month (-1.1% in amounts and -2.4% in real terms). This behavior was mainly due to the decrease in operations in the physical format. However, compared to the same month of the previous year, the clearing of checks accumulated an increase of 8.8% in amounts and 17.7% in real amounts issued, an increase explained entirely by the electronic format (+111% in amounts and +68.4% in real amounts). Thus, during December the ECHEQs continued to increase their weighting in total compensation, to represent 22.9% in amounts (+11.1 p.p. y.o.y.) and 47.3% in real amounts (+14.2 p.p. y.o.y., see Graph 21). It is estimated that the amount of checks cleared in terms of GDP totaled 27.5% as of December (+ 5.1 p.p. y.o.y.), reversing the behavior observed in the last25 years.
Figure 21 | Check clearing
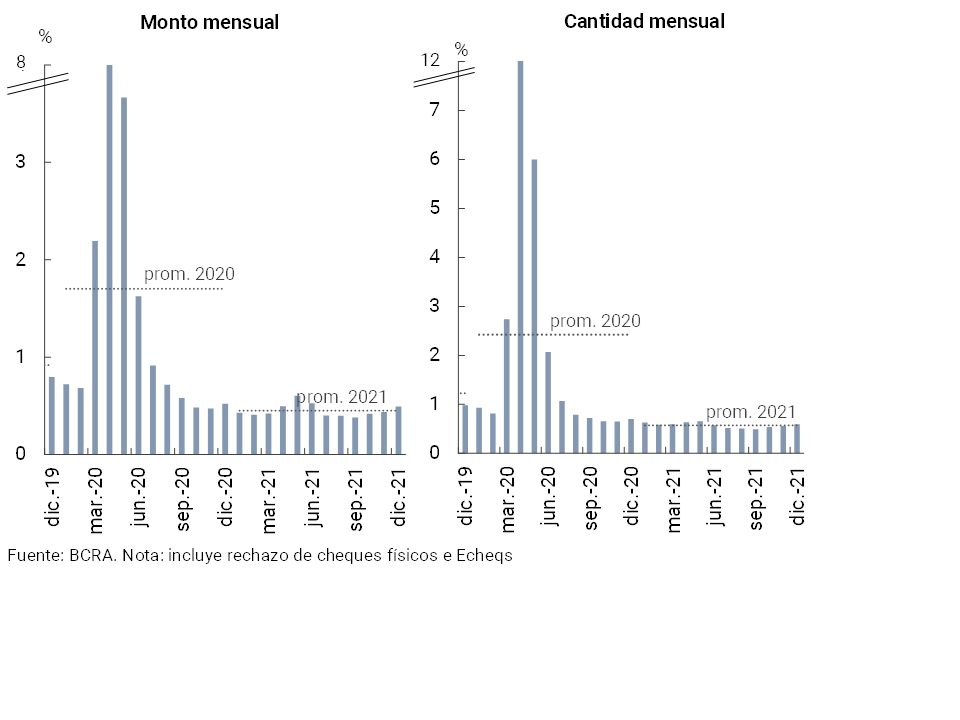
In December, the ratio that measures the rejection of checks due to lack of funds in terms of the total compensated25 continued at limited levels, slightly above those observed in November (+0.04 p.p. to 0.6% in quantities and +0.06 p.p. to 0.5% in amounts, see Graph 22). Compared to the same month of the previous year, the rejection ratio decreased in quantities (-0.1 p.p.) and in amounts (-0.03 p.p.)
Figure 22 | Bounce checks due to insufficient funds
Back to top
References
1Differences in balance sheet balances expressed in homogeneous currency. Information extracted from the Monthly Accounting Information Regime for the Balance Sheet (November 2021, latest information available at the time of publication of this Report).
2Expressed in currency of origin.
3Includes principal adjustments and accrued interest.
4Throughout the Report, when reference is made to groups of private (national and/or foreign) and public financial institutions, it corresponds to banking entities. Non-bank entities will be referred to as “EFNBs”.
5For more details, see Ordered text “Financing line for productive investment in MSMEs”.
6See Communication “A” “7082” and Communication “A” “7102”.
7See Communication “A” “7342”.
8Traditional fixed-term deposits (without an adjustment clause) decreased 2.5% in real terms in the month; while fixed-term deposits in UVA fell 1.1% in real terms (3.3% increase in real terms in pre-cancelable deposits and a 3.3% decrease in traditional deposits).
9 For more details on this analysis, see section 3.2 of the “December 2021 Financial Stability Report”.
10See Communication “A” “7432” and “Press Release” of 06/01/22.
11Includes forward purchase and sale transactions of foreign currency classified off-balance sheet.
12See Communication “A” “6938”, Communication “A” “7107”, Communication “A” “7181”, Communication “A” “7245” and Point 2.1.1. of the Ordered Text “Financial Services in the Framework of the Health Emergency Provided for by Decree No. 260/2020 CORONAVIRUS (COVID-19)” Financial Services in the Framework of the Health Emergency Provided for by Decree No. 260/2020 CORONAVIRUS (COVID-19)”. To date, the only measure in force for debtors is the transfer at the end of the life of the credit of the unpaid installments of the assistance granted to those who are employers covered by REPRO II (being left out of the reclassification process).
13It considers availability, integration of minimum cash and BCRA instruments, in national and foreign currency.
14With respect to regulatory changes with potential effects on liquidity, it should be noted that in order to reorder the interest rate scheme and simplify the organization of systemic liquidity, the BCRA recently redesigned the monetary policy instruments. First, an increase of 2 percentage points in the nominal interest rate of the LELIQ with a 28-day term was established. It was also decided to expand the maximum holding limit of these Bills by up to an amount proportional to the stock of private sector time deposits of each financial institution. At the same time, the monetary authority advanced in the creation of a new LELIQ with a 180-day term. As for the shorter-term instruments, the 7-day passive passes are progressively eliminated, while those agreed to 1 day remain in force. For more details, see “Press release of January 6, 2022”.
15The LCR considers the liquidity available to deal with a potential outflow of funds in the event of a possible stress scenario in the short term. See Ordered Text —TO— “Liquidity Coverage Ratio”. The NSFR takes into account the availability of stable funding from entities, in line with the terms of the businesses to which it applies. See TO “Stable Net Funding Ratio”.
16An additional indicator that provides an idea of the degree of coverage of the financial system against the credit risk assumed.
17Including those accounted for in ORI.
18When considering annualized amounts of the last three months.
19Within the framework of the positive performance of IT, with a growing relevance of the segment where accounts in payment service providers intervene (from and/or to CVU), the BCRA recently introduced changes in the current regulations. In particular, as of 2022, financial institutions must constitute a reserve requirement of 100% of the funds deposited by payment service providers that offer payment accounts (PSPOCP), known as virtual wallets, to preserve them from contingencies and ensure that the funds are always available to their holders. It should be considered that the funds in the transactional accounts managed by the PSPOCP are, at the disposal of the BCRA, deposited at all times in demand accounts in pesos in financial institutions in the country. With this new rule, as of January 1, 2022, these funds must also remain immobilized in the BCRA. (“Communication “A” 7429″ and Press release “30-Dec-21”).
20Transfer payments represent a separate set of operations from immediate transfers. They correspond to payments initiated with debit card credentials and with open QR codes, while consolidating information previously presented as Immediate Electronic Payment (PEI).
21For more details see “Press release of 22-01-2022”.
22The average monthly variation in November for the previous five years is -0.5 in quantities and -1.5 in real values.
23This increase in quantities and decrease in real amounts is explained, in part, by the greater opening of the economy after the first stages of the pandemic’s closure of circulation.
24When considering annualized amounts of the last three months.
25In the last decade, check clearing has fallen by an average of 2.8 p.p. of GDP each year. During 2021, since the introduction of the electronic format of ECHEQs, the downward trend was reversed.
26Consider physical checks as well as electronic checks.
Share on


