I. Financial intermediation activity
Financial intermediation activity saw a slight increase during May. Considering the most relevant movements in the balance sheet of the financial institutions as a whole for items in pesos —in real terms—1, the balance of public sector deposits increased during the month and, as a counterpart, an increase in liquidity in the broad sense and in the credit balance was observed. In the segment of foreign currency items, private sector deposits increased in the period, while those of the public sector decreased2.
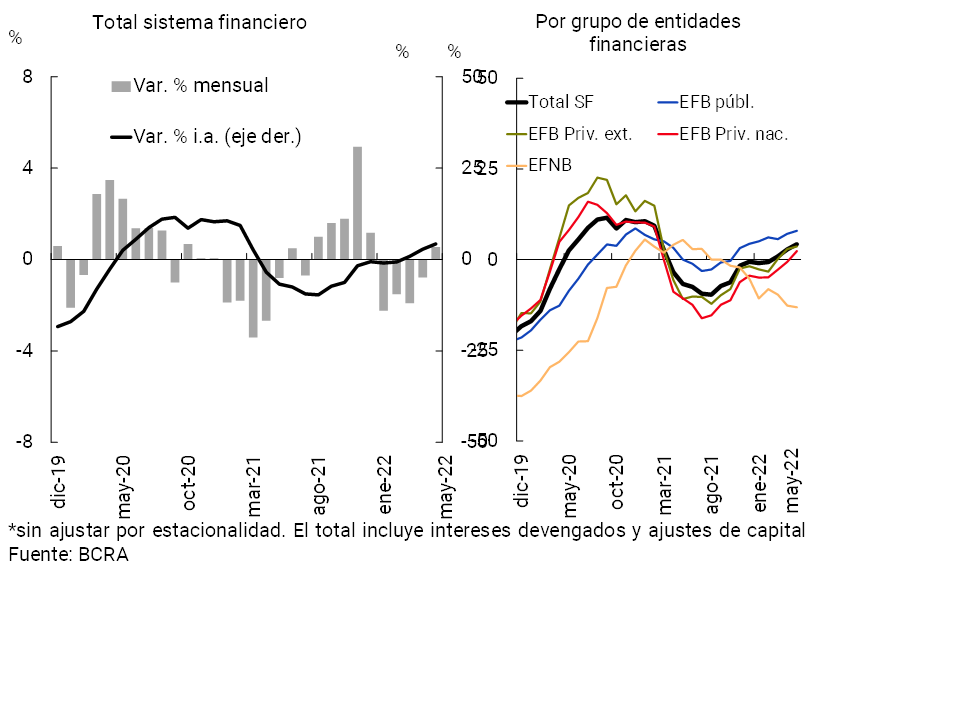
In May, the balance of financing in pesos to the private sector increased 0.6% in real terms compared to the previous month (see Graph 1; +5.7% nominal), after 4 months of declines. This performance was reflected in most groups of financial institutions3. Among the credit lines, heterogeneity was observed in the month: increases in advances, pledges and cards, and falls in the rest of the credit assistance. In year-on-year terms, the credit balance in national currency increased by 4.3% in real terms (+67.4% nominal YoY). The year-on-year dynamics were mainly driven by commercial lines (advances and documents) and pledges, in a context in which financing by public financial institutions verified the highest relative increase in the period (+7.9% real y.o.y.).
Graph 1 | Credit balance to the private sector in pesos
In real terms* – Financial system
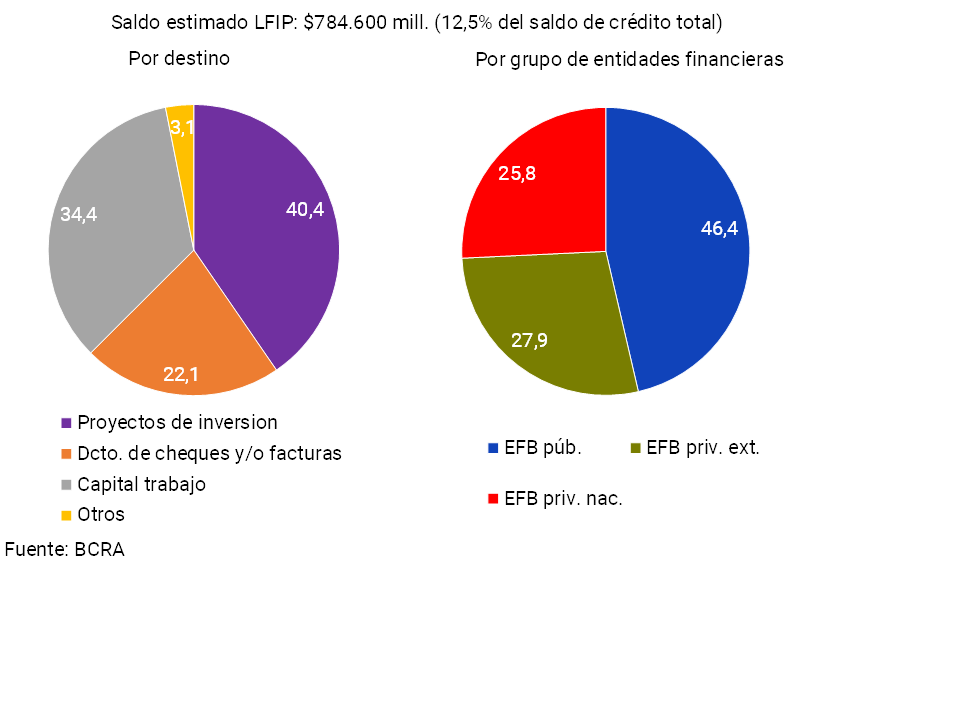
The positive evolution of commercial loans4 in the last year was partly explained by the Financing Line for Productive Investment of MSMEs (LFIP), one of the main credit stimulus programs implemented by the BCRA. Disbursements through this tool totaled almost $2.5 trillion in nominal terms since its launch in October 2020 and until June 2022, benefiting more than 284,500 companies. Thus, it is estimated that as of May the LFIP credit balance reached about $784,600 million, representing 12.5% of the total credit balance to the private sector of the financial system. When distinguishing by credit destination, it can be seen that about 40.4% of the balance was channeled to investment projects, 34.4% to working capital and 22.1% to discount checks and/or invoices (see Graph 2). Public financial institutions accounted for almost half of the estimated credit balance of the LFIP (46.4%), followed by foreign and domestic private institutions5.
Graph 2 | Financing Line for Productive Investment (LFIP) of MSMEs – Estimate of the balance as of May 2022 – Share % in the total
Considering the items in foreign currency, in May the balance of credit to the private sector increased 2% – in currency of origin – compared to April. Thus, the balance of total financing (in domestic and foreign currency) to the private sector accumulated an increase of 0.6% in real terms in the month (+5.7% nominal).
The monthly growth of the real credit balance was mainly driven by financing to households, with a 1.6% increase compared to April. This performance is in line with the perceived increase in credit demand for cards and other consumer loans by the aggregate of banks surveyed in the latest Credit Conditions Survey (ECC), corresponding to the second quarter of 20226. On the supply side, at the aggregate level, the CCP’s responses indicated a slight bias towards easing credit standards (indicative of an increase in supply) in most credit lines to households over the same period.
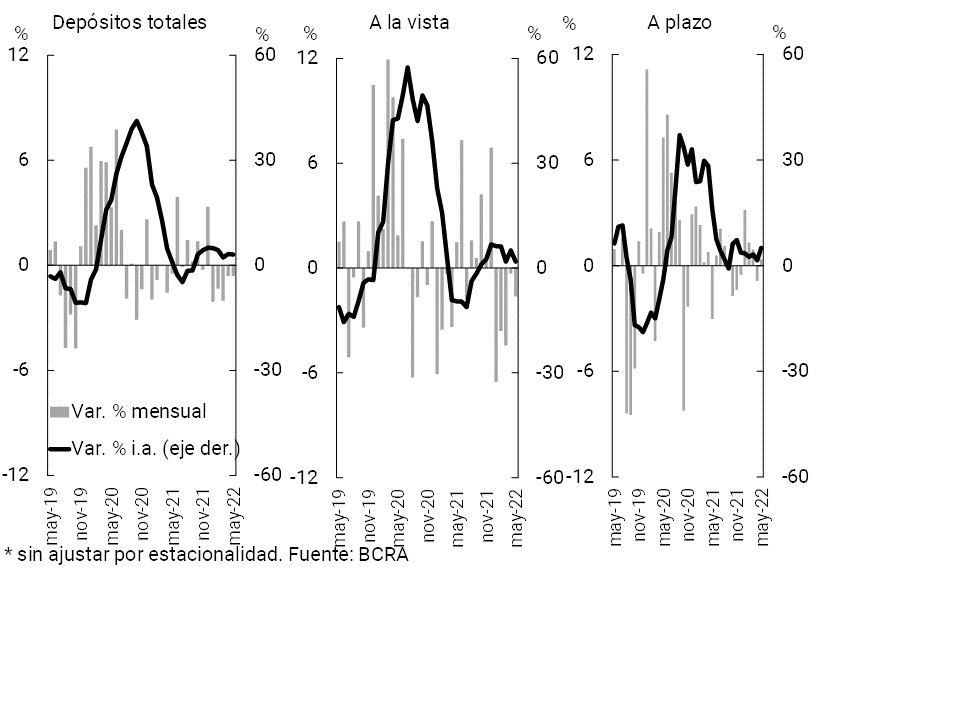
With regard to funding in the financial system, the balance of deposits in pesos in the private sector fell by 0.6% in real terms in May (+4.5% nominal) (see Chart 3)7. Demand accounts decreased by 1.6% in real terms in the period (+3.4% nominal), while the balance of time deposits increased by 0.4% in real terms (+5.5% nominal).
Graph 3 | Balance of private sector deposits in pesos
In real terms* – Financial system
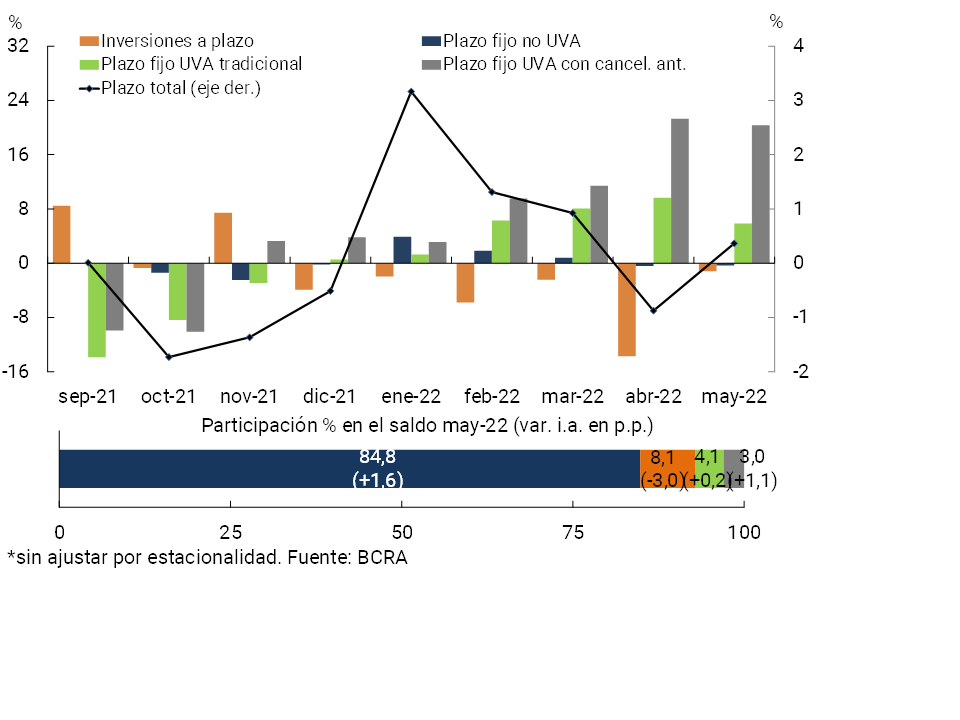
In line with what has been observed in recent months, UVA deposits—which offer positive real returns to the depositor—continued to grow at a high rate, being arranged mainly by individuals8. In particular, pre-cancellable UVA placements increased by 20.3% in real terms compared to April, while traditional loans grew by 5.8% in real terms (see Graph 4). As a result of this performance, the balance of time deposits in UVA continued to gain relevance in private sector time deposits, representing 7.1% of the total (+1.3 p.p. y.o.y.).
Figure 4 | Monthly change in the balance of private sector time deposits in pesos in real terms*
So far this year, the BCRA has increased the interest rates of monetary policy tools, as well as the minimum interest rates for fixed-term (see Chart 5). In this context, since the end of 2021, nominal interest rates on fixed-term deposits have risen gradually, contributing to the total private sector deposits in fixed-term pesos increasing by 8.4% in real terms in the first five months of the year.
Graph 5 | Interest rates operated in pesos
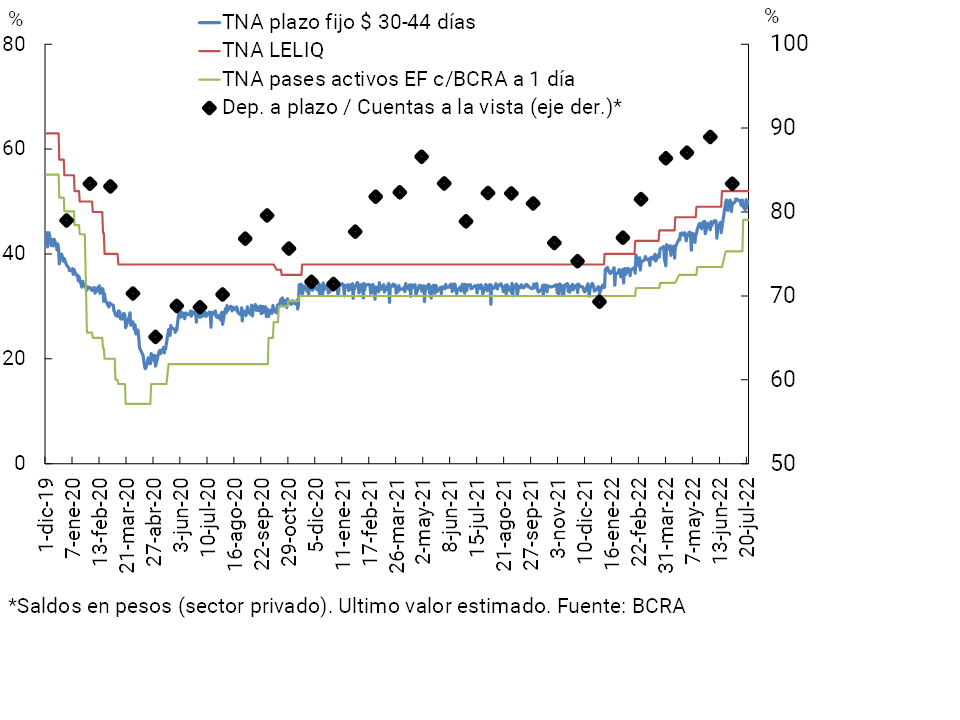
In order to generate positive real returns on investments in local currency, strengthen the public debt market in pesos and advance in the use of Treasury instruments as monetary policy tools, in mid-July the BCRA decided to use an interest rate corridor for the design of monetary and financial policy made up of the interest rate of short-term Treasury Bills. the monetary policy rate represented by the 28-day LELIQ and the 1-day pass rate9.
On the foreign currency side, in May the balance of deposits in this denomination of the private sector increased 1.1% in source currency. In this context, the balance of total private sector deposits (in domestic and foreign currency) accumulated a fall of 0.5% compared to the previous month (+4.6% nominal).
In year-on-year terms, private sector deposits in national currency increased by 3.1% in real terms (+65.6% nominal), driven mainly by time deposits. On the other hand, public sector deposits in pesos accumulated a fall of 9.3% YoY in real terms (+45.6% YoY nominal). As a result, the real balance of total deposits in national currency considering all sectors remained at a level similar to that verified a year ago (+0.6% real YoY or +61.6% nominal YoY). Thus, total deposits (currencies and sectors) decreased by 3.8% YoY in real terms (+54.5% YoY in nominal terms).
II. Aggregate evolution and composition of the balance sheet
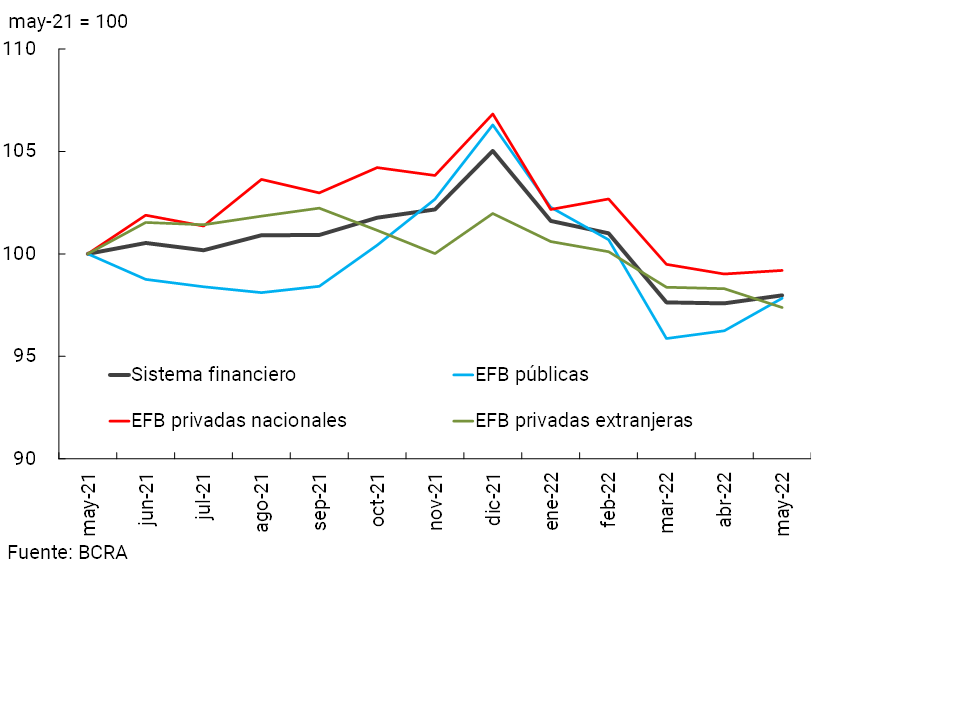
The total asset balance of the aggregate of financial institutions increased slightly in May (+0.4% real and +5.5% nominal; see Chart 6), with heterogeneous performances among the groups of financial institutions. In a year-on-year comparison, the assets of the financial system verified a decrease of 2% in real terms (+57.3% nominal y.o.y.).
Graph 6 | Total assets of the financial system
In real terms
With regard to the structure of the total assets of all financial institutions, in May the weighting of the balance of availabilities in pesos, credit to the public sector and, to a lesser extent, credit to the private sector increased slightly (see Chart 7). Considering assets by currency, in the period those arranged in pesos with an adjustment clause for CER and/or UVA slightly increased their participation in the total, while that of assets in foreign currency decreased.
Figure 7 | Asset composition
Financial system – Share %
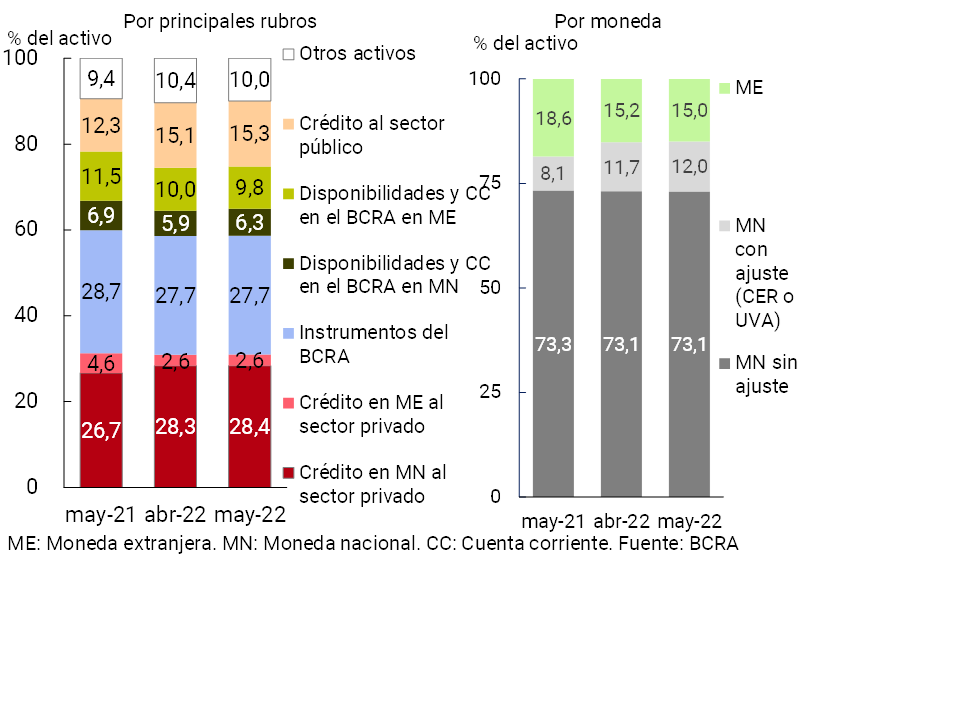
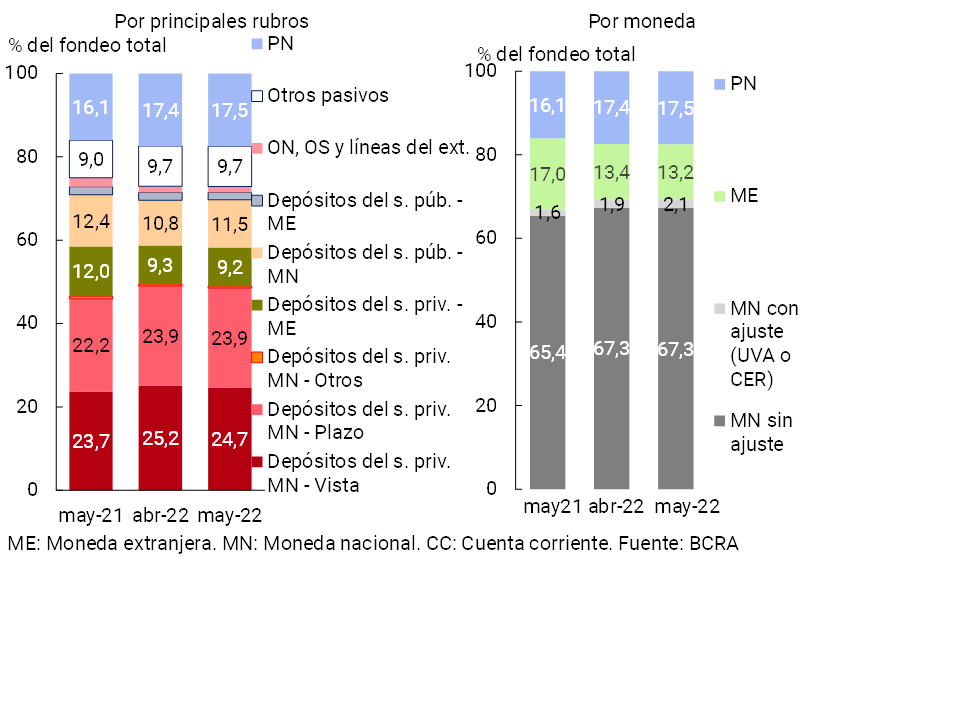
With regard to the composition of the total funding of the aggregate financial system, in May the balance of public sector deposits in national currency gained relative importance in the total, while private sector demand deposits decreased (see Chart 8). The rest of the items that make up the funding did not show major changes in the period. When differentiating the total funding by currency, items in pesos with an adjustment clause by CER or in UVA increased their weighting in the month, reducing the relevance of those denominated in foreign currency.
Figure 8 | Total Funding Composition
Financial system – Share %
Under the current regulatory framework, the exposure of the financial system’s balance sheet to foreign currency items decreased in May. The spread between assets and liabilities of all financial institutions in foreign currency10 stood at 10.8% of regulatory capital, falling 1 p.p. compared to April’s value (+3.5 p.p. y.o.y.). On the other hand, it is estimated that the spread of the items with a CER adjustment clause (and/or UVA) remained unchanged in magnitude in the period, standing at close to 65% of the regulatory capital in the period (+0.1 p.p. in the month and +19.4 p.p. y.o.y.).
III. Portfolio quality
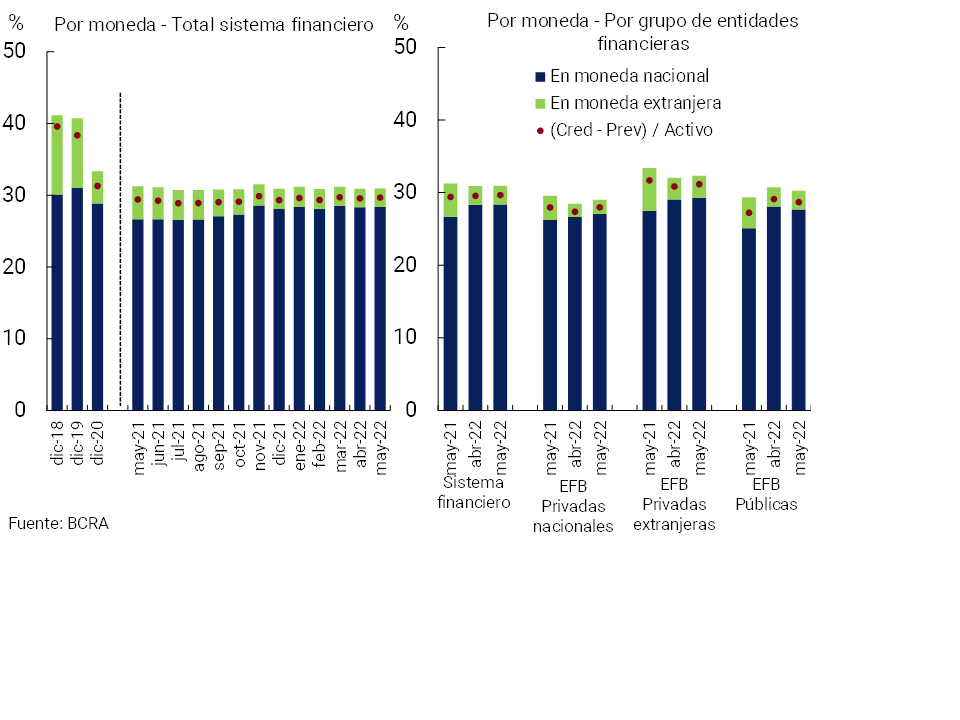
In May, the gross exposure of the financial system to the private sector (including domestic and foreign currency) stood at 31% of total assets11, in line with the records of April (+0.1 p.p.) and May 2021 (-0.3 p.p. y.o.y.). If only financing in pesos is considered, the indicator stood at 28.4% in the period (unchanged in the month and +1.7 p.p. y.o.y.) (see Graph 9). The weighting of credit to the private sector in foreign currency in total assets remained around 2.6% (-2 p.p. y.o.y.). As for the gross exposure of the financial system to the public sector, it totaled 15.3% of assets in May, without significant changes compared to last month (+0.1 p.p.) and +3 p.p. y.o.y.
Figure 9 | Credit balance to the Private Sector / Assets
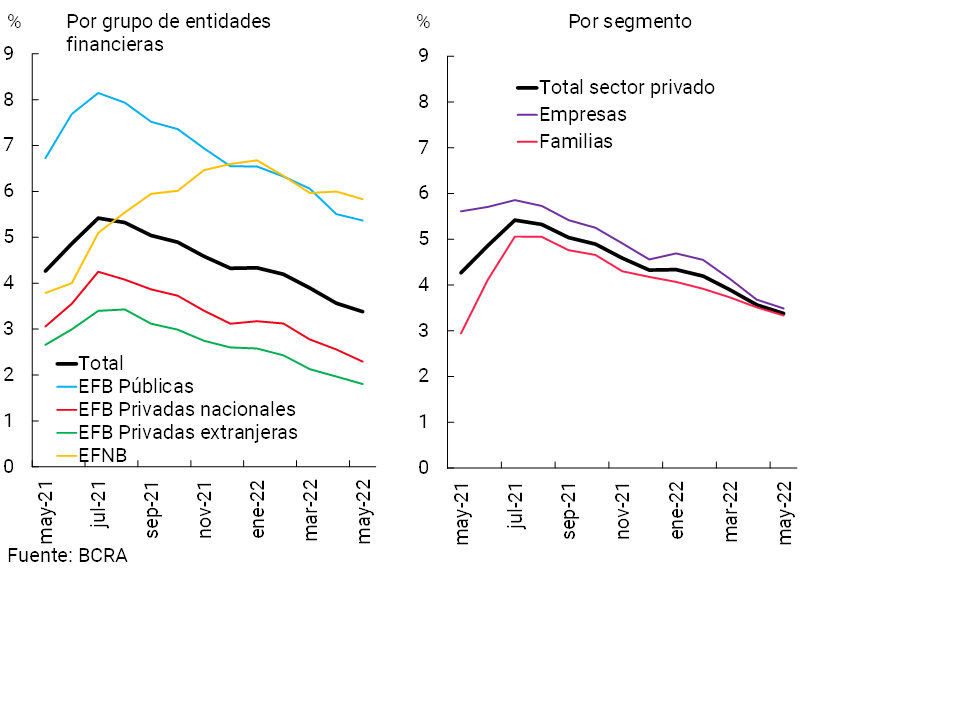
In May, the non-performing ratio of credit to the private sector fell by 0.2 p.p. to 3.4% (-0.9 p.p. y.o.y.) for the aggregate of institutions (see Chart 10).12 The fall in the NPL indicator was reflected in all groups of entities, both in the segment of loans to companies and households.
Figure 10 | Irregularity of credit to the private sector
Irregular financing / Total financing (%)
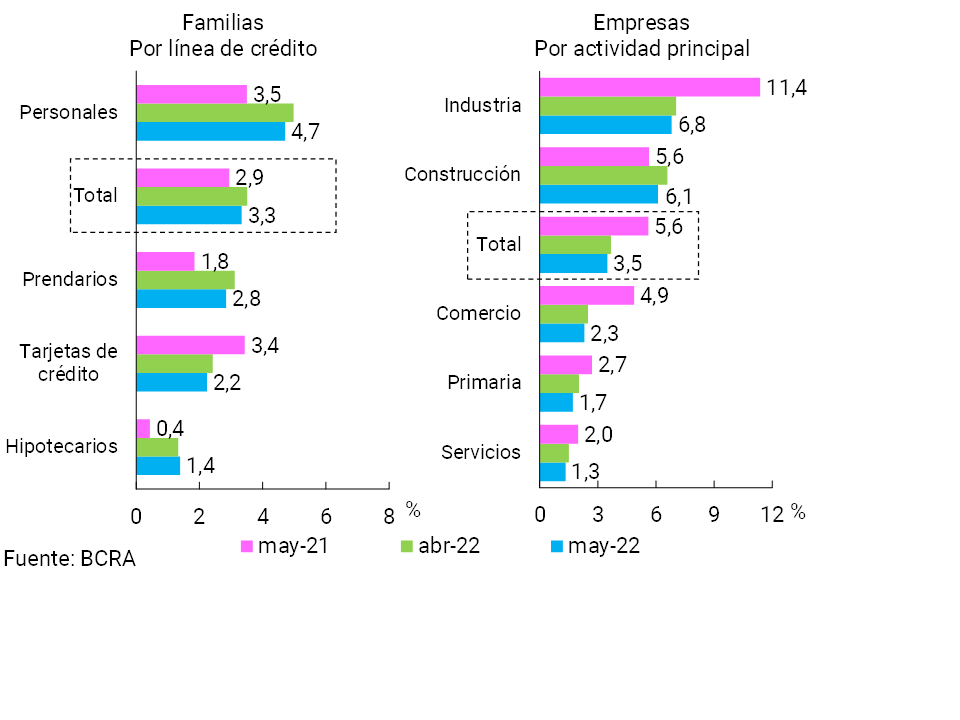
In May, the irregularity of financing to households stood at 3.3% of the total balance of loans to them (see Graph 11), 0.2 p.p. below the level of the previous month (+0.4 p.p. y.o.y.). The monthly performance was driven by the pledge and personal lines, which more than offset the slight increase in mortgages. In turn, non-performing loans for companies stood at 3.5% of financing to this segment in the period, 0.2 p.p. below the April figure (-2.1 p.p. y.o.y.). Although generalized among the different activities, the monthly reduction was led by companies whose main activity belongs to the construction sector and the primary sector13.
Figure 11 | Irregularity of credit to the private sector
Irregular financing / Total financing (%)
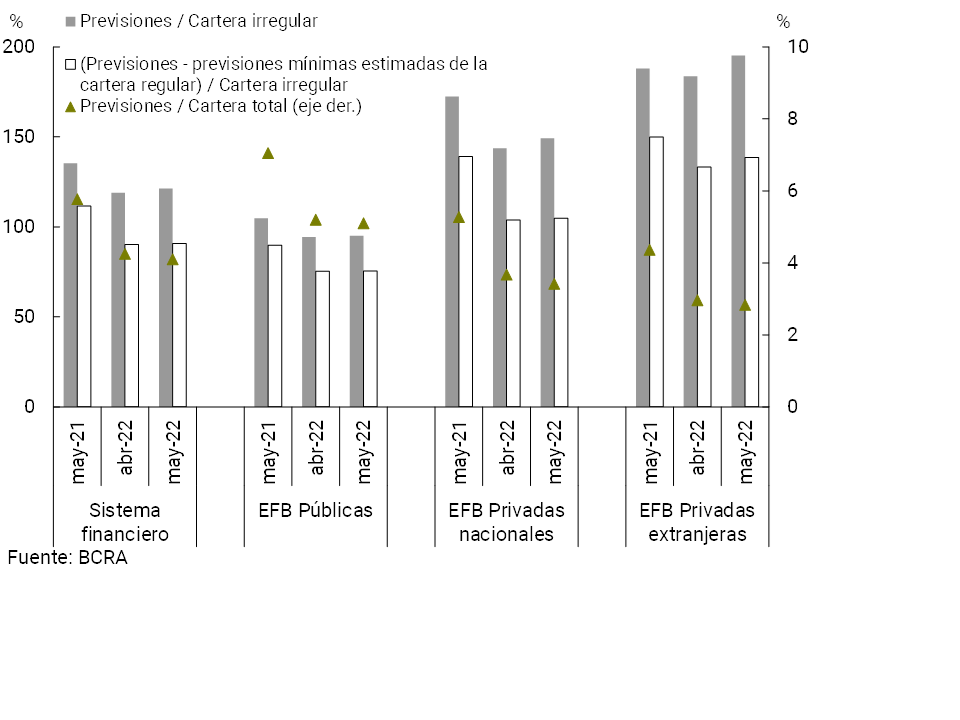
In May, the total forecasts of the aggregate financial system represented 4.1% of total credit to the private sector (slightly lower than the April figure and 1.7 p.p. below the value of a year ago) and 121.3% of the irregular portfolio (+2.4 p.p. monthly and -14 p.p. y.o.y.) (see Graph 12). In the period, the net forecasts of those that regulatorily correspond to the portfolio in situation 1 and 2 (following the criteria of the minimum regulatory forecasts for uncollectibility risk) totaled 90.8% of the portfolio in an irregular situation at the systemic level.
Figure 12 | Credit to the private sector and forecasts
By Entity Group
IV. Liquidity and solvency
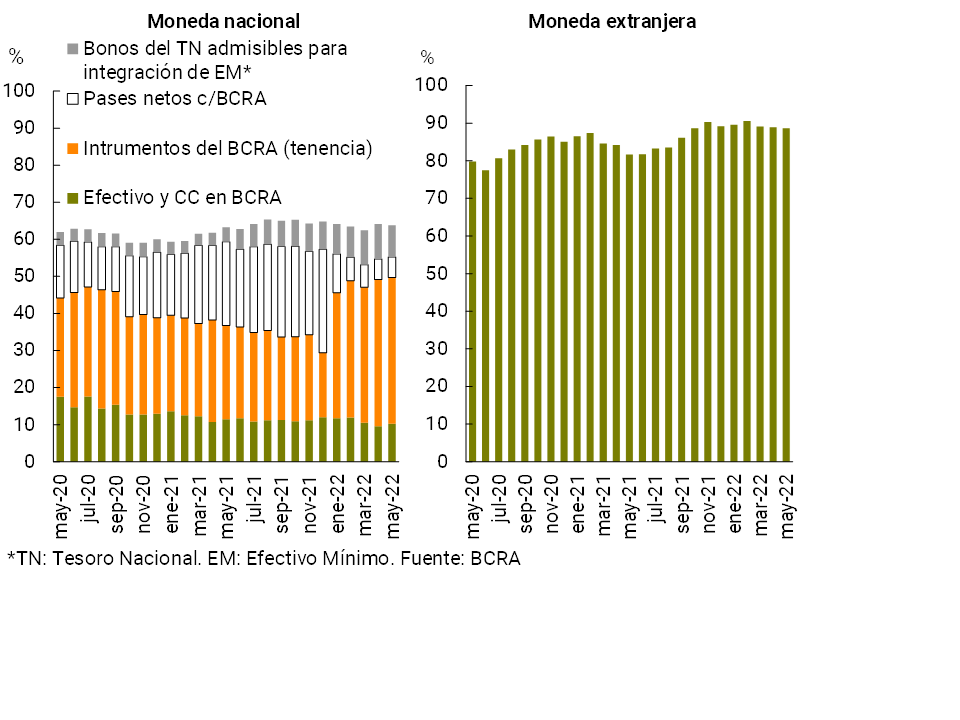
From relatively high levels, liquidity indicators in the financial system declined slightly in May. Broad sense liquidity14 of the financial system represented 67.6% of total deposits in the month, 0.4 p.p. less than in April. Disaggregated by currency, the broad liquidity ratio totaled 63.8% for items in local currency and 88.6% considering the segment in foreign currency (-0.4 p.p. and -0.3 p.p. in the month, respectively, see Chart 13). In terms of the composition of liquid assets in pesos, between the end of the month the relevance of the public securities of the National Treasury admitted for the integration of minimum cash decreased, while the relative importance of cash and current accounts that entities have in this Institution increased15. In a year-on-year comparison, ample liquidity (in pesos and foreign currency) of the financial system increased 0.8 p.p. of total deposits.
Figure 13 | Liquidity of the financial system
In % of deposits
Faced with the context of volatility in the public debt market that became evident as of June, the BCRA began to offer financial institutions a put option on National Government securities awarded as of July 2022 and maturing before December 31, 202316. Among other objectives, this measure seeks to reduce the volatility of the prices of Treasury instruments and provide entities with new tools to manage their liquidity.
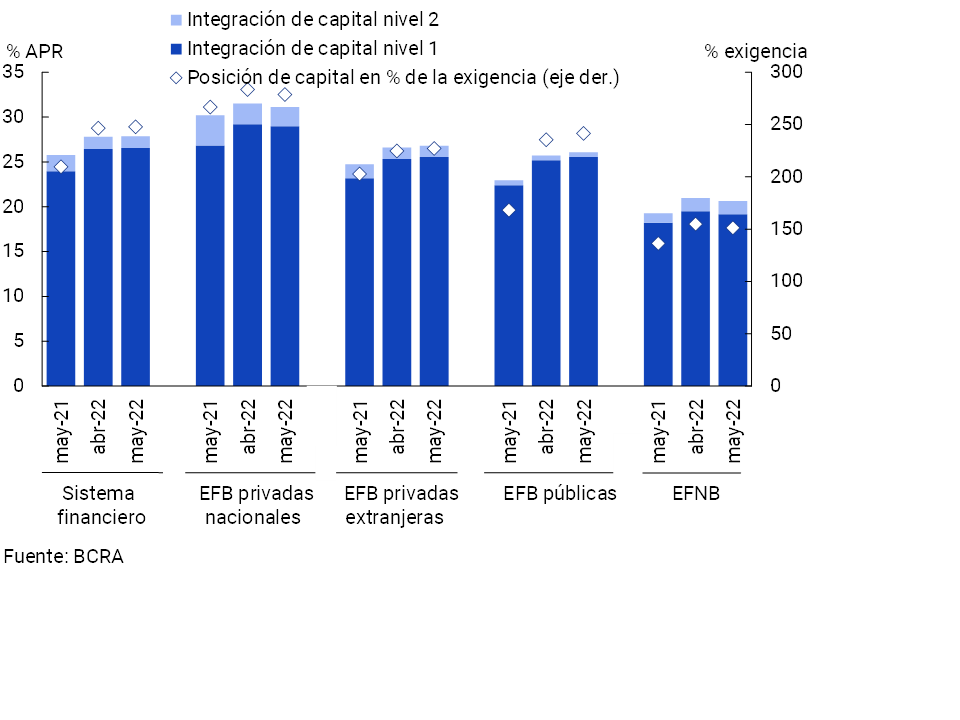
The sector’s solvency indicators did not show significant changes in May, remaining at high levels. The integration of regulatory capital (RPC) of the aggregate of entities stood at 27.9% of risk-weighted assets (RWA), a level similar to the April figure (+2.1 p.p. y.o.y., see Chart 14). As for the composition of the sector’s PRC, more than 95% continued to be explained by Tier 1 Capital, with a greater capacity to absorb potential losses. In turn, the capital position – CPR net of the minimum regulatory requirement – totaled 248% of the regulatory requirement in the month at the aggregate level, with no change in magnitude compared to April (+38.2 p.p. y.o.y.). The excess regulatory capital in terms of the balance of credit to the private sector net of forecasts stood at 35.8%17 at the systemic level, well above the average of the last 10 years —15.7%—18.
Figure 14 | Integration of regulatory capital
By financial institution group
So far in 2022, the profitability indicators of the group of entities were at positive levels (see Chart 15). In the first 5 months of the year, the total comprehensive results in homogeneous currency for the aggregate financial system totaled 1.2% annualized (y.) of assets (ROA) and 7.2% y. of net worth (ROE), exceeding the records observed in the same period of 2021, although being lower than those verified at the beginning of 2020.
Figure 15 | Comprehensive total profit in homogeneous currency of the financial system
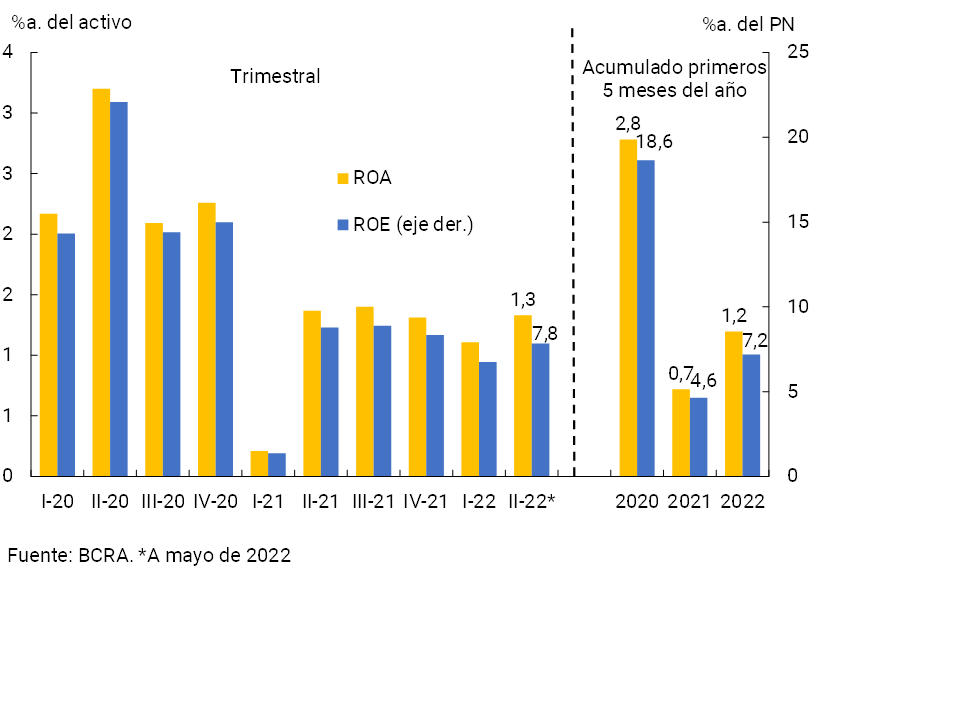
In the last 12 months to May, the ROA of the financial system stood at 1.3% and ROE at 7.9%, 0.3 p.p. and 2.7 p.p. lower in a year-on-year comparison, respectively. This reduction mainly reflected the effects of increases in the cost of funding for deposits and greater monetary losses (effect of inflation on balance sheets), factors that were partly tempered by higher income from premiums for passes and securities19, among others.
V. Payment system
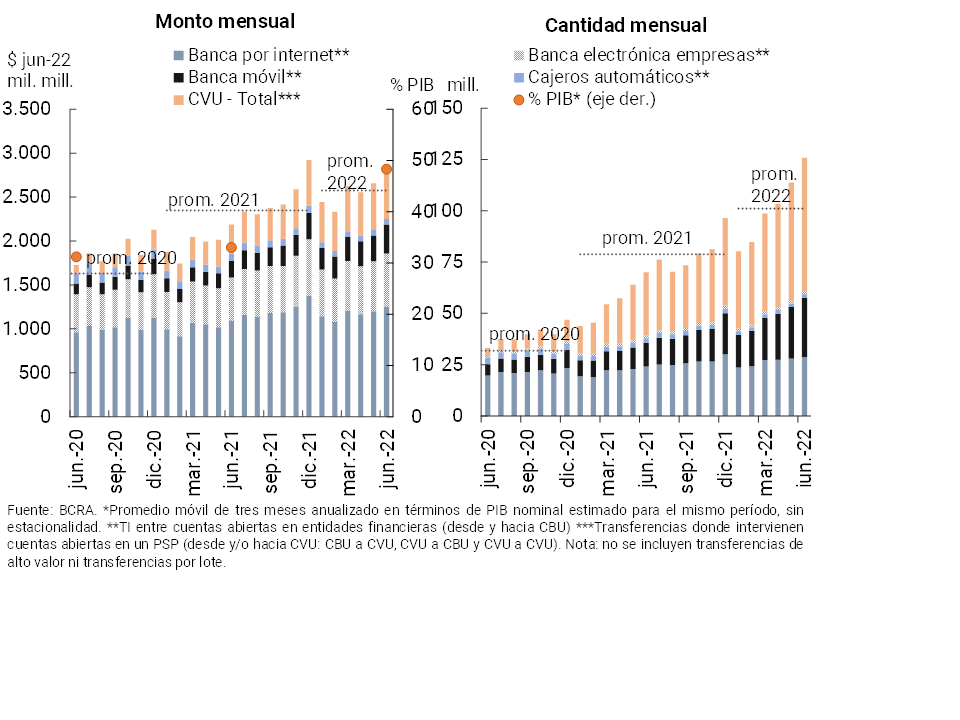
In June, immediate transfers (TI) increased compared to the previous month: 10.6% in amounts and 6.9% in real amounts. These operations continued to show significant dynamism over the last year: growth of 79.8% YoY in quantities and 29.8% YoY in real amounts. The year-on-year performance of IT was driven by a generalized increase in its components. IT between accounts opened in financial institutions via CBU expanded 55.1% YoY in amounts and +21.4% YoY in real amounts, among which the dynamism in transactions through Mobile Banking stood out (+147.5% YoY in amounts and +75.5% YoY in real amounts). Transactions involving accounts in payment service providers (PSPs) from and/or to CVU also registered significant dynamism (+111.3% YoY in quantities and +76.4% YoY in real amounts). In particular, this last segment of transfers increased its share of total IT: up to 51.7% in quantities (+7.7 p.p. y.o.y.) and 20.8% in amounts (+5.5 p.p. y.o.y.). It is estimated that in June IT accounted for 48.3% of GDP20 (+15.3 p.p. compared to the same month of the previous year, see Graph 16).
Figure 16 | Instant Transfers (TI)
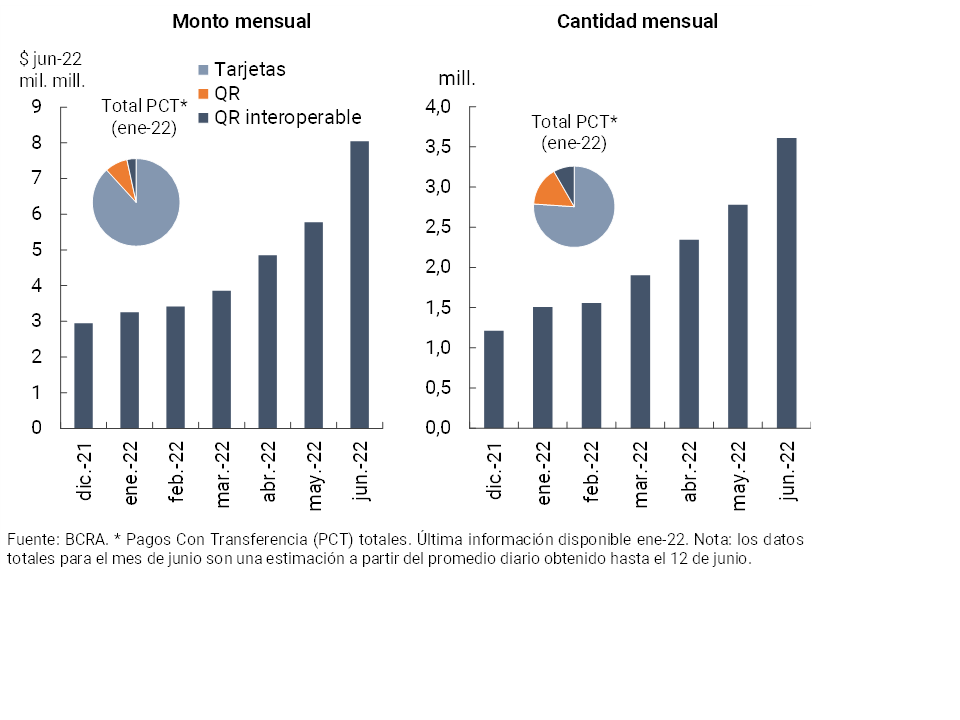
In June, transfer payments (PCT) initiated through interoperable QR codes21 had a notable increase compared to the previous month (+29.8% in amounts and +39.3% in real terms in amounts, see Chart 17). Since the beginning of the full QR interoperability scheme (end of November 2021), the number of operations under this modality accumulated to June reached 14.9 million, equivalent to $32,221 million at June 2022 prices.
Figure 17 | Payments by transfer (PCT)
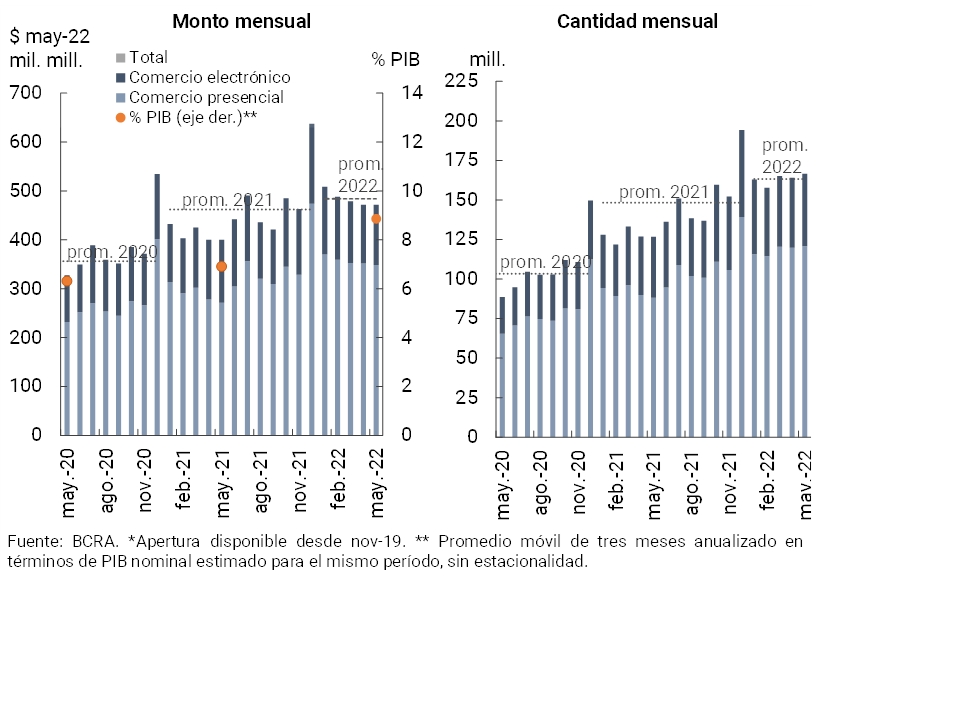
During May (latest available information) there were no changes compared to the previous month in debit card operations both in amounts and in real amounts. In year-on-year terms, debit card transactions grew significantly (+31.4% in amounts and +17.9% in real terms in amounts, see Chart 18). This behavior was reflected with greater dynamism in online face-to-face operations with the greater mobility of people in relation to the months of pandemic22. Thus, it is estimated that debit card transactions accounted for 8.9% of GDP (2 p.p. more than in the same month of the previous year).
Figure 18 | Debit card transactions
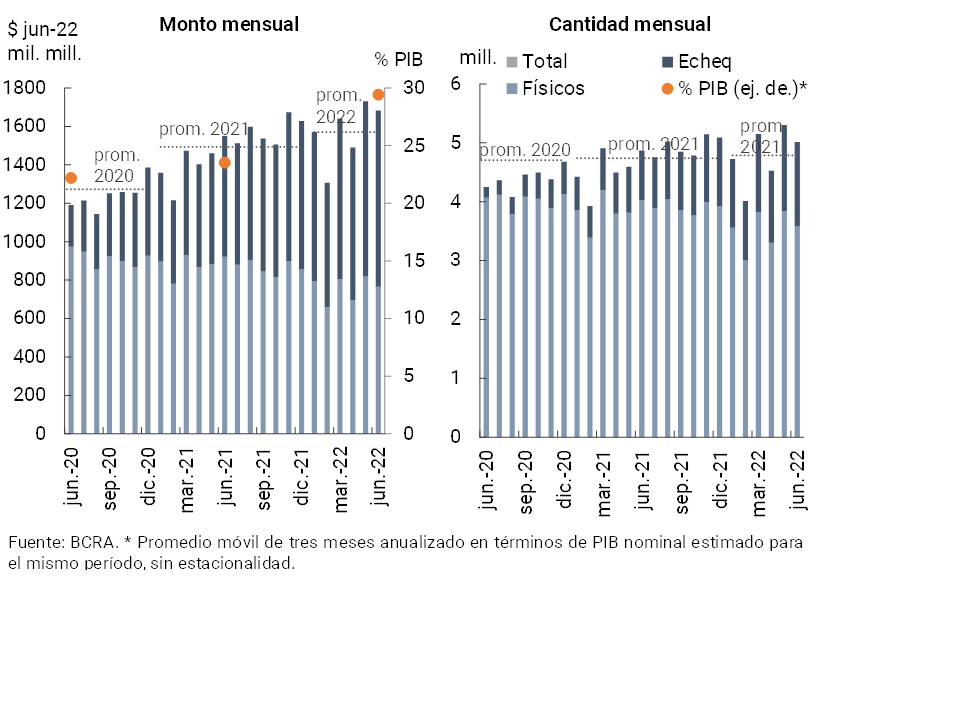
In June, the clearing of checks decreased compared to the previous month (-5.4% in amounts and -2.7% in real terms). Compared to the same period of the previous year, these operations grew 2.9% in quantities and 8.6% in real terms in amounts. Given the better relative performance, ECHEQs continued to increase their weighting in total compensation: in June they represented 28.7% in quantities (+11.4 p.p. y.o.y.) and 54.5% in real amounts (+14 p.p. y.o.y., see Graph 19). It is estimated that in the period the amount of cleared checks (both physical and electronic) was equivalent to 29.4% of GDP (+5.9 p.p. y.o.y.).
Figure 19 | Check clearing
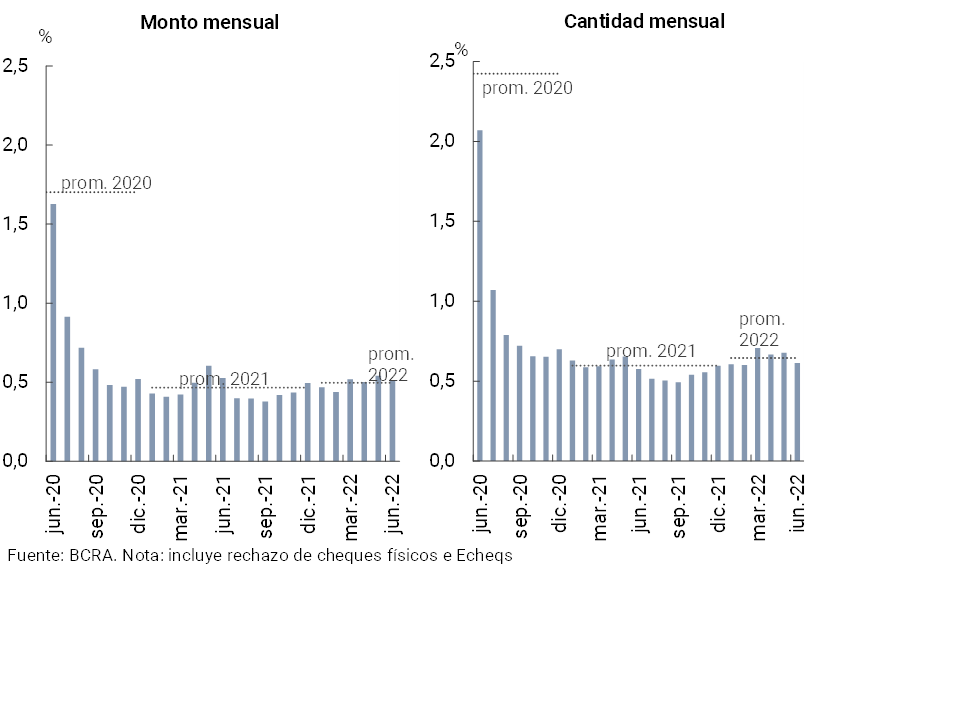
In June, the ratio of rejection of checks due to lack of funds in terms of the total cleared23 decreased compared to the previous month (up to 0.61% in amounts and 0.51% in amounts, see Chart 20), remaining in a limited range of values, similar to the average of 2021 and 2022.
Figure 20 | Bounce checks due to insufficient funds
Back to top
References
1 Differences in balance sheet balances expressed in homogeneous currency. Information extracted from the Monthly Accounting Information Regime for the Balance Sheet (May 2022, latest information available at the time of publication of this Report).
2 Expressed in currency of origin.
3 Includes principal adjustments and accrued interest.
4 In May, advances, documents and leasing increased by 33.6% YoY in real terms, 20.1% YoY in real terms and 19.1% YoY in real terms, respectively.
5 For more details, see Box “Financing Line for Productive Investment (LFIP)” of the “IEF I-22”.
6 For more detail, see “Second Quarter 2022 CCP” results.
7 During the month, the real balance of private sector deposits held by the EFNBs increased, while it remained unchanged in the domestic private EFBs and decreased in the rest of the institutions.
8 For more details, see Box Recent Behavior of UVA Time Deposits of the Private Sector of the “IEF I-22”.
9See Press release of “15/07/22”. This policy was accompanied by a new system implemented by the BCRA to reduce the volatility of Treasury securities (see Liquidity and Solvency section).
10 Includes forward purchase and sale of foreign currency classified off-balance sheet.
11 29.7% of net of the accounting balance of forecasts.
12 As has been happening in recent months, part of the fall in the indicator is associated with a certain transfer of debt in situation 5 (irrecoverable) to off-balance sheet items. It is worth mentioning that these movements do not have an impact on the statement of income or on the income statement, as they are fully forecasted assets.
13 For an additional and complementary approach to credit risk in the different productive sectors, see Figure 10 of the IEF “IEF I-22”.
14 Considers availabilities, assets admitted for the integration of the Minimum Cash requirement and BCRA instruments, in national and foreign currency, all in terms of total deposits.
15 In May, it was established that the minimum cash requirement for deposits in pesos in accounts of payment service providers that offer payment accounts (PSPOCP) in which their customers’ funds are deposited, will be determined based on the average of daily balances recorded at the end of each day during each calendar month (see Communication “A 7515”). In turn, at the end of June 2022, the BCRA promoted a simplification of the Minimum Cash Regime in pesos. In particular, a reduction in the number of franchises was contemplated, maintaining those that favor productive credit to MSMEs and household consumption financing (see Communication “A 7536” and Press Release of “30/06/2022”).
16 The price will be set by the maximum rate between the closing value of the asset on the business day prior to settlement and the weighted average APR, plus a spread, and for this right, the financial institutions holding the option must pay a premium. For more details, see Communication “A 7546” and Press Release of “12/07/2022”.
17 That ratio reflects the significant capital coverage of the sector as a whole against a possible materialisation of credit risk (extreme and very unlikely).
18 For more detail on the main strengths of the local financial system, see “IEF I-22.”
19 Includes those accounted for in the ORI.
20 When considering annualized amounts of the last three months.
21 Within the framework of the Transfers 3.0 scheme, a registry of interoperable wallets was established (for more information, see “BCRA Communication “B” 12333″).
22 Face-to-face operations increased 36.8% YoY in quantities and 28.5% YoY in real amounts. While electronic operations increased 19% YoY in quantities, but decreased 4.3% YoY in real amounts.
23 Considers physical checks as electronic checks.
Share on


