I. Financial intermediation activity
Financial intermediation activity with the private sector declined in July. According to the main differences in balances of the balance sheet of the financial system on items in pesos – in real terms – in the month liquidity in the broad sense and financing to both the private and public sectors decreased. On the other hand, there was a fall in the balance of deposits. A similar performance was observed in foreign currency items: a reduction in financing and deposits at the aggregate level. 1
In July, the balance of financing in pesos to the private sector fell by 1.8% in real terms compared to the previous month (see Chart 1; +5.5% nominal), with falls in all groups of financial institutions. 2 When distinguishing by type of assistance, during the month there were increases in the real balances of commercial loans (leasing, advances and documents) and pledges, and falls in the remaining credit lines. Notwithstanding the monthly performance, in year-on-year terms the credit balance in national currency accumulated an increase of 3.7% in real terms (+77.1% nominal y.o.y.). The year-on-year increase in lending was disseminated among the different groups of banks, driven mainly by the performance of pledges (35.4% real y.o.y.) and commercial lines (+21.8% real y.o.y.).
Graph 1 | Credit balance to the private sector in pesos
In real terms* – Financial system
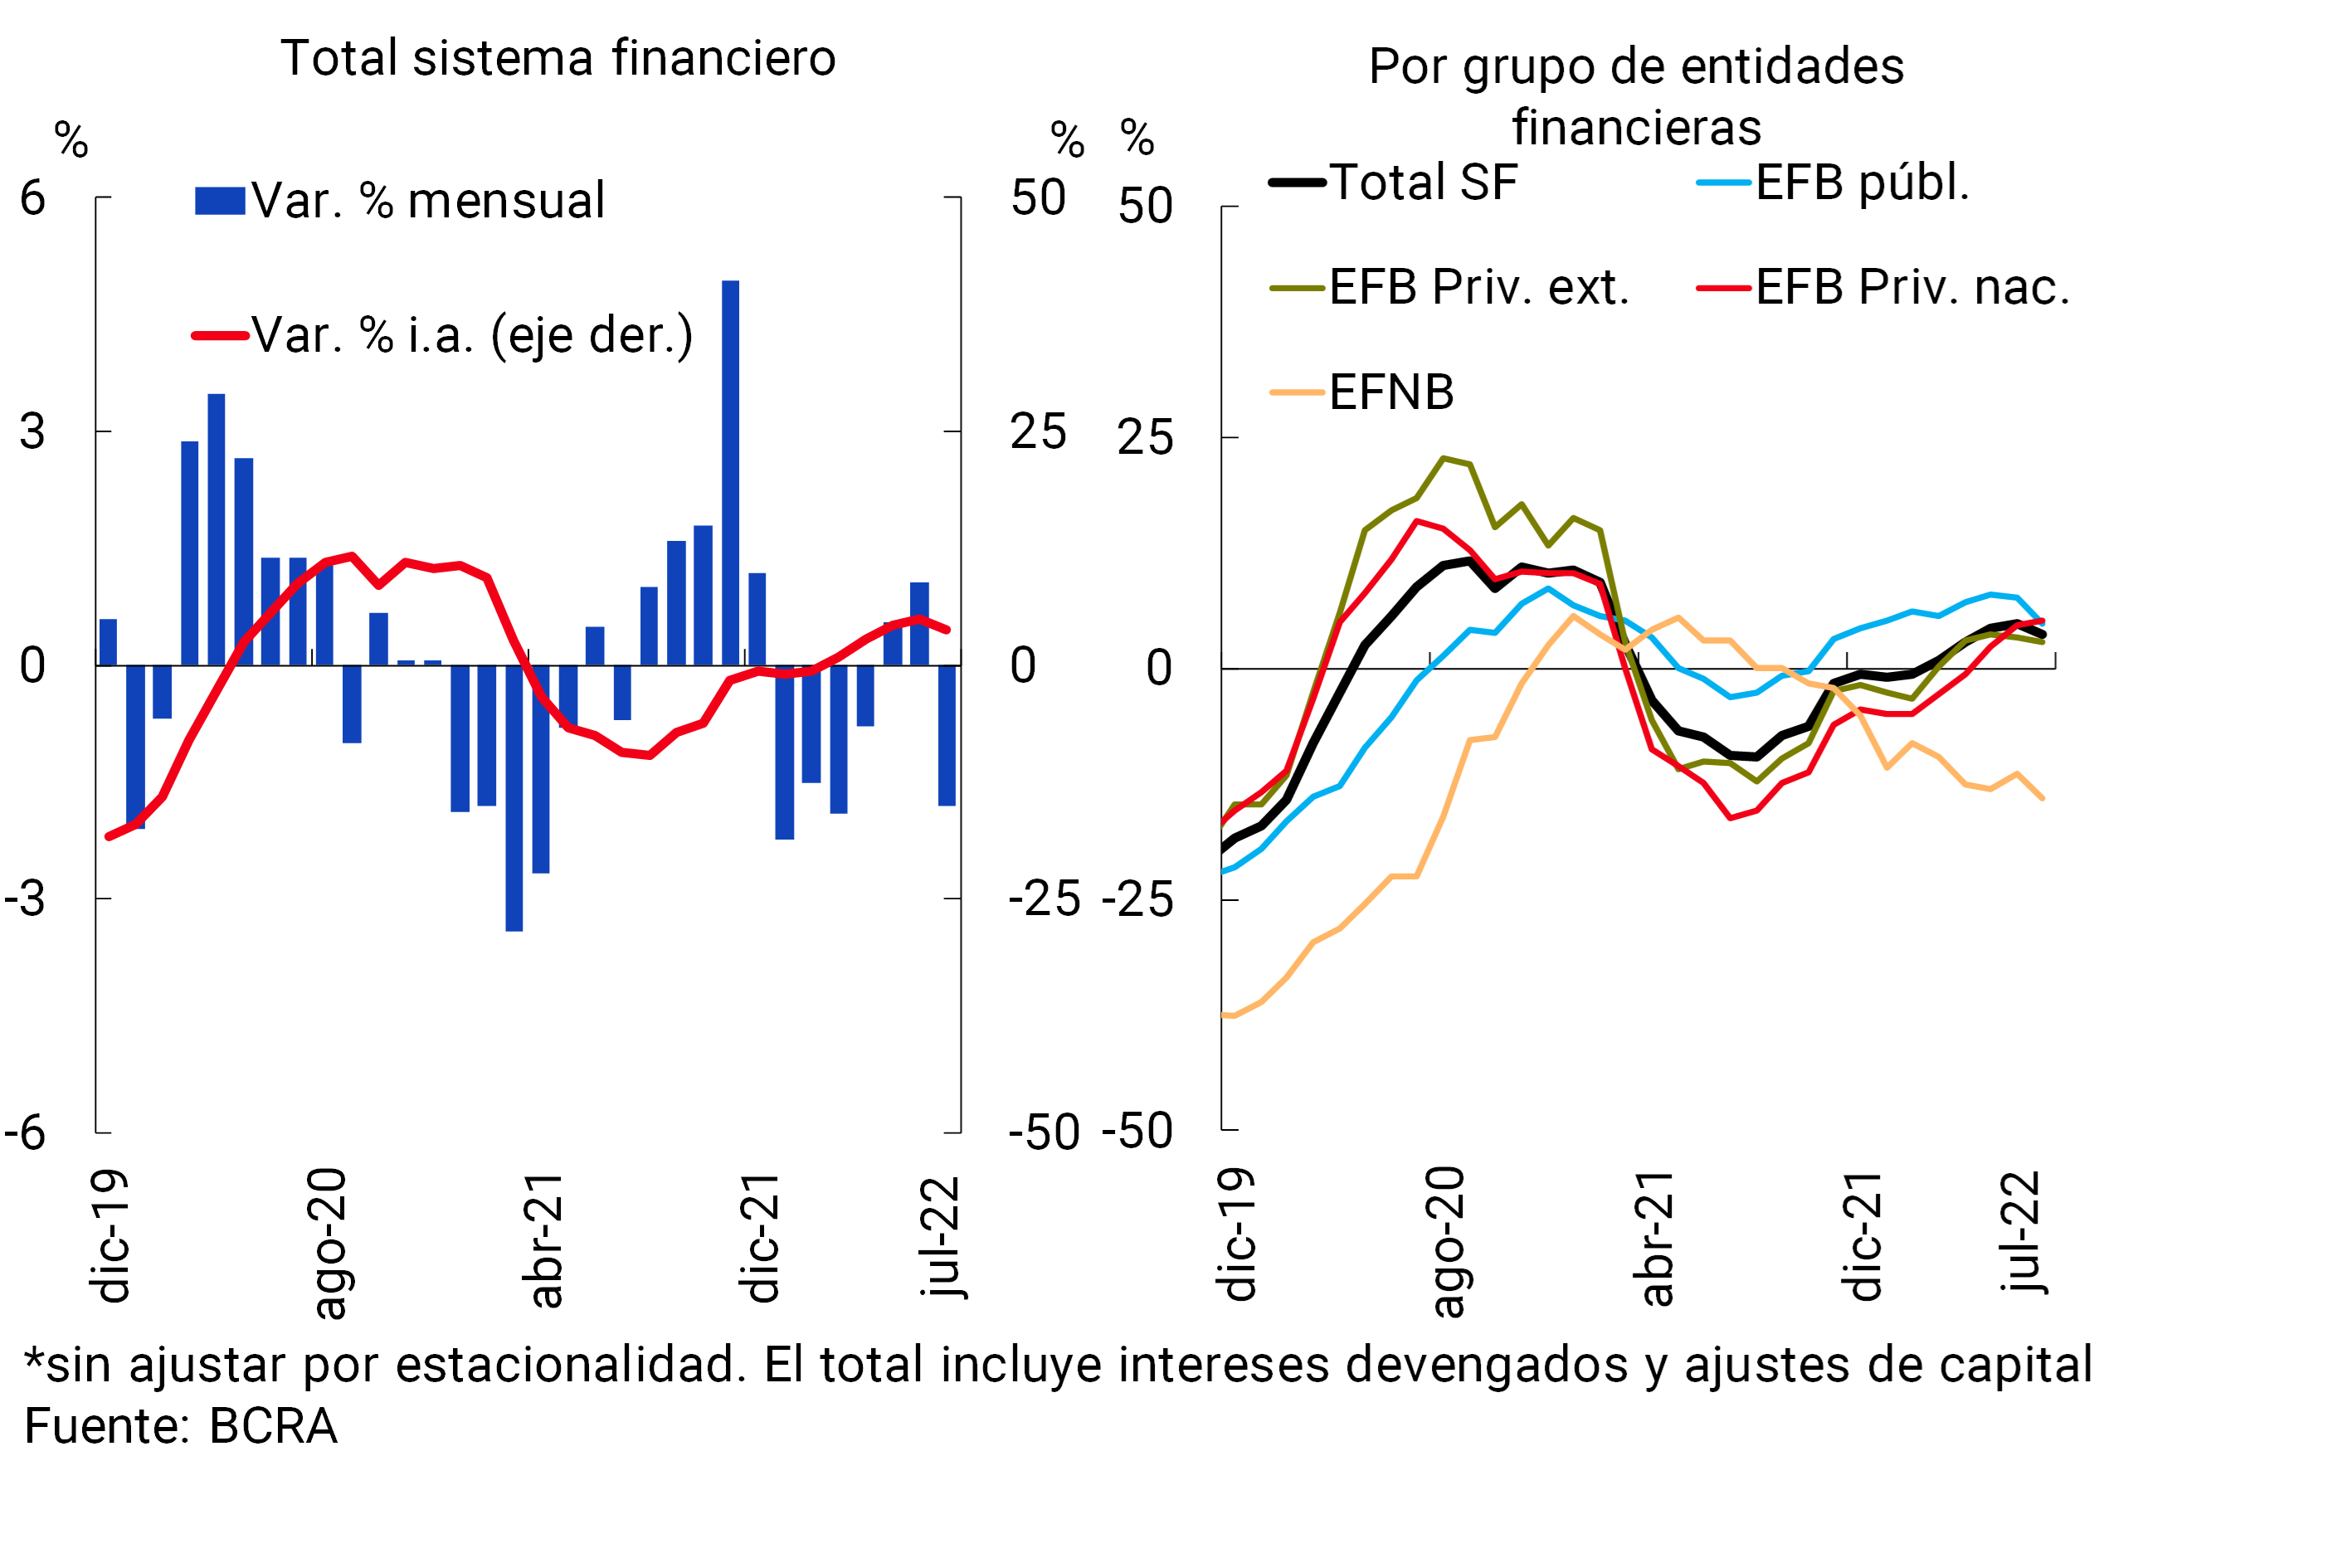
The dynamics of commercial loans in pesos continue to be promoted by the Financing Line for the productive investment of MSMEs (LFIP). Thus, in order to continue promoting access to credit lines with subsidized rates, the BCRA recently extended the LFIP until the end of March 2023, maintaining the same conditions in force. 3 Since the launch of the LFIP (November 2020) and until August 2022, almost $2.9 trillion has been disbursed in nominal terms, reaching more than 298,300 companies. As of July (latest available information) the estimated credit balance of the LFIP stood at $871,700 million (about 40% corresponds to financing of investment projects), representing almost 22.6% of the total credit balance to companies. In a framework in which the LFIP seeks to focus resources to promote productive development mainly on relatively smaller companies, at the systemic level, the balance of credit in pesos channeled to SMEs accumulated an increase of 23.3% in real terms in a year-on-year comparison to July, almost doubling the balance (measured in homogeneous currency) at the end of 2019 (see Graph 2).
Graph 2 | Credit balance in pesos to SMEs
Financial system
In July, the balance of credit in foreign currency to the private sector decreased 7.1% compared to the previous month. 4 Thus, the total credit balance (in domestic and foreign currency) to the private sector accumulated a reduction of 2.4% in real terms in the month (+4.8% nominal) and 2.8% in real y.o.y.
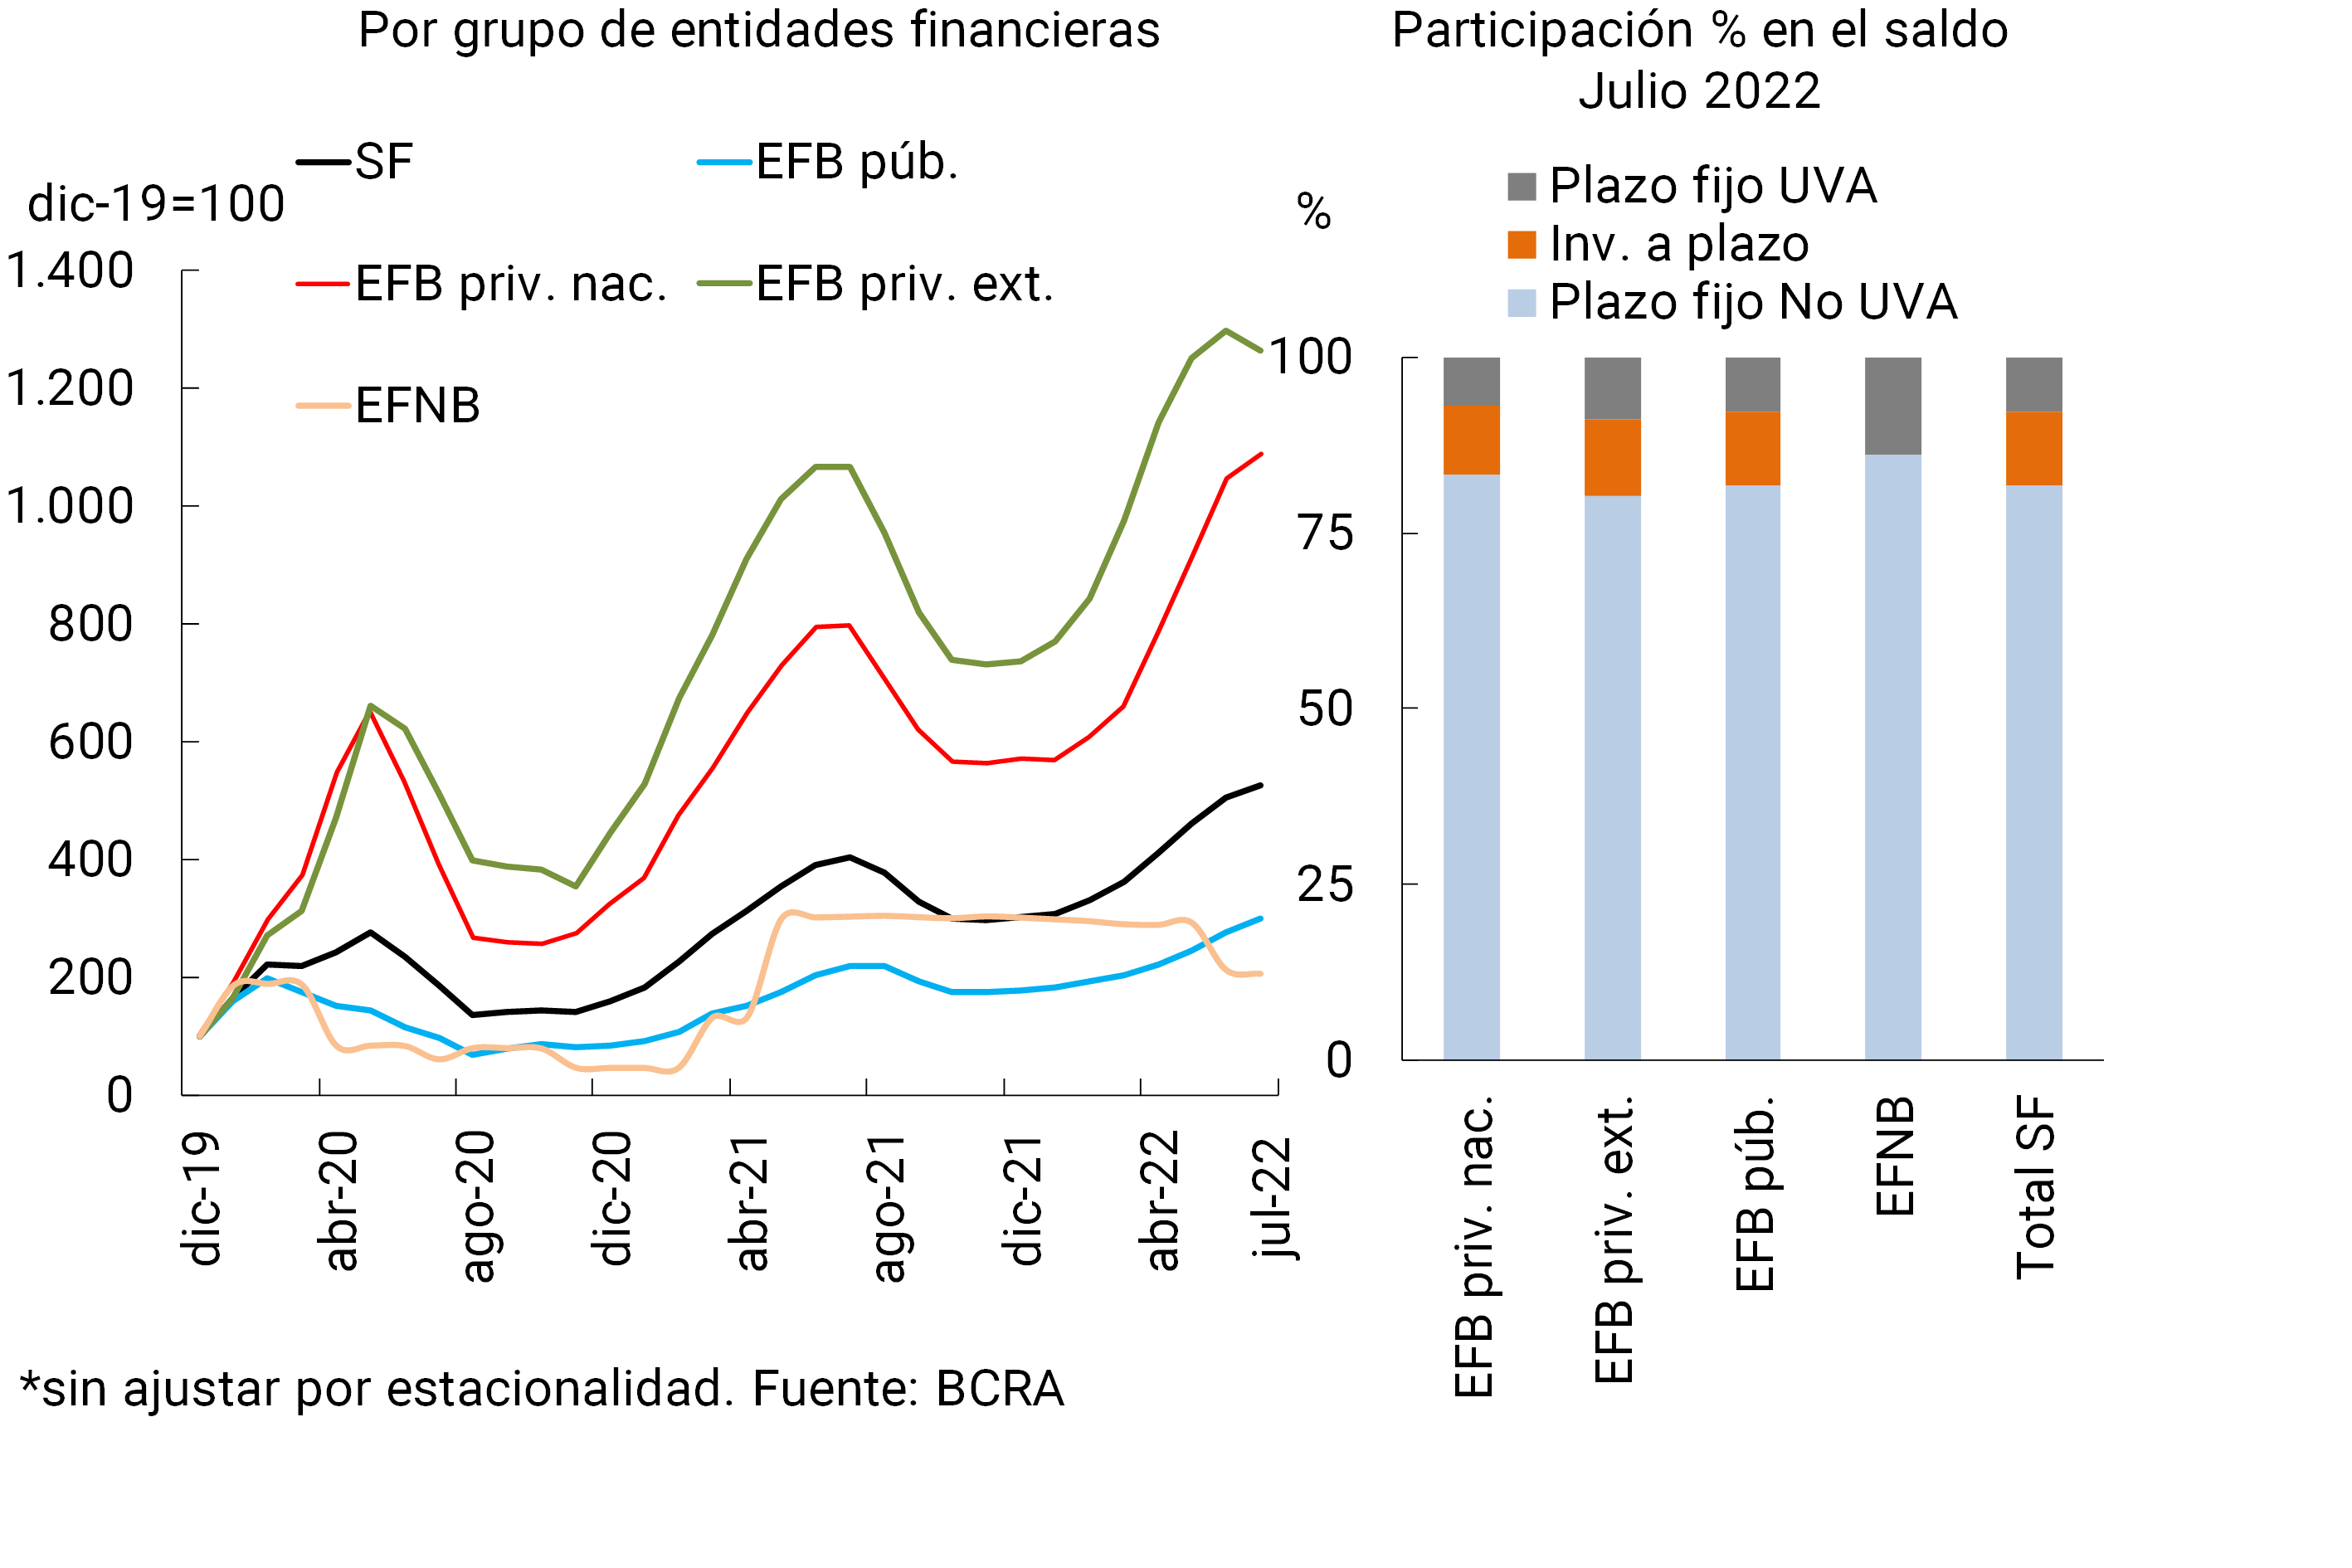
Regarding the funding of the financial system, in July the balance of deposits in pesos of the private sector fell 3.2% in real terms compared to June (+3.9% nominal, see Graph 3), reflecting falls in both demand accounts (-5.6% real or +1.4% nominal) and time deposits (-0.4% real or +6.9% nominal). Within the latter segment, traditional fixed-term deposits showed slight declines in real terms during July, which were partly offset by increases in UVA-denominated time deposits and time investments. The balance of the latter increased by 3.7% in real terms in the month,5 accumulating an increase of 73.6% in real terms since December. The performance of these deposits in the first 7 months of the year showed greater relative dynamism in private banking financial institutions and, to a lesser extent, in public banking institutions (see Graph 4). In July, time deposits in UVA represented 7.8% of the balance of time deposits in pesos in the private sector, 2.9 p.p. above the value at the end of 2021.
Graph 3 | Balance of private sector deposits in pesos
In real terms* – Financial system
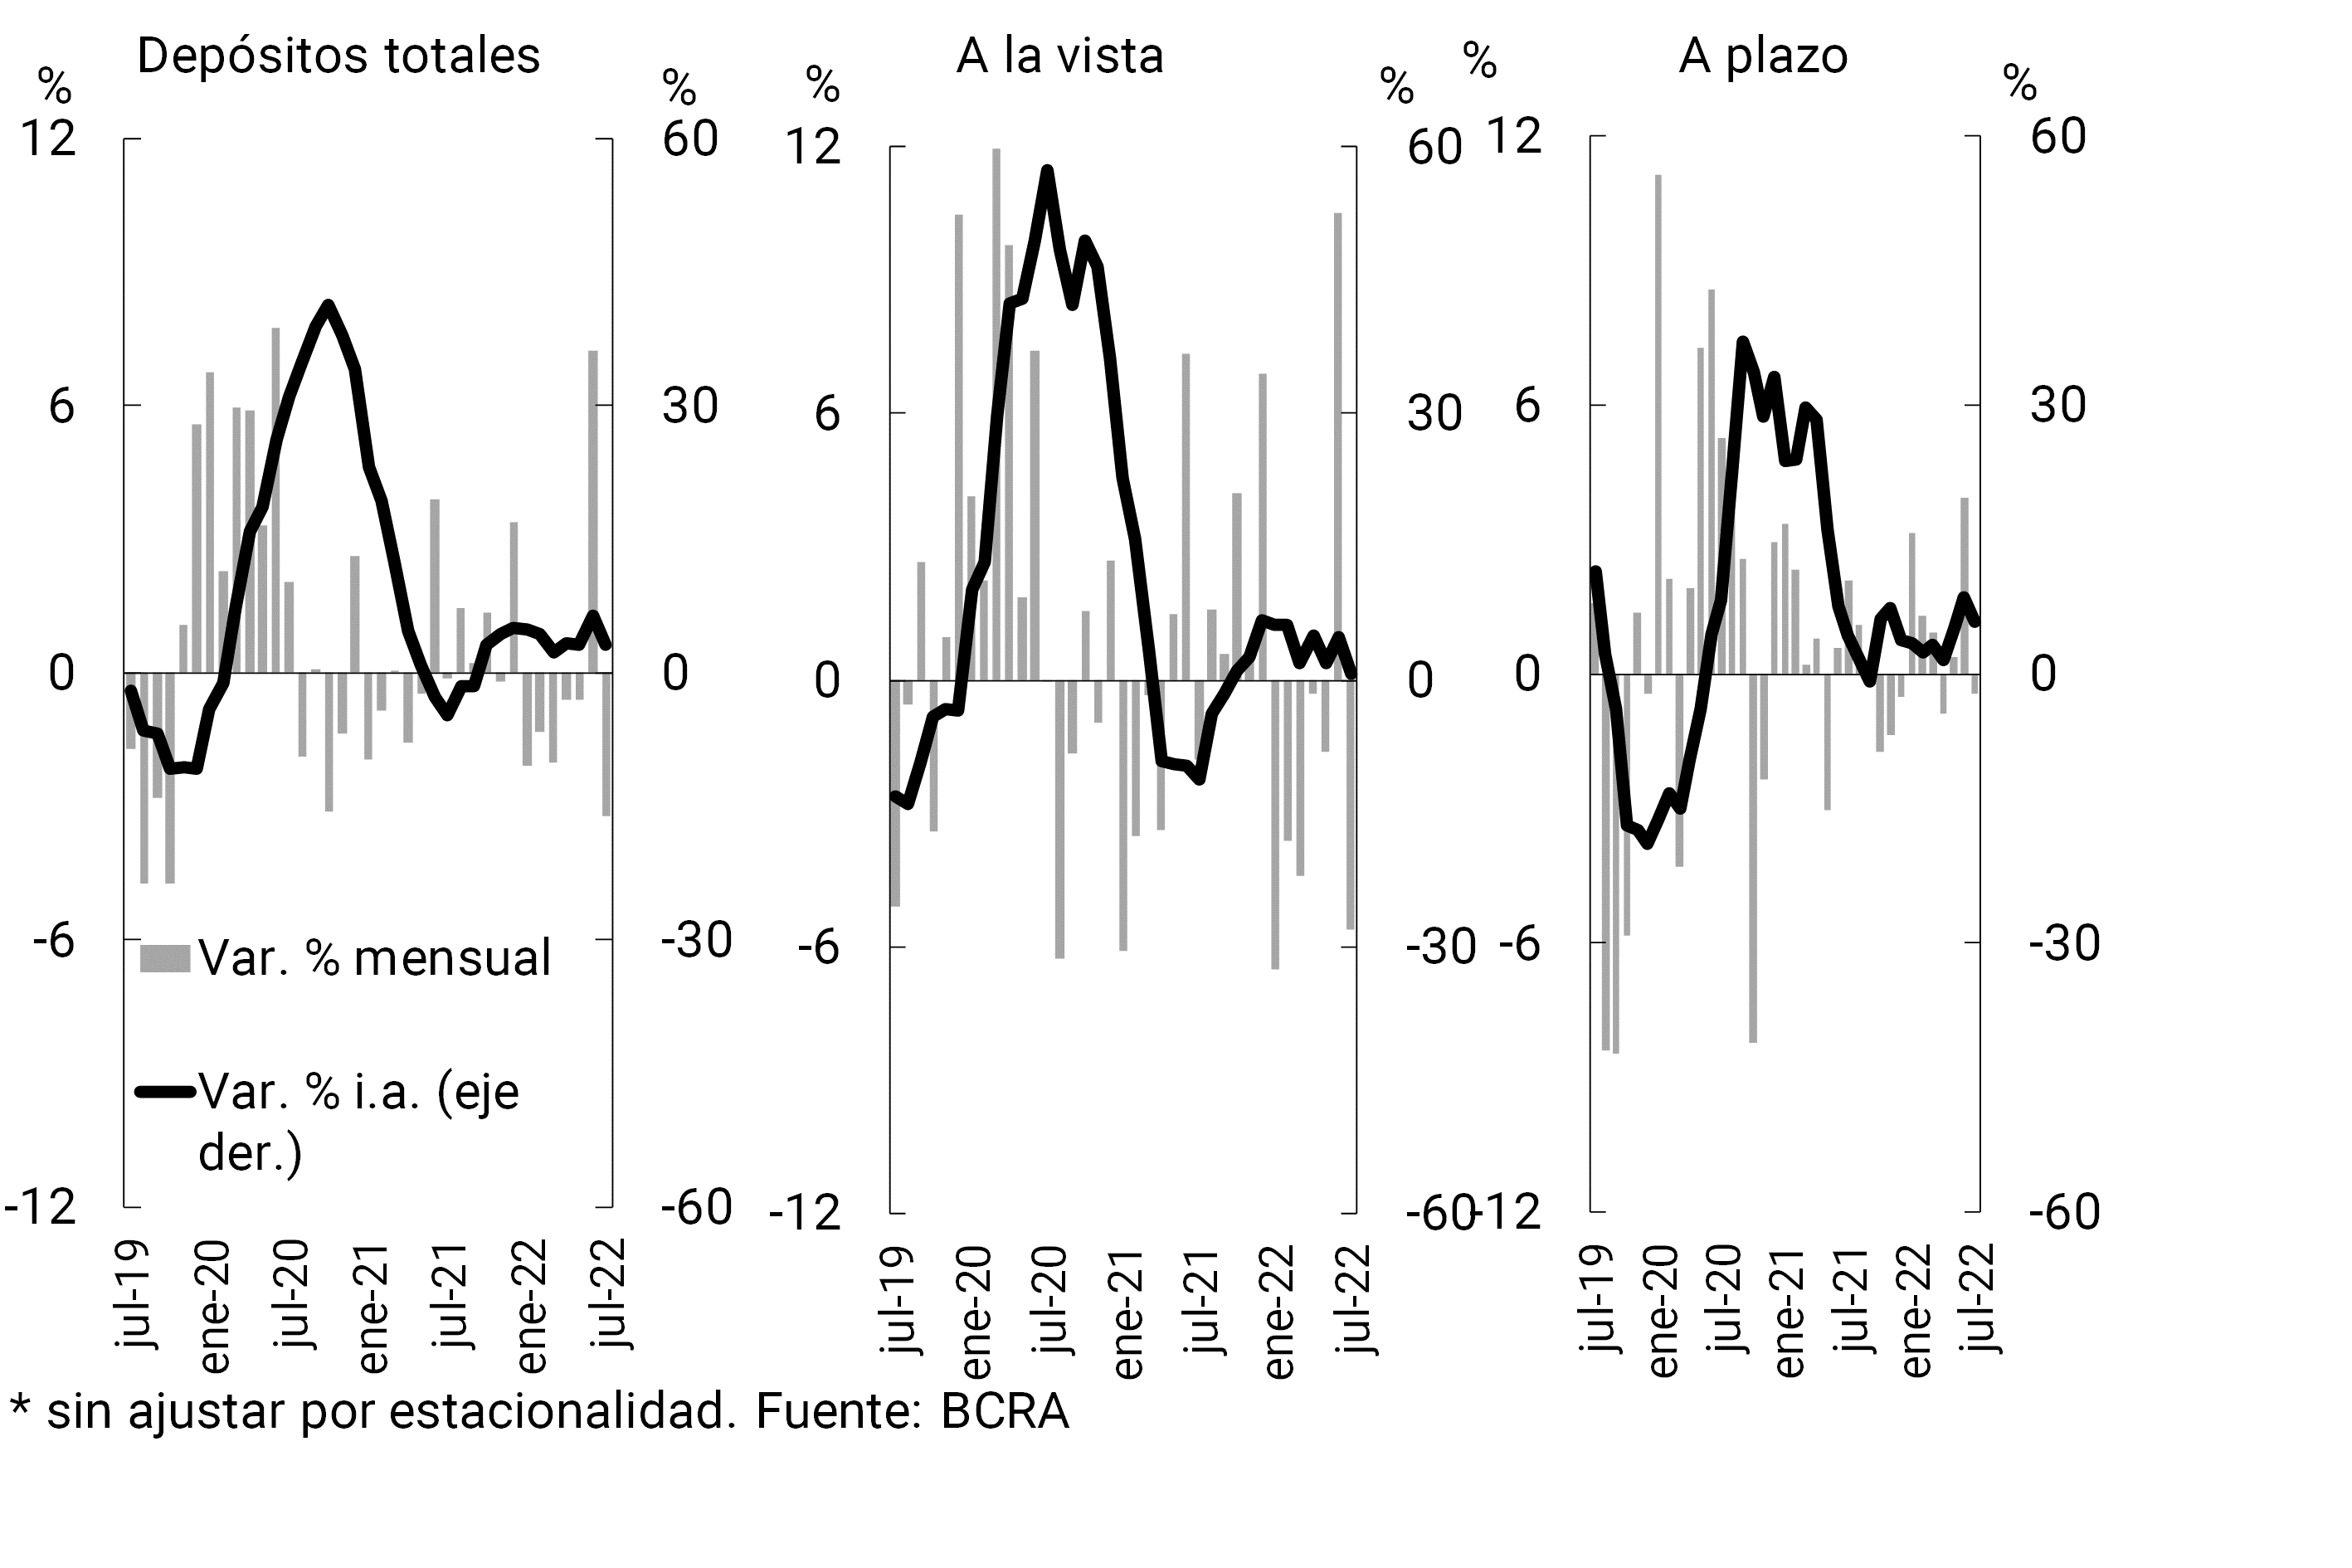
Figure 4 | Private sector UVA deposit balance in real terms*
In order to consolidate the process of normalization of the structure of interest rates to place them in positive territory in real terms, the BCRA recently raised the interest rate of the 28-day LELIQ from 69.5% to 75%. At the same time, the minimum interest rate on 30-day fixed terms of up to $10 million for individuals was increased to 75% TNA, while for the rest of the private sector’s fixed-term deposits it stood at 66.5% TNA. 6
In July, the balance of private sector foreign currency deposits fell by 5.5% in source currency. Thus, total private sector deposits (in domestic and foreign currency) accumulated a fall of 3.9% in real terms (+3.2% nominal) in the month and 3.1% in real terms in a year-on-year comparison (+65.6% nominal).
In year-on-year terms, the balance of deposits in pesos in the private sector increased by 3.1% in real terms (+76.1% nominal), while deposits in the public sector fell by 6.7% in real terms (+59.5% nominal YoY). Considering the total sectors, the balance of deposits in pesos increased by 1.6% YoY in real terms (+73.6% YoY in nominal terms). Taking into account all types of depositors and currencies, the balance of total deposits decreased by 3.4% YoY in real terms (+65% YoY in nominal terms).
II. Evolution and aggregate composition of the balance sheet
In July, the size of the balance sheet of the financial system, measured by the balance of total assets, fell by 2.4% in real terms (+4.8% nominal) compared to June. In a year-on-year comparison, assets also fell slightly in real terms (-2.2% or +67% nominal) at the systemic level.
With respect to the composition of the total assets of the sector as a whole, in July the weighting of the balance of BCRA instruments and foreign currency credit to the private sector was reduced. On the other hand, the main items that increased in relative importance in the month were the balances of the current accounts that the entities have in the BCRA and credit to the private sector in pesos (see Graph 5). When considering assets by currency, in the month the weighting of items in pesos without adjustment for CER (or in UVA) increased slightly (to 74.1%), while those assets denominated in pesos with CER adjustment clauses (or in UVA) slightly decreased their relative importance (to 11.6%).
Graph 5 | Composition of assets and total funding
Financial system – Share %
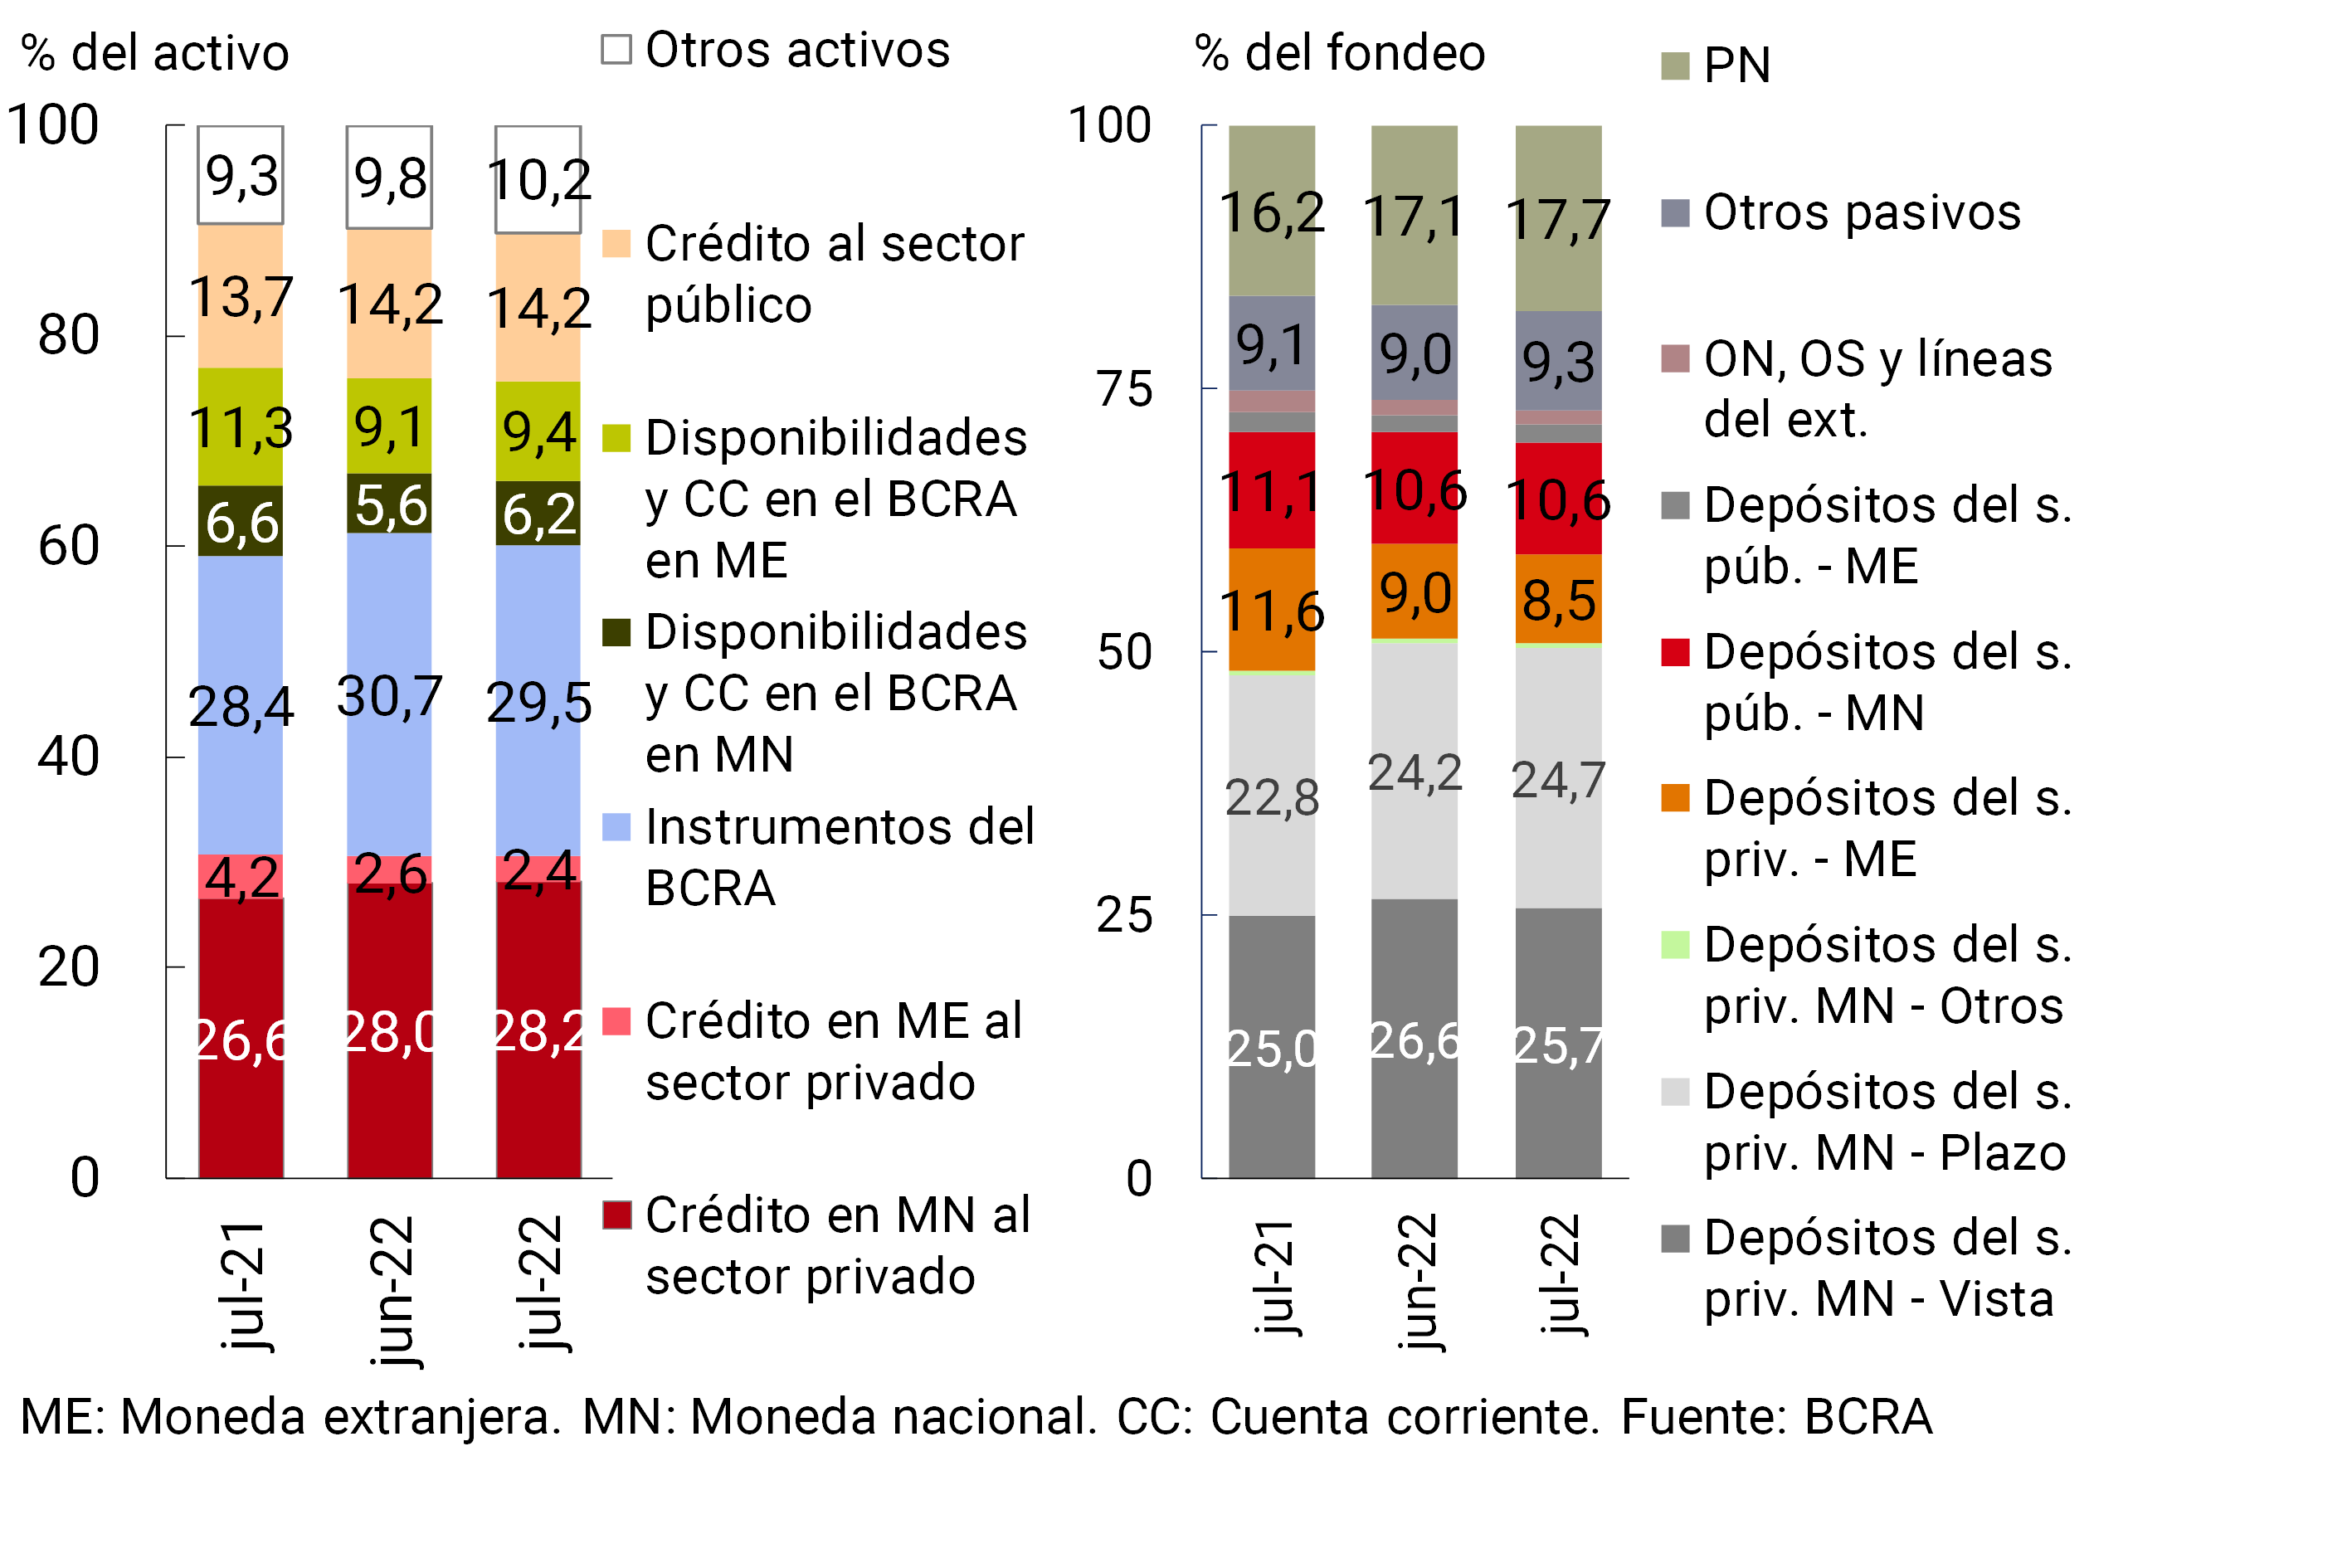
Regarding the composition of the total funding of the group of financial institutions, in the month the weighting of demand accounts in pesos of the private sector and deposits in foreign currency arranged by the same sector was reduced. Meanwhile, the balance of net worth and time deposits in national currency of the private sector increased their relative weight (see Chart 5). When differentiating the total funding by currency, the items in pesos with an adjustment clause by CER (or in UVA) increased slightly in their weighting in the month, reducing the relevance of those denominated in foreign currency.
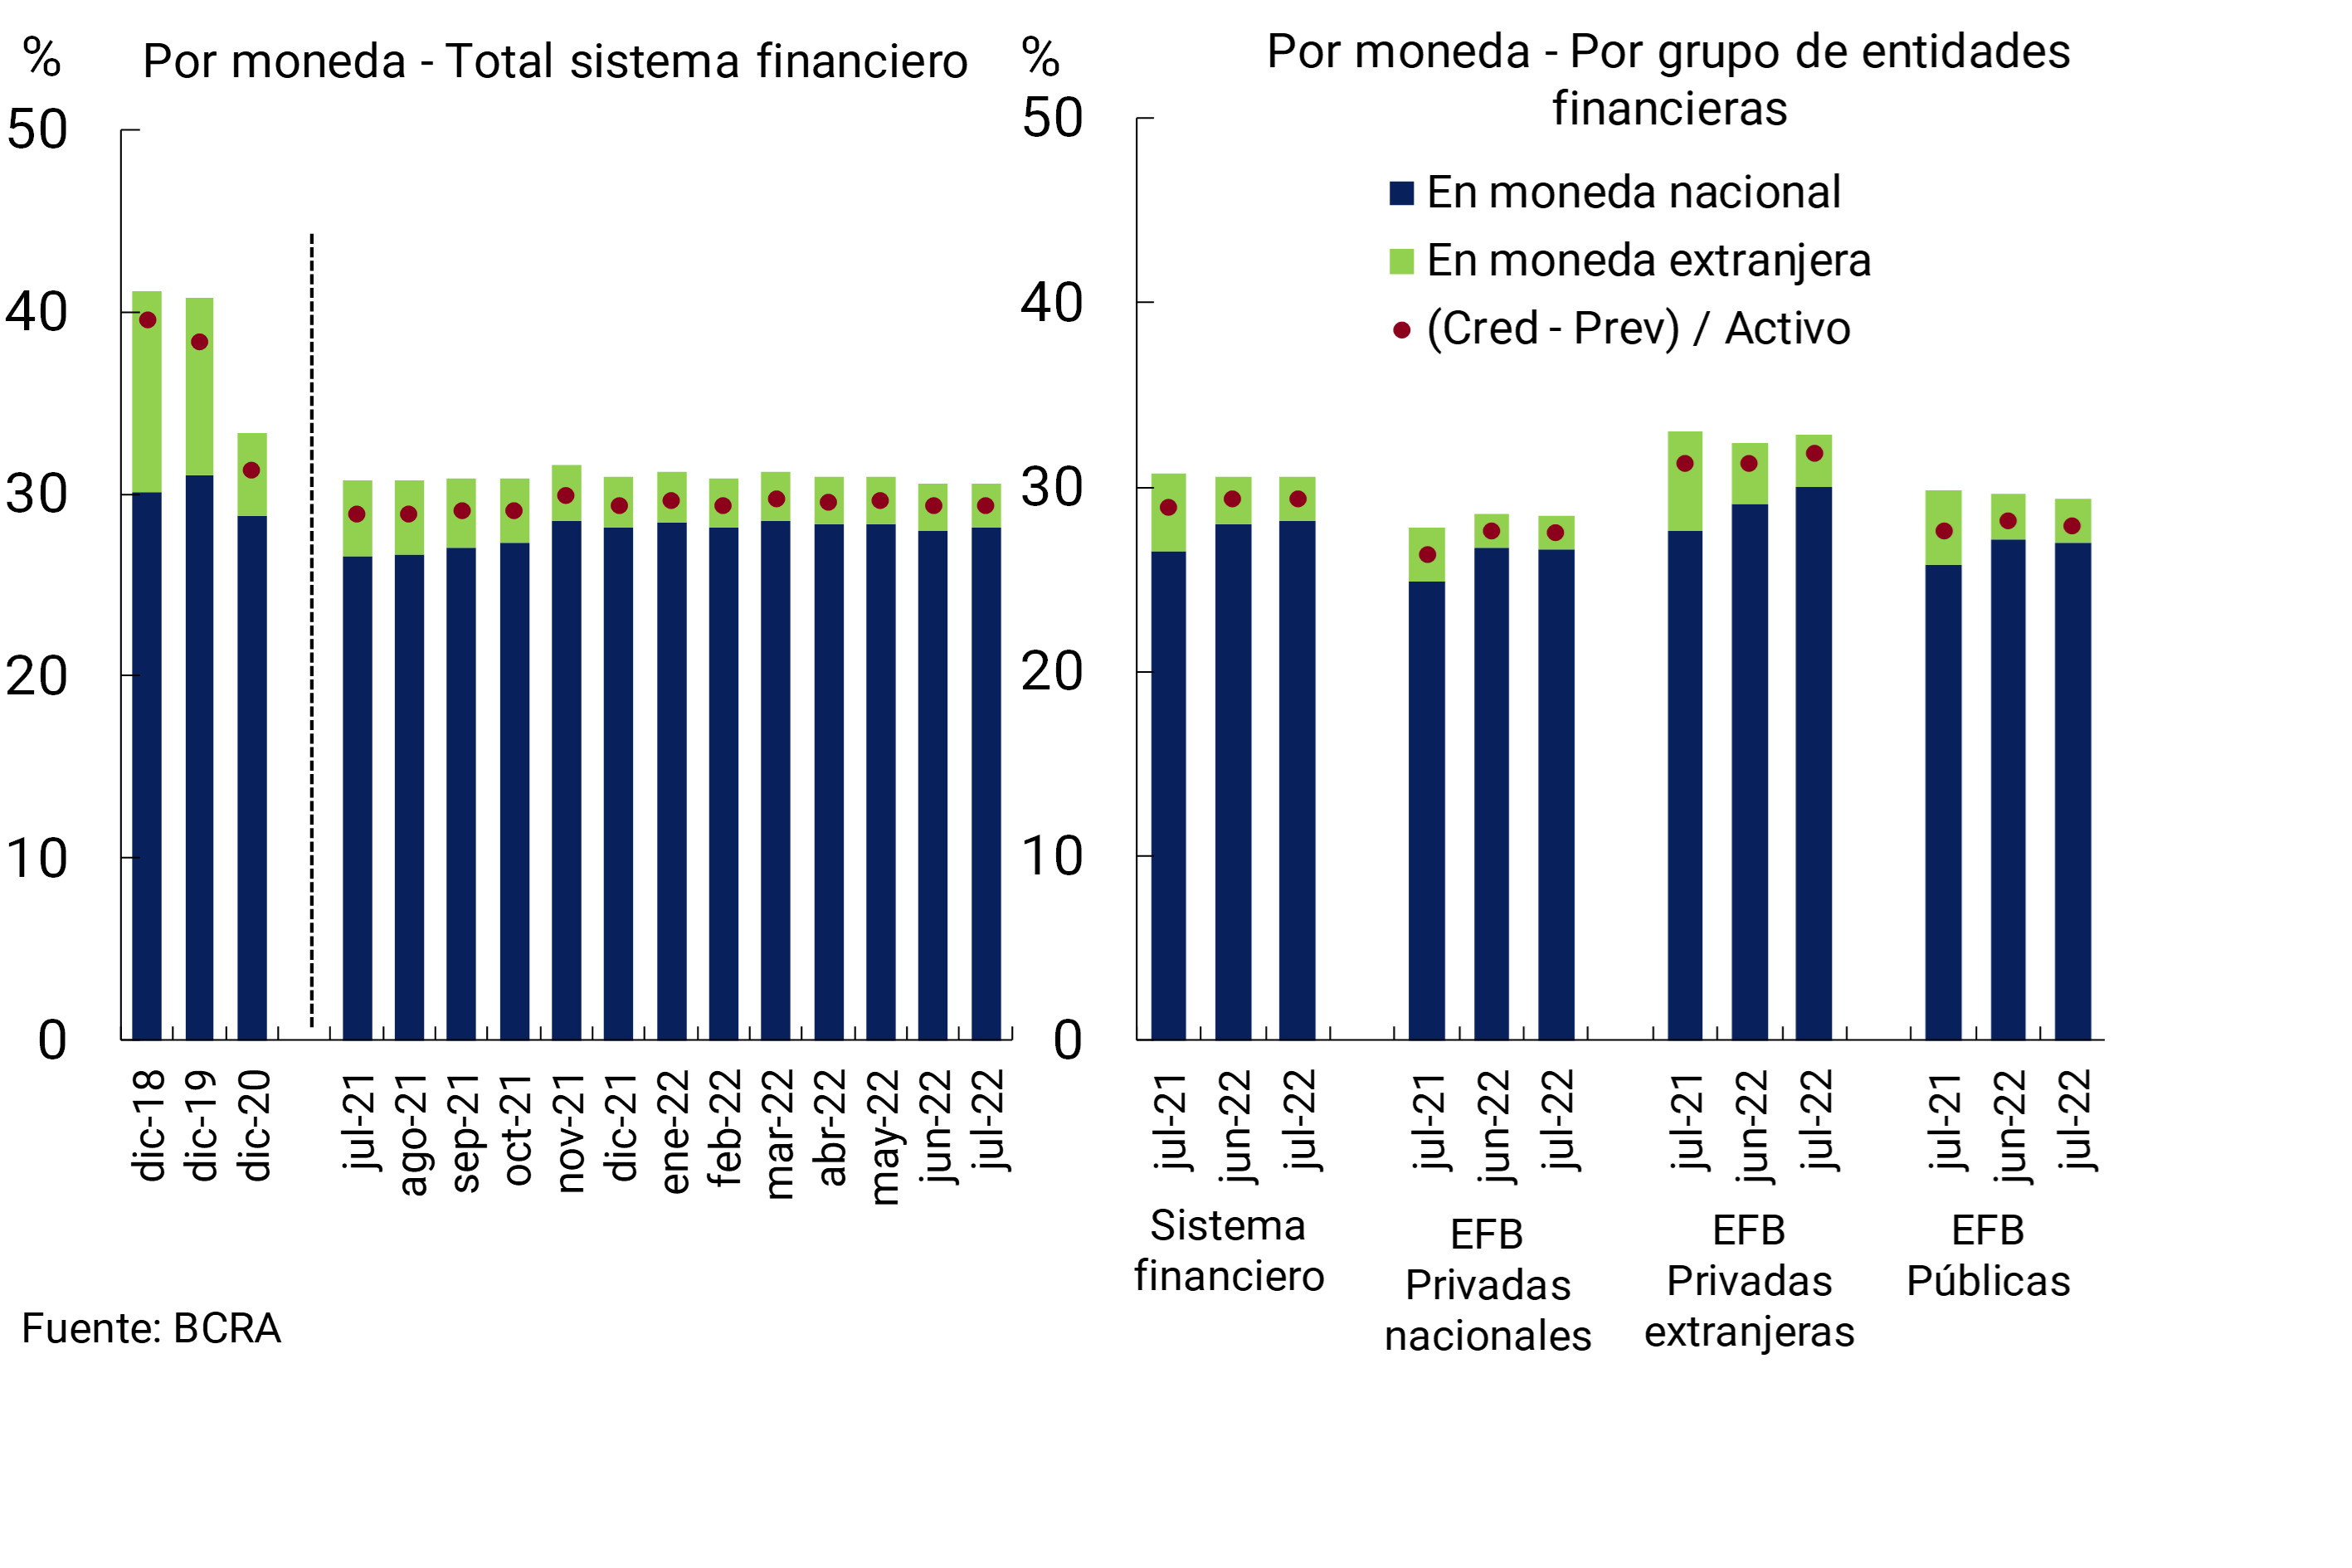
The exposure of the financial system’s balance sheet to foreign-currency-denominated items remained relatively low in July under macroprudential regulation. The spread between assets and liabilities of all financial institutions in foreign currency7 stood at 13.1% of regulatory capital in July, 1.4 p.p. more than last month (+5.8 p.p. y.o.y.). Meanwhile, the positive spread between assets and liabilities with capital adjustment by CER (or in UVA) totaled 60.8% of regulatory capital in the month, 4.4 p.p. less than in June and 5.2 p.p. above the July 2021 record.
III. Portfolio quality
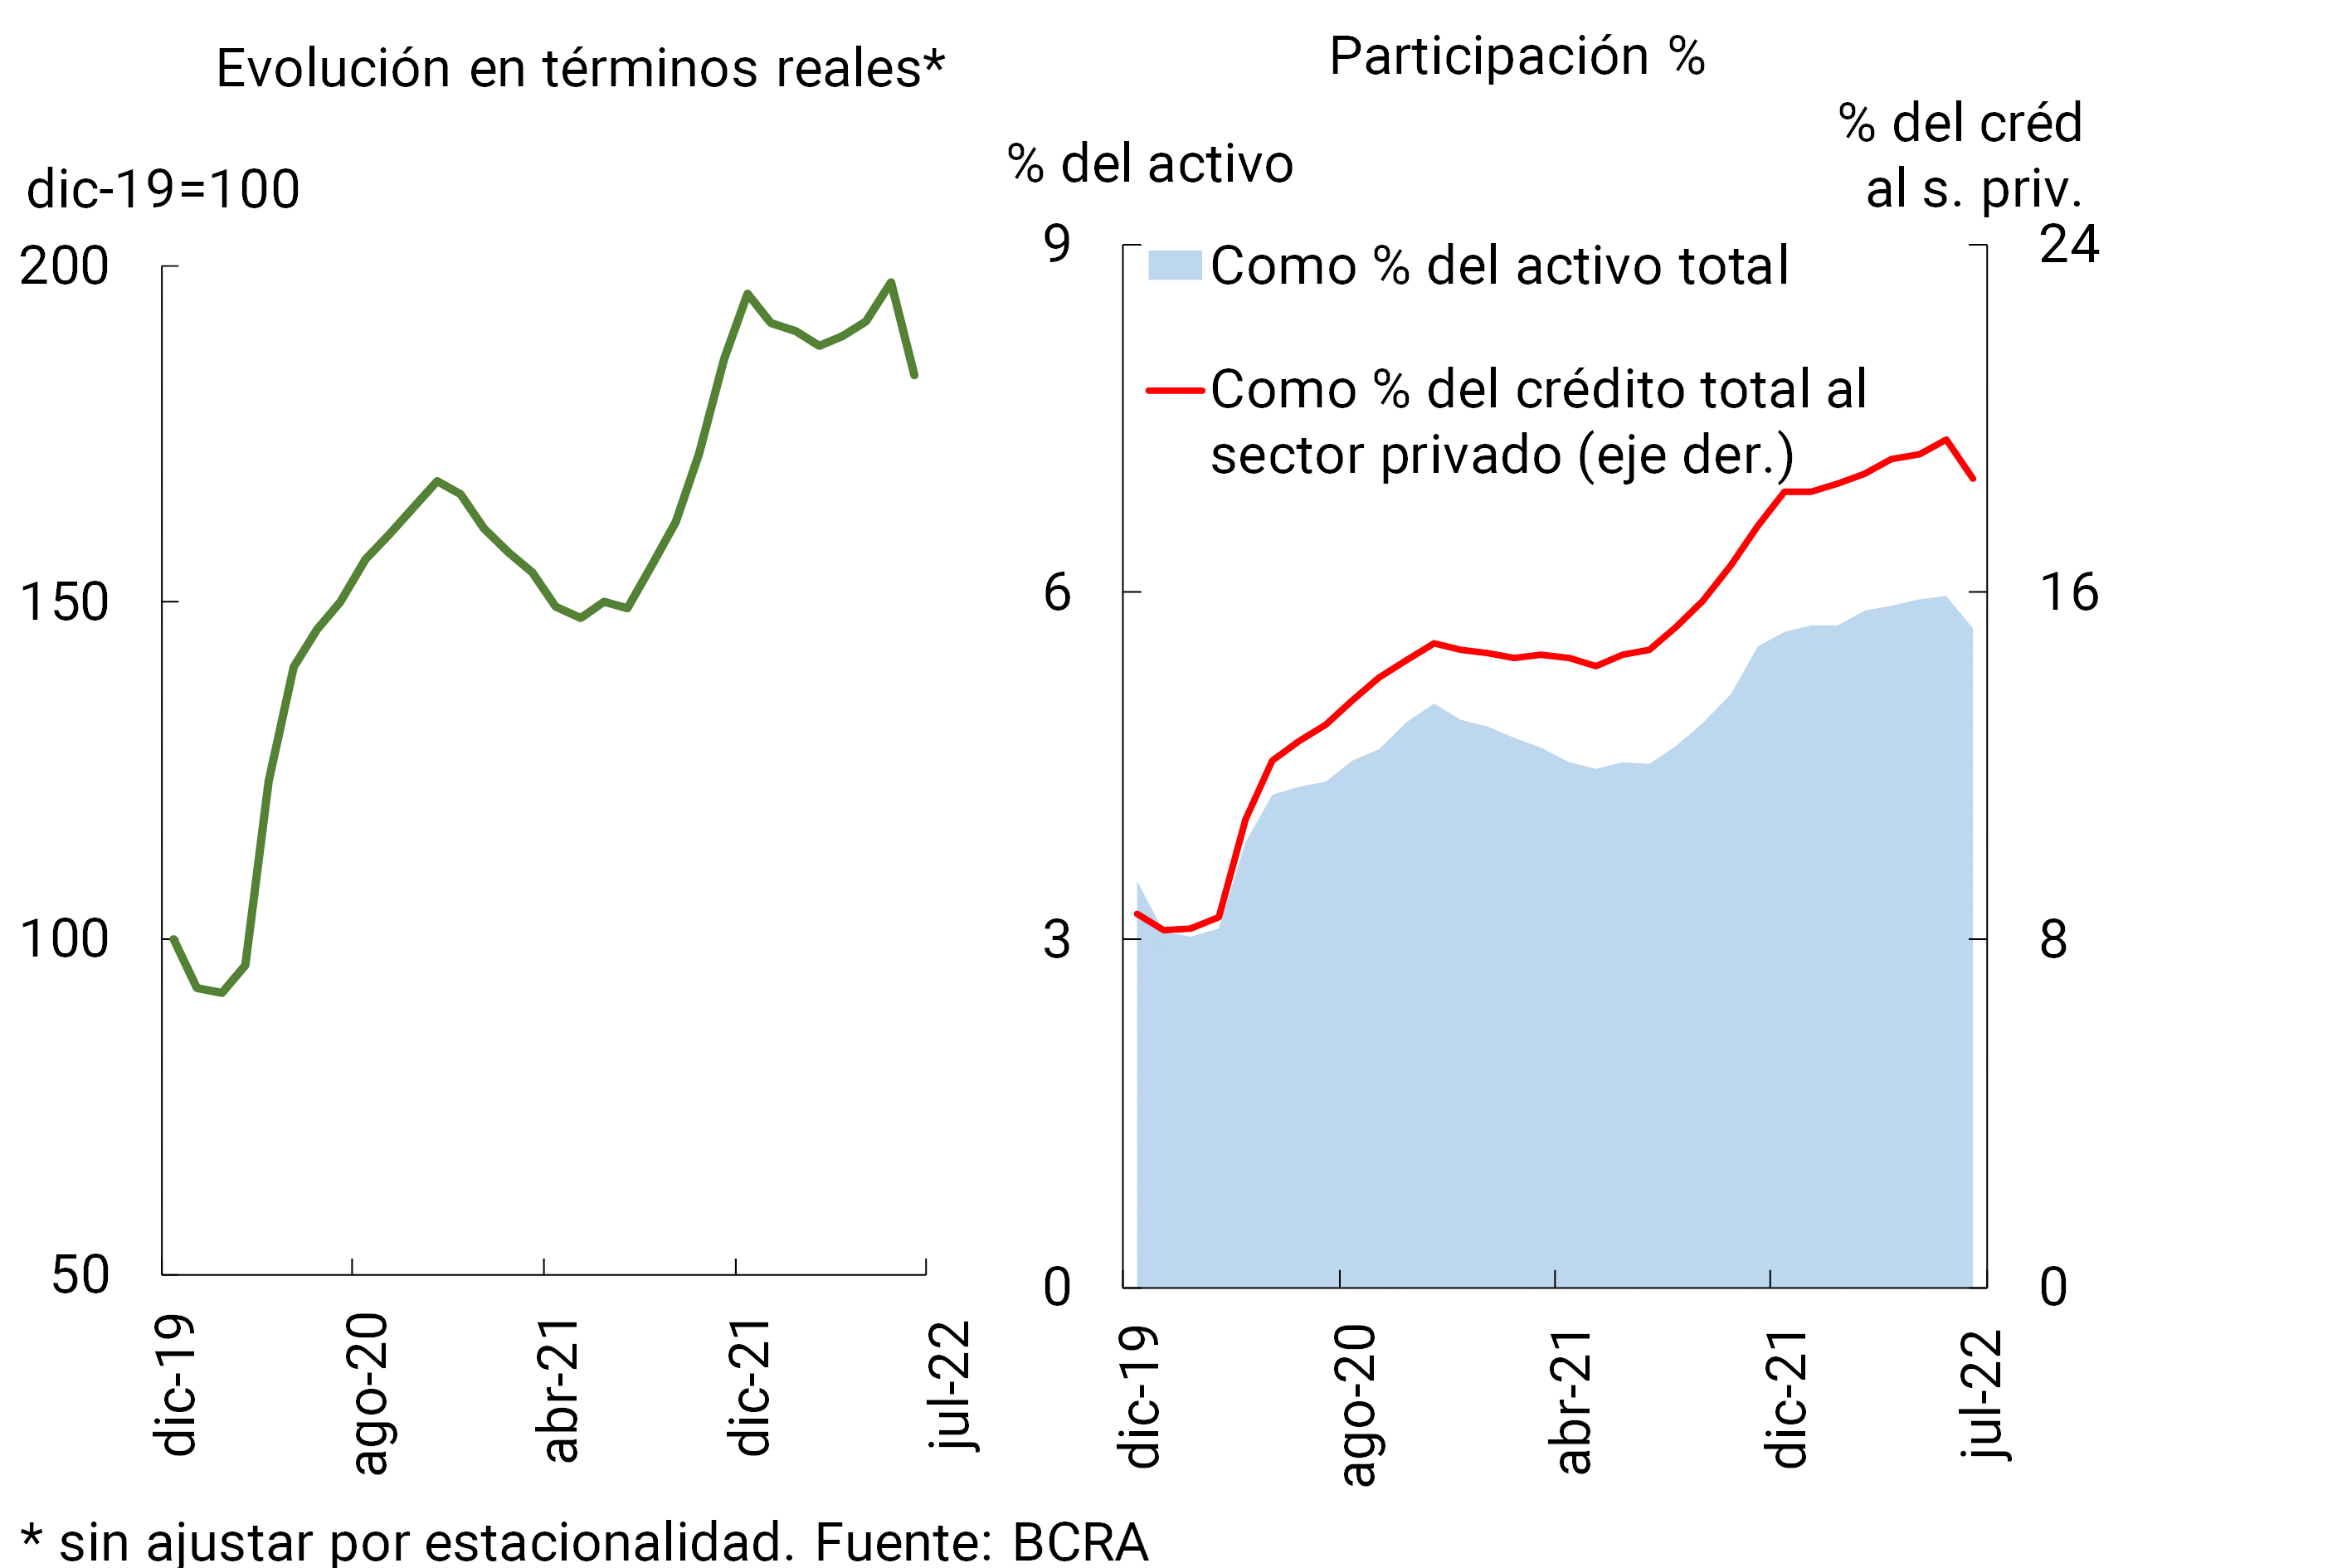
In July, the financial system’s gross exposure to the private sector (including domestic and foreign currency) stood at 30.6% of total assets,8 with no change in magnitude with respect to the previous month and in a year-on-year comparison (see Chart 6). When considering only financing in pesos, the gross exposure of all entities to the private sector stood at 28.2%, 0.2 p.p. above the June figure (+1.6 p.p. y.o.y.). For its part, the exposure of all entities to the public sector represented 14.2% of total assets in July, with no change in magnitude in the month (+0.5 p.p. y.o.y.).
Graph 6 | Private Sector Credit Balance / Assets
The non-performing loan ratio for private sector loans fell for the sixth consecutive month in July to 3.1%, accumulating a year-on-year decline of 2.3 p.p.9 The monthly performance of this indicator was driven by credit to companies. The NPL ratio in this segment fell by 0.2 p.p. in the month, to a total of 3.1% (-2.8 p.p. y.o.y.), a variation mainly explained by the performance of companies linked to the construction, industry and primary production sectors (see Graph 7). In July, the indicator of delinquency of financing to families stood at 3.2% (with no changes in magnitude in the month and -1.8 p.p. y.o.y.)
Figure 7 | Irregularity of credit to the private sector
Irregular financing / Total financing (%)
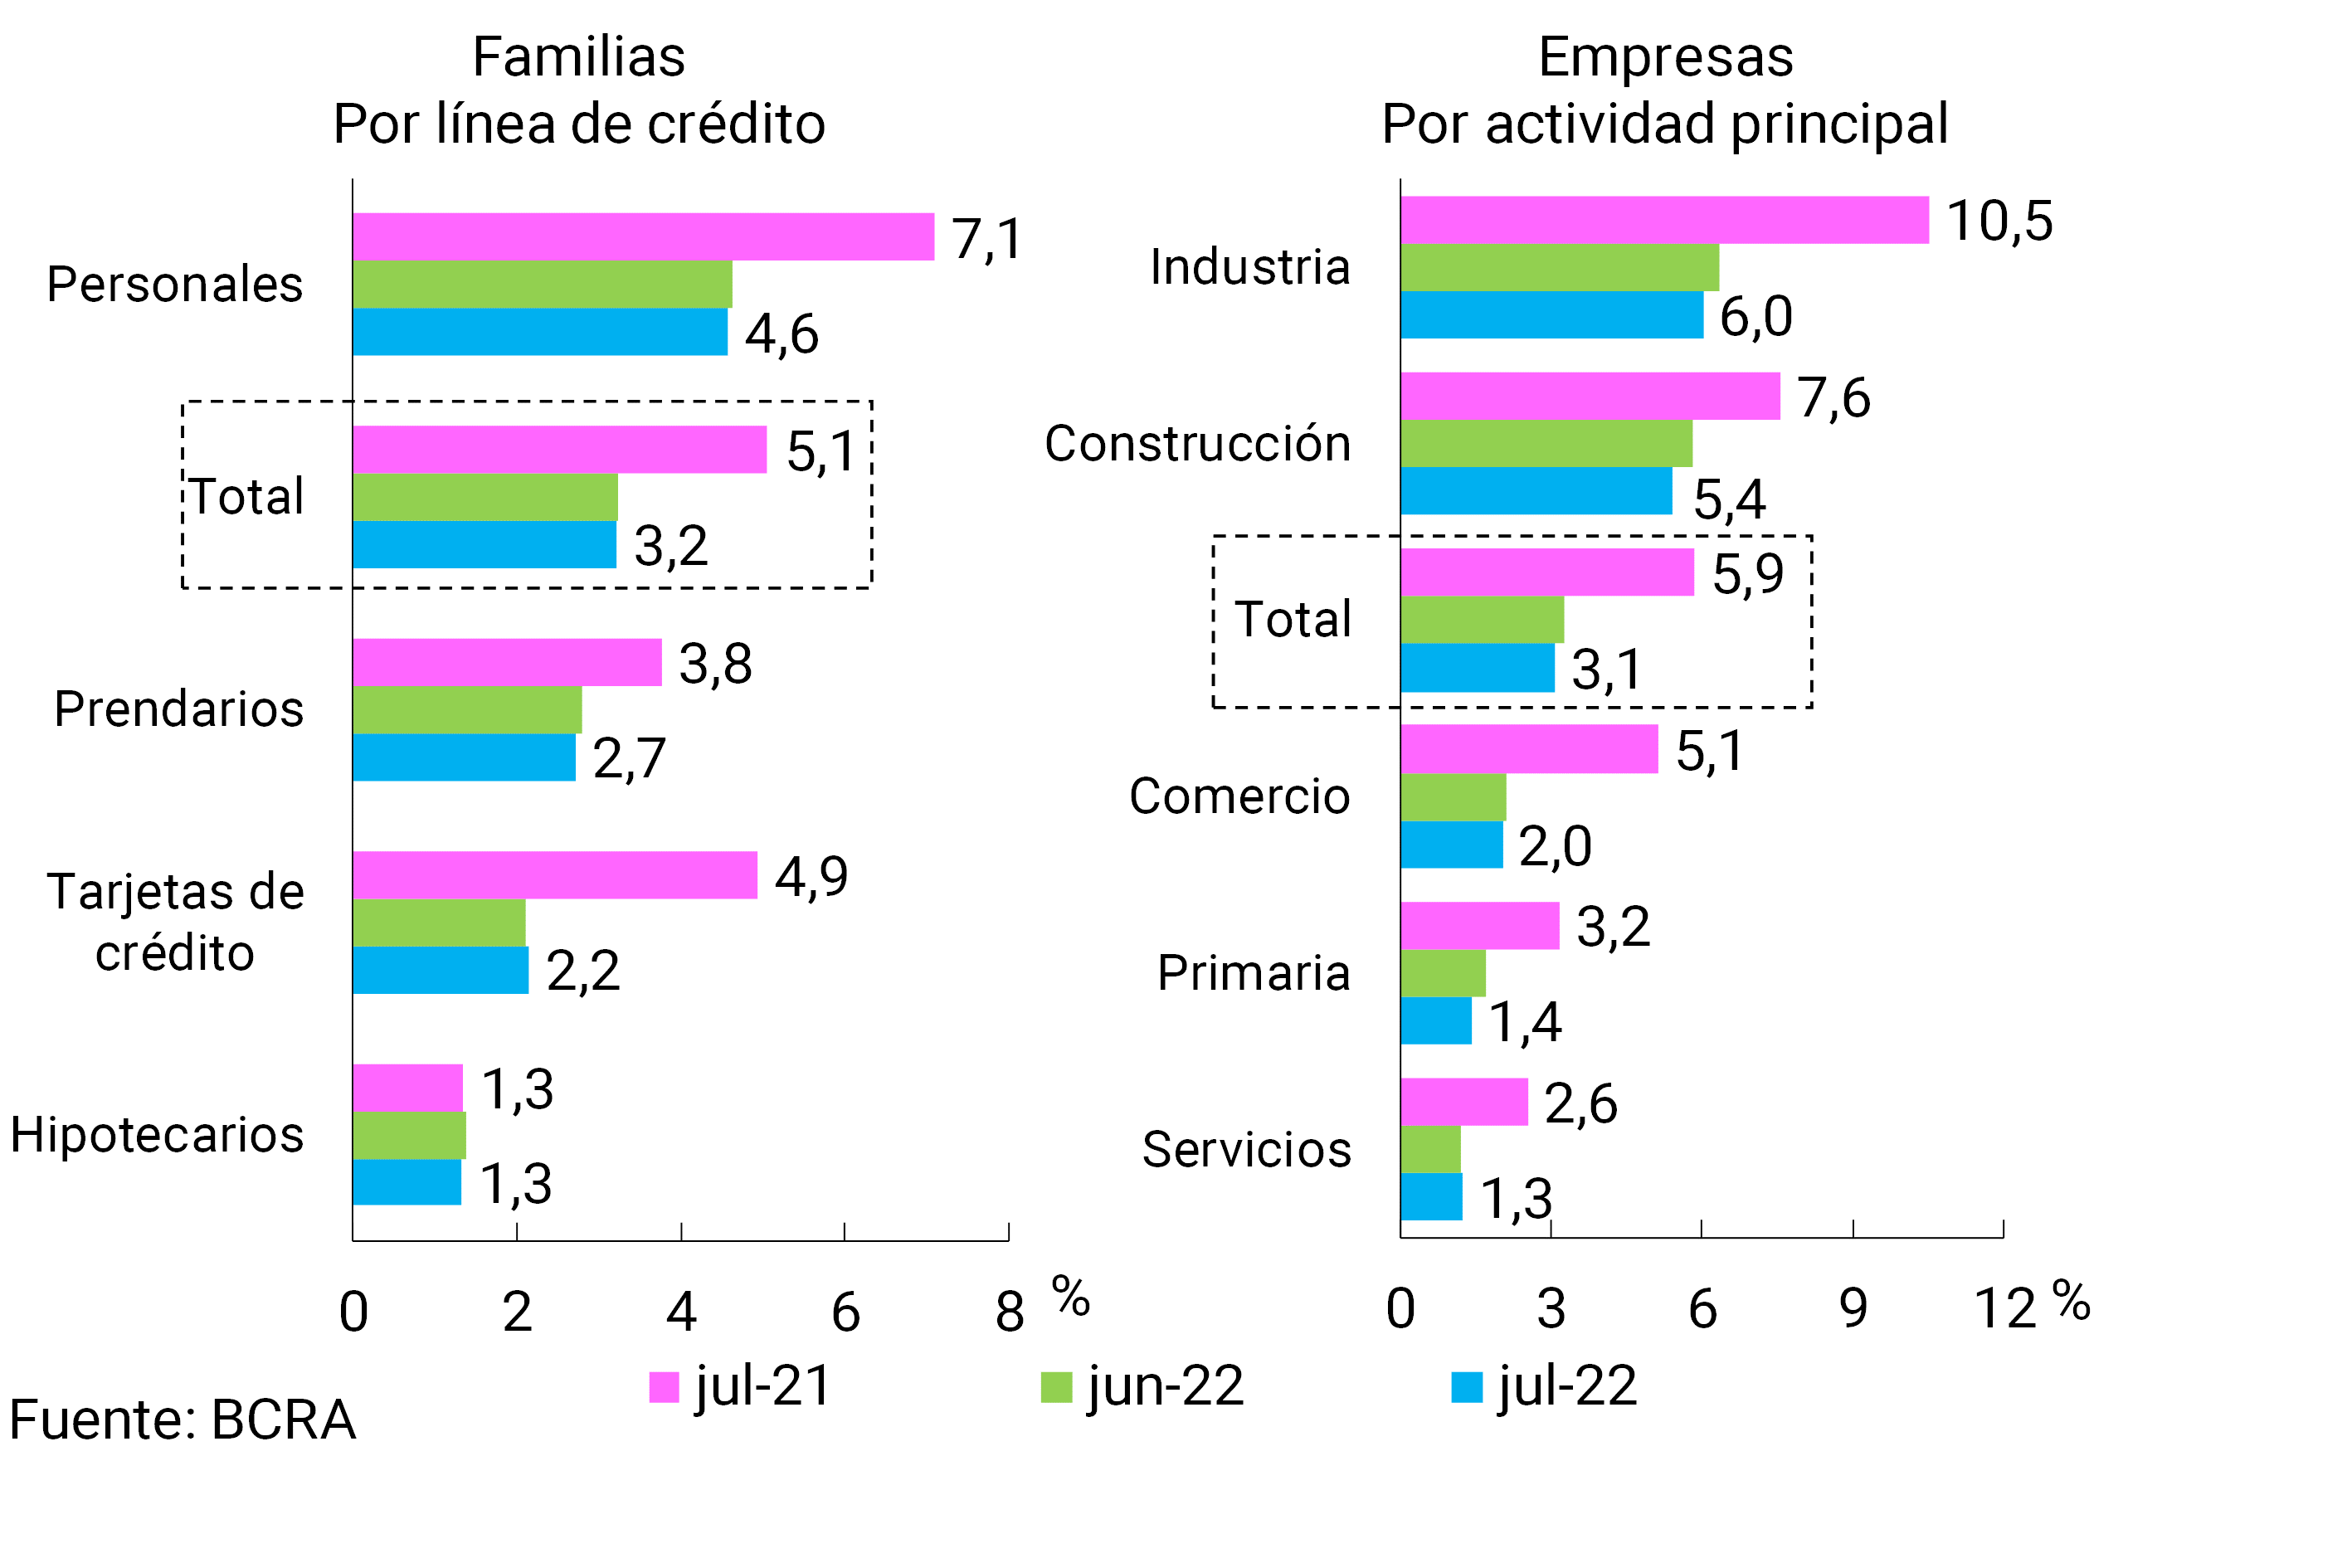
Disaggregated by entity group, loans to companies channeled through public financial institutions presented a relatively higher level of irregularity than in the rest of the groups of entities, in a framework in which there was a generalized decrease in the segment’s delinquency indicator in the last 12 months. In the credit segment of families, the highest levels of irregularity continued to be registered in non-bank financial institutions.
In July, the balance of total forecasts for the sector as a whole represented 3.8% of total credit to the private sector (-2.1 p.p. y.o.y.) and 120.5% of the portfolio in an irregular situation (no change in magnitude in the month and -11.9 p.p. y.o.y.). In the period, the net forecasts of those that regulatorily correspond to the portfolio in situation 1 and 2 (following the criteria of the minimum regulatory forecasts for uncollectibility risk) totalled 89.3% of the portfolio in an irregular situation for all institutions.
IV. Liquidity and solvency
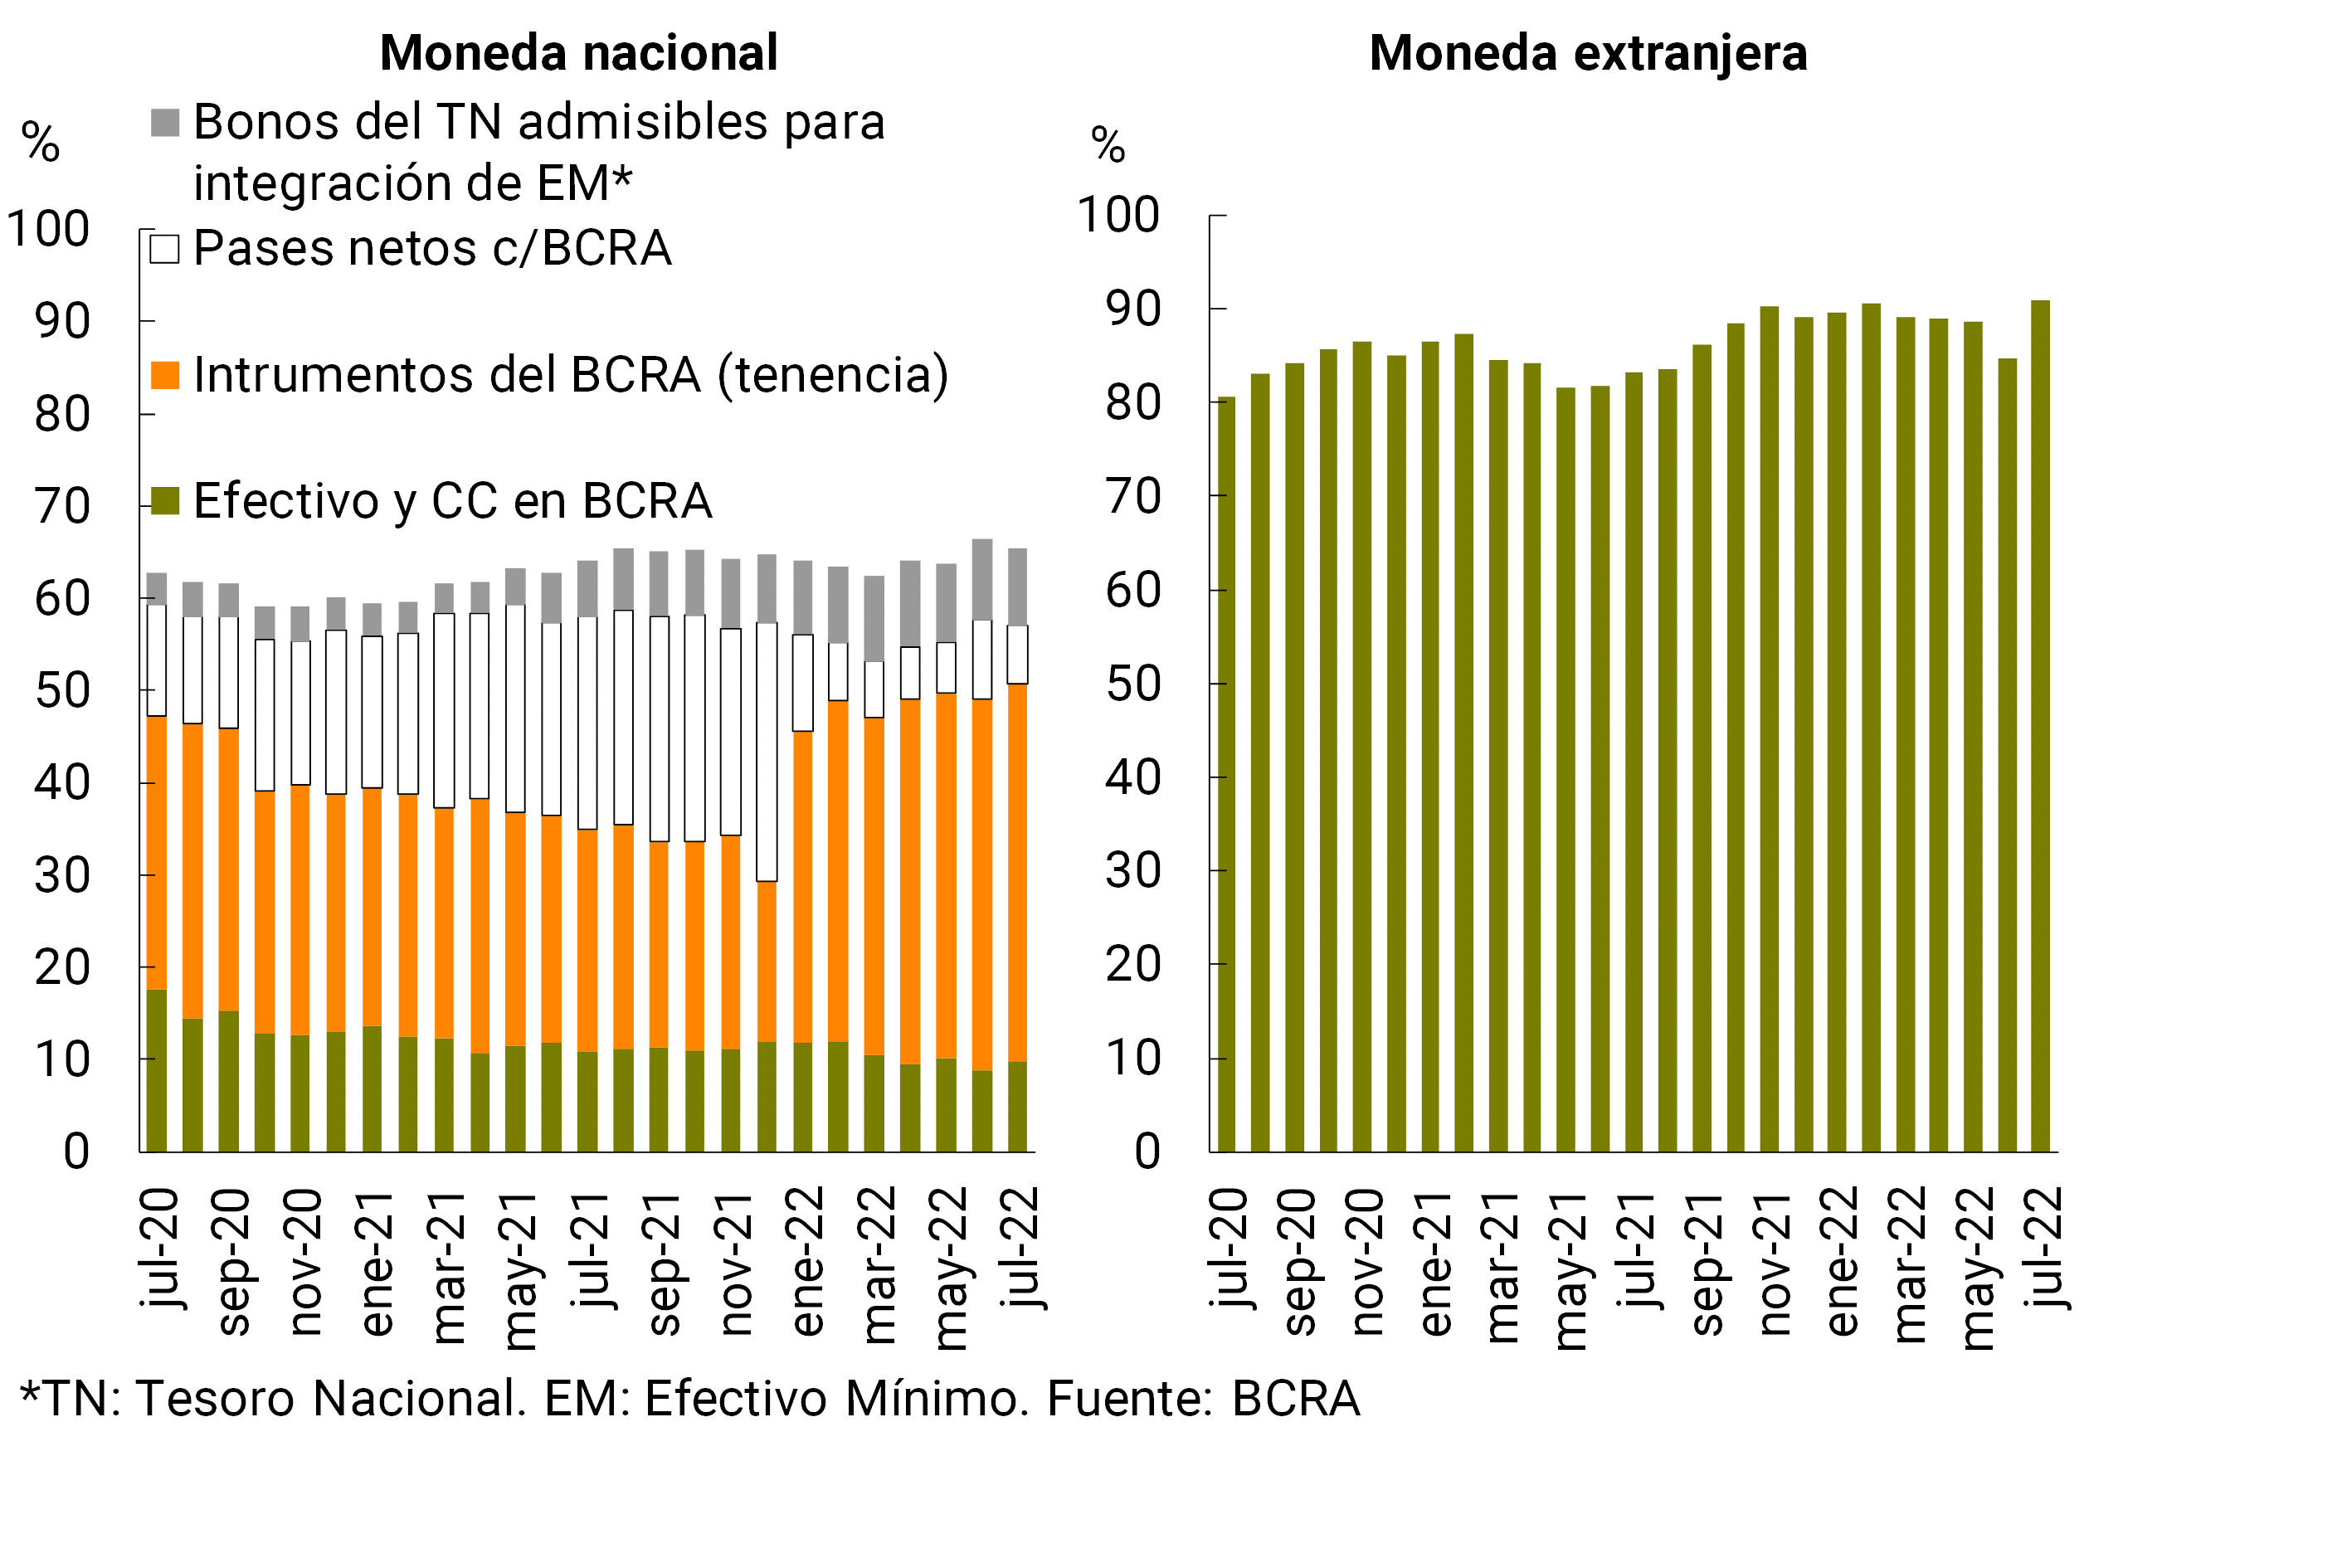
The liquidity indicators of the financial system remained at high levels in July. Broad liquidity accounted for 69.1% of total deposits at the end of the month, with no significant changes from June’s record. The indicator for items in pesos stood at 65.5%, and at 90.9% for those corresponding in foreign currency (-1 p.p. and +6.2 p.p. monthly, respectively, see Graph 8). In terms of the composition of liquidity in pesos, between the end of the month the relevance of net passes with the BCRA decreased, while the proportion of the balance of current accounts that entities have in this Institution and the holding of BCRA instruments increased. In year-on-year terms, ample liquidity (in pesos and in foreign currency) fell 1.4 p.p. of total deposits.
Figure 8 | Liquidity of the financial system
In relation to the regulatory liquidity ratios that arise within the framework of international recommendations (Basel Committee), the group of entities locally obliged to comply with these requirements (Group A) closed the first half of 2022 (latest available information) with levels above the minimum required. As of June, the median Liquidity Coverage Ratio (LCR) stood at 2.1, while that observed for the Stable Net Funding Ratio (NSFR) amounted to 2, compared to a minimum required of 1 for both indicators.
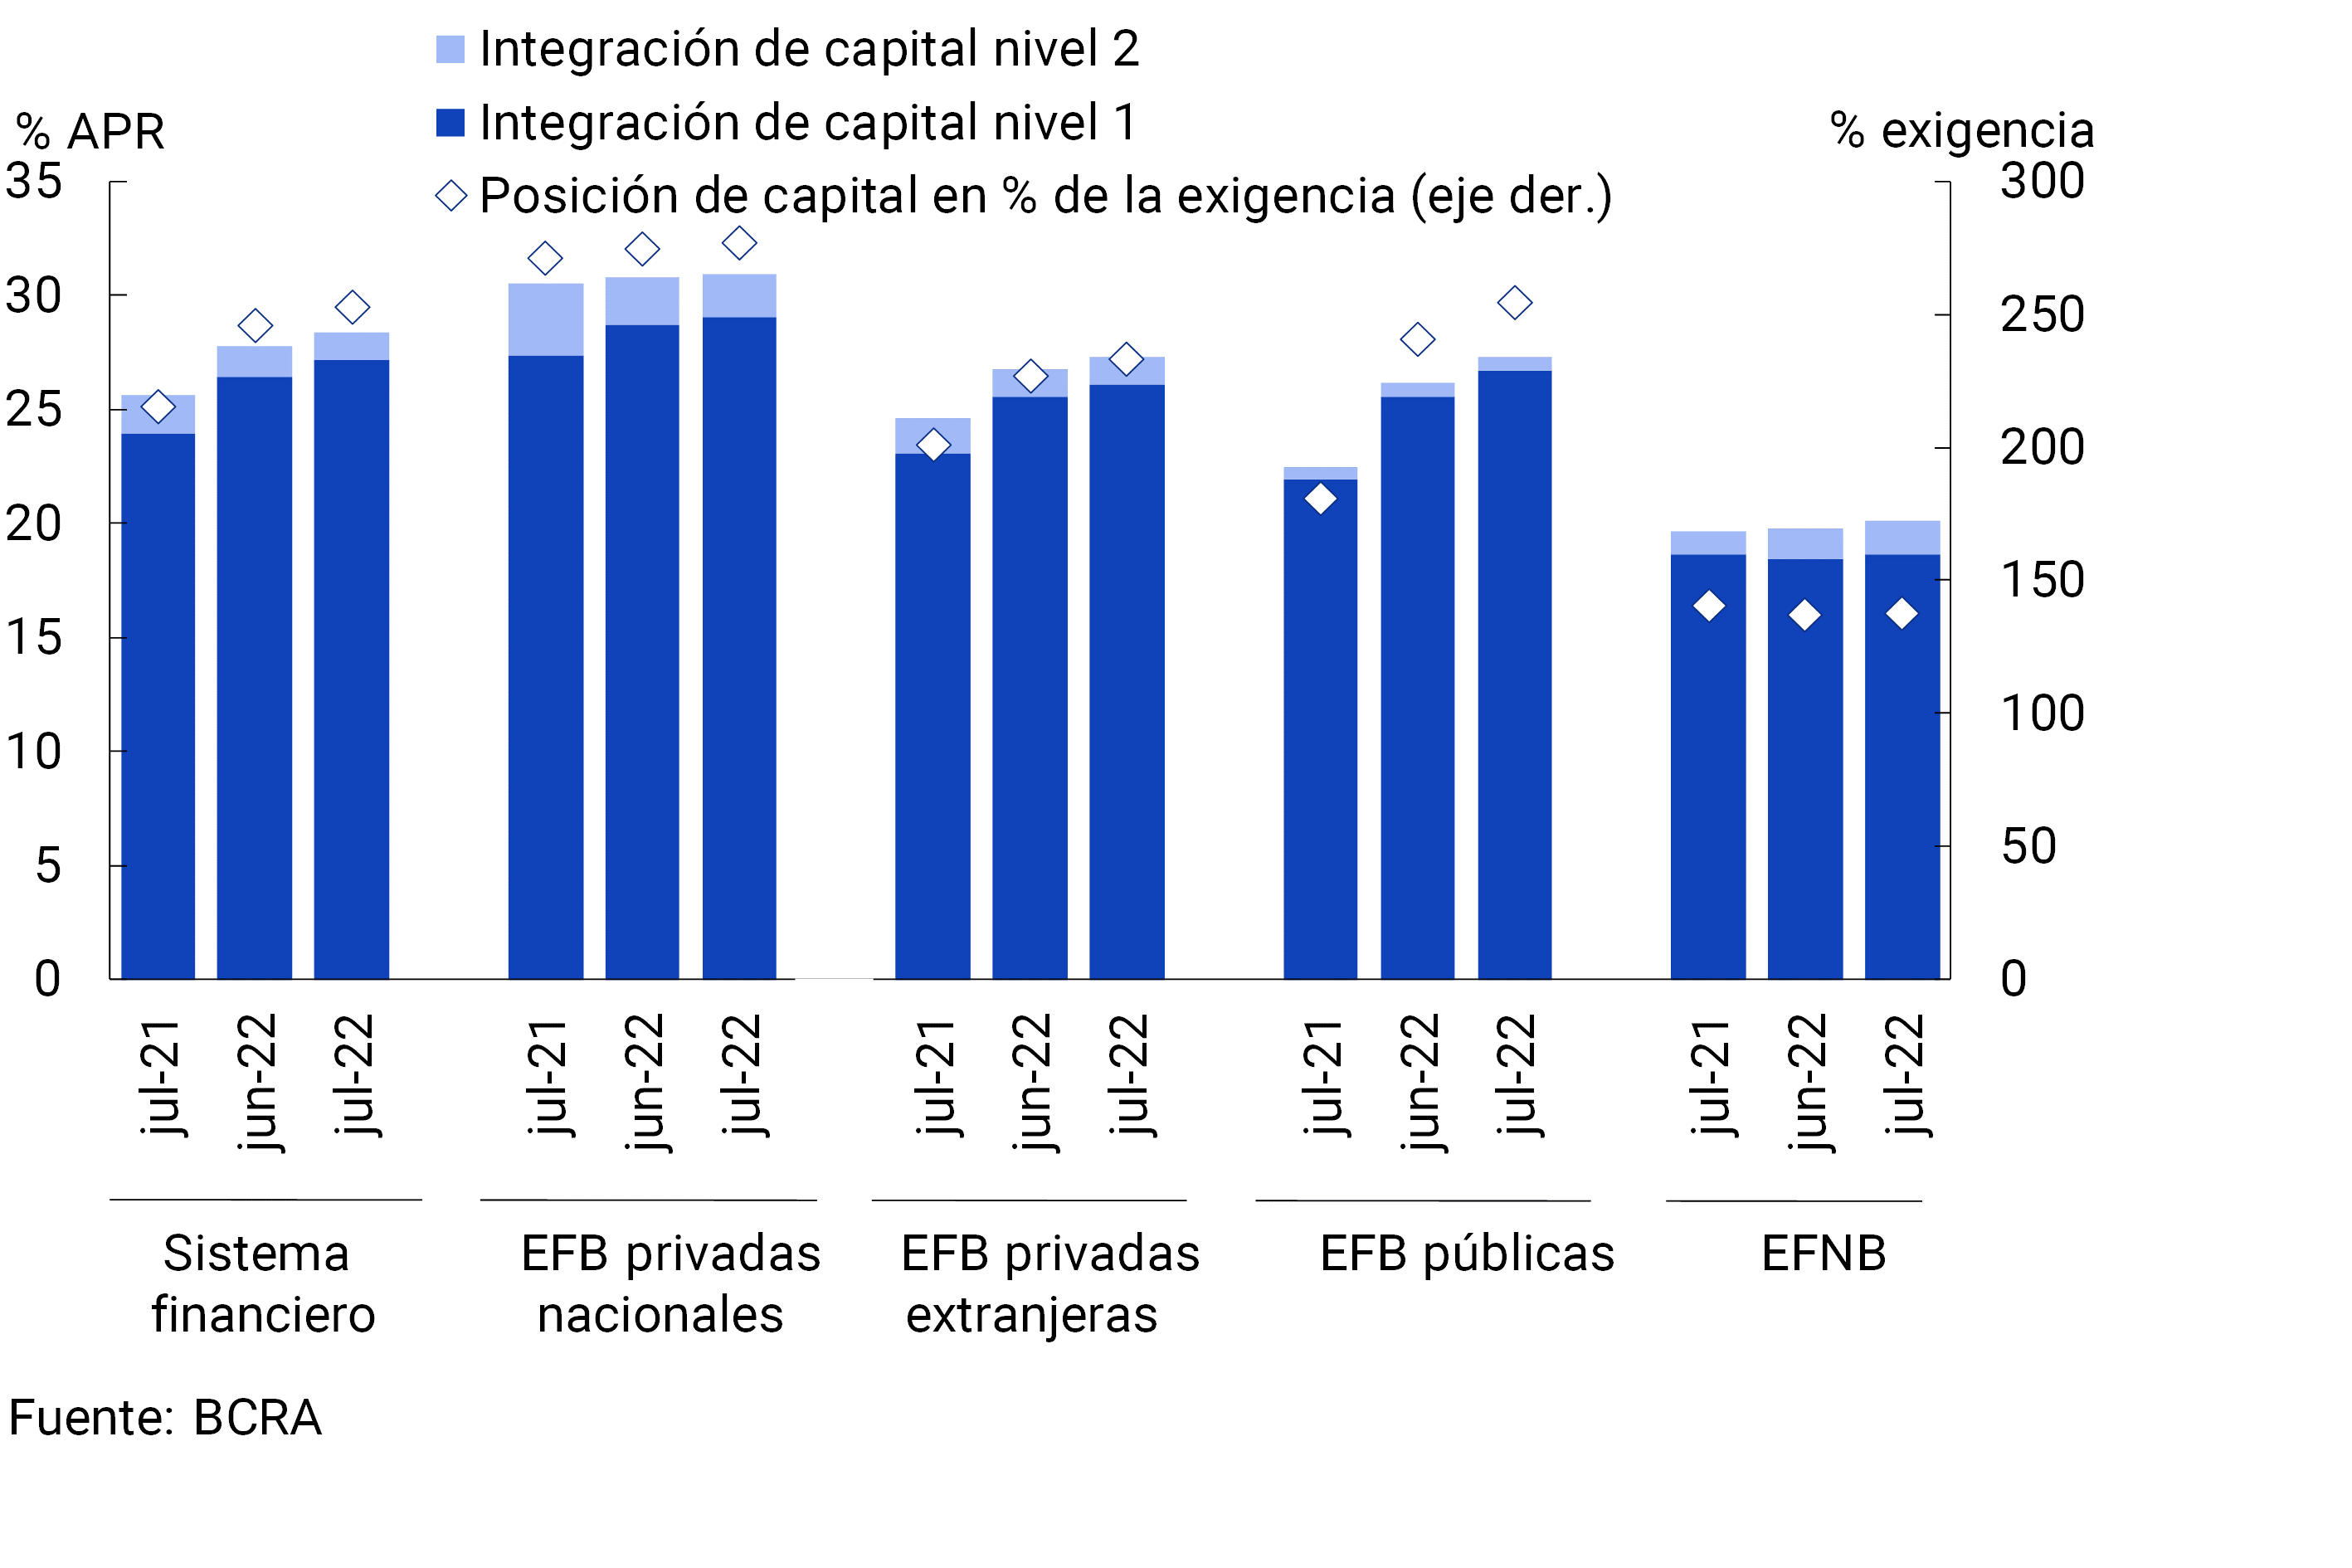
The banks as a whole maintained high solvency indicators in the month. Capital integration (PRC) of the aggregate financial system stood at 28.4% of its risk-weighted assets (RWA), 0.6 p.p. above the previous month (+2.8 p.p. y.o.y., see Chart 9). Regarding the composition of the PRC of the financial system, almost 96% was explained by Tier 1 capital, with a greater capacity to absorb potential losses. The capital position – excess capital integration in terms of regulatory requirements – totalled 253% of the requirement in the month at the systemic level, 7.2 p.p. more than in June (+37.9 p.p. y.o.y.). For its part, excess regulatory capital in July represented 36.3% of the balance of credit to the private sector net of forecasts at the aggregate level, well above the average of the last 10 years (16.2%).
Figure 9 | Integration of regulatory capital
By financial institution group
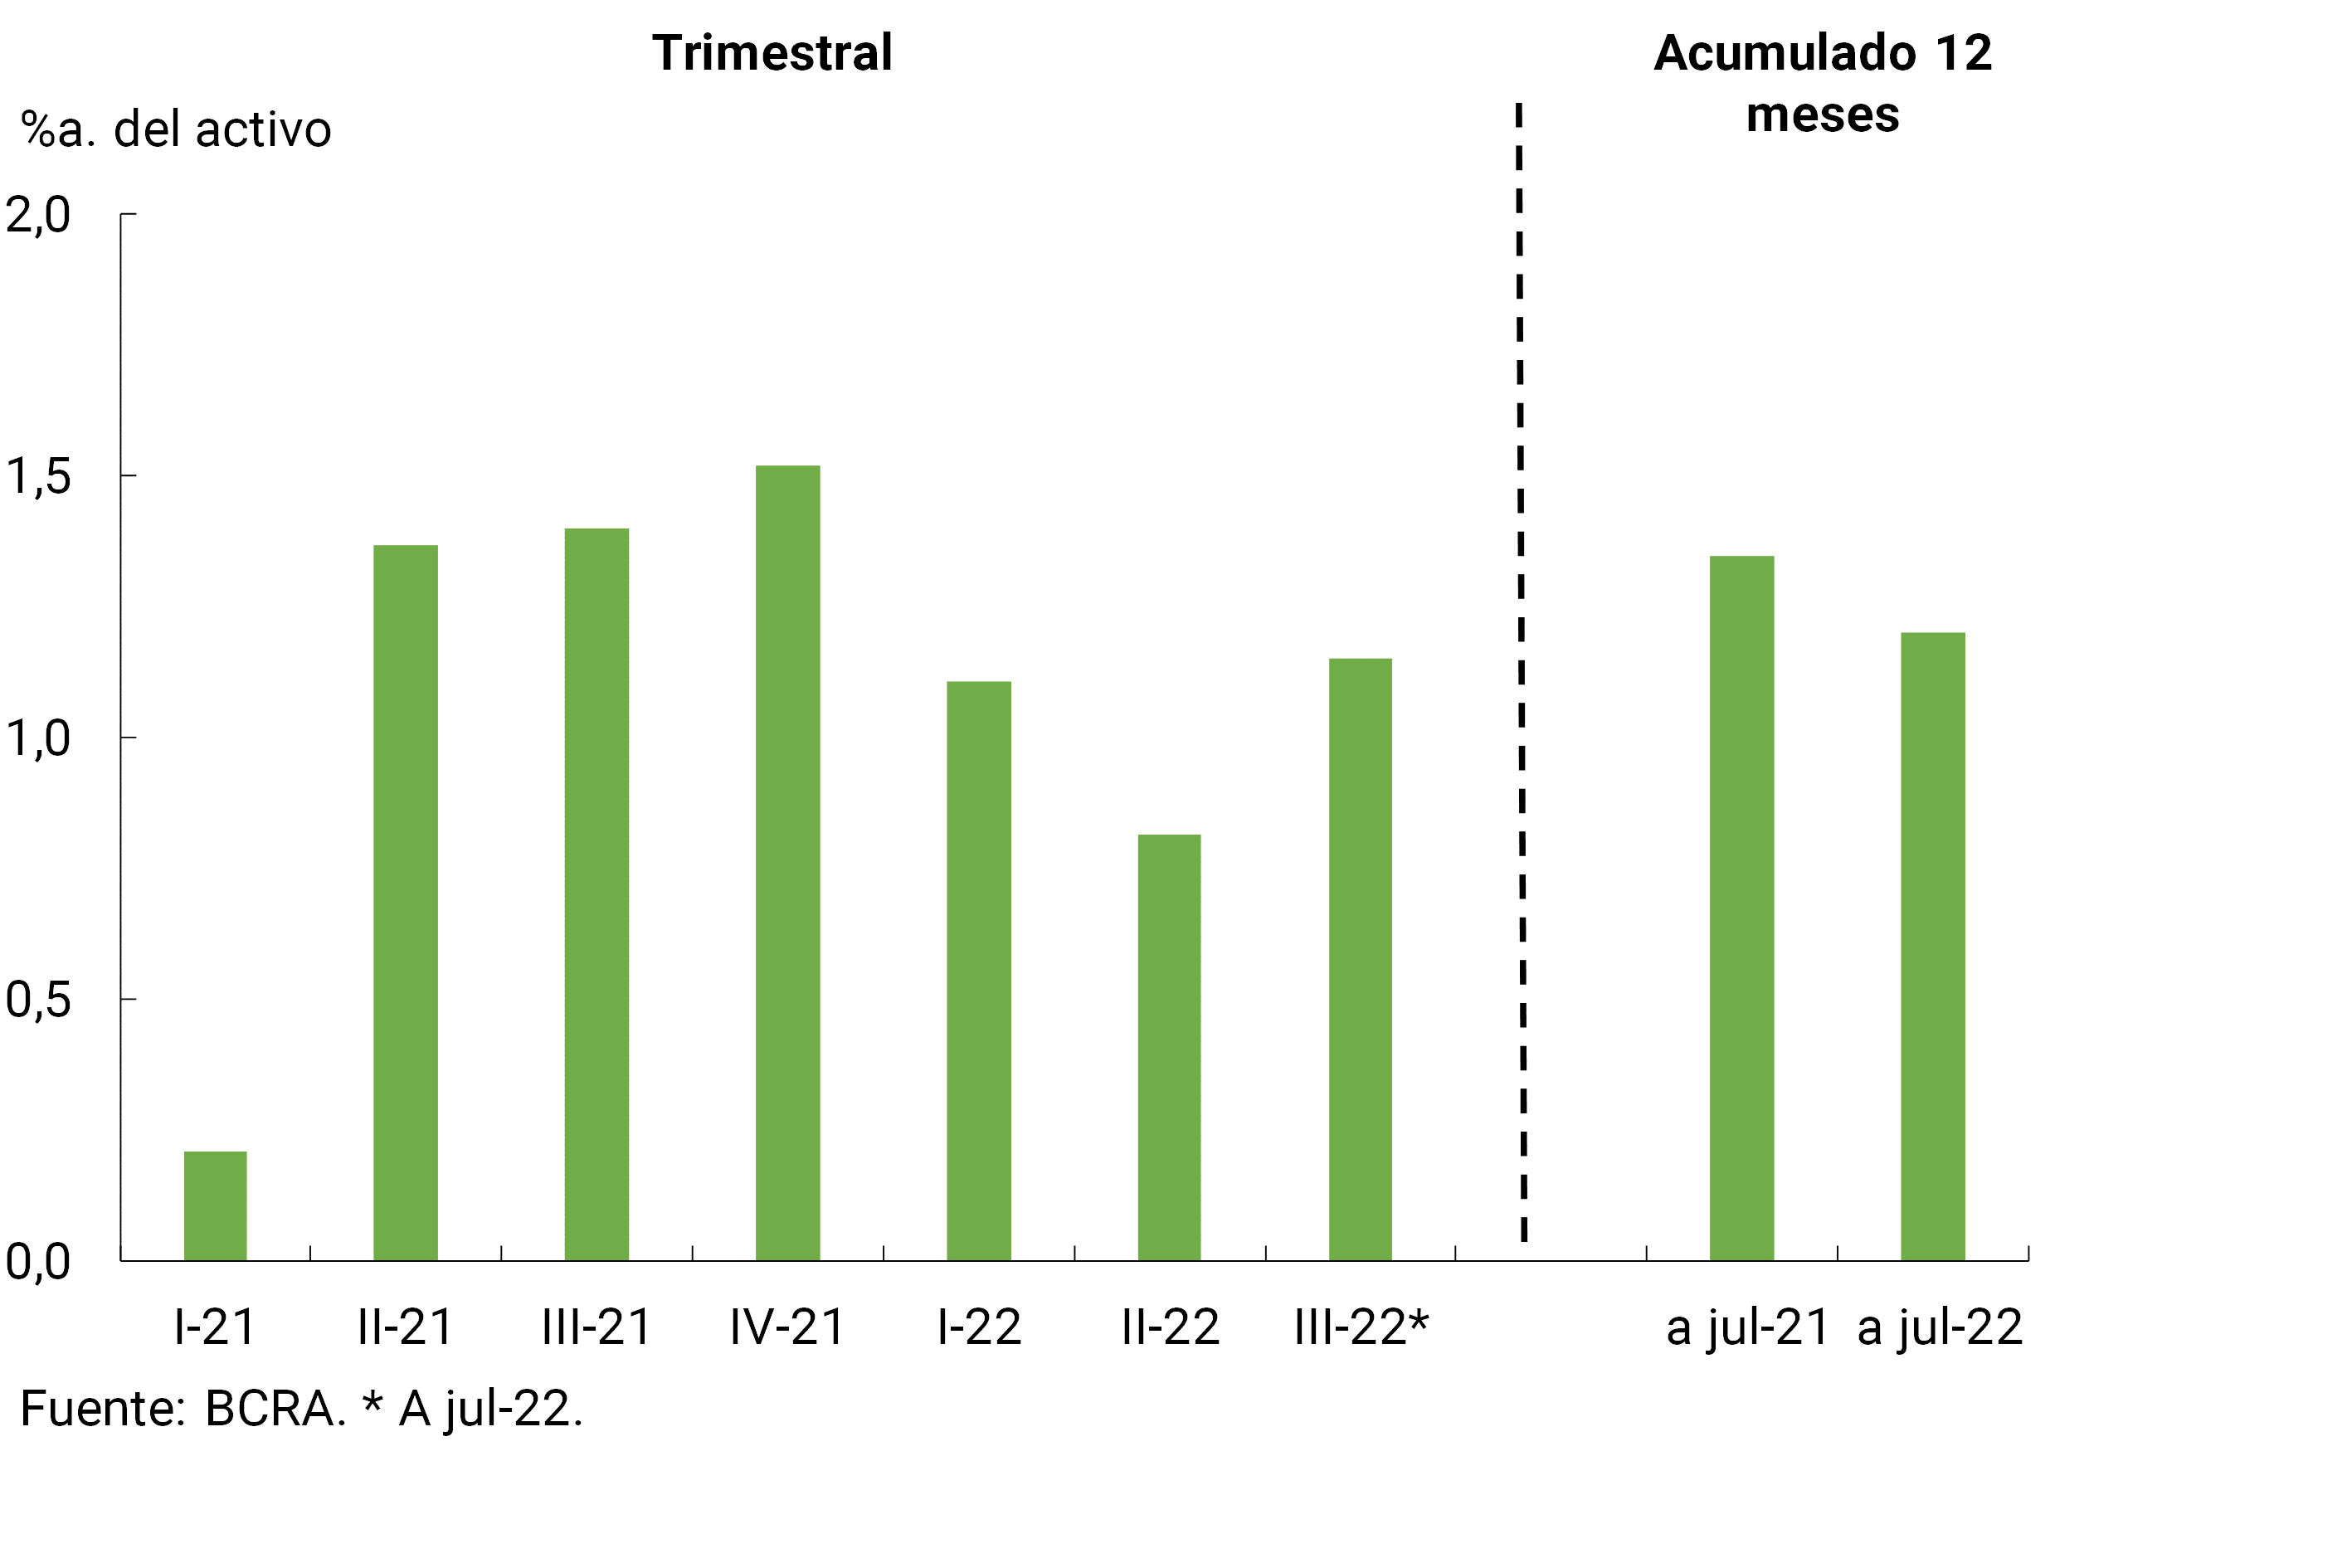
Regarding the sector’s internal capital generation, in the first 7 months of the year, the financial system’s comprehensive total results in homogeneous currency totaled 1% annualized (a.) of assets (ROA) and 5.9% y. of net worth (ROE), slightly above the records observed in the same period of 2021, although lower than those of that part of 2020. Considering the accumulated of the last 12 months to July, the ROA of the financial system stood at 1.2% and ROE at 7.4%, slightly lower in a year-on-year comparison (see Chart 10). This last variation mainly reflected the effects of the increase in the cost of funding deposits and higher monetary losses. On the other hand, higher income from securities and lower charges for uncollectibility tempered the year-on-year dynamics.
Figure 10 | Comprehensive total profit in homogeneous currency of the financial system
In real terms* – Financial system
V. Payment system
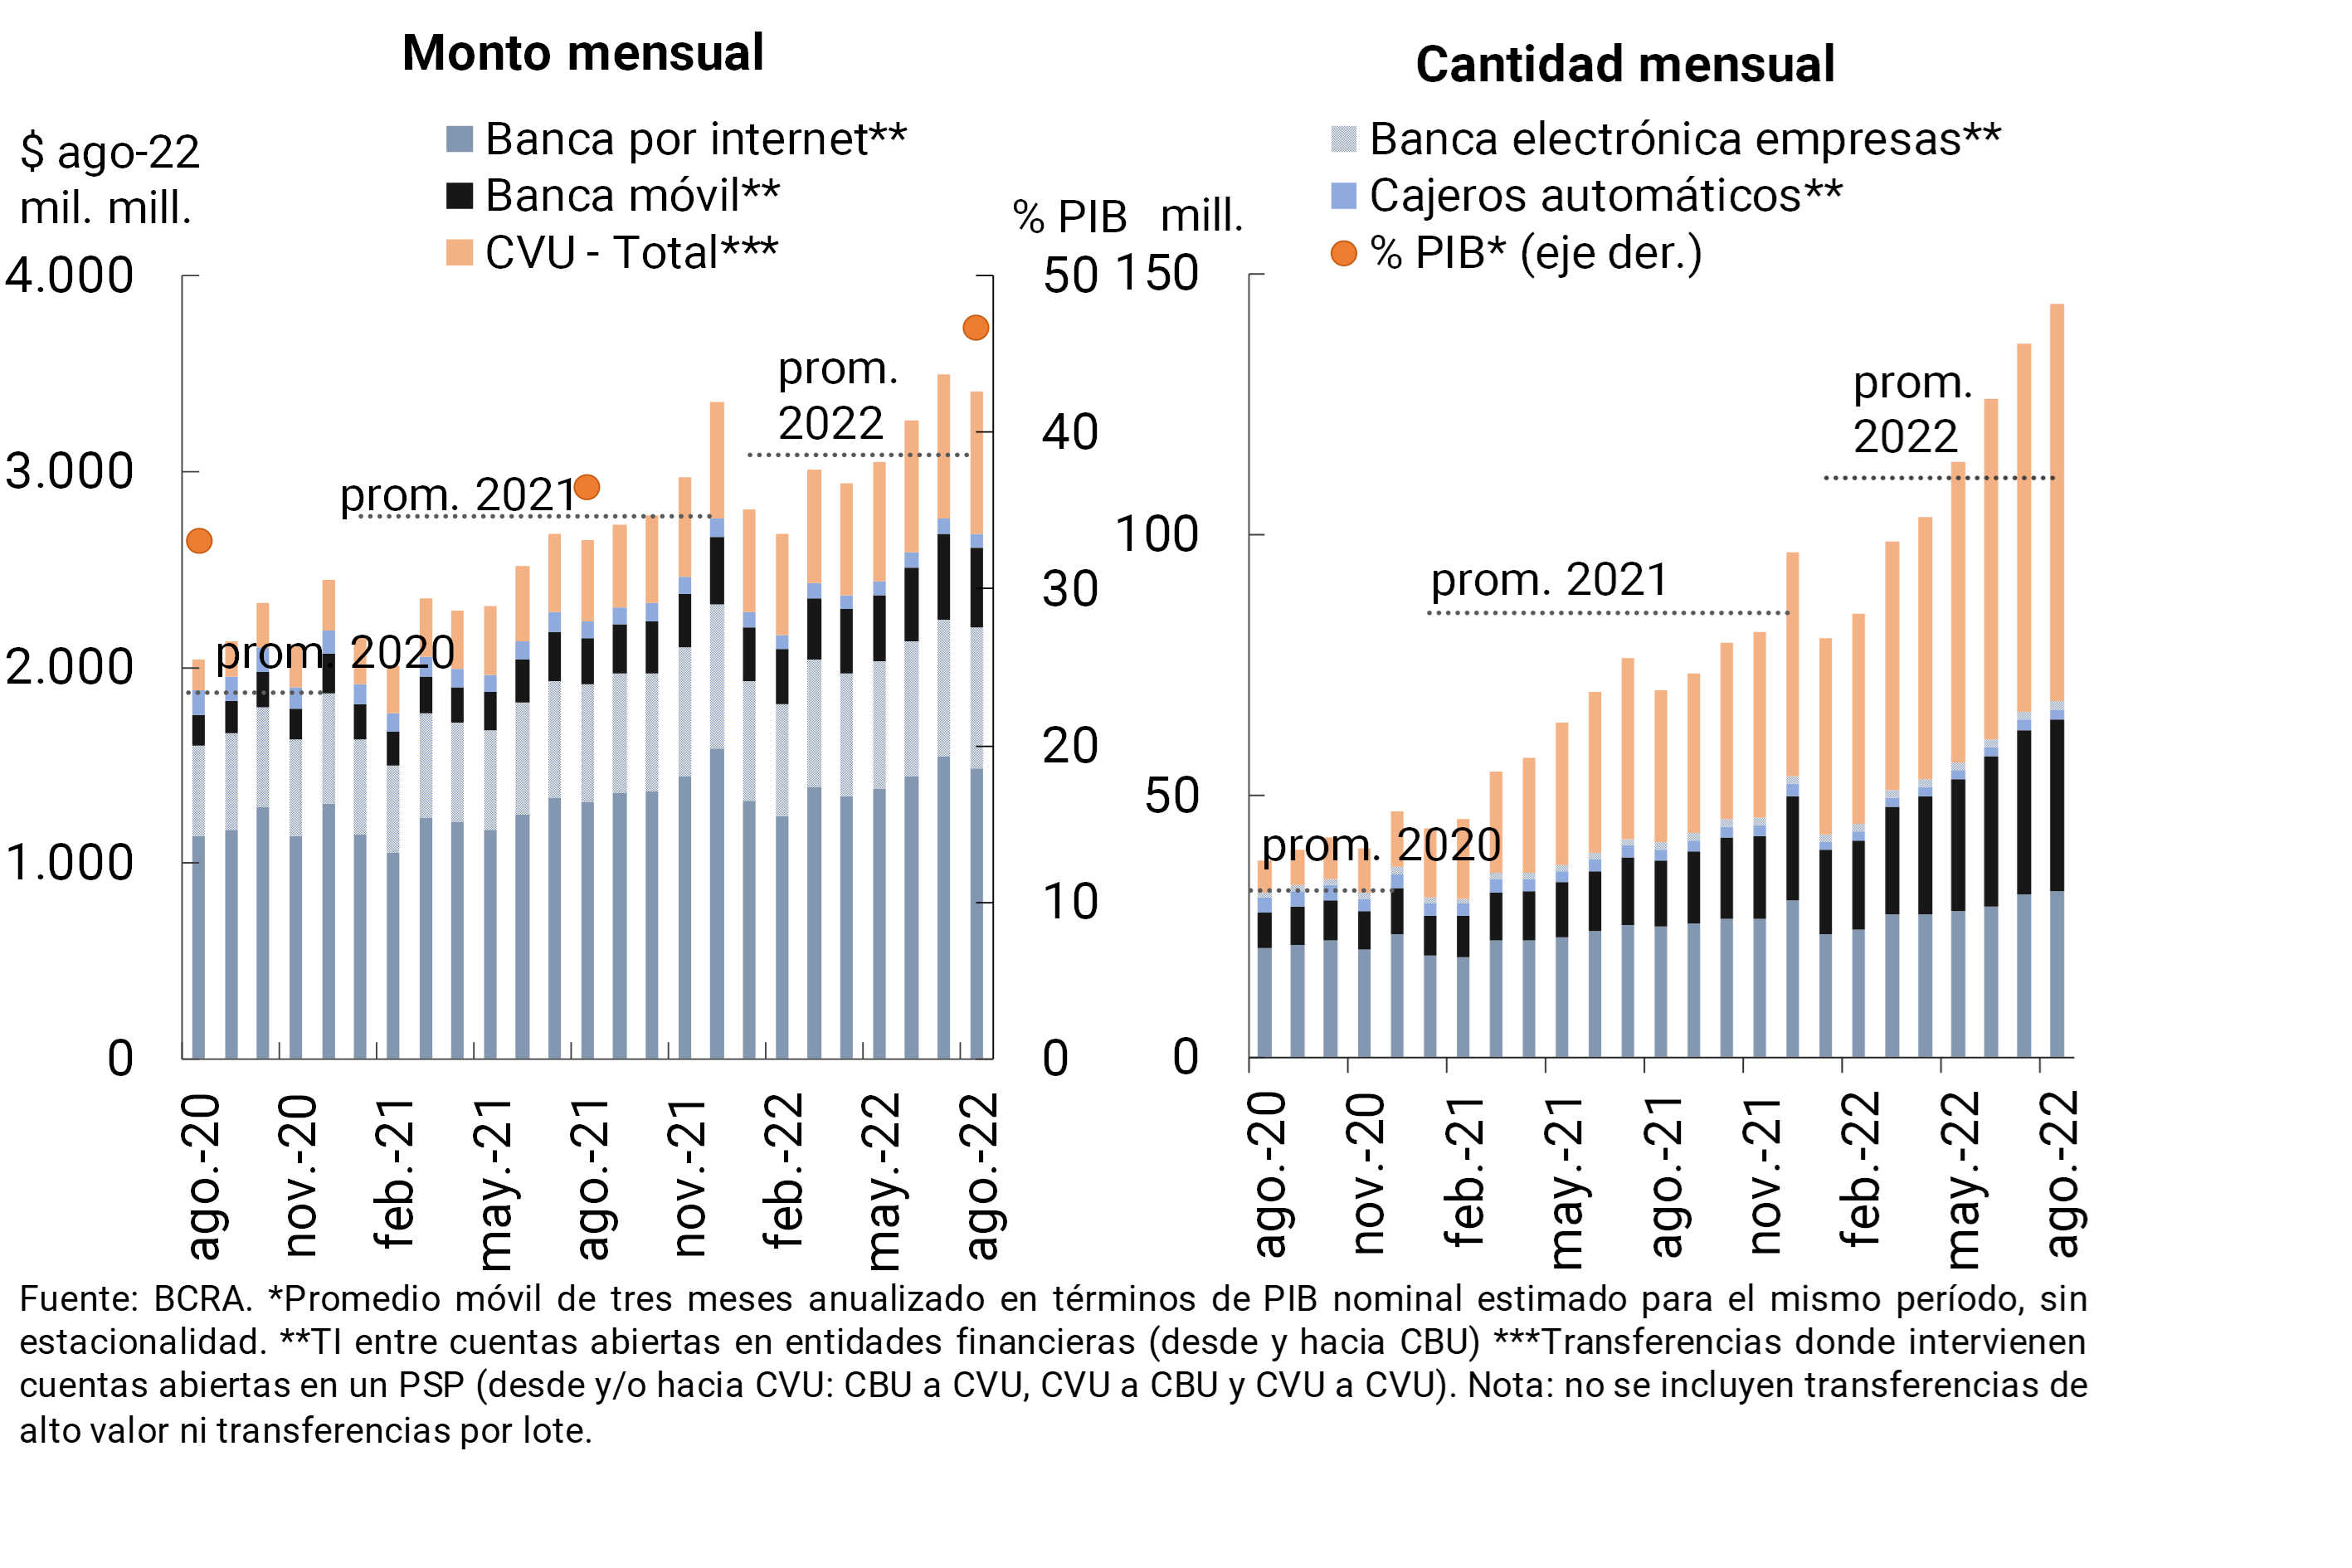
In August, immediate transfers (TI) increased in amounts (+5.7%) and decreased in real amounts (-2.5%). TIs accumulated an increase of 105.2% YoY in quantities and 28.7% YoY in real terms. In this last performance, those in which accounts in payment service providers (PSPs) from and/or to CVU intervened stood out. The latter operations increased their share of total IT: 52.8% in quantities (+11.4 p.p. y.o.y.) and 21.3% in amounts (+5.7 p.p. y.o.y.). It is estimated that the amount of IT operated in the last three months (annualized) represented 46.7% of GDP (+10.2 p.p. compared to the same month of the previous year, see Graph 11). 10
Figure 11 | Instant Transfers (TI)
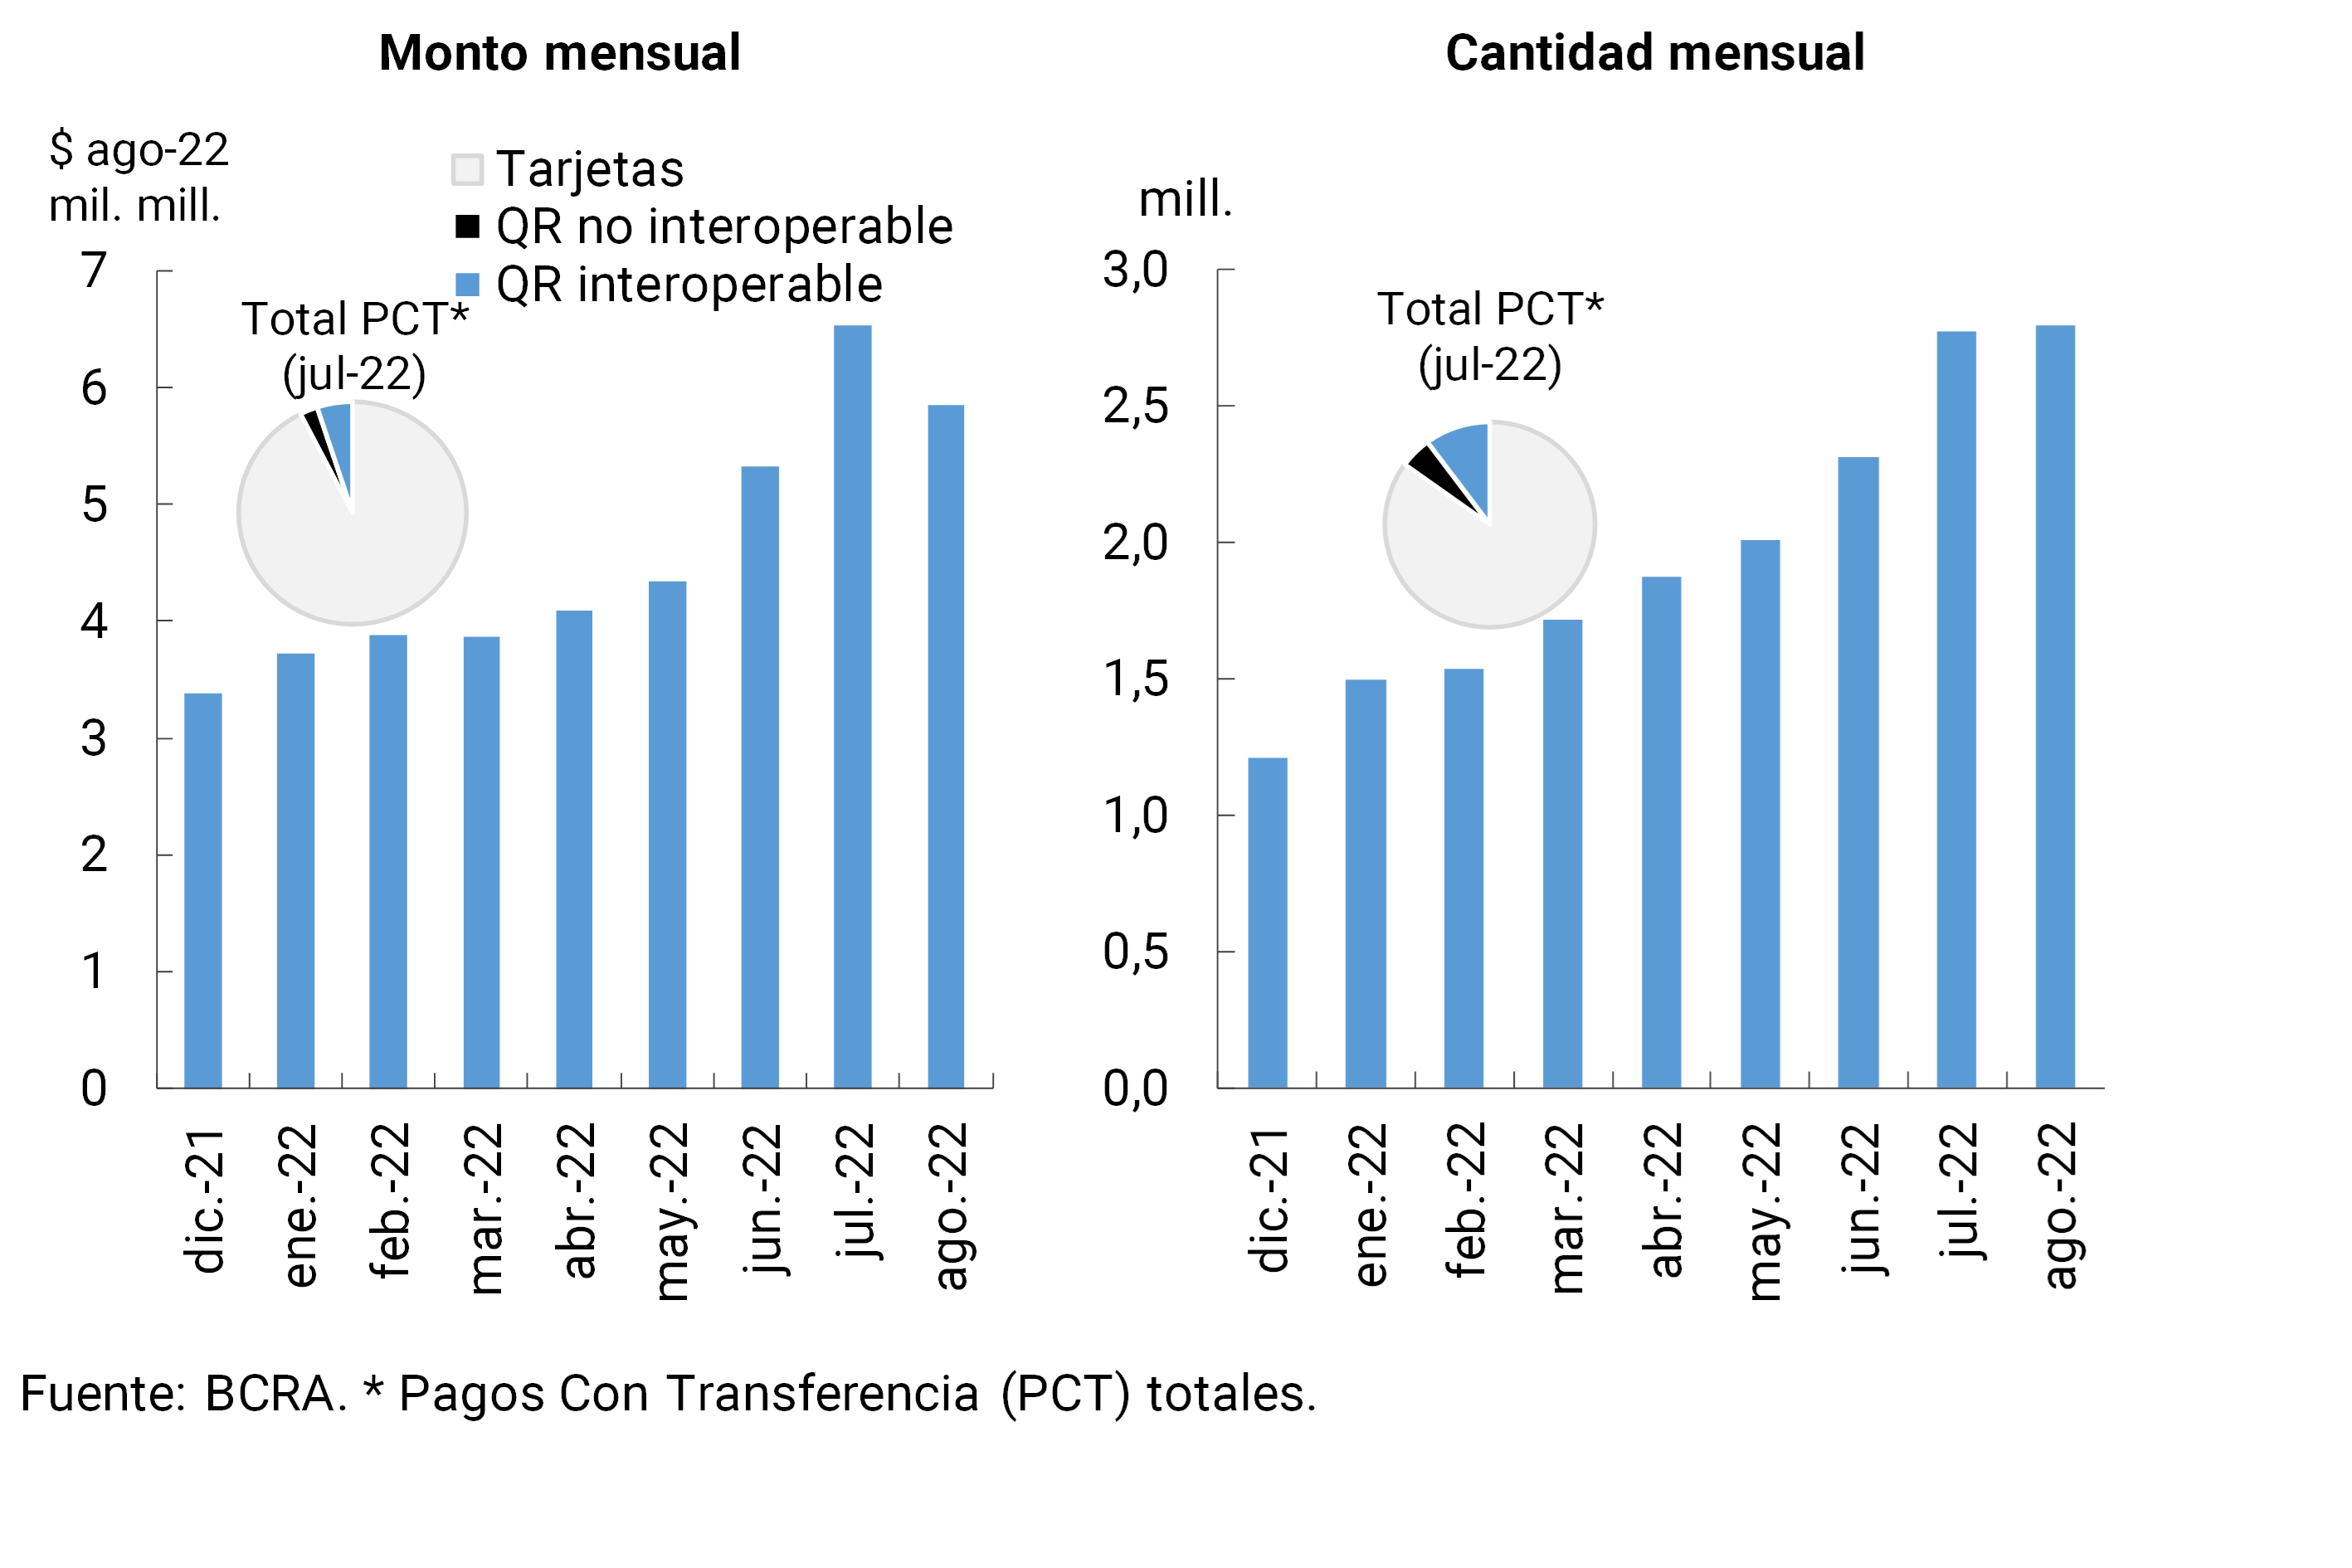
In August, transfer payments (PCT) initiated through interoperable QR codes increased slightly in amounts and decreased in real amounts compared to the previous month (see Chart 12). As of July (latest available), these operations accounted for 10.7% and 5% of the total PCT quantity and amounts, respectively. 11
Figure 12 | Payments by transfer (PCT)
In July, debit card transactions increased compared to the previous month: 5% in amounts and 8.4% in real amounts, partly due to seasonal reasons. This increase was entirely due to face-to-face transactions. In year-on-year terms, debit card transactions grew significantly (+21.7% in amounts and +12.4% in real terms in amounts). This behavior was reflected with greater dynamism in face-to-face operations, being a sign of greater mobility of people in relation to the months of the pandemic. It is estimated that the amount of debit card transactions in the last three months (annualized) represented 8.2% of GDP (0.9 p.p. more than in the same month of the previous year).
During June, credit card operations decreased slightly in amounts and in real amounts, partly due to seasonal reasons. However, in year-on-year terms, credit card transactions increased 11.5% YoY in amounts and 15.9% YoY in real amounts. It is estimated that these operations (last three annualized months) totaled about 8.3% of GDP (0.8 p.p. more than in the same month of the previous year).
In August, check clearing increased compared to the previous month, both in amounts (+9.3%) and in real amounts (+7.3%). Operations through ECHEQs continued to increase their share in the total clearing of documents: in August they represented 30.9% in quantities and 56.1% in amounts. It is estimated that the amount of checks cleared in the last three months (annualized) was equivalent to 26.6% of GDP (+1.8 p.p. y.o.y.). The ratio of rejection of checks due to lack of funds in terms of the total compensated remained at moderate levels (0.60% in amounts and 0.56% in amounts), similar to those of the previous month and slightly higher in a year-on-year comparison.
Back to top
References
1Values expressed in currency of origin.
2Includes principal adjustments and accrued interest.
3Communication “A” “7612” and Press Release of 09/22/22.
4Expressed in currency of origin.
5Pre-cancellable deposits increased by 8.6% in real terms in July, while those without an early cancellation option fell by 0.3% in real terms.
6Communication “A” “7605” and Press Release of 9/15/22.
7Includes forward purchase and sale transactions of foreign currency classified off-balance sheet.
8When netting the forecast accounting balance, this indicator would stand at 29.4% at the aggregate level in July.
9A significant part of this year-on-year reduction was explained by the transfer of debtors who were classified as in an irregular situation to off-balance sheet items (irrecoverable), in accordance with current regulations. These transfers did not imply effects on the income statement because the debts were already fully anticipated.
10During August, the average value of IT between CBU was $39,500 and that of IT where a CVU of $9,500 is involved. The average value of IT operations by channel for Mobile Banking, Internet Banking, Business Electronic Banking and ATMs was $12,400, $54,200, $446,500 and $30,400, respectively.
11During August, the average value of a PCT operation with interoperable QR was $2,200.
Share on


