I. Financial intermediation activity
In February, financial intermediation activity with the private sector fell, reflecting the seasonal effects characteristic of the beginning of the year. Based on the most notable variations in the aggregate balance sheet of the financial institutions as a whole for items in pesos – in homogeneous currency – the balance of credit to the private sector and liquidity in the broad sense decreased in the month. These movements occurred simultaneously with a reduction in deposits and a slight increase in public sector financing in real terms. On the foreign currency side, the credit balance and liquidity fell in February, a variation that was mainly offset by a fall in public sector deposits.
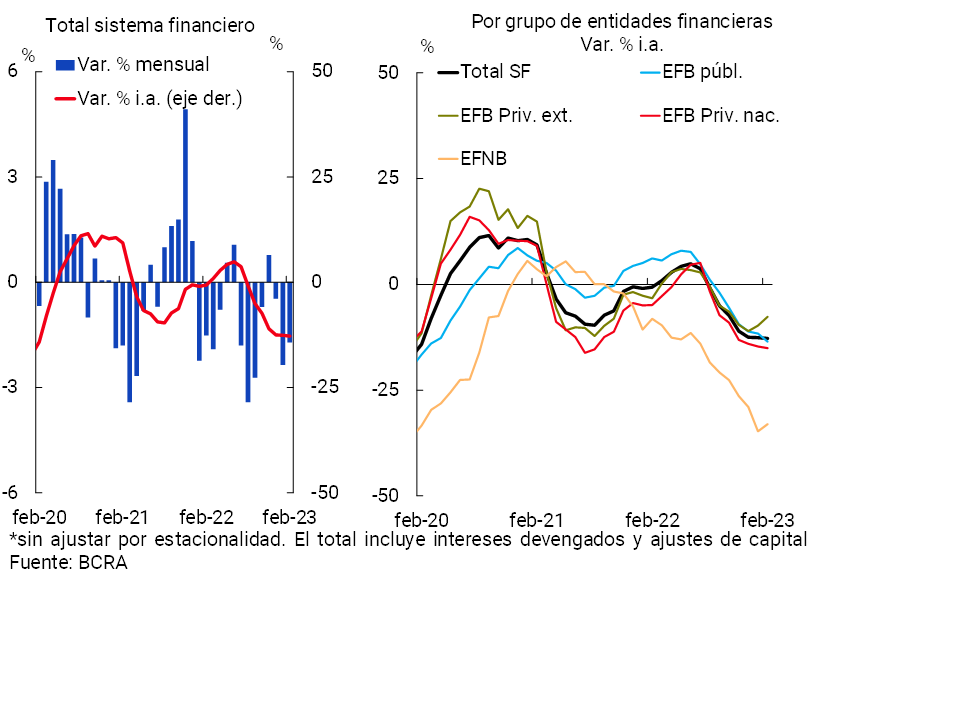
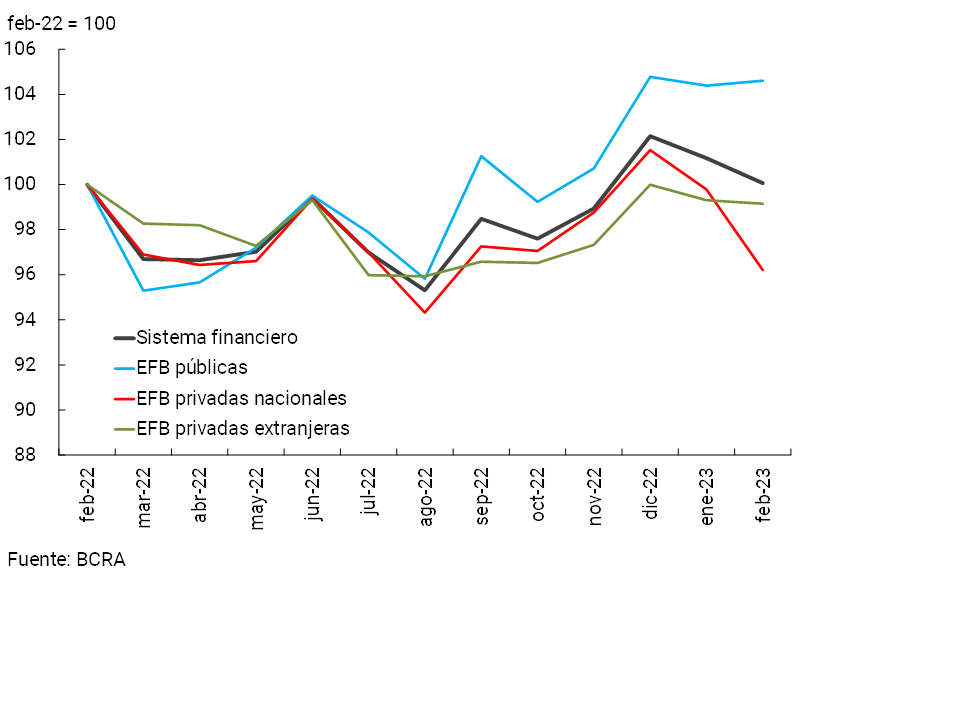
The balance of financing in pesos to the private sector decreased by 1.7% in real terms in February (+4.8% nominal, see Graph 1)1, with falls in public and domestic private banking institutions, as well as slight increases in foreign private financial institutions and EFNBs. Most of the credit lines in pesos were reduced in real terms during the month, with the exception of advances. In year-on-year terms, the balance of loans in pesos fell 12.8% in real terms (+76.5% nominal YoY).
Graph 1 | Credit balance to the private sector in pesos
In real terms* – Financial system
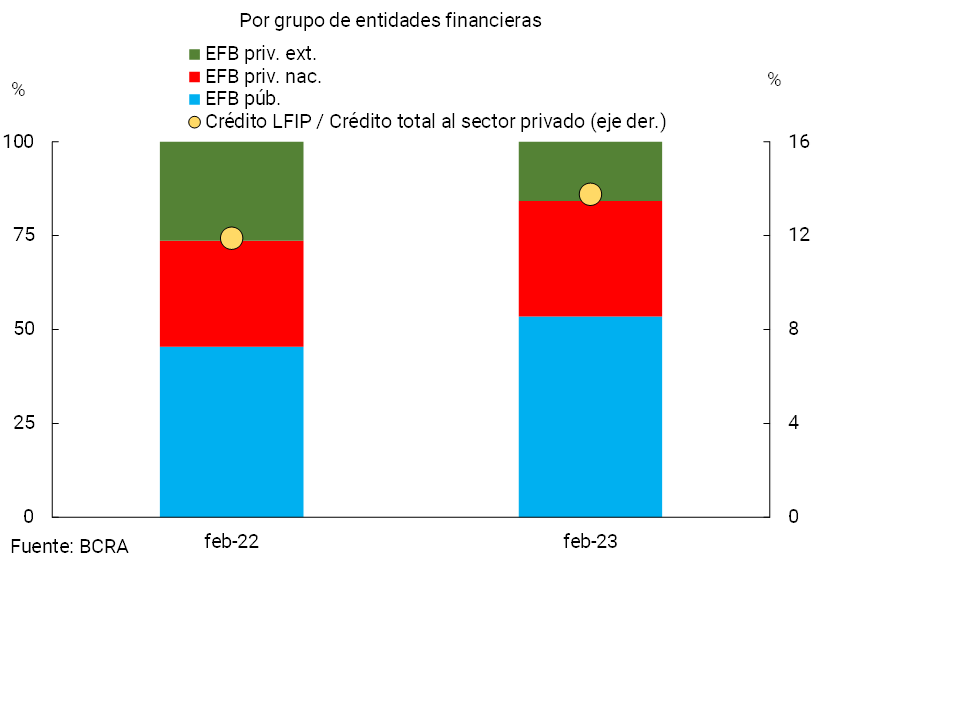
Through the Financing Line for Productive Investment of MSMEs (LFIP), $4.9 billion has been disbursed since its launch (in October 2020) until the end of March 2023, distributed among more than 390,300 companies. In terms of balance, the estimated LFIP credit reached $1.3 trillion as of February, representing 13.8% of total credit to the private sector, increasing 1.9 p.p. compared to the level of a year ago (see Graph 2). More than 53% of the total estimated balance of the LFIP was channeled by public financial institutions.
Graph 2 | Estimated balance of the Financing Line for Productive Investment (LFIP) of MSMEs – As % of total
On the side of the foreign currency segment, in February the balance of credit to the private sector fell 3% compared to the previous month2. Thus, the balance of total financing (in domestic and foreign currency) to the private sector accumulated a fall of 1.9% in real terms in the month (+4.6% nominal) and 13.1% in real terms compared to the level of a year ago (+75.8% nominal YoY).
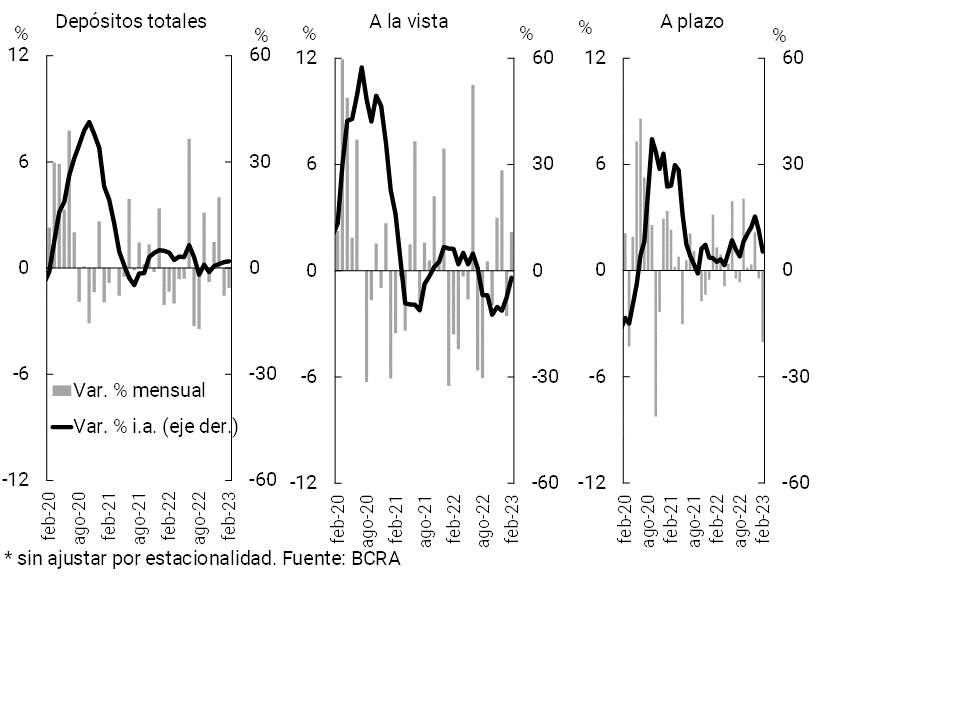
In terms of funding in the financial system, in February the balance of deposits in national currency of the private sector decreased by 1.1% in real terms (+5.4% nominal, see Graph 3). When distinguishing by type of deposits, demand accounts increased by 2.2% in real terms (+8.9% nominal) between the end of the month, while the balance of time deposits decreased by 4% in real terms (+2.3% nominal). The monthly dynamics were partly explained by the migration from time deposits to interest-bearing demand accounts by certain institutional investors3.
Graph 3 | Balance of private sector deposits in pesos
In real terms* – Financial system
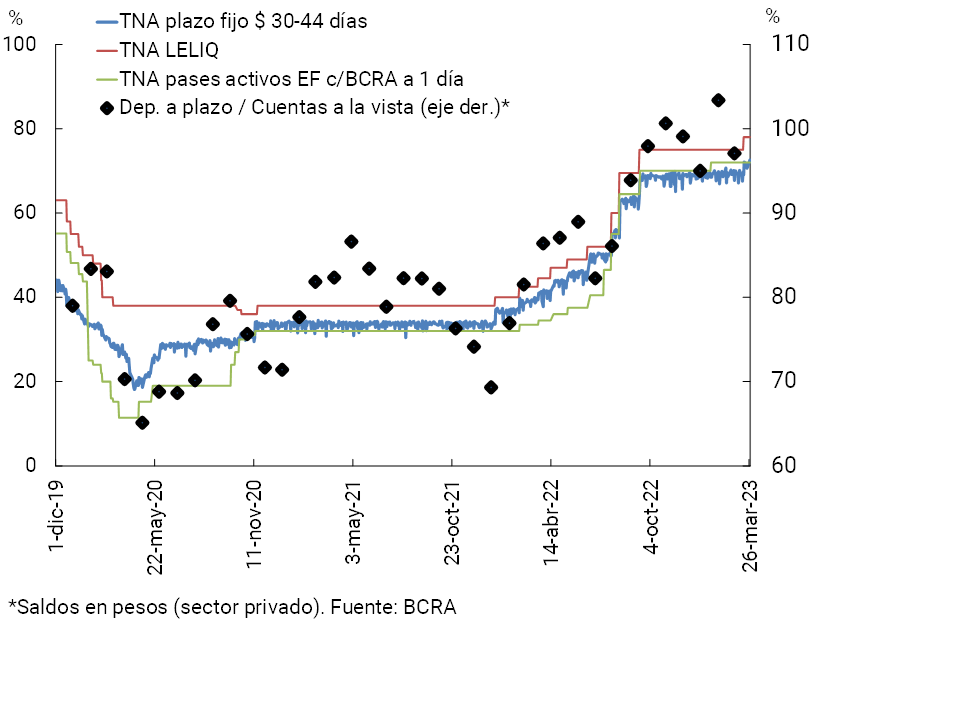
In March, institutional investors’ time deposits resumed growth path4, within the framework of the increase in reference interest rates ordered by the BCRA. In particular, the interest rate on 28-day LELIQs and the minimum remuneration for time deposits of up to $10 million for individuals (69.5% minimum TNA for the rest of the fixed terms) were raised to 78% (TNA) (see Graph 4). The maximum lending rates of the preferential lines for MSMEs and credit cards remained unchanged5.
Figure 4 | Interest Rates and Deposits in Pesos*
In February, the balance of private sector deposits in foreign currency did not show significant changes (+0.2% in source currency). The balance of total private sector deposits (in domestic and foreign currency) decreased by 1.1% in real terms between the peak of the month (+5.5% nominal).
In the last twelve months, the balance of deposits in national currency of the private sector accumulated an increase of 1.9% in real terms, driven by time deposits (+5.4% real y.o.y.). For its part, the real balance of deposits in pesos in the public sector decreased 19.1% y.o.y. Thus, the balance of total deposits (all currencies and sectors) fell by 1.5% YoY in real terms.
II. Evolution and aggregate composition of the balance sheet
The total assets of the financial system fell by 1.1% in real terms (+5.4% nominal) in February, reaching a level similar to that of a year ago (see Chart 5). The monthly decrease in assets was verified in all groups of financial institutions, with the exception of public banks.
Graph 5 | Total assets in real terms
Financial system
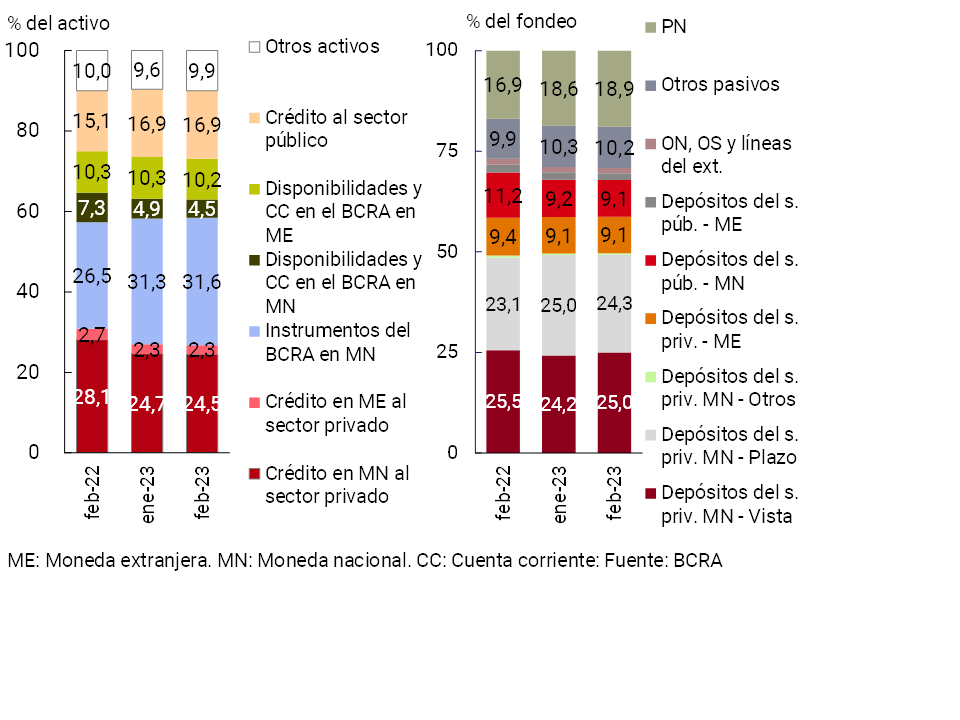
In relation to the composition of the sector’s assets, in the month the balance of availabilities and current accounts at the BCRA and credit in pesos to the private sector reduced in relative importance. In contrast, the weighting of the balance of BCRA instruments (LELIQ) increased (see Chart 6). On the side of the total funding of the group of entities, in February the term placements in pesos of the private sector and the deposits of the public sector in foreign currency reduced their weighting. On the other hand, the private sector’s demand accounts in pesos and net worth increased their weighting in total funding in the period (see Chart 6).
Graph 6 | Composition of assets and total funding
Financial system – Share %
The spread between assets and liabilities of the financial system in foreign currency fell to 30.7% of regulatory capital in February, (+18.9 p.p. y.o.y.)6. The spread between assets and liabilities with capital adjustment by CER (or in UVA) for all entities remained unchanged in magnitude in the period, at 43.5% of the CPR (-27.7 p.p. y.o.y.).
III. Portfolio quality
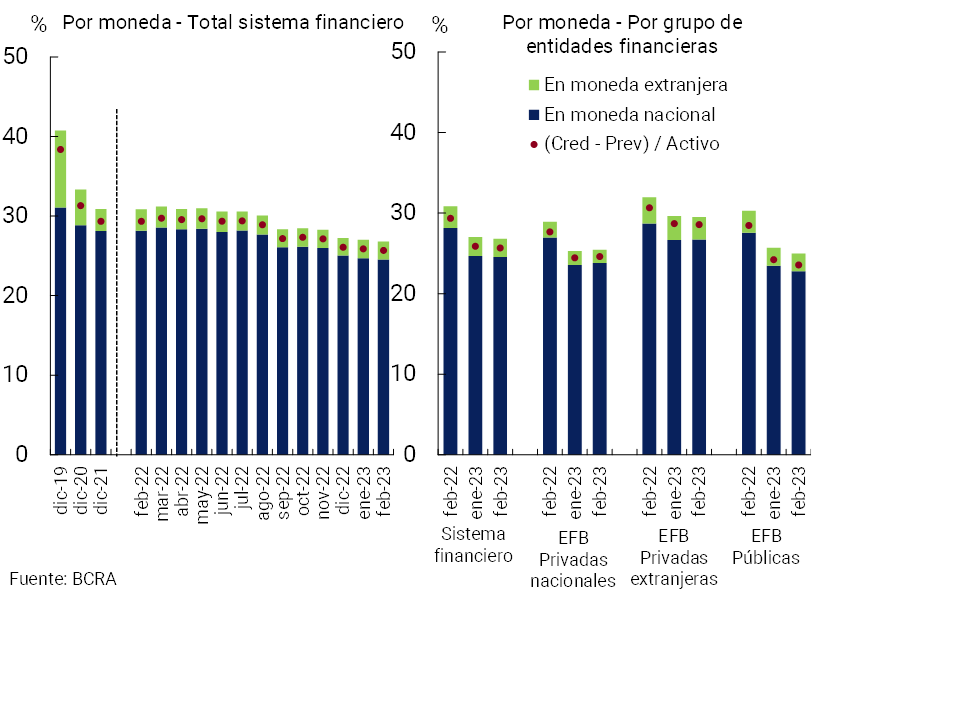
The total gross exposure of all financial institutions to the private sector totaled 26.8% of assets in February, decreasing 4.1 p.p. in year-on-year terms (see Chart 7). Regarding financing in pesos, this indicator stood at 24.5% in the period (-3.6 p.p. y.a.), while the weighting of credit to the private sector in foreign currency represented 2.3% of assets (-0.4 p.p. y.a.). The balance of financing to the private sector net of forecasts for the financial system stood at 25.7% of assets in February, 3.7 p.p. less than the level of a year ago.
Figure 7 | Private Sector Credit Balance / Assets
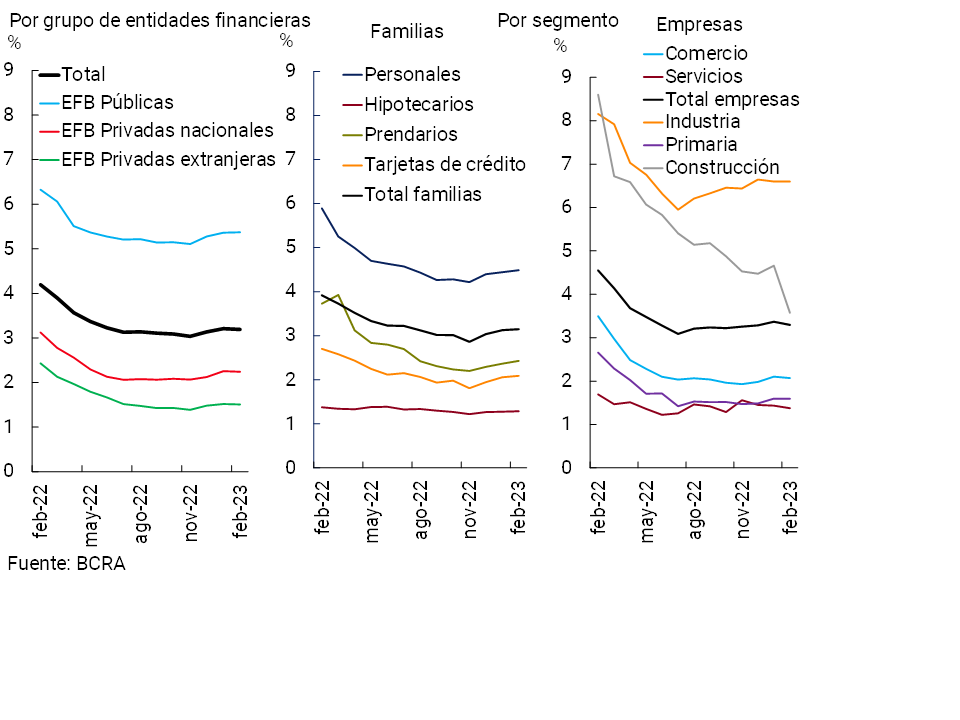
The non-performing loan ratio to the private sector remained at 3.2% in February, falling 1 p.p. in year-on-year terms (See Chart 8). When distinguishing by credit segment, the NPL ratio of loans to households remained unchanged in the month at 3.1% (-0.8 p.p. y.o.y.), while the non-performing loan ratio of loans to companies decreased slightly in the period to 3.3% (-1.3 p.p. y.o.y.).
Figure 8 | Irregularity ratio of credit to the private sector per debtor – Financial system
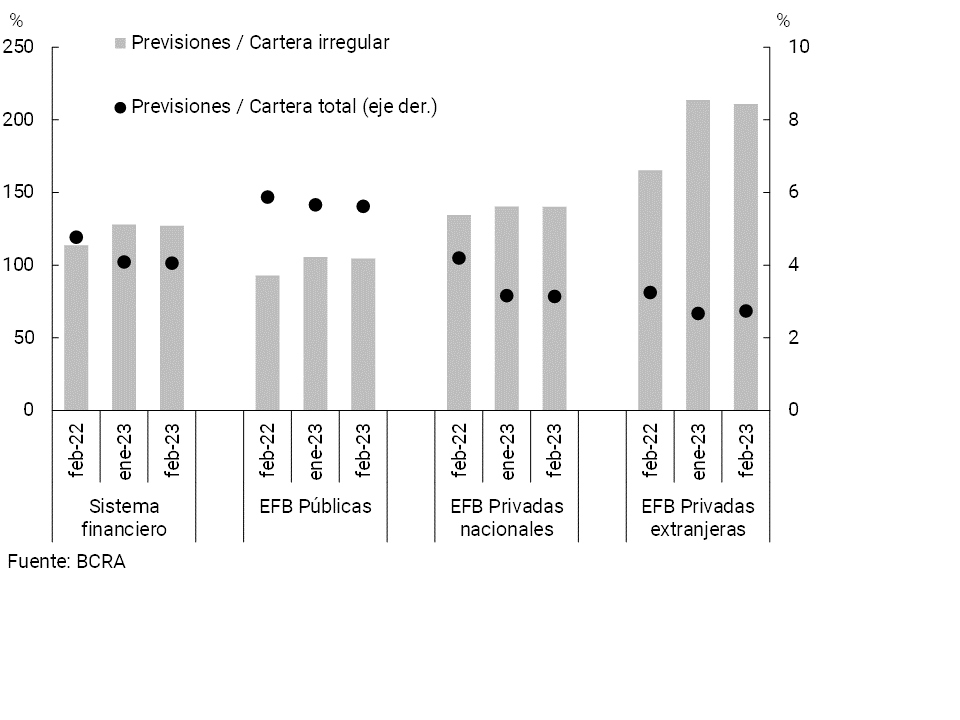
The forecasts were around 4.1% of total credit to the private sector in February (no significant changes in the month and -0.7 p.p. y.o.y.; see Chart 9) and 127.2% in terms of the non-performing portfolio (-0.2 p.p. compared to January and +13.5 p.p. y.o.y.). The balance of forecasts attributable to the portfolio in an irregular situation7 represented 94.9% of said portfolio at the aggregate level (+5.4 p.p. y.o.y.).
Graph 9 | Credit Balance and Forecasts (Private Sector) – By Group of Banking Financial Institutions
IV. Liquidity and solvency
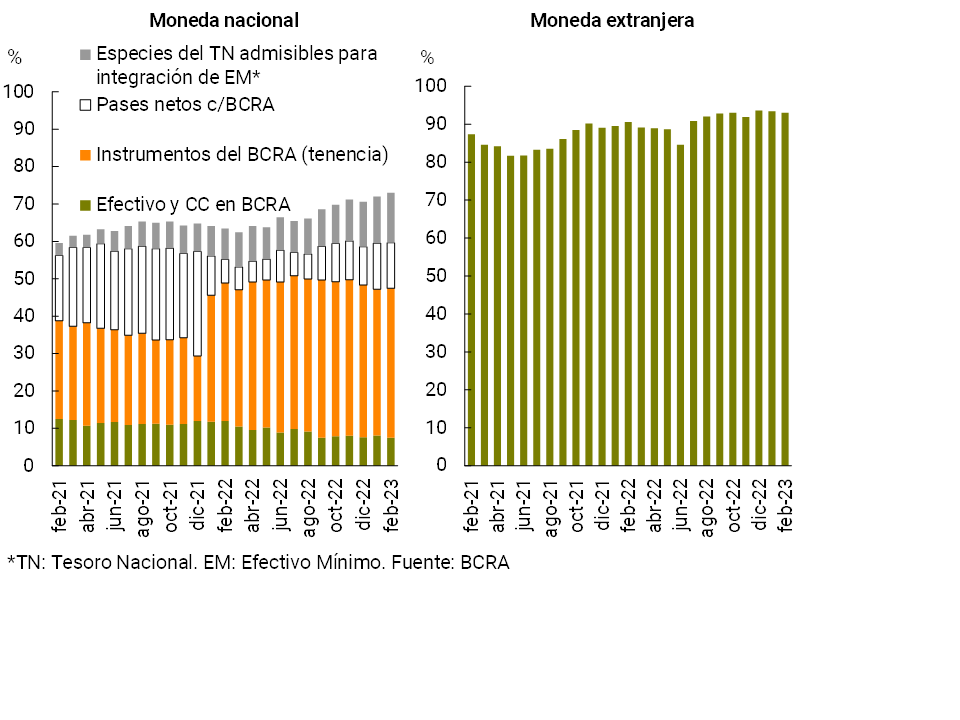
In February, the financialsystem’s broad liquid assets 8 amounted to 76.3% of deposits, increasing 0.7 p.p. compared to January. The indicator for items in pesos stood at 73%, and at 94.5% for foreign currency (see Graph 10). Ample liquidity (in pesos and in foreign currency) increased 8.5 p.p. of total deposits compared to February 2022.
Figure 10 | Liquidity of the financial system
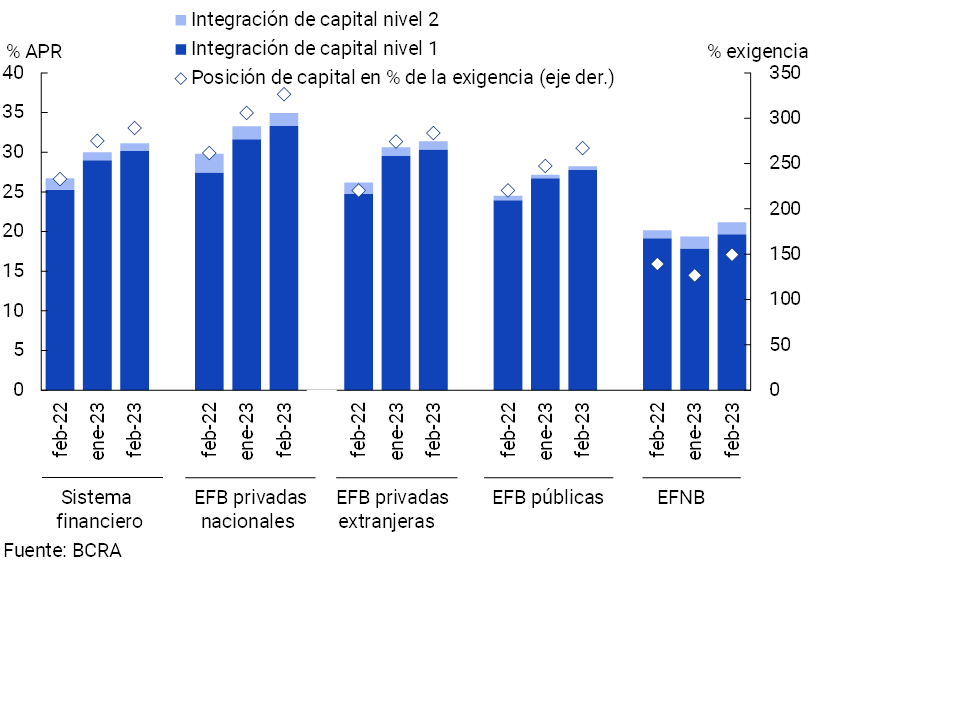
The sector’s solvency indicators increased in the month. The integration of regulatory capital (RPC) of the aggregate of entities stood at 31.1% of risk-weighted assets (RWA), 1.1 p.p. above the January figure (+4.4 p.p. y.o.y., see Chart 11). 96.8% of the PRC was accounted for by Tier 1 capital, with a greater capacity to absorb potential losses. The capital position – regulatory capital net of the minimum regulatory requirement – totaled 289.3% of the requirement at the systemic level (14.2 p.p. more than in January and +56.4 p.p. y.o.y.) and 46.4% of the balance of credit to the private sector net of forecasts, well above the average of the last 10 years (18.2%).
Figure 11 | Integration of regulatory capital
By financial institution group
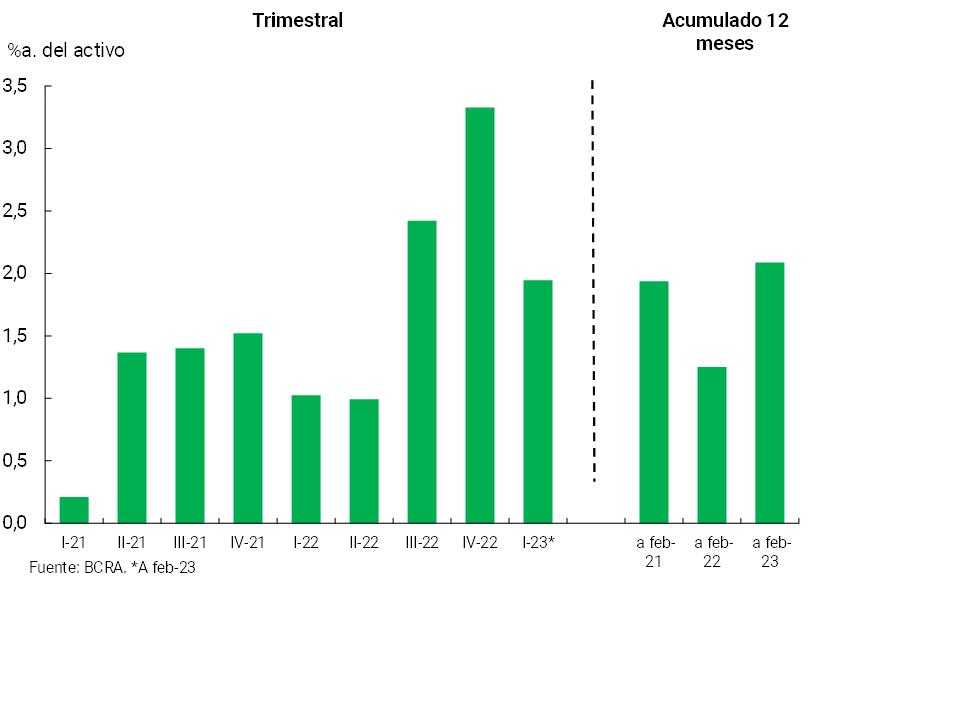
With regard to the internal generation of capital in the sector, the financial system continues to show positive profitability. The total comprehensive profit in homogeneous currency of the financial system for the accumulated in the last 12 months to February was equivalent to 2.1% of assets (ROA) and 11.9% of equity (ROE). These indicators increased in a year-on-year comparison (see Chart 12) mainly due to a higher financial margin, despite the increase in losses due to exposure to currency items and tax burdens.
Figure 12 | Comprehensive total profit in homogeneous currency of the financial system
V. Payment system
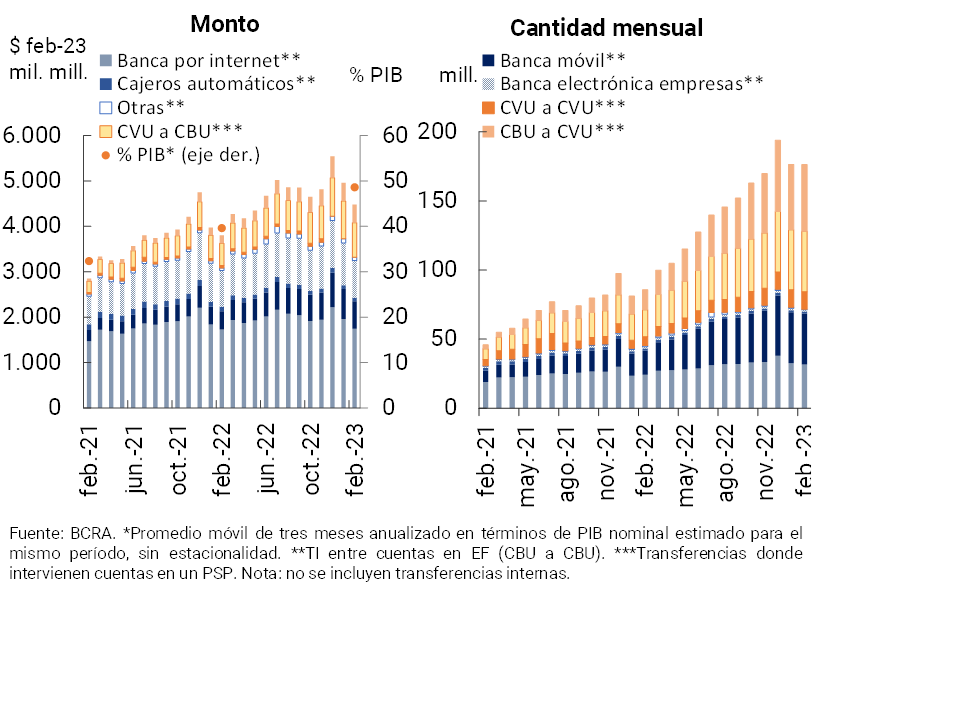
Within the framework of seasonal factors, in February immediate transfers (TI) remained without significant changes in quantities and decreased in real amounts compared to the previous month. However, in a year-on-year comparison, IT continued to expand. IT between CBUs grew 60.2% YoY in quantities and 7.2% YoY in real amounts, highlighting the dynamism of operations carried out through Mobile Banking. IT involving accounts in payment service providers (PSPs) (from and/or to CVUs) increased by 160.1% YoY in quantities and 73.7% YoY in real amounts, reflecting greater dynamism in operations ranging from financial institutions (FIs) to PSPs (CBU to CVUs). It is estimated that the amount of IT operated in the last three months (annualized) represented 48.6% of GDP (+9 p.p. compared to the same month of the previous year, see Chart 13)9.
Figure 13 |Instant Transfers (TI)
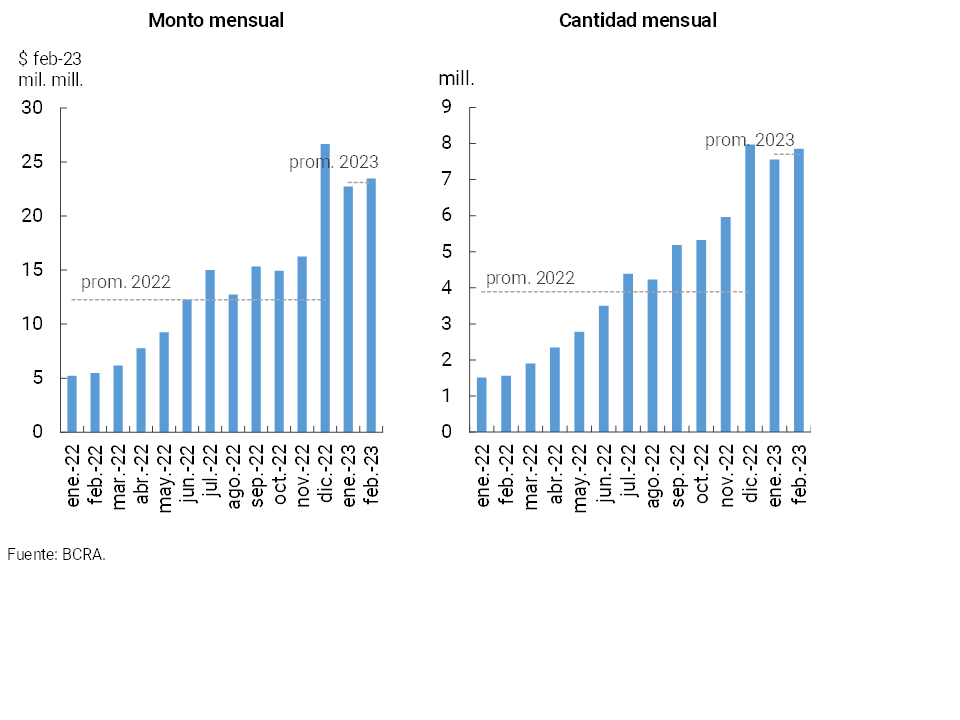
In February, transfer payments (PCT) initiated through interoperable QR codes increased compared to the previous month (4% and 3.3% in amounts and in real amounts, respectively). Since the beginning of this payment method, a positive reception was observed by users, with rapid adoption and a growing level of acceptance, reaching a fivefold increase in the operation in a year-on-year comparison (see Graph 14)10.
Figure 14 | Payments with transfer (PCT) through interoperable QR codes
Debit card and credit card transactions decreased in January (latest available information) compared to the previous month in the context of seasonal factors, although there is a year-on-year increase in both the number of transactions (16.5% in debit cards and 8.5% in credit cards) and in real amounts (3.3% and 1% respectively)11.
In February, online check clearing was reduced due to the seasonality of the period. In a year-on-year comparison, cleared checks grew (7.9% in amounts and 6.2% in real amounts), a dynamic explained by ECHEQs (+51.4% and 28.9% respectively). These instruments continued to gain share in the total clearing of checks. It is estimated that the amount of checks cleared in the last three months (annualized) was equivalent to 24.4% of GDP (+1.2 p.p. compared to the same month of the previous year)12.
In February, the ratio of rejection of checks due to lack of funds in terms of the total compensated did not present changes in magnitude in amounts (value of 0.76%) and rose slightly in terms of amounts traded (value of 0.54%). The current levels of this indicator were slightly above those recorded in the same period of the previous year (+0.16 p.p. and +0.1 p.p. in terms of quantity and actual amounts, respectively).
Back to top
References
1 Includes principal adjustments and accrued interest.
2 Expressed in currency of origin.
3 The balance of term investments fell by 22.5% in real terms in the month (-17.4% nominal), while fixed-term loans (without an adjustment clause) fell by 2.6% in real terms (+3.8% nominal) and those denominated in UVA decreased by 12.8% in real terms (-7% nominal).
4 For more detail see “Monthly Monetary Report”.
5 See “Press Release” of 03/16/23 and Communication “A” “7726”.
6 Includes forward purchase and sale transactions of foreign currency classified off-balance sheet. Liabilities include deposits in the agricultural sector that have variable remuneration depending on the evolution of the exchange rate.
7 Total net forecasts of the minimum regulatory forecasts for debtors in situations 1 and 2, according to the criteria of the minimum regulatory forecasts for risk of uncollectibility.
8It considers availabilities, BCRA instruments in national and foreign currency, and all public securities authorized to be used as minimum cash integration.
9 In February, transfers between EFs (CBU to CBU) averaged $45,500 and operations involving a PSP averaged $11,800.
10 During February, the average value of PCTs with interoperable QR was $3,000.
11 During January, the average value of debit card transactions was $4,380 and credit card was $8,420.
12 In February, the average value of physical and electronic check clearing operations was $317,000 and $880,000, respectively.
Share on


