I. Financial intermediation activity
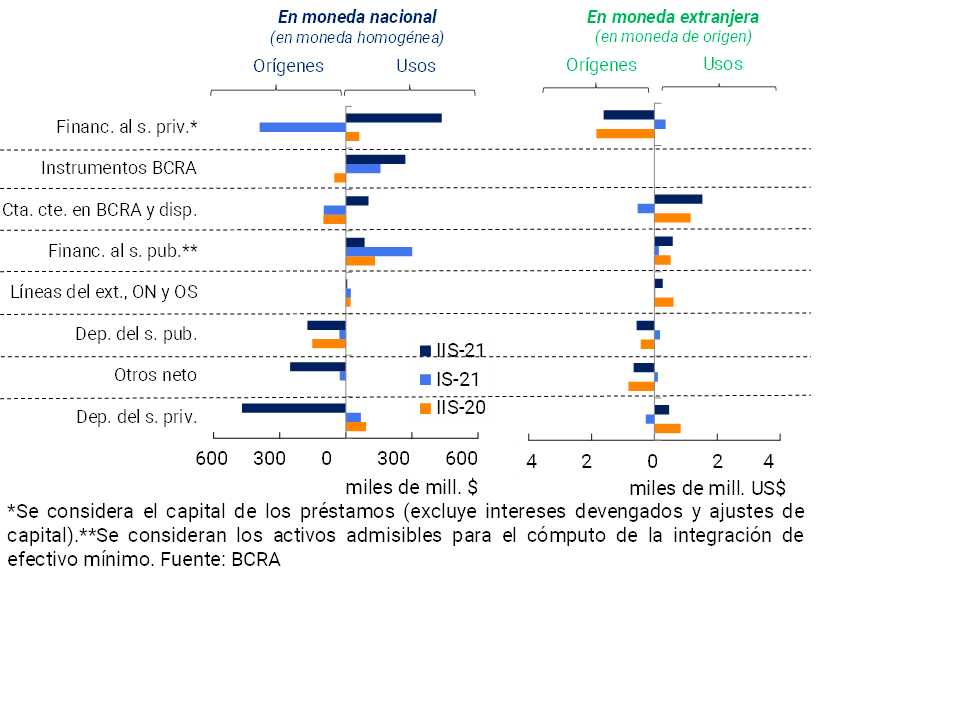
In the last month of 2021, financial intermediation in national currency with the private sector continued to increase. In particular, taking into account the differences in the balance sheet of all financial institutions – in homogeneous currency – for the segment in pesos1, in December the increase in the balance of deposits in the private and public sector stood out. On the other hand, there was a monthly increase in liquidity in the broad sense and in financing channeled to both the private and public sectors. Meanwhile, among the items in foreign currency2 – expressed in currency of origin – in the month there was a growth in deposits and a decrease in the balance of financing to the private sector, offset by an increase in liquidity.
Taking into account the differences in the aggregate balance sheet commented for December, in the second half of the year there was an outstanding performance of credit in pesos to the private sector and of deposits arranged by families and companies. In the second half of 2021, unlike the previous two semesters, these concepts explained the most important variations in real terms between the sector’s aggregate assets and liabilities (see Chart 1).
Graph 1 | Main components of the balance sheet of the financial system – Half-yearly changes
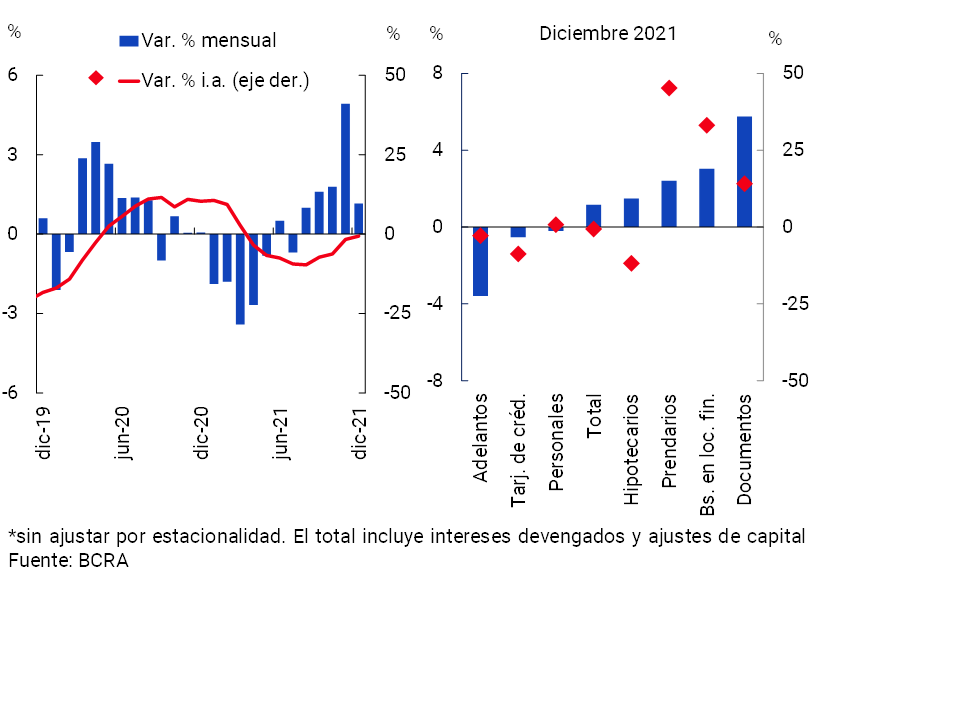
With regard to monthly performance, the balance of credit to the private sector in pesos increased by 1.2% in real terms in December (+5% nominal) (see Graph 2)3 with some heterogeneity among credit assistance and among groups of financial institutions. Thus, the balance of loans in pesos to the private sector measured in real terms increased for the fifth consecutive month, accumulating an expansion of 28.1% annualized real between the end of July and the end of December, being the best relative performance in the last 4 years. Given the recovery experienced in recent months, as of December the balance of financing to the private sector in pesos measured in homogeneous currency stood at a level similar to that recorded a year ago (-0.6% real or +49.9% nominal).
Graph 2 | Credit balance to the private sector in pesos
In real terms* – Financial system
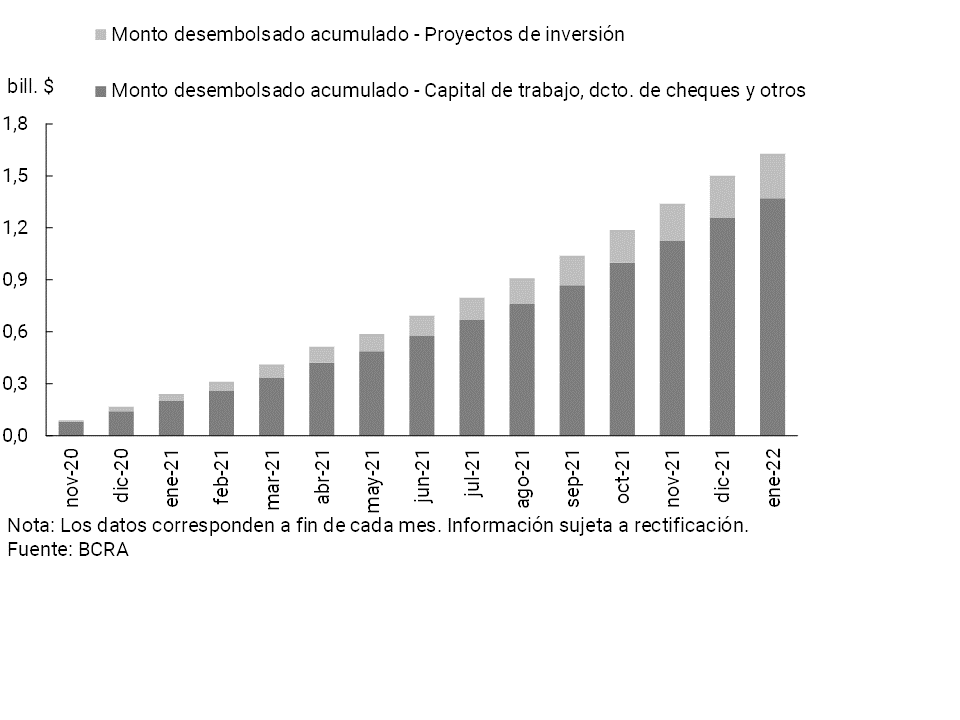
Among the measures implemented by the BCRA to stimulate credit to the private sector, throughout 2021 the Financing Line for Productive Investment of MSMEs4 (LFIP) stood out. The loans channeled through this tool totaled disbursements of an amount equivalent to $1.6 trillion since its launch (mid-October 2020) and until the beginning of 2022 (see Graph 3), benefiting more than 215,500 companies. Almost 16% of the total disbursed was allocated to investment projects.
Graph 3 | Financing Line for Productive Investment (LFIP) of MSMEs
In addition, through the line of financing at subsidized interest rates for companies enrolled in the “Emergency Assistance Program for Work and Production” (ATP)5 , at the end of January 2022, nearly $14,300 million had been granted through more than 20,900 loans.
Within the framework of the lines of credit under favorable conditions for single-tax and self-employed workers, through the “Zero Rate Credit 2021” Program, nearly 333,900 loans were disbursed for more than $38,900 million until January 20226. Thus, when adding the 2020 Zero-Rate Credits, more than $104,500 million have been disbursed.
The balance of credit to the private sector in foreign currency decreased by 2.1% in December, mainly due to the performance of domestic private financial institutions. Thus, the balance of total loans (in domestic and foreign currency) to the private sector increased by 0.7% in real terms compared to the previous month (4.5% nominal), accumulating a year-on-year reduction of 5.5% in real terms.
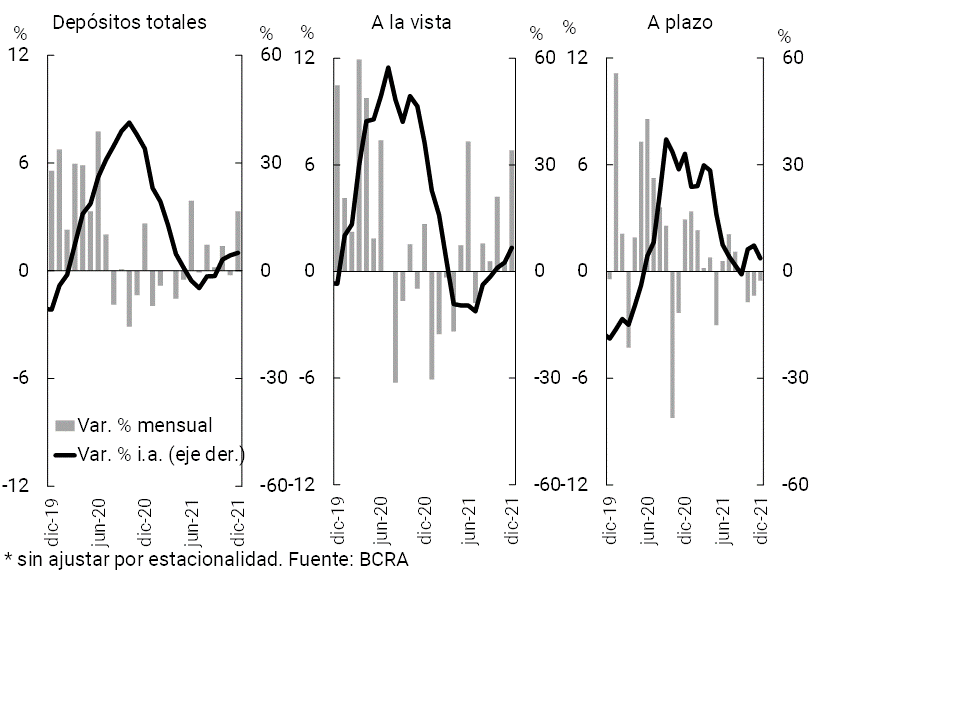
On the funding side of the financial institutions as a whole, in December the balance of deposits in pesos in the private sector increased by 3.3% in real terms between the peak of the month (+7.2% nominal) (see Graph 4), with increases in all groups of banking financial institutions. In the context of seasonal factors typical of the end of the year, demand accounts grew 6.8% in the month (+10.9% nominal), while time deposits fell 0.5% in real terms (+3.3% nominal)7.
Figure 4 | Balance of private sector deposits in pesos
In real terms* – Financial system
Partly associated with tax factors, in the last month of 2021 the balance of deposits in foreign currency of the private sector grew 2.5% – in currency of origin – a variation explained by the performance of demand accounts. In this context, total private sector deposits (including domestic and foreign currency) increased by 2.8% in real terms in the month (+6.8 nominal).
In year-on-year terms, the balance of deposits in national currency of the private sector increased by 5% in real terms (+58.3% nominal). Demand accounts grew by 6.7% YoY in real terms (+60.9% YoY in nominal terms), while time deposits increased by 3.7% YoY in real terms (+56.4% YoY in nominal terms). Public sector deposits in pesos accumulated an increase of 11.6% y.o.y. in real terms (+68.3% y.o.y. nominal). Thus, the real balance of total deposits in pesos of the private and public sectors grew by 6.5% in the last twelve months (+60.7% nominal YoY). Finally, considering all deposits (sum of all currencies and sectors), the real balance accumulated a growth of 1.7% YoY in real terms (+53.3% YoY nominal).
II. Aggregate evolution and composition of the balance sheet
In December, the total assets of the financial system increased by 2.9% in real terms compared to the previous month, with a generalized increase among the different groups of financial institutions. After the expansion recorded in 20208, the sector’s total assets grew more moderately in 2021 (2.1% in real terms, see Chart 5). Public financial institutions verified the highest relative growth in the year.
Graph 5 | Total assets of the financial system
Change % year-on-year – In real terms
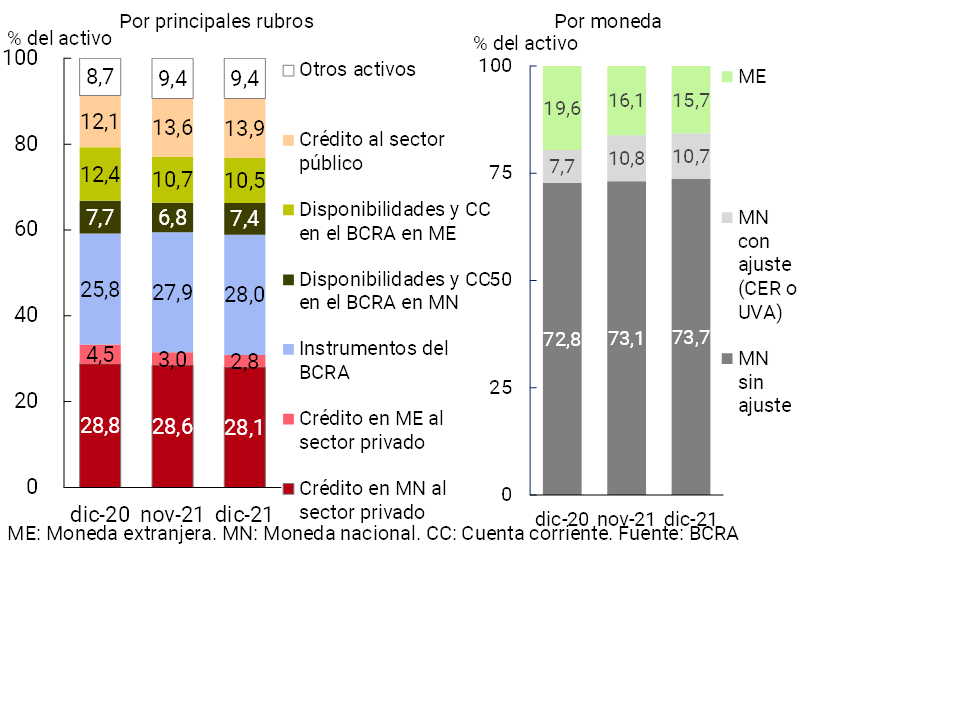
With respect to the composition of the total assets of the financial system, in December the weighting of the balance of current accounts in the BCRA in pesos and of credit to the public sector increased slightly (see Chart 6), while the relative weight of the rest of the items decreased. Considering the assets by currency, in the period those arranged in pesos without an adjustment clause for CER and/or UVA slightly increased their participation in the total.
Graph 6 | Composition of total assets
Financial system – Share %
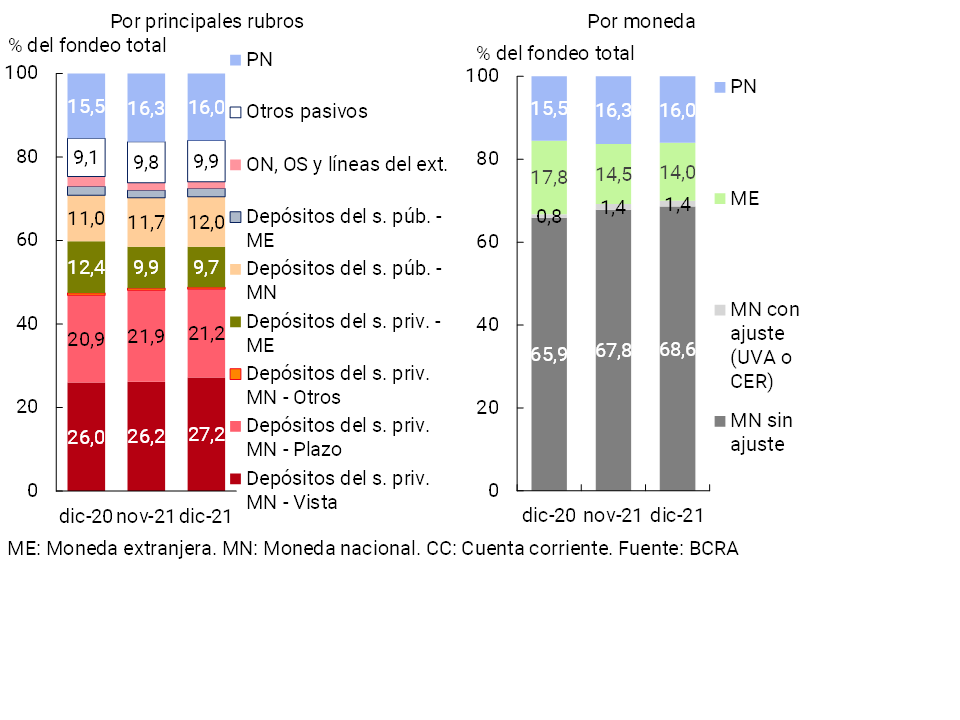
Regarding the structure of funding, in December the main movements at the systemic level were associated with the increase in the weighting of demand accounts in pesos in the private sector and the fall in the relative weight of time deposits in pesos in this sector (see Chart 7). When distinguishing by currency, the relative importance of items in pesos without an adjustment clause for CER and/or UVA increased during the month.
Figure 7 | Total system funding composition
In % of total funding (liabilities + equity)
The financial system closed 2021 with limited currency equity mismatches, within the framework of current macroprudential regulations. In December, the spread between assets and liabilities in foreign currency9 of the set of financial institutions stood at 12.7% of regulatory capital (see Chart 8), slightly below last month’s value (-0.1 p.p.) and the level of a year ago (-0.3 p.p. y.o.y.). Meanwhile, the positive spread between assets and liabilities with capital adjustment by CER and/or UVA totaled 66.7% of regulatory capital at the end of 2021, 1 p.p. more than last month and 17 p.p. above the December 2020 record.
Figure 8 | EM Assets – EM Liabilities + EM Forward Position — Financial System
III. Portfolio quality
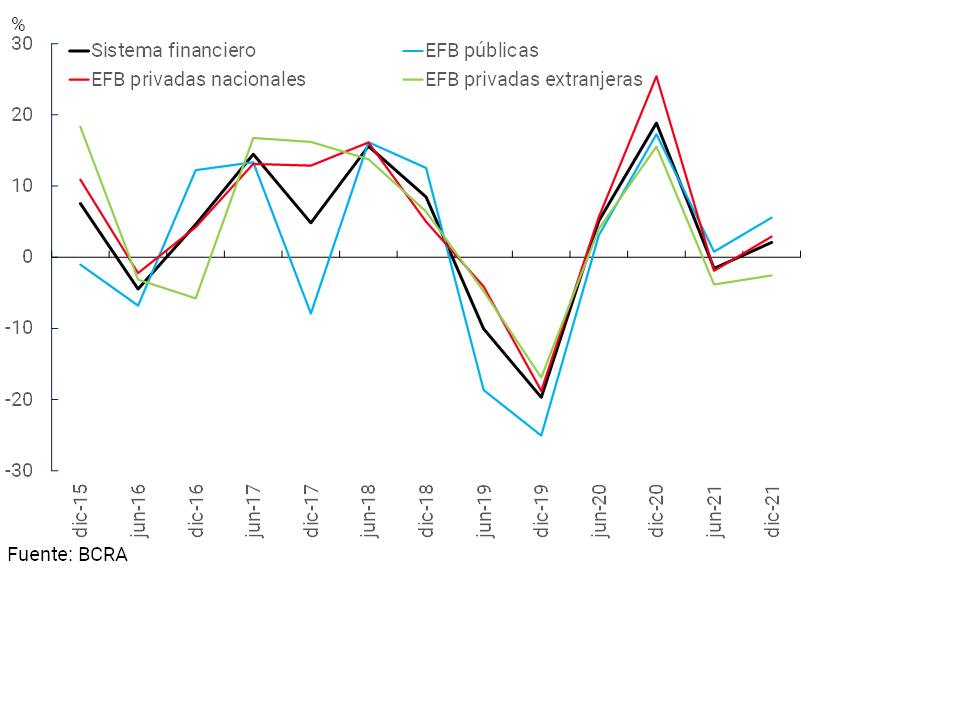
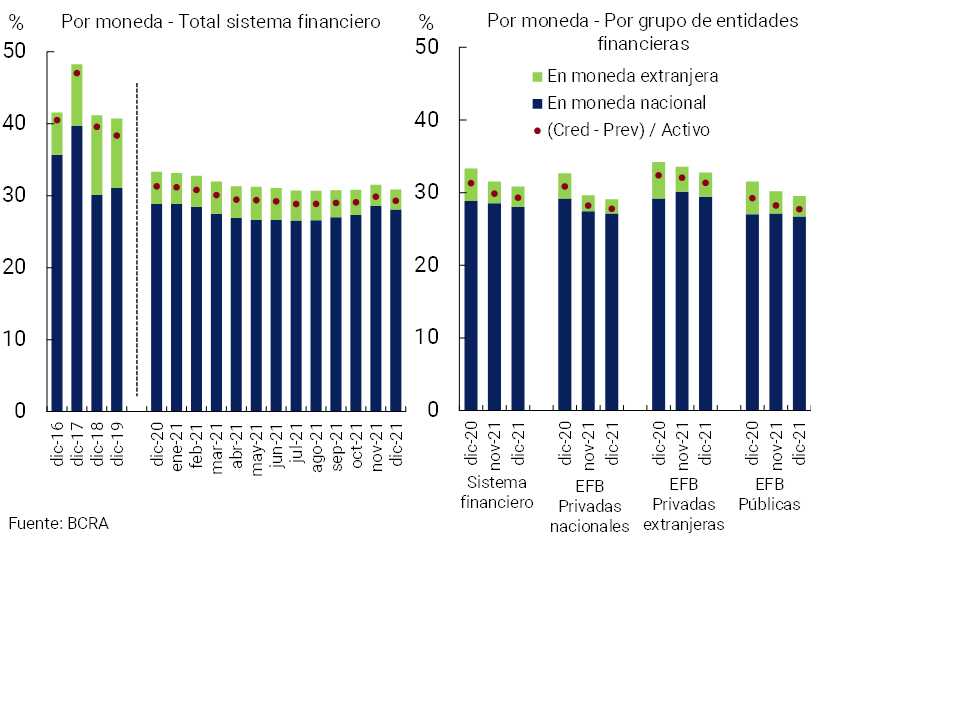
The gross exposure of the financial system to the private sector (including domestic and foreign currency) stood at 30.9% of total assets at the end of year10, 0.7 p.p. less than the value recorded in the previous month (-2.5 p.p. y.o.y.). The monthly decrease was widespread among the different groups of financial institutions, except in the EFNB. When considering only financing in pesos, this indicator stood at 28.1%, 0.5 p.p. below November (-0.8 p.p. y.o.y.) (see Graph 9). The weighting of credit to the private sector in foreign currency in total assets decreased monthly by 0.2 p.p. to a total of 2.8% in the period (-1.7 p.p. y.o.y.).
Graph 9 | Credit balance to the Private Sector / Assets
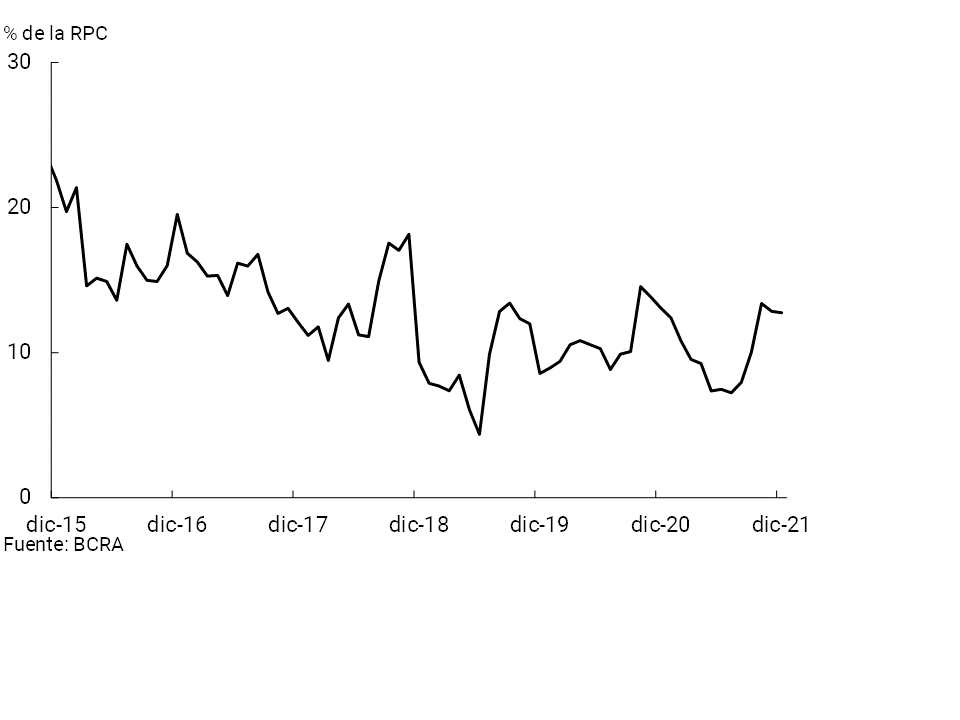
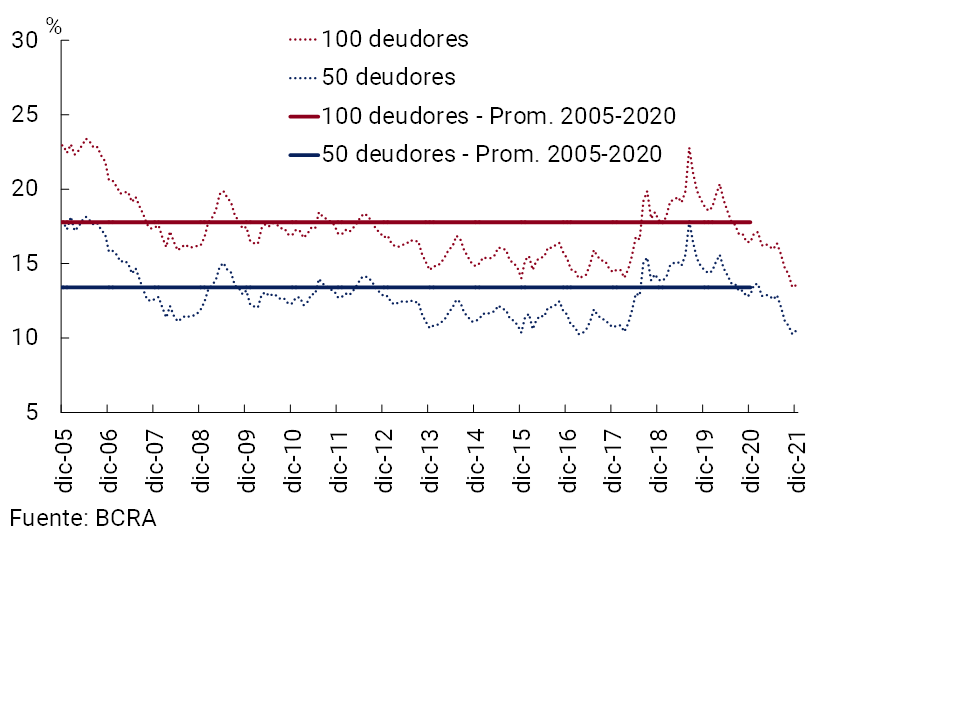
In December, the share of the main debtors (legal and human) in the total portfolio of loans to the private sector of the financial system continued to be relatively low11. In particular, the top 100 and 50 private sector debtors12 accounted for 13.6% and 10.5% of the total balance of loans in the aggregate of the financial system (see Chart 10), 2.9 p.p. and 2.4 p.p. below the same month of the previous year, respectively. Thus, the current levels for these indicators were among the lowest in the last 16 years.
Figure 10 | Share of the total balance of credit to the private sector of the main debtors
The non-performing ratio of credit to the private sector for the aggregate financial system fell for the fifth consecutive month to 4.3% at the end of the year, 0.2 p.p. below the November figure (+0.5 p.p. y.o.y.)13, performance reflected in all groups of banking financial institutions (see Graph 11). Thus, the system’s irregularity indicator is below the levels observed prior to the start of the COVID-19 pandemic: 6.1% average in the first two months of 2020 and 4.5% average in 2019. The dynamics of credit quality occur in the context of the targeting of the financial relief measures opportunely implemented during the course of the pandemic14.
Figure 11 | Irregularity of credit to the private sector
Irregular financing / Total financing (%)
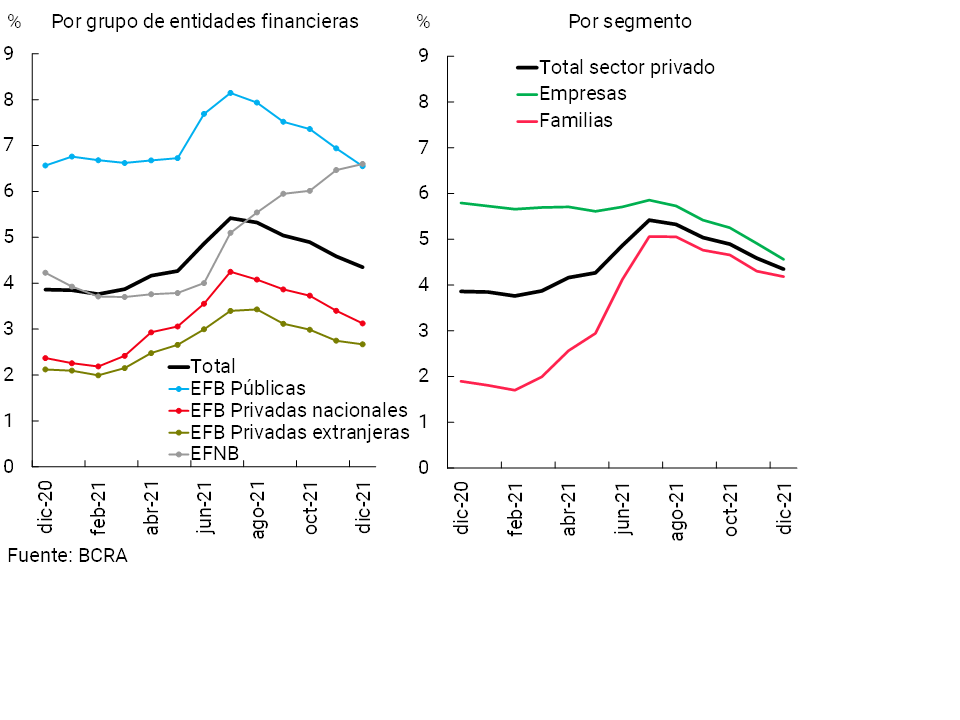
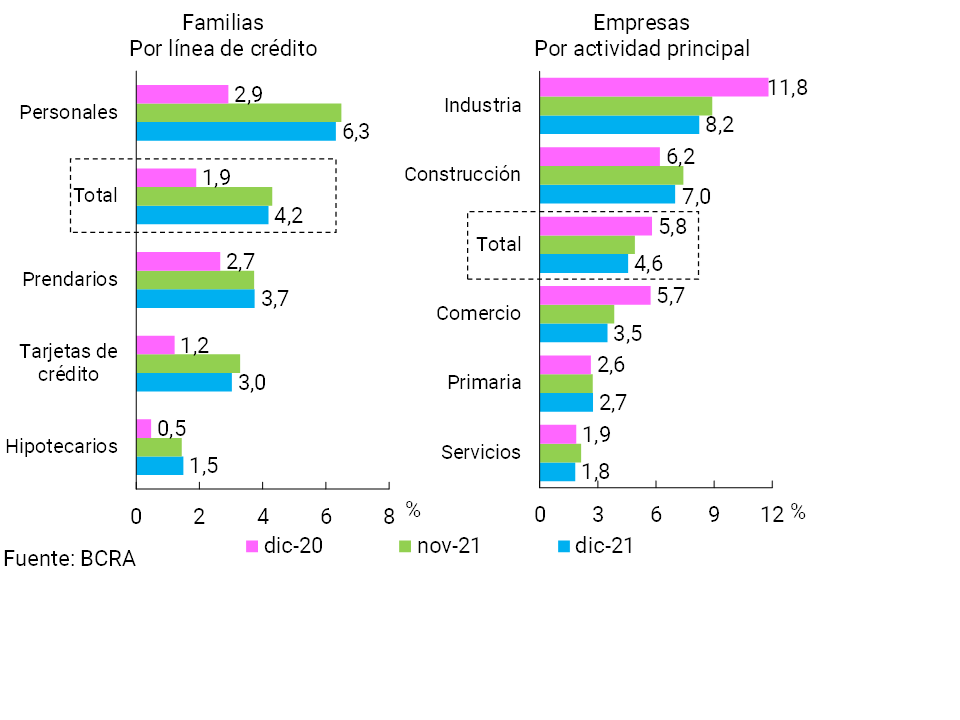
In December, the irregularity of financing to households stood at 4.2% of the total balance of loans for this segment (see Graph 12), slightly below the level of the previous month (+2.3 p.p. y.o.y.). The monthly performance was mainly driven by the decrease in the delinquency of consumer loans (credit cards and personal loans). For its part, the non-performing loan indicator for companies stood at 4.6% in the period (see Graph 12), 0.3 p.p. less than the November figure (-1.2 p.p. y.o.y.). The credit quality of companies improved monthly in most economic sectors (with the exception of the primary sector where it remained unchanged), with companies whose main activity corresponds to Industry and Construction standing out.
Figure 12 | Irregularity of credit to the private sector
Irregular financing / Total financing (%)
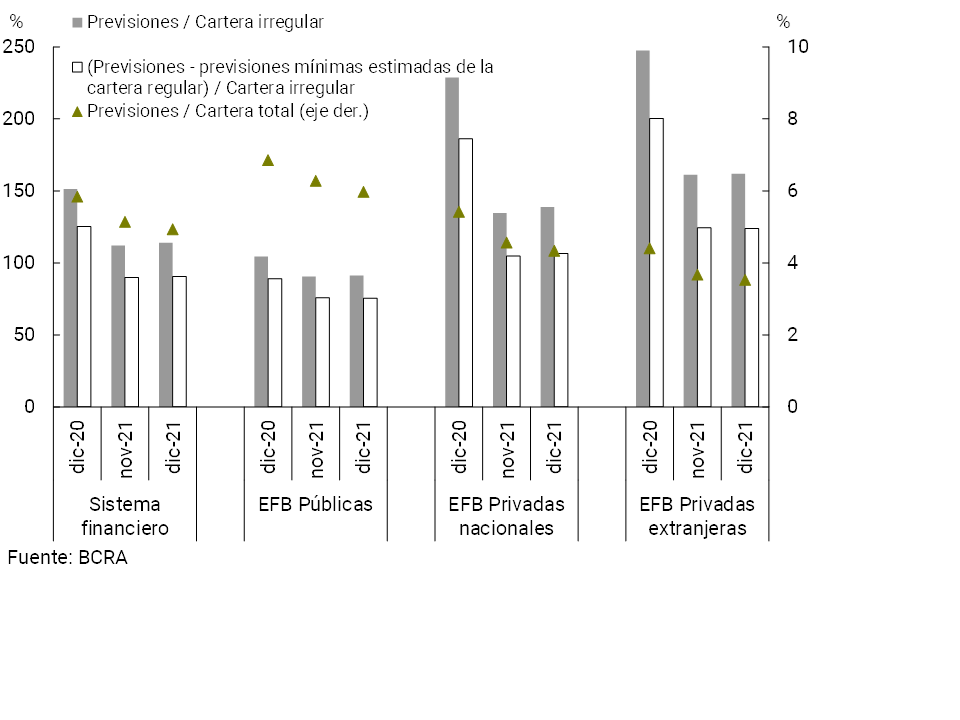
At the end of 2021, the total forecasts for the aggregate financial system represented 4.9% of total credit to the private sector, 0.2 p.p. and 0.9 p.p. below the November figure and the end of the previous year, respectively (see Chart 13). The total forecasts in terms of the non-performing portfolio stood at 114.1% in the month at the systemic level (+2.0 p.p. monthly and -37.2 p.p. y.o.y.). In December, the balance of regulatory forecasts attributable to the non-performing portfolio (following the criteria of the minimum regulatory forecasts for uncollectibility risk) represented 90.6% of this portfolio for the aggregate of entities.
Figure 13 | Credit to the private sector and forecasts
By Entity Group
IV. Liquidity and solvency
The liquidity and solvency indicators of the financial system closed the year at high levels, both from a historical perspective and in an international comparison.
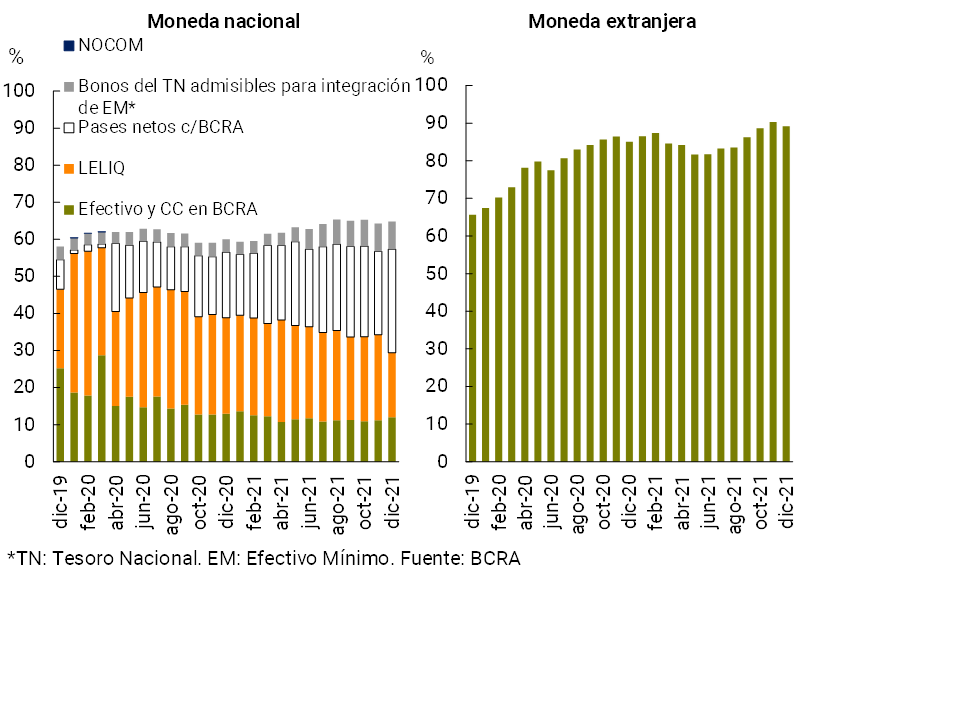
In December, the broad liquidity ratio15 of the group of institutions increased by 0.2 p.p. of deposits to 68.7% (+0.6 p.p. to 64.8% for items in pesos and -1.1 p.p. to 89.2% for the foreign currency segment, see Chart 14). Within the liquid assets in pesos, the relevance of net passes with the BCRA and the balances of the current accounts that the entities have in this Institution increased in the month, while the weighting of the LELIQ decreased. Throughout 2021, the broad sense liquidity indicator (for total domestic and foreign currency items) increased by 3.7 p.p. at the systemic level.
Figure 14 | Liquidity of the financial system
In % of deposits
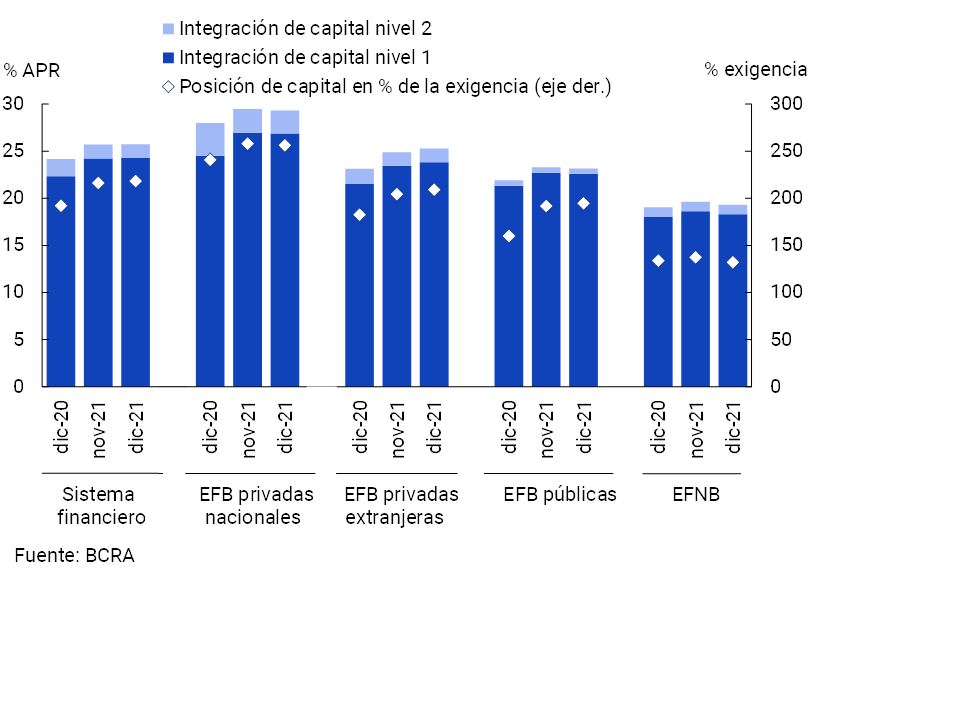
In terms of the solvency of the sector as a whole, in December capital integration (CPR) over risk-weighted assets (RWA) remained unchanged in magnitude, in the order of 25.7% (+1.6 p.p. y.o.y., see Chart 15). The surplus capital position (difference between CPR and the minimum regulatory capital requirement) totalled 218.4% of the regulatory requirement for all institutions in the month, 2.1 p.p. more than in November (+26.1 p.p. y.o.y.).
Figure 15 | Integration of regulatory capital
By financial institution group
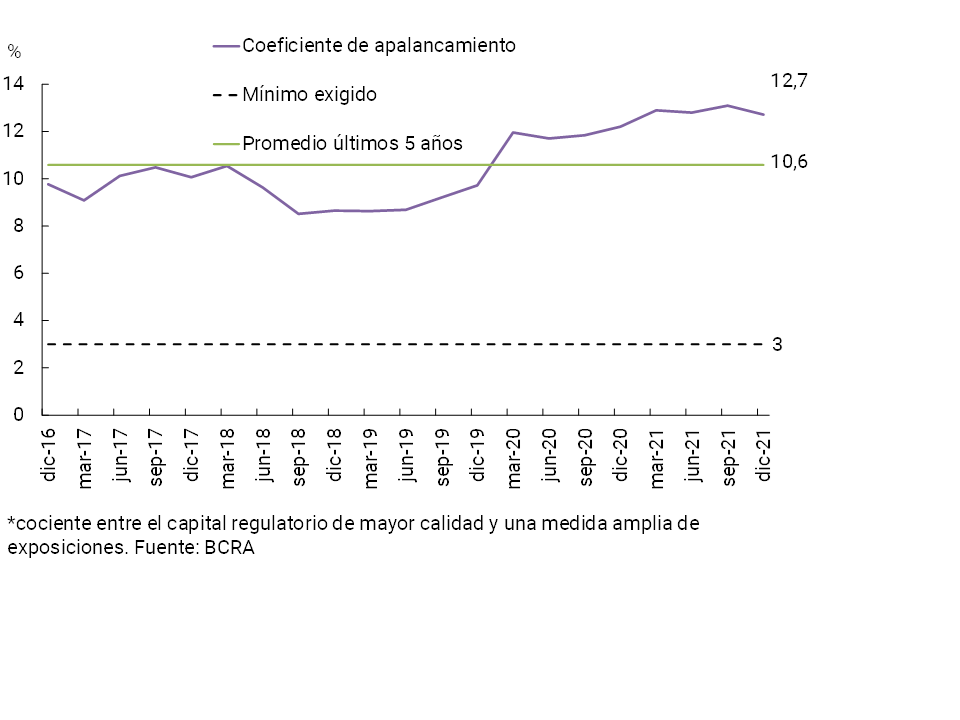
Tier 1 capital, with a greater capacity to face potential losses, continued to account for more than 94% of the total regulatory capital of the financial system. The ratio between this component of capital and a broad measure of exposures—leverage ratio according to the guidelines established by the Basel Committee—reached 12.7% in December for the aggregate of entities (see Chart 16)16. The level of this indicator did not fluctuate greatly throughout the year, comfortably exceeding the regulatory minimum of 3% and remaining among the highest records since the regulatory requirement began to apply at the local level in 2018.
Figure 16 | Leverage Ratio (LR)
An additional indicator that allows us to approximate the degree of coverage of the financial system against the credit risk assumed is the relationship between the excess regulatory capital position and the credit to the private sector net of forecasts. This indicator stood at 31.7% at the aggregate level in December, 4 p.p. more than the record at the end of 2020 and well above the average of the last 10 years —14.7%—.
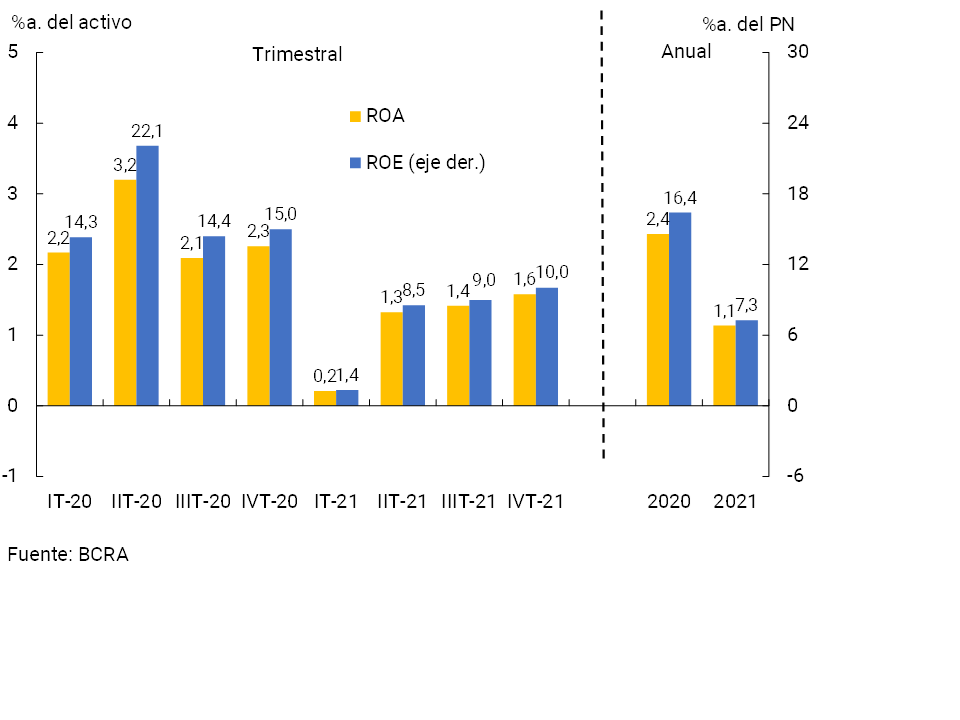
With regard to the sector’s internal capital generation, in the last quarter of 2021 the financial system registered a slight increase in profitability indicators compared to the previous quarter, following an upward pattern throughout the year. Cumulative total comprehensive income in homogeneous currency between October and December totaled 1.6% y/y of assets (ROA) and 10% y/y of equity (ROE), +0.2 p.p. and +1 p.p. respectively with respect to the third quarter of the year. However, the profitability indicators of the IVT-21 are lower in a year-on-year comparison (-0.7 p.p. in ROA terms and -5 p.p. for ROE).
Thus, throughout 2021 the financial system accumulated a total comprehensive profit in homogeneous currency equivalent to 1.1% of assets (ROA) and 7.3% of equity (ROE). These levels were lower than those evidenced throughout 2020 (-1.3 p.p. and -9.2 p.p. in terms of assets and net worth, respectively, see Chart 17). Among the main factors that influenced the lower year-on-year profitability of the sector are increases in the cost of funding for deposits, higher monetary losses (adjusted for inflation), reduction in interest income from loans and lower results from securities (including those registered in ORI). For its part, this dynamic was partially offset by higher income from pass premiums and lower charges for uncollectibility, among others.
Figure 17 | Comprehensive total profit in homogeneous currency of the financial system
V. Payment system
Retail electronic means of payment continued to grow steadily in 2021, accompanying the greater demand from users in the context of the pandemic as well as the boost generated by the BCRA.
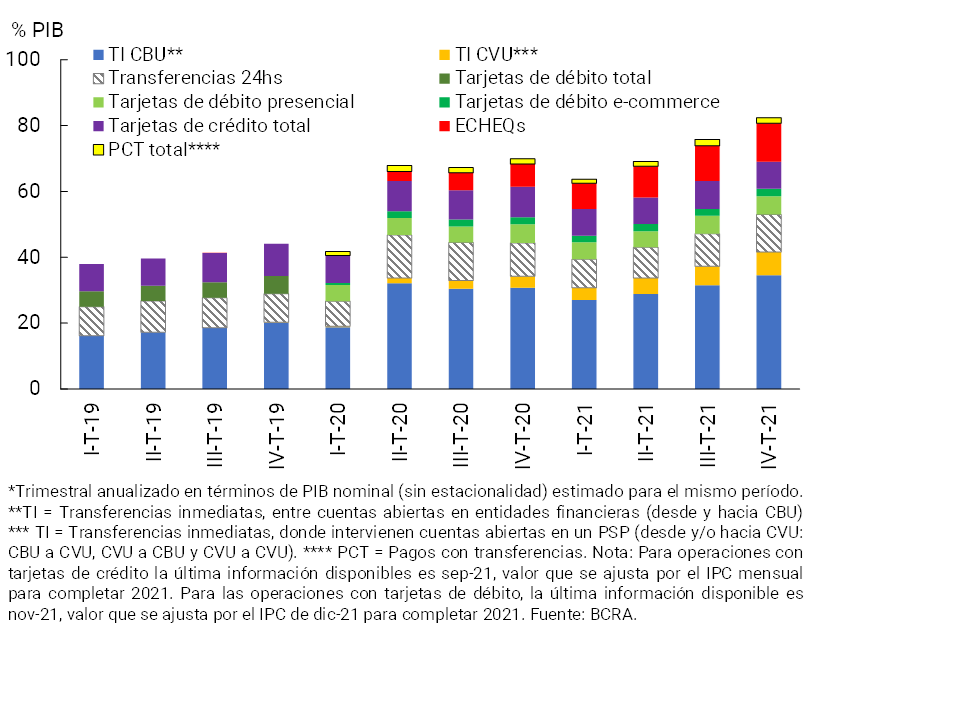
The emergence of new instruments and continuous technological improvements in existing mechanisms have led to electronic payment operations gaining weight in the economy in recent years (see Chart 18). In particular, it is estimated that the sum of the main electronic means of payment in terms of local GDP experienced an expansion of 11.6 p.p. in 2021, an increase that amounts to 37.6 p.p. if compared to the end of 2019. Among the concepts that explained the increase over the last year is the compensation of electronic checks (ECHEQs), an instrument that grew 4.8 p.p. of GDP to reach 11.7% as of December 2021 (+11.7 p.p. compared to the end of 2019). To a lesser extent, the contribution of immediate fund transfers was also relevant in the year, either between accounts exclusively of CBU (+3.7 p.p. of GDP to 34.5%), as well as in those involving accounts opened in Payment Providers (PSP; +3.6 p.p. of GDP up to 7.1%).
Figure 18 | Retail electronic means of payment
Amounts traded as a % of GDP
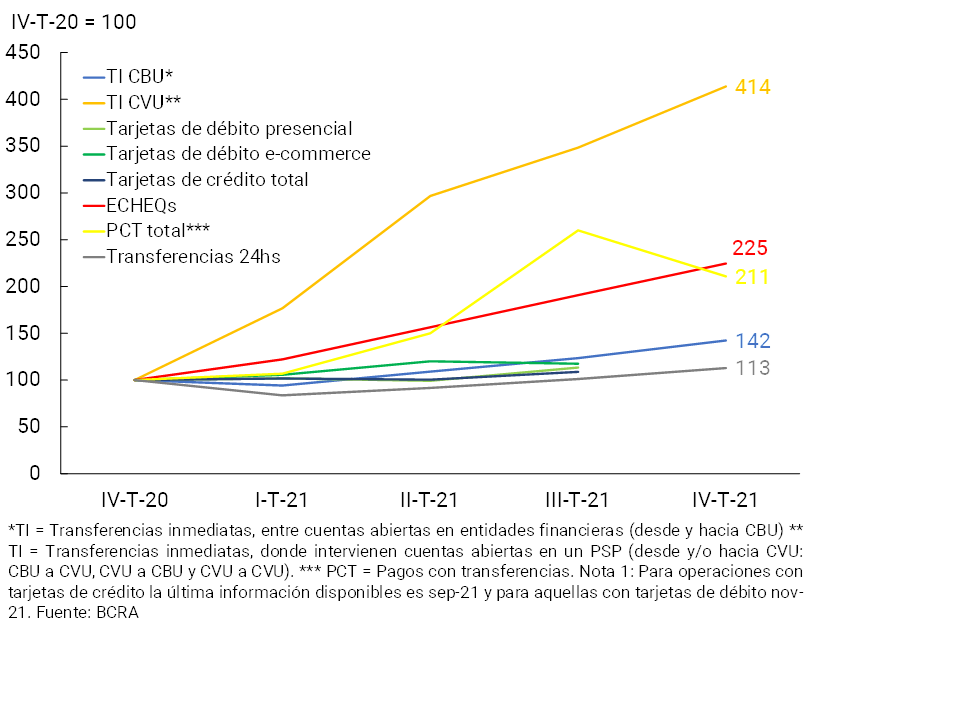
In terms of the number of transactions carried out, similar dynamics can also be seen with respect to the expansion in the use of electronic means of payment in 2021 (see Graph 19). When disaggregated by type of instrument, immediate fund transfers involving PSPs and electronic check clearing showed the greatest dynamism in 2021, growing 313% and 125% respectively.
Figure 19 | Retail electronic means of payment
Number of trades – Base index
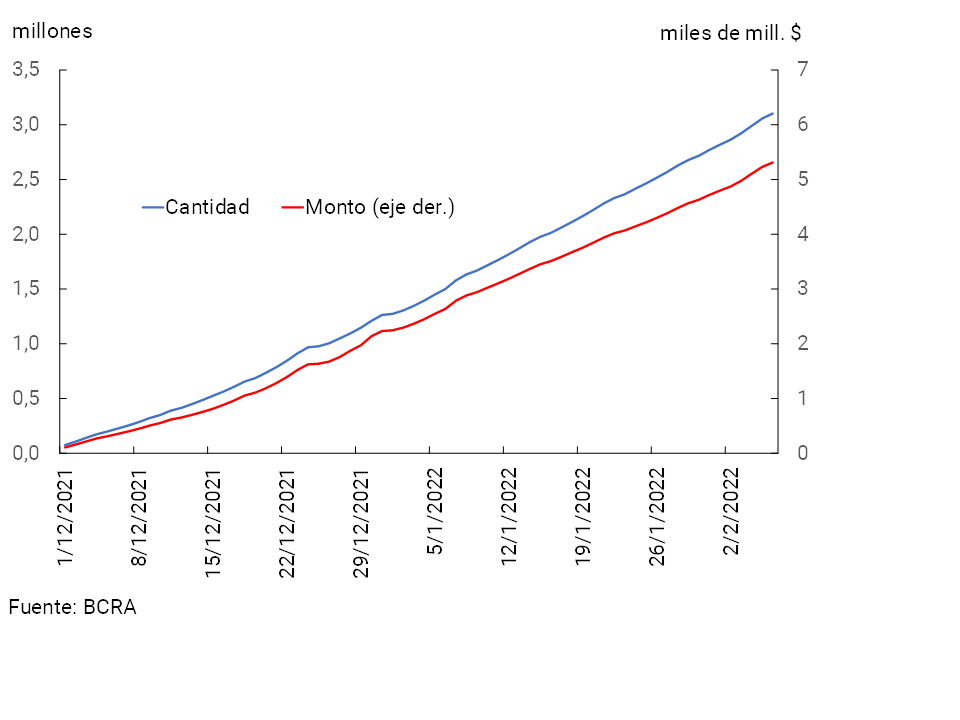
In relation to the Transfers 3.0 scheme and within the framework of the latest regulatory modifications that provided for the interoperability of transactions initiated with QRcode 17, transfer payments gained renewed momentum since the end of November 2021 (the date on which the full application of the scheme came into force), reflected in the amount and values processed daily (see Graph 20). Specifically, as of November 29, 2021, the number of accumulated operations as of February 6 reached 3.1 million, equivalent to $5,310 million (resulting in an average of $1,711 per transaction), evidencing an increase of approximately 100% in the last 30 days (both in the number of transactions, as well as in the amounts operated).
Figure 20 | Transfer payments
Cumulative values since 11/29
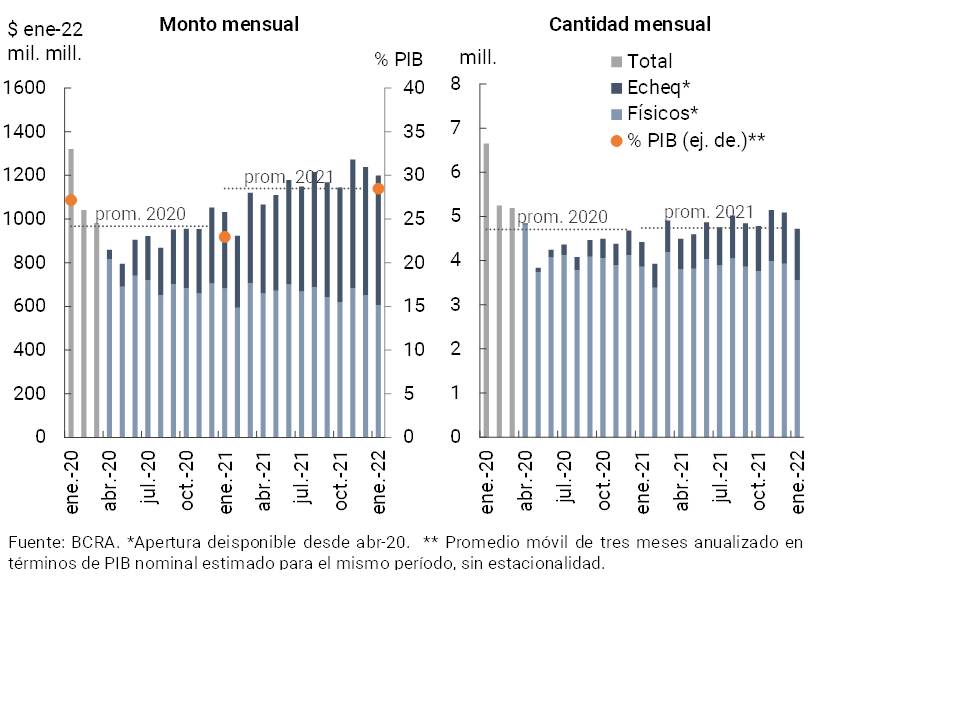
In January 2022, within the framework of seasonal factors, check clearing decreased compared to the previous month (-7.2% in amounts and -3.2% in real terms). This behavior was due to the decrease in operations in the physical format, which was partially offset by the slight increase in the compensation of ECHEQs. However, compared to the same month of the previous year, the clearing of checks accumulated an increase of 6.8% in amounts and 16.1% in real amounts, an increase explained entirely by the electronic format (+106.8% in amounts and +69.1% in real amounts). Thus, during January the ECHEQs continued to increase their weighting in total compensation, to represent 24.7% in quantities (+11.9 p.p. y.o.y.) and 49.5% in real amounts (+15.5 p.p. y.o.y., see Graph 21).
Figure 21 | Check clearing
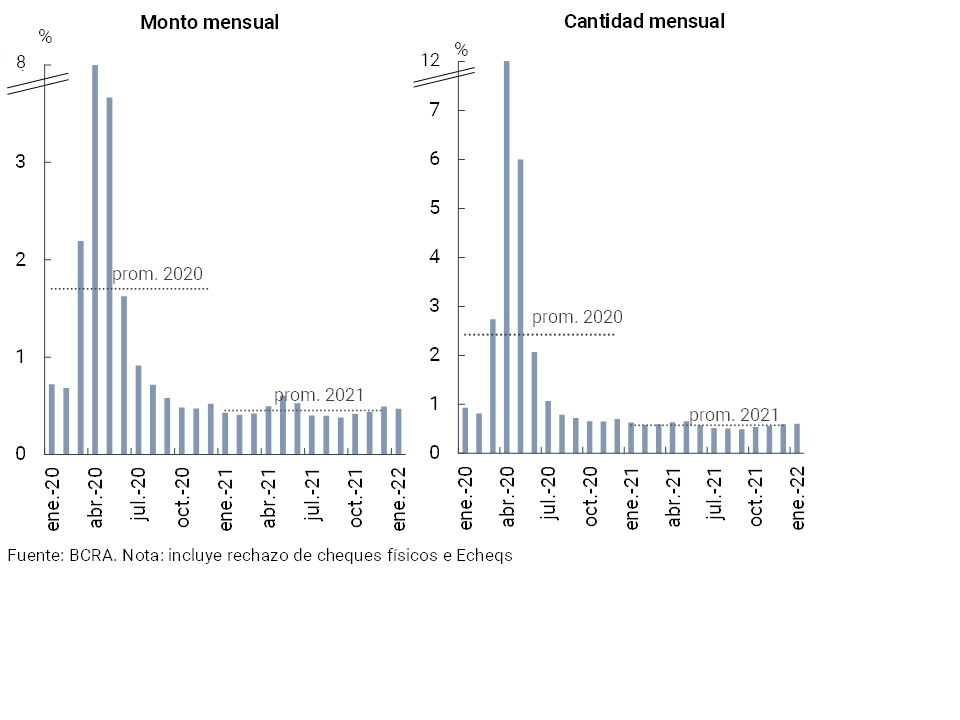
At the beginning of 2022, the ratio of rejection of checks due to lack of funds in terms of the total compensated18 did not have significant variations compared to the end of 2021 (+0.01 p.p. to 0.6% in amounts and -0.03 p.p. to 0.5% in amounts, see Chart 22). This indicator remained at levels similar to those recorded in the same month of the previous year (-0.03 in quantities and +0.04 p.p. in amounts).
Figure 22 | Bounce checks due to insufficient funds
Back to top
References
1Differences in balance sheet balances expressed in homogeneous currency. Information extracted from the Monthly Accounting Information Regime of Balance Sheet (December 2021 latest information available at the time of publication of this Report).
2Expressed in currency of origin.
3Includes principal adjustments and accrued interest.
4For more details, see Ordered text “Financing line for productive investment in MSMEs”.
5See Communication “A” “7082” and Communication “A” “7102”.
6See Communication “A” “7342”.
7Fixed-term deposits in UVA increased by 1.7% in real terms in the month (including the capital adjustment component), while traditional deposits (without an adjustment clause) fell by 0.2% in real terms. On the other hand, term investments decreased 3.9% compared to November.
8Between the peaks of 2020, the total assets of the financial system increased by 18.9% in real terms, a variation explained in part by the increase in credit in pesos and the holding of BCRA instruments (the latter within the framework of monetary sterilization, as a result of the issuance made to carry out the various extraordinary financial support programs for the private sector).
9Includes forward purchase and sale transactions of foreign currency classified off-balance sheet.
10Reaching 29.3% when netting the accounting balance of forecasts.
11It should be noted that the current macroprudential regulations establish certain limits on “Large Exposures to Credit Risk”.
12Considering the debt in aggregate form in the financial system, not necessarily being the main debtors in each of the financial institutions.
13This monthly reduction was partly explained by the transfer of credits in situation 5 to irrecoverable in suspense accounts.
14See Communication “A” “6938”, Communication “A” “7107”, Communication “A” “7181”, Communication “A” “7245” and Point 2.1.1. of the Ordered Text “Financial Services in the Framework of the Health Emergency Provided for by Decree No. 260/2020 CORONAVIRUS (COVID-19)”
15It considers availability, assets admitted for the integration of minimum cash and BCRA instruments, in domestic and foreign currency, in terms of the total balance of deposits.
16For more methodological detail see the TO of the “Leverage Ratio”.
17For more details see “Press release of 22-01-2022”
18Consider physical checks as well as electronic checks.
Share on


