Executive summary
Since the publication of the last IEF (May 2018), a more adverse context than expected in the baseline scenario has materialized. The main macroeconomic variables were affected by an external context that remained challenging and a growing perception of risk regarding the vulnerabilities of the Argentine economy. This implied a slowdown in the financial intermediation process since the second quarter and a lower dynamism in the local capital markets. The financial system has shown clear signs of strength in the face of a materialization of the risks faced, maintaining relatively high levels of liquidity and solvency, and preserving its capacity to provide its intrinsic functions of intermediation and provision of means of payment to the economy. This behavior was facilitated by a prudential regulatory scheme that this Central Bank has been implementing, which combines international standards in the field with the lessons of past financial crises.
The pressures in the foreign exchange market since the end of August were accompanied by a strong acceleration in inflation and a significant change in the outlook regarding the performance of the local economy, entering a recessionary phase of the cycle. To mitigate financial tensions, the BCRA made progress in the implementation of new policy measures, with interventions in the foreign exchange market combined with additional increases in reference interest rates, increases in reserve requirements for financial institutions and gradual reduction of the LEBAC balance, in a context in which the BCRA no longer makes transfers to the Treasury. In addition to these measures, the acceleration of the fiscal consolidation process and the renegotiation of the agreement with the IMF signed in June made it possible to increase the available fiscal resources, and to clear up the doubts installed in the markets regarding the 2018-2019 financial program. Since the beginning of October, given the increase in uncertainty that occurred at the end of August and its impact during the month of September, the monetary policy scheme based on inflation targets was replaced by a regime of control of monetary aggregates. The BCRA committed not to increase the monetary base until June 2019, which implies its decrease in real terms. This was complemented by the definition of intervention and non-intervention zones in the foreign exchange market, a scheme that combines the benefits of exchange rate flexibility to face adverse shocks with the possibility of limiting disruptive fluctuations in the exchange rate. In this context, since October a calmer situation began to be observed in the foreign exchange market.
It is expected that this combination of policies will limit uncertainty, recover the anchor on inflation expectations and resume the path of decrease in the rate of change of the general price level of the economy. Although the starting point is high nominal interest rates, which affect the financial intermediation process, they are expected to decrease, as inflation expectations are reduced. A more competitive real exchange rate will boost tradable sectors and will contribute, together with the correction of the fiscal deficit, to the reversal of the current account imbalance. Economic activity is expected to begin a gradual recovery starting in 2019, on a more sustainable basis than in the past, allowing the expansionary phase of the financial cycle to resume.
Given this baseline scenario expected after the application of the new policy measures and the soundness observed so far by the financial system, there should be extreme negative deviations for financial stability conditions to be significantly compromised. With a relatively small financial system, based on traditional intermediation (of little complexity), with limited term transformation, high liquidity and capital coverage, and a regulatory framework in line with the standards recommended at a global level, the possibility of amplification of possible additional materializations of assumed risks is reduced. Although in the coming months the evolution of the quality of banks’ loan portfolios will continue, in part, to be conditioned by the behavior of economic activity and interest rates, the relatively low levels of non-performing loans should be highlighted, both in comparison with history itself and with respect to other countries. In particular, the mortgage loan segment, one of the fastest growing in recent years (and with a significant part in UVA), maintains very low levels of irregularity. The limited level of leverage of the private sector, the moderate exposure of banks to it and the high levels of coverage with forecasts and excess regulatory capital that they hold are factors of strength in the face of a context of possible greater materialization of credit risk. In this regard, the results of the stress exercises for credit risk continue to show reduced impacts at the aggregate level – unchanged compared to those obtained in previous editions of the IEF – with a significant degree of resilience of the sector to even more adverse scenarios in terms of this type of risk (main balance sheet exposure).
The financial system shows significant levels of capitalization, while its profitability has not registered sudden changes. Banks continued to exhibit a high liquidity risk hedge, in a context in which deposits maintained a relatively positive performance in view of the adverse macroeconomic context in which the sector operated, while bank lending showed less dynamism than in previous months. The banks’ foreign currency asset mismatch is relatively limited, with low dollarization of their balance sheets and with foreign currency exposures to sectors with revenues correlated to that currency, in accordance with current prudential regulations. The BCRA will continue to monitor the existing sources of risk and the evolution of the financial system in the current situation, having macroprudential policy instruments to use if necessary.
1. Context
A challenging external context remains for emerging economies in general, and for Argentina in particular, as greater discrimination has been observed among investors towards countries with more vulnerable macroeconomic fundamentals, with particular impact on the exchange rate and the perceived risk of sovereign debt. In view of this situation, with an impact on the financial markets and the level of activity (potentially affecting the banking sector), the Ministry of Finance and the BCRA implemented new measures in recent months. In order to reduce uncertainty, fiscal convergence was accelerated, a new agreement was negotiated with the IMF (increasing the available fiscal resources) and a new monetary-exchange scheme was applied. Based on these measures, by October greater stability was observed in the foreign exchange market, while inflation is expected to go down – once the effect of the recent situation has been overcome – and that economic activity will begin to recover in 2019, led by the tradable sector. So far, the financial system has shown important signs of solidity, maintaining an intermediation process that observes significant resilience in the face of the adverse context in which the sector operates (see Chapter 3). Monitoring of the evolution of economic activity continues, in a context of high interest rates and less financing for the private sector, beyond the incipient reappearance of the placements of negotiable obligations in the capital market since the end of October.
International situation
1.1.1 External financial markets continue to show restrictive conditions for Argentina
In recent months, a challenging context has remained in the international financial markets, despite the fact that liquidity conditions remain relatively comfortable in historical terms and the positive performance of global economic activity (including Argentina’s main trading partners). This challenging context had effects on the evolution of the AR$/US$ exchange rate, in addition to affecting companies with debt abroad (which in many cases are also debtors to the local banking system). In addition, by influencing the policy scheme applied (including increases in interest rates), it conditioned the local context in which financial intermediation is carried out.
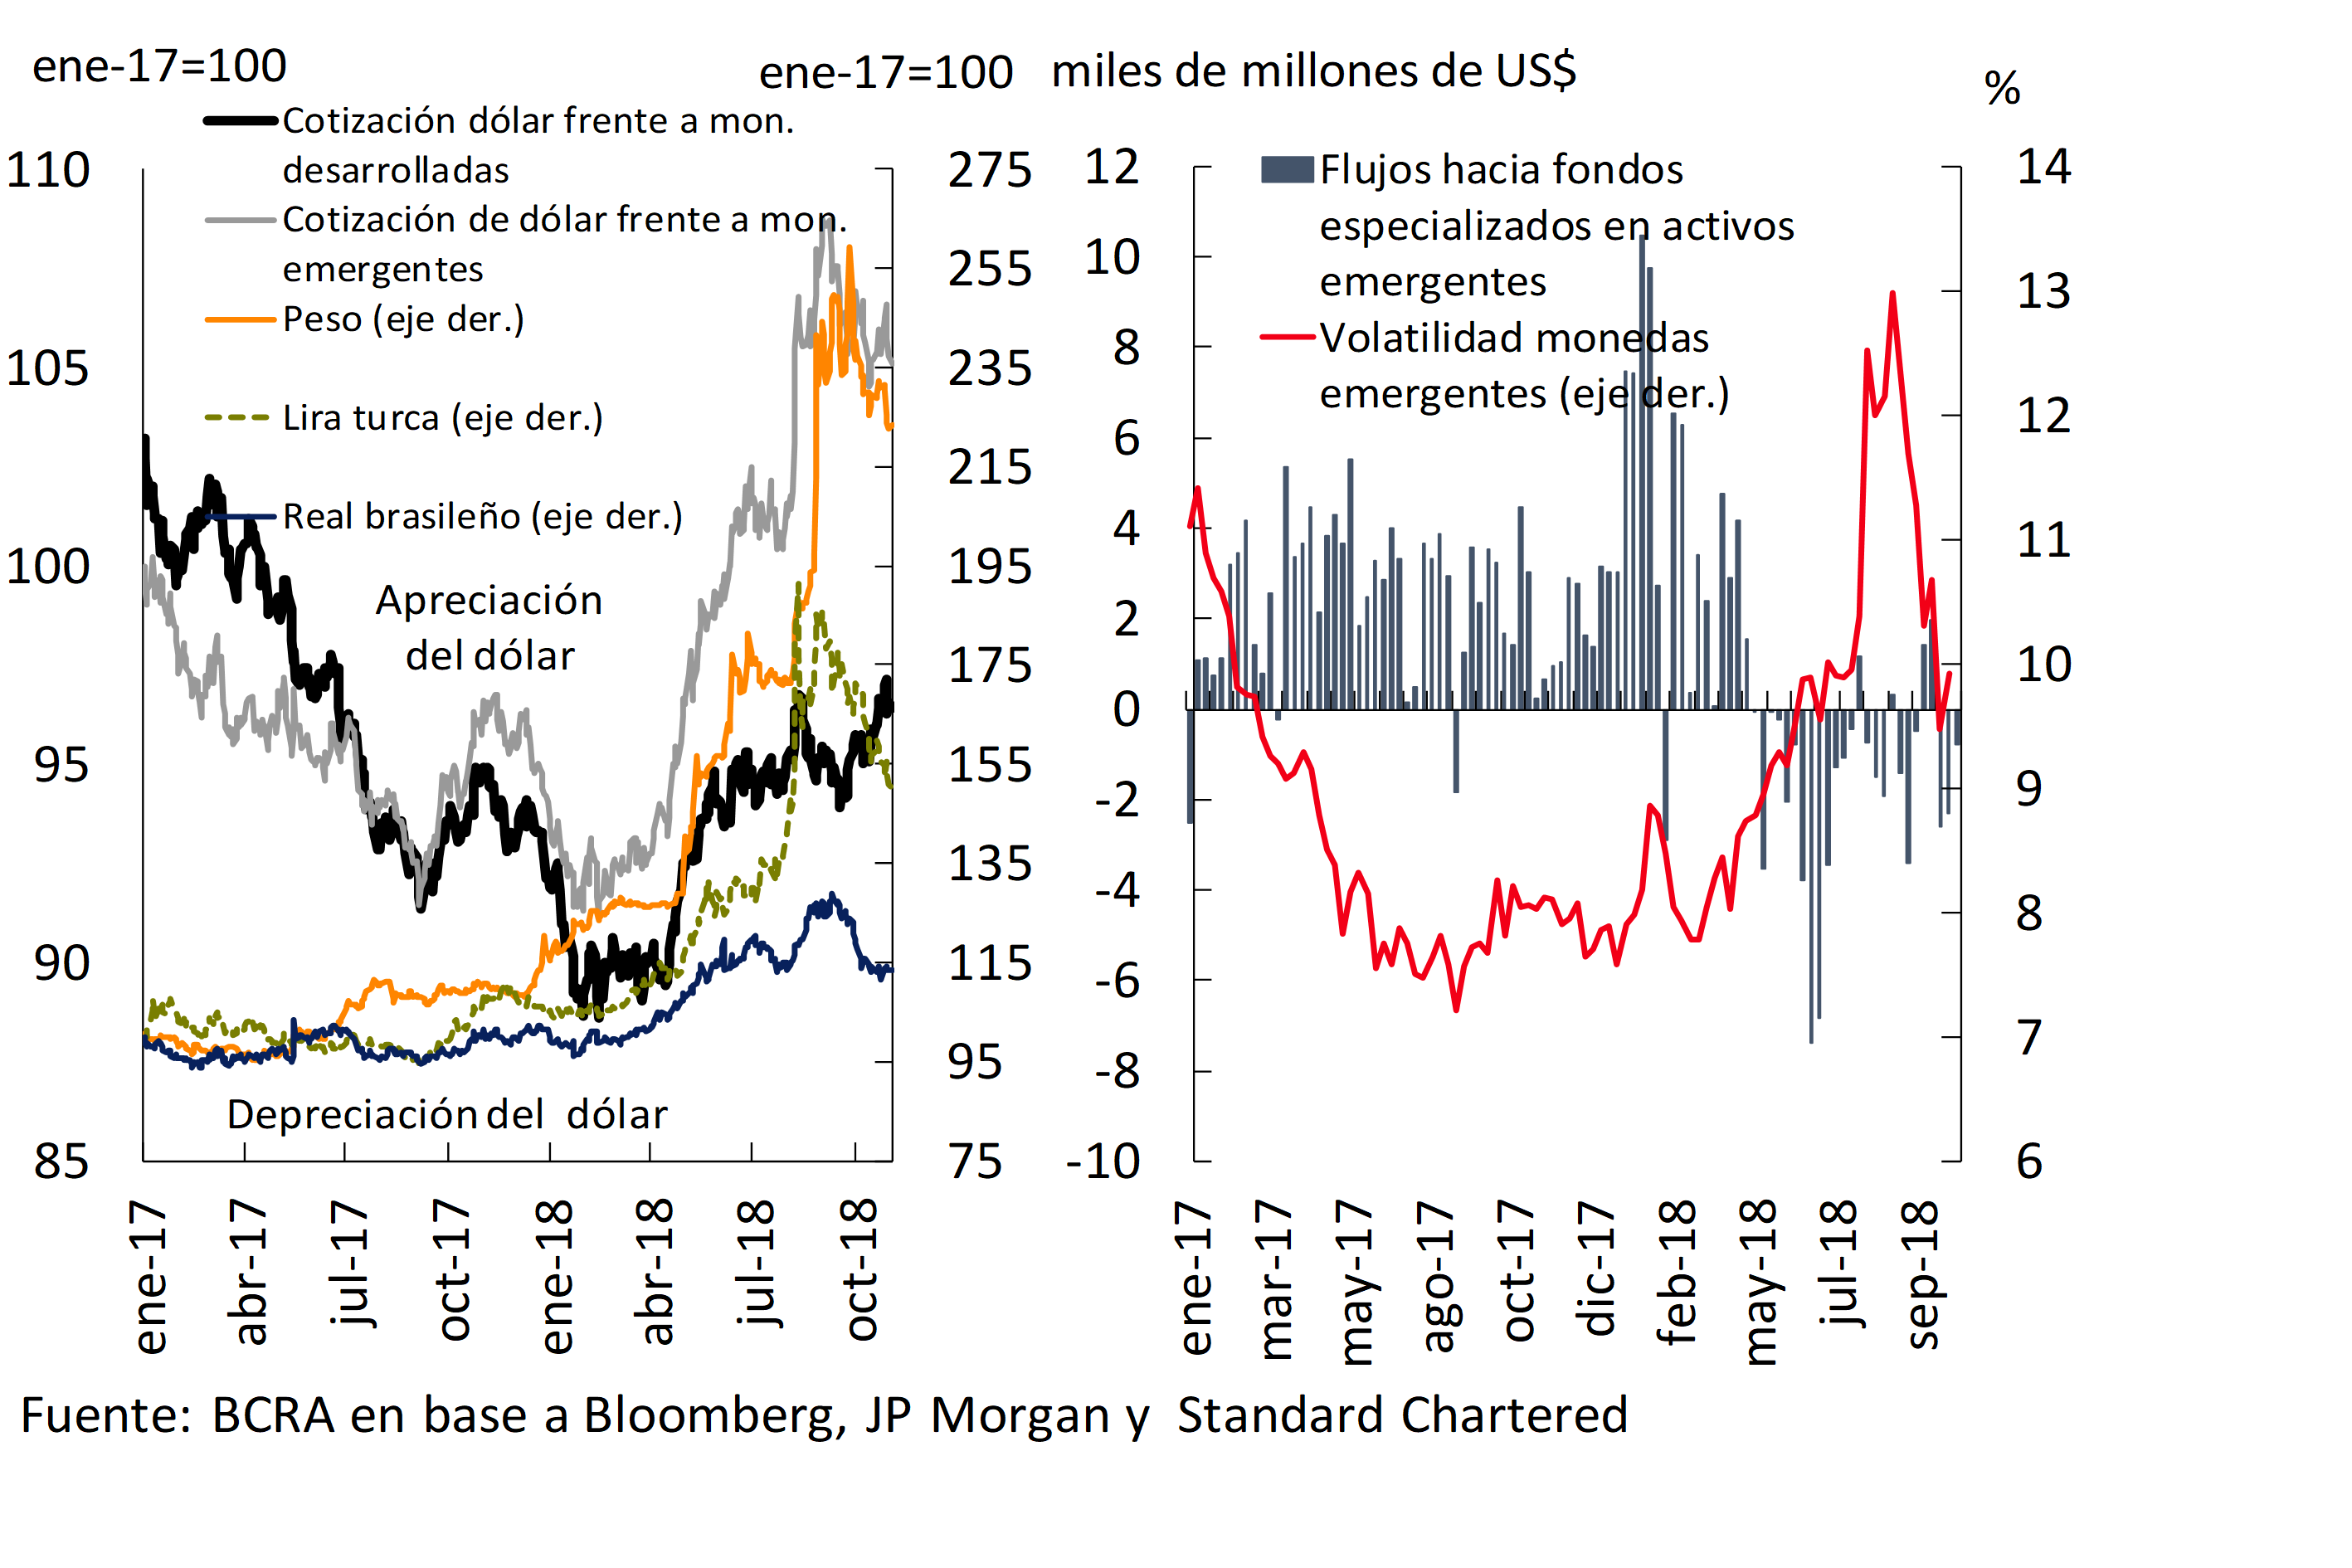
Indeed, after signs of tension during the first half of 2018, in the August-September period there was again greater risk aversion, with pressure on emerging market assets, particularly in fixed income instruments. Similar to previous capital outflow situations, there was a depreciation of emerging currencies against the dollar, while the volatility expected in these markets increased (see Figure 1.1). Although this deterioration was widespread, the impact was more marked in the currencies of countries with a more compromised external and fiscal situation. 1 In the international debt markets of emerging economies, there was an increase in the surcharge required by these instruments (with some improvement more recently), while new placements lost dynamism.
Figure 1.1 | Asset volatility and dollar price
As mentioned in previous editions of the IEF, the tensions in the markets are due to different reasons, including the evolution of the US economy and its effect on expectations regarding the gradual rise in monetary policy interest rates, the yields on its sovereign debt and the evolution of the dollar. Eventually, these developments could generate new portfolio adjustments that impact the assets of emerging economies. Another risk factor is the eventual deepening of the trade war between the US and China. In this case, the outlook related to foreign trade volumes and business costs could be conditioned, with an impact on global growth. Depending on potential additional actions, this could affect financial and currency markets, in addition to commodity prices.
The situation in Europe also presents different sources of tension that could trigger greater risk aversion in the markets or affect the level of trade and growth at the global level. 2 Other factors with a potential impact on risk aversion include geopolitical issues (recently, the tension between Turkey and Saudi Arabia), or the impact of the situation of specific economies with direct influence on Argentina (such as Brazil, with a political process that implied greater volatility in its exchange rate in recent months). Finally, another factor usually mentioned in the debate on risks at the global level is that linked to the rise of cryptoassets in recent years. This phenomenon does not represent a source of systemic risk so far (see Section 1).
1.1.2 Deterioration of the external context faced and local vulnerabilities led to changes in the policies applied
The more demanding financing conditions in international markets, capital outflows3 and the volatility observed in currency markets, in conjunction with the perception of vulnerabilities inherent to the Argentine economy, led to important changes in the policies applied. In a context of increased perceived risk for Argentina’s debt instruments in international markets (see Box 1), an agreement was signed with the IMF in June to access a credit line. In order to clear up the uncertainty regarding the 2018-2019 financial program, a new agreement was reached with this institution towards the end of September (increasing the available fiscal resources). This new agreement implied strengthening fiscal convergence (new measures to achieve primary fiscal balance in 2019) and the adoption of a new monetary-exchange regime.
In the face of renewed exchange rate tensions in August – a consequence of external and internal factors – the BCRA took a series of measures to mitigate the pressures on the foreign exchange market and its effects on inflation: increases in the reference interest rate, interventions in the foreign exchange market, increases in bank reserve requirements, gradual reduction of LEBACs and completion of transfers to the Treasury. However, given the dynamics that the exchange rate was taking and the risk of a greater de-anchoring of inflation expectations, at the beginning of October (within the framework of the new agreement with the IMF) the BCRA implemented a new monetary policy scheme, based on a monetary base target, complemented by the definition of areas of intervention and non-exchange intervention. Regarding the latter, it seeks to combine the benefits of floating with the benefits of preventing excessive fluctuations in the exchange rate. This allows the latter to act as an automatic stabiliser of employment and economic activity in the face of internal or external shocks.
It is expected that this new monetary-exchange scheme, based on an exchange rate more consistent with the macroeconomic balance (which contributes to the adjustment of the external accounts), will consolidate the calmer situation in the market observed since October. Given the evolution of the exchange rate, the context of high interest rates and slowdown in economic activity in recent months, the monitoring of the situation of companies and banks continues (see Chapters 3), assessing that there should be extreme deviations in the expected base scenario for financial stability to be affected.
Box 1. Argentina’s cost of financing and perceived risk
Since the last publication of the IEF, the cost of sovereign borrowing in dollars has increased, discontinuing access to international debt markets (the last placement of sovereign debt was in January 2018). This increase in the cost of financing also occurred for companies (the last corporate issuance in international markets was in April 2018).
The spread on Argentina’s sovereign debt (measured by the EMBI+) exceeded 780 bps in early September, then fell back to nearly 600 bps in early November. The rise was more marked than for countries with the same credit rating, even exceeding the levels of countries with lower ratings for several weeks (see Figure 1.2). This occurred in a context in which two of the three main rating agencies modified their outlook for Argentina downwards, while towards mid-November S&P lowered its rating for the country by one notch.
Figure 1.2 | Argentine sovereign debt yields and rating
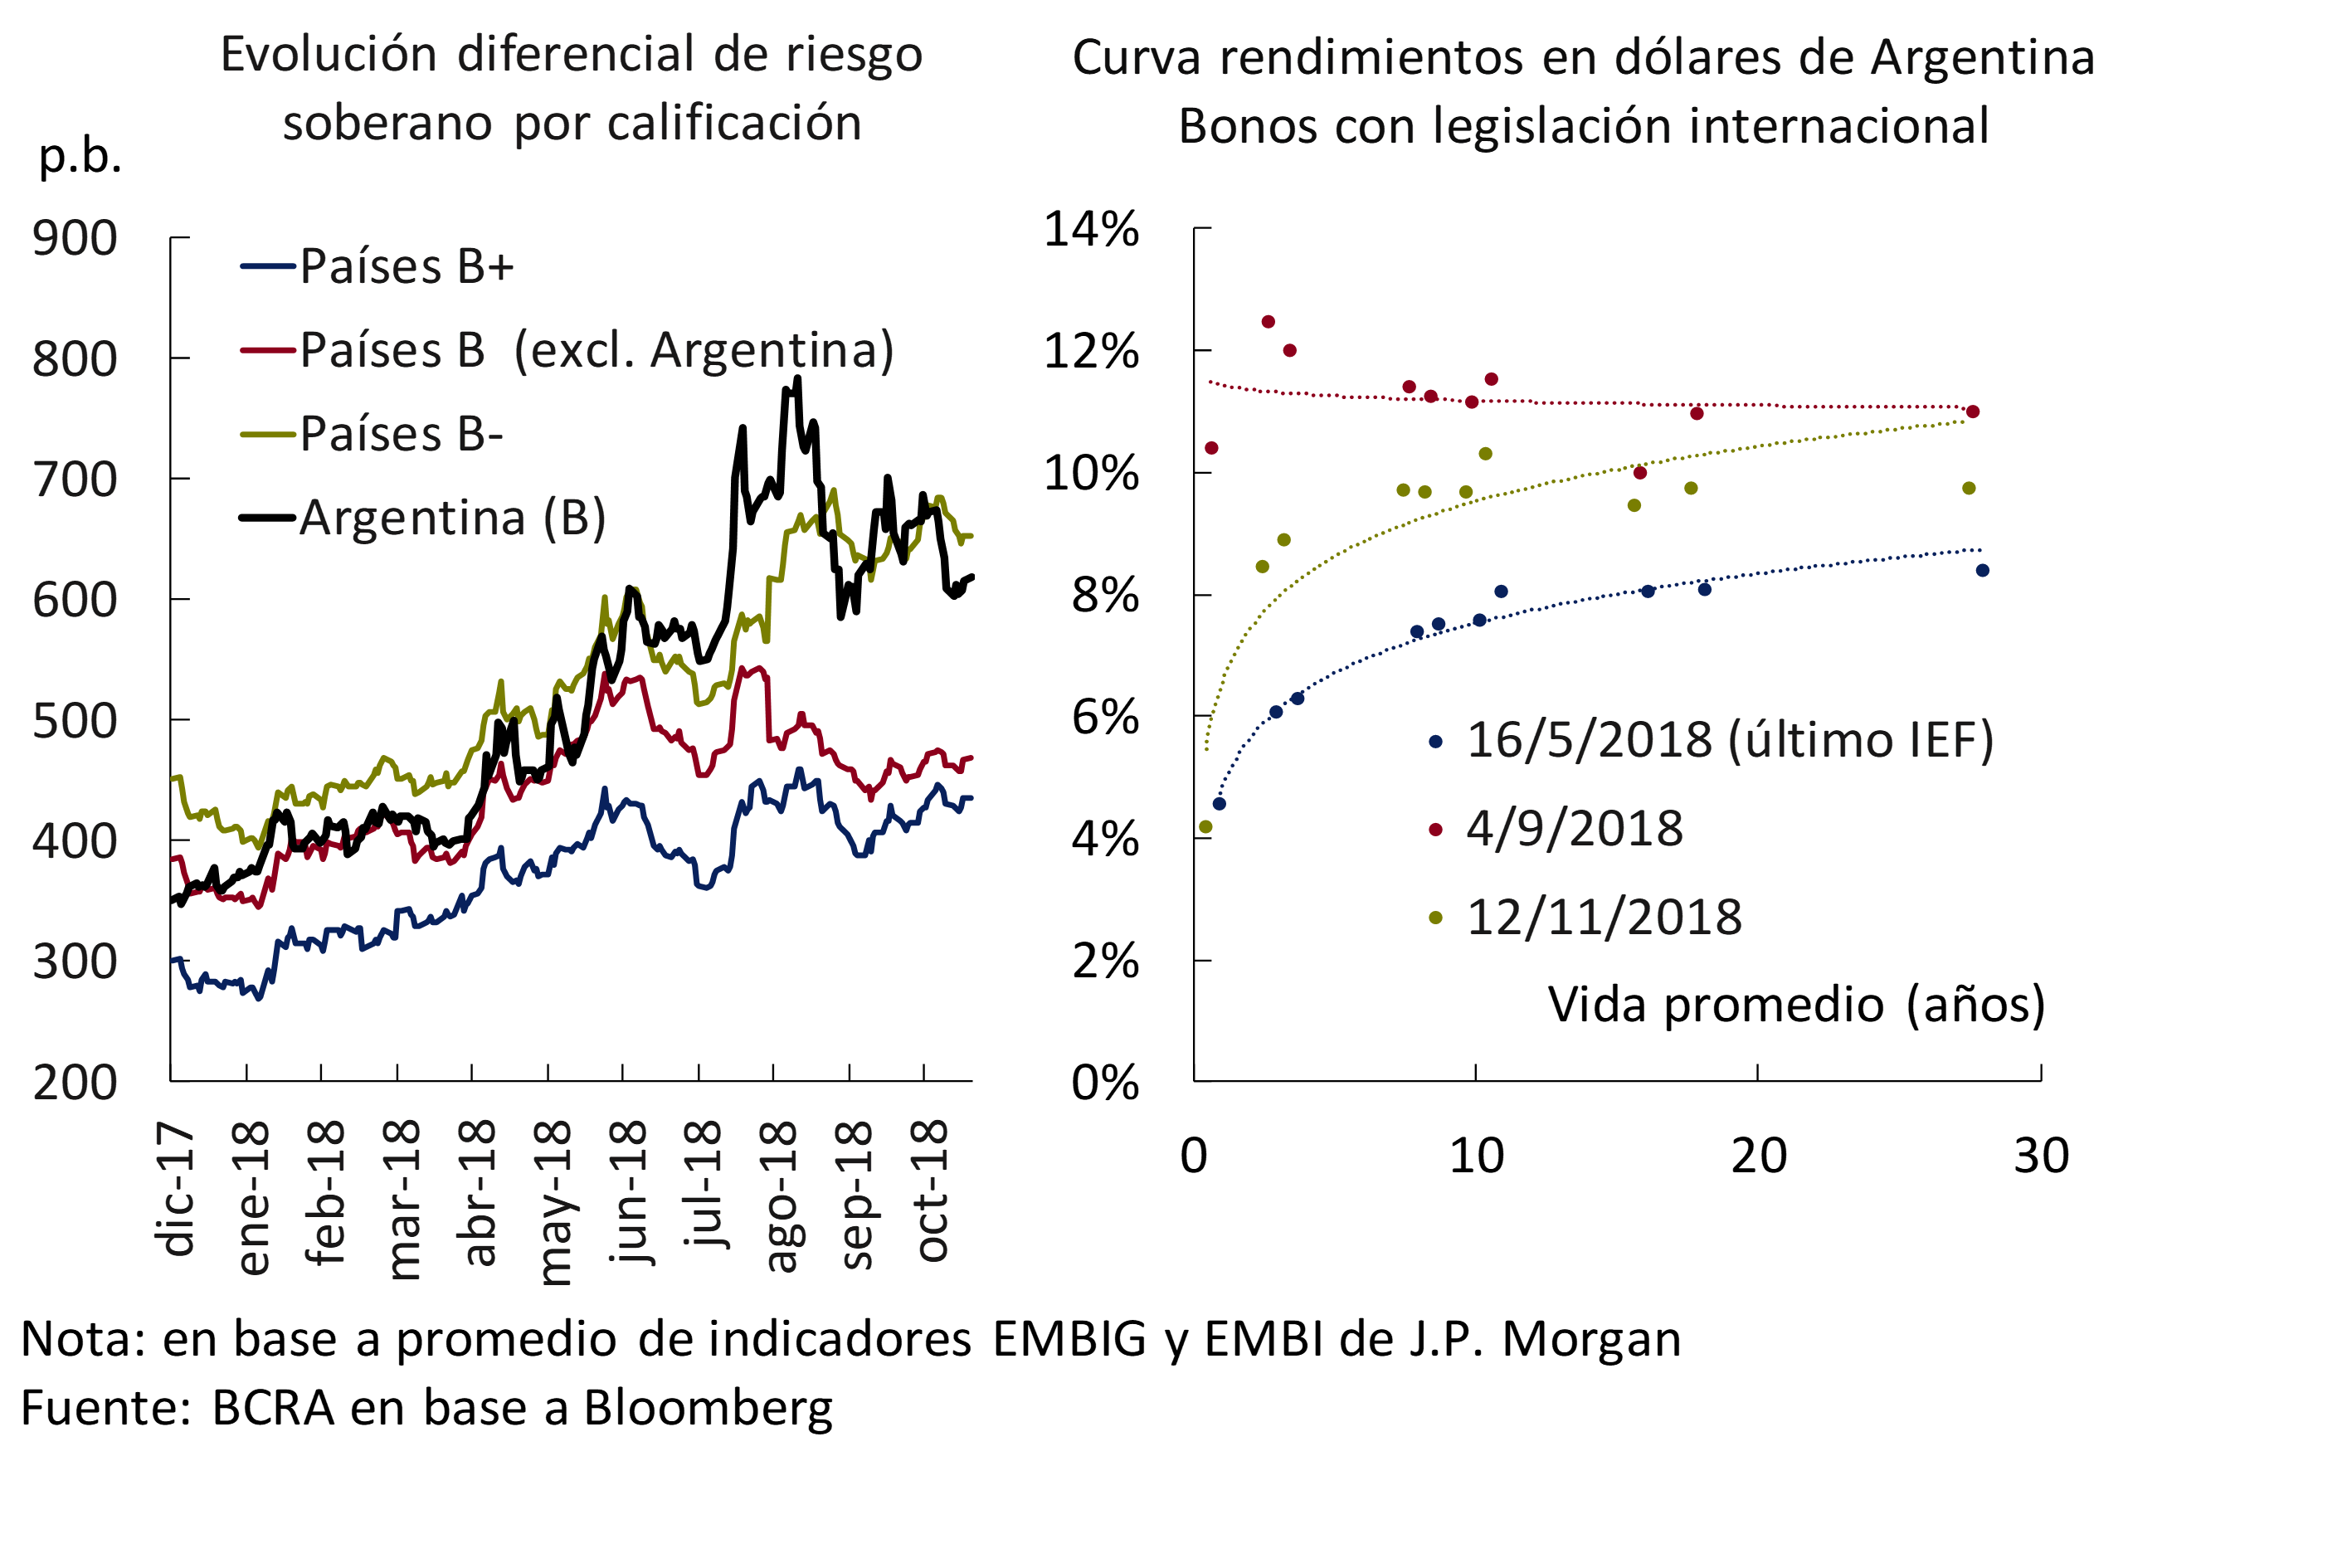
The greater perceived risk was also evidenced in the form of the yield curve of instruments in dollars with international legislation, showing higher yields for the shorter tranche at times of greater tension (end of August and beginning of September). The downward slope in the dollar yield curve was temporary and less steep than in previous situations of international financial crisis and periods of stress linked to debt litigation. At the beginning of November, there was an increase of approximately 160 bps compared to the levels in force in the last publication of the IEF, with a relatively parallel shift in the yield curve.
1.2 Less constructive local context for financial intermediation
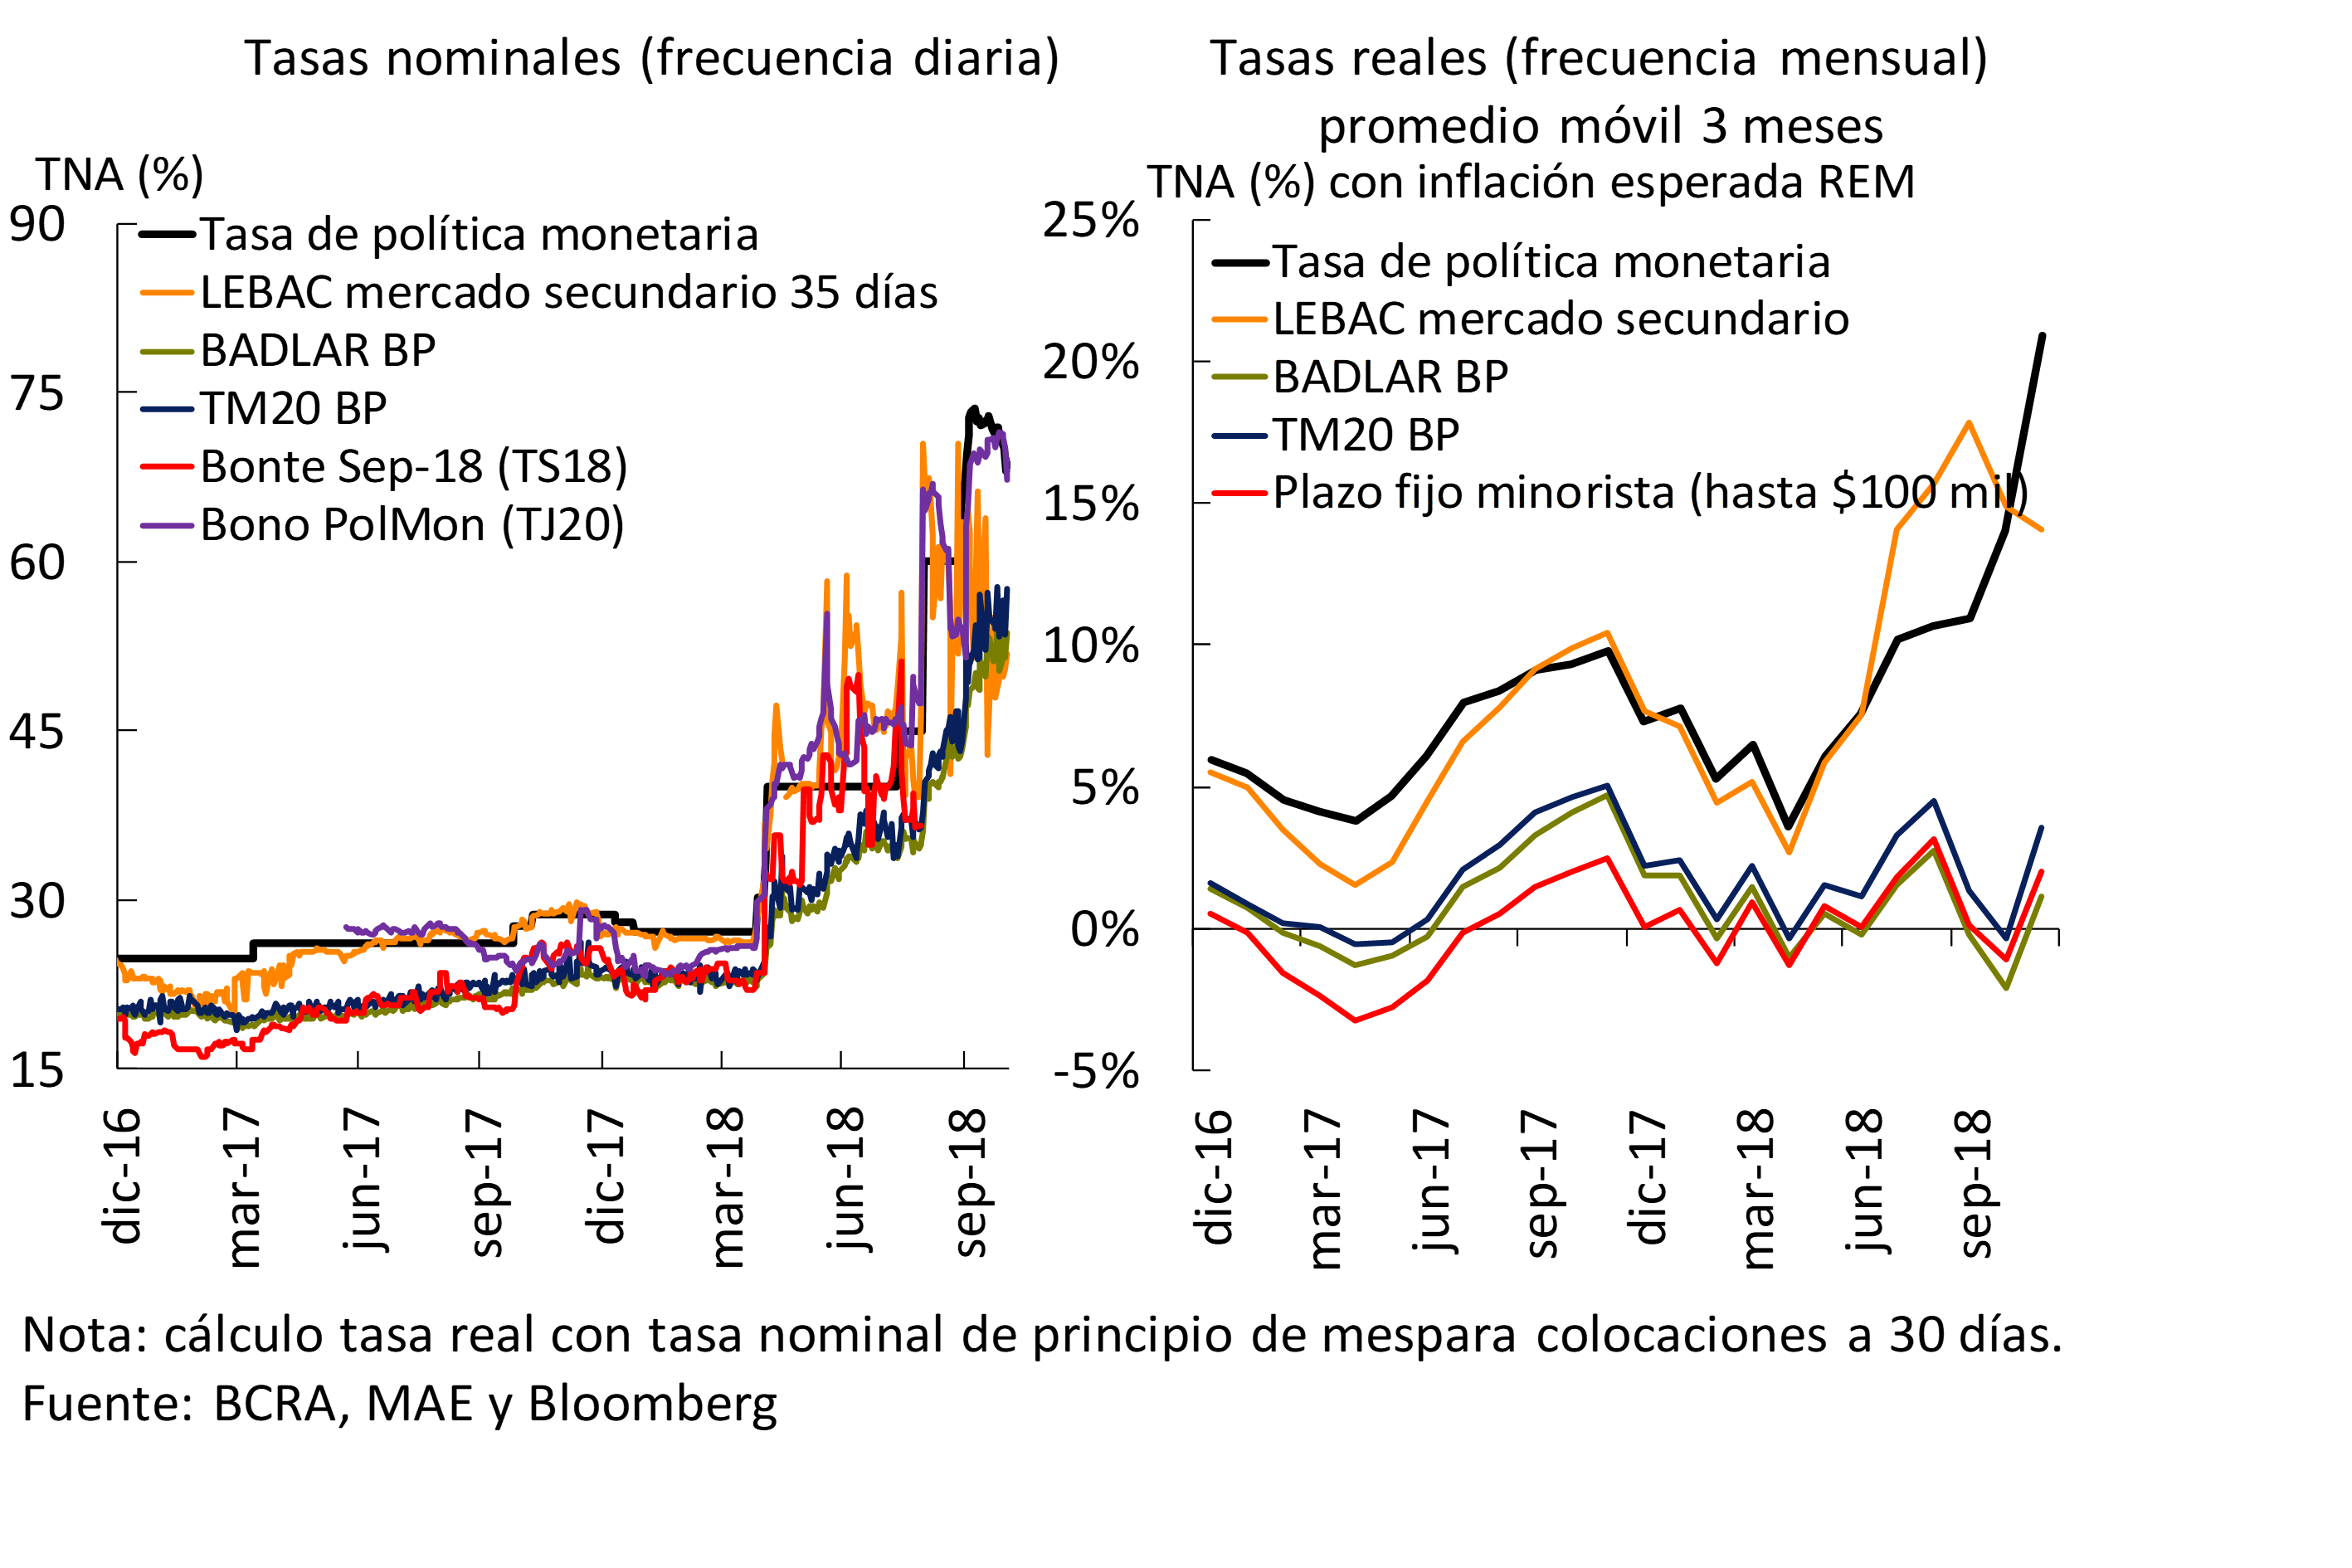
With greater uncertainty in relation to what had been observed until the previous IEF, the local context conditioned the development of financial activity in recent months (see Chapter 2). The new episode of nominal instability (since the end of August) led to a significant change in the forecasts for macroeconomic performance, which were not included in the assumptions of the baseline scenario in force until the first months of 2018. In addition to the effect of the drought and the uncertainty generated by the judicial investigations of corruption cases, the incidence of financial and exchange rate volatility was added to determine the entry of the local economy into a recessionary phase of the economic cycle. At the same time, successive exchange rate hikes led to an increase in inflation records and raised the risk of a de-anchoring of inflation expectations, which translated into successive increases in benchmark interest rates (see Figure 1.3), among other measures mentioned. As will be seen in Chapter 3, this has so far had a limited impact on the institutions as a whole, for example, in terms of the deterioration in the quality of the loan portfolio in the financial system.
Figure 1.3 | Reference rates in domestic markets in pesos
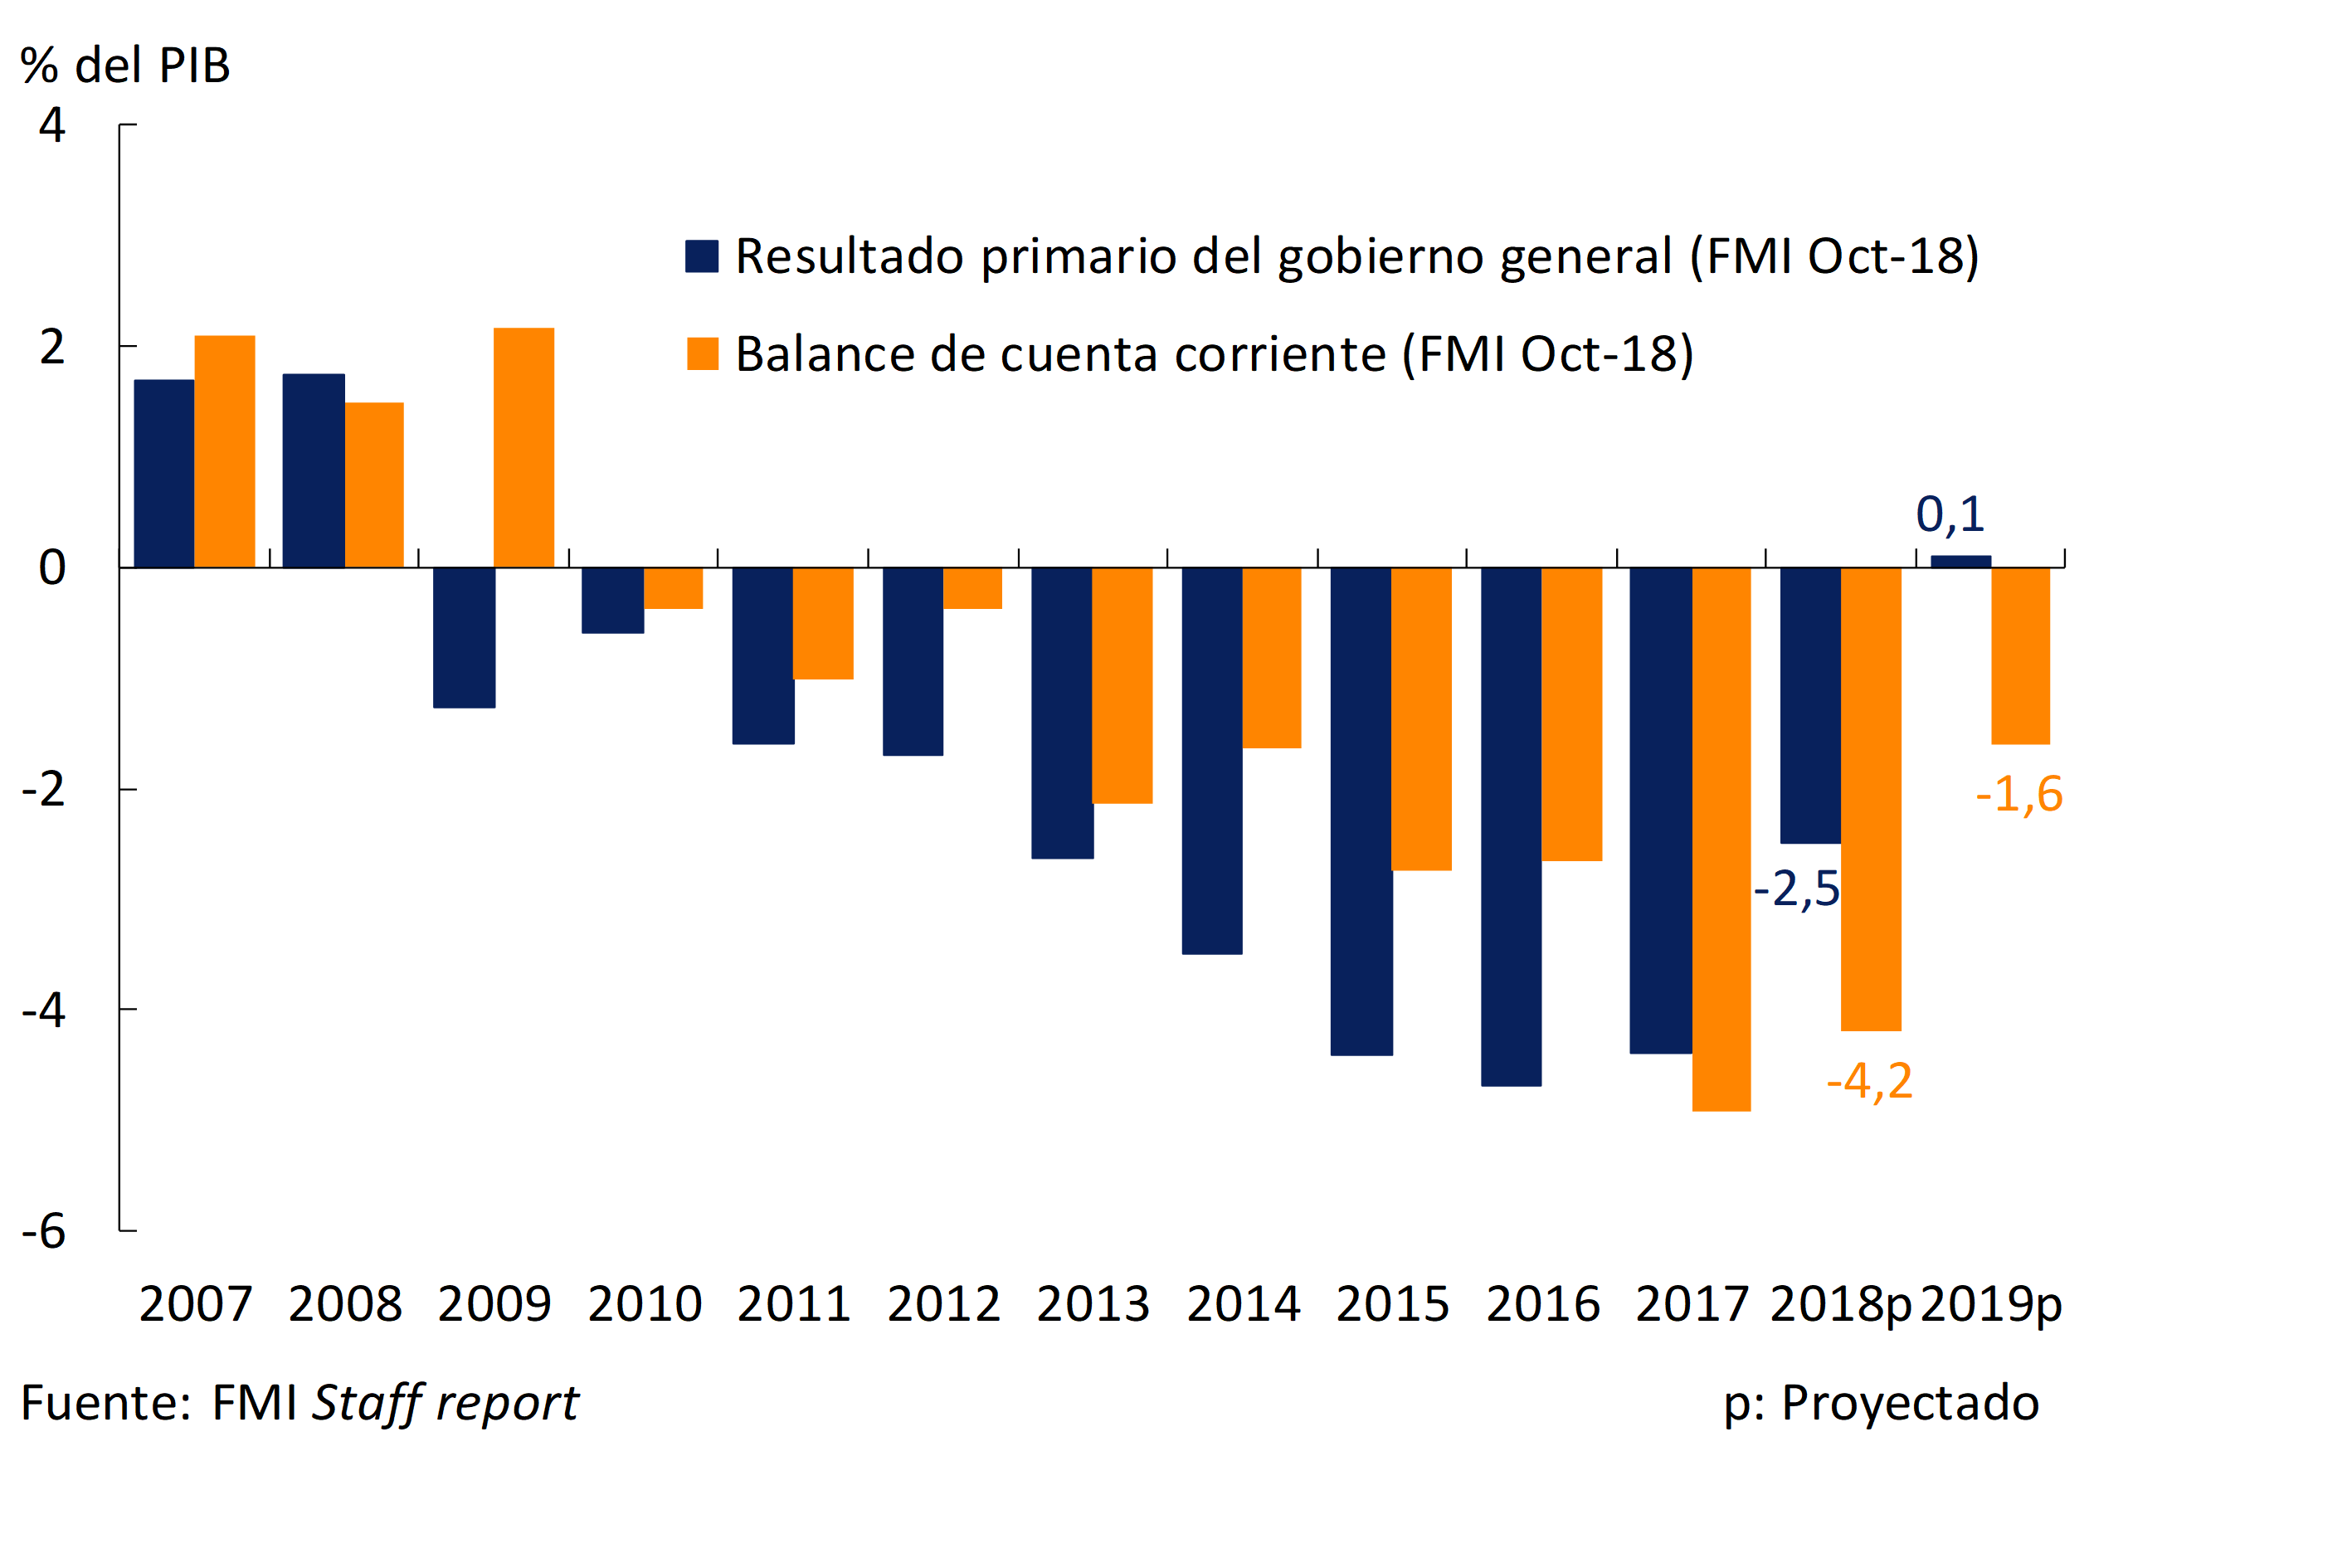
In terms of the fiscal situation, the new planned consolidation path, more demanding than the previous one, will imply a faster closing of the savings-investment gap in the public sector, which is one of the main determinants of the current account deficit. The correction of the external and fiscal deficits will allow a recovery to begin during 2019 on a more sustainable basis than in the past (see Figure 1.4). 4 Along these lines, it is also worth mentioning the importance for the functioning of the financial system of the evaluation of the fiscal situation, attentive to the credit exposure – currently limited – to the public sector.
Figure 1.4 | Primary fiscal result and current account balance
With respect to economic activity, during the second quarter, GDP fell 4% s.e. as a result of the impact of the drought that affected the soybean and corn harvest. 5 During the third quarter, in a context of marked exchange rate and financial tensions, non-agricultural GDP would have deepened its fall (which would be partially offset by the recovery of the agricultural sector). The contraction was widespread in the different sectors of GDP. Going forward, the macroeconomic projections contained in the 2019 National Budget Bill envisage a fall in GDP in 2018 and the beginning of a gradual recovery in 2019 (this could condition the behavior of financial intermediation and the quality of banks’ portfolios, see Chapter 2). This path of gradual recovery of the economy is shared by the analysts who participate in the REM.
In terms of the price level, as mentioned, the accumulation of significant increases in the exchange rate deepened uncertainty and led to a rise in inflation. Although inflation expectations, measured in the REM, have grown since the beginning of the exchange rate turbulence and are at high levels, it is noteworthy that the market continues to expect a slowdown in inflation over 12 and 18 months. The monetary contraction generated by the new monetary policy scheme, together with the downward path of the primary deficit and the commitment to no longer finance the Treasury, is expected to be reflected in a fall in both expectations and observed levels of inflation in the coming months. In turn, this will allow us to move towards a scenario of lower interest rates.
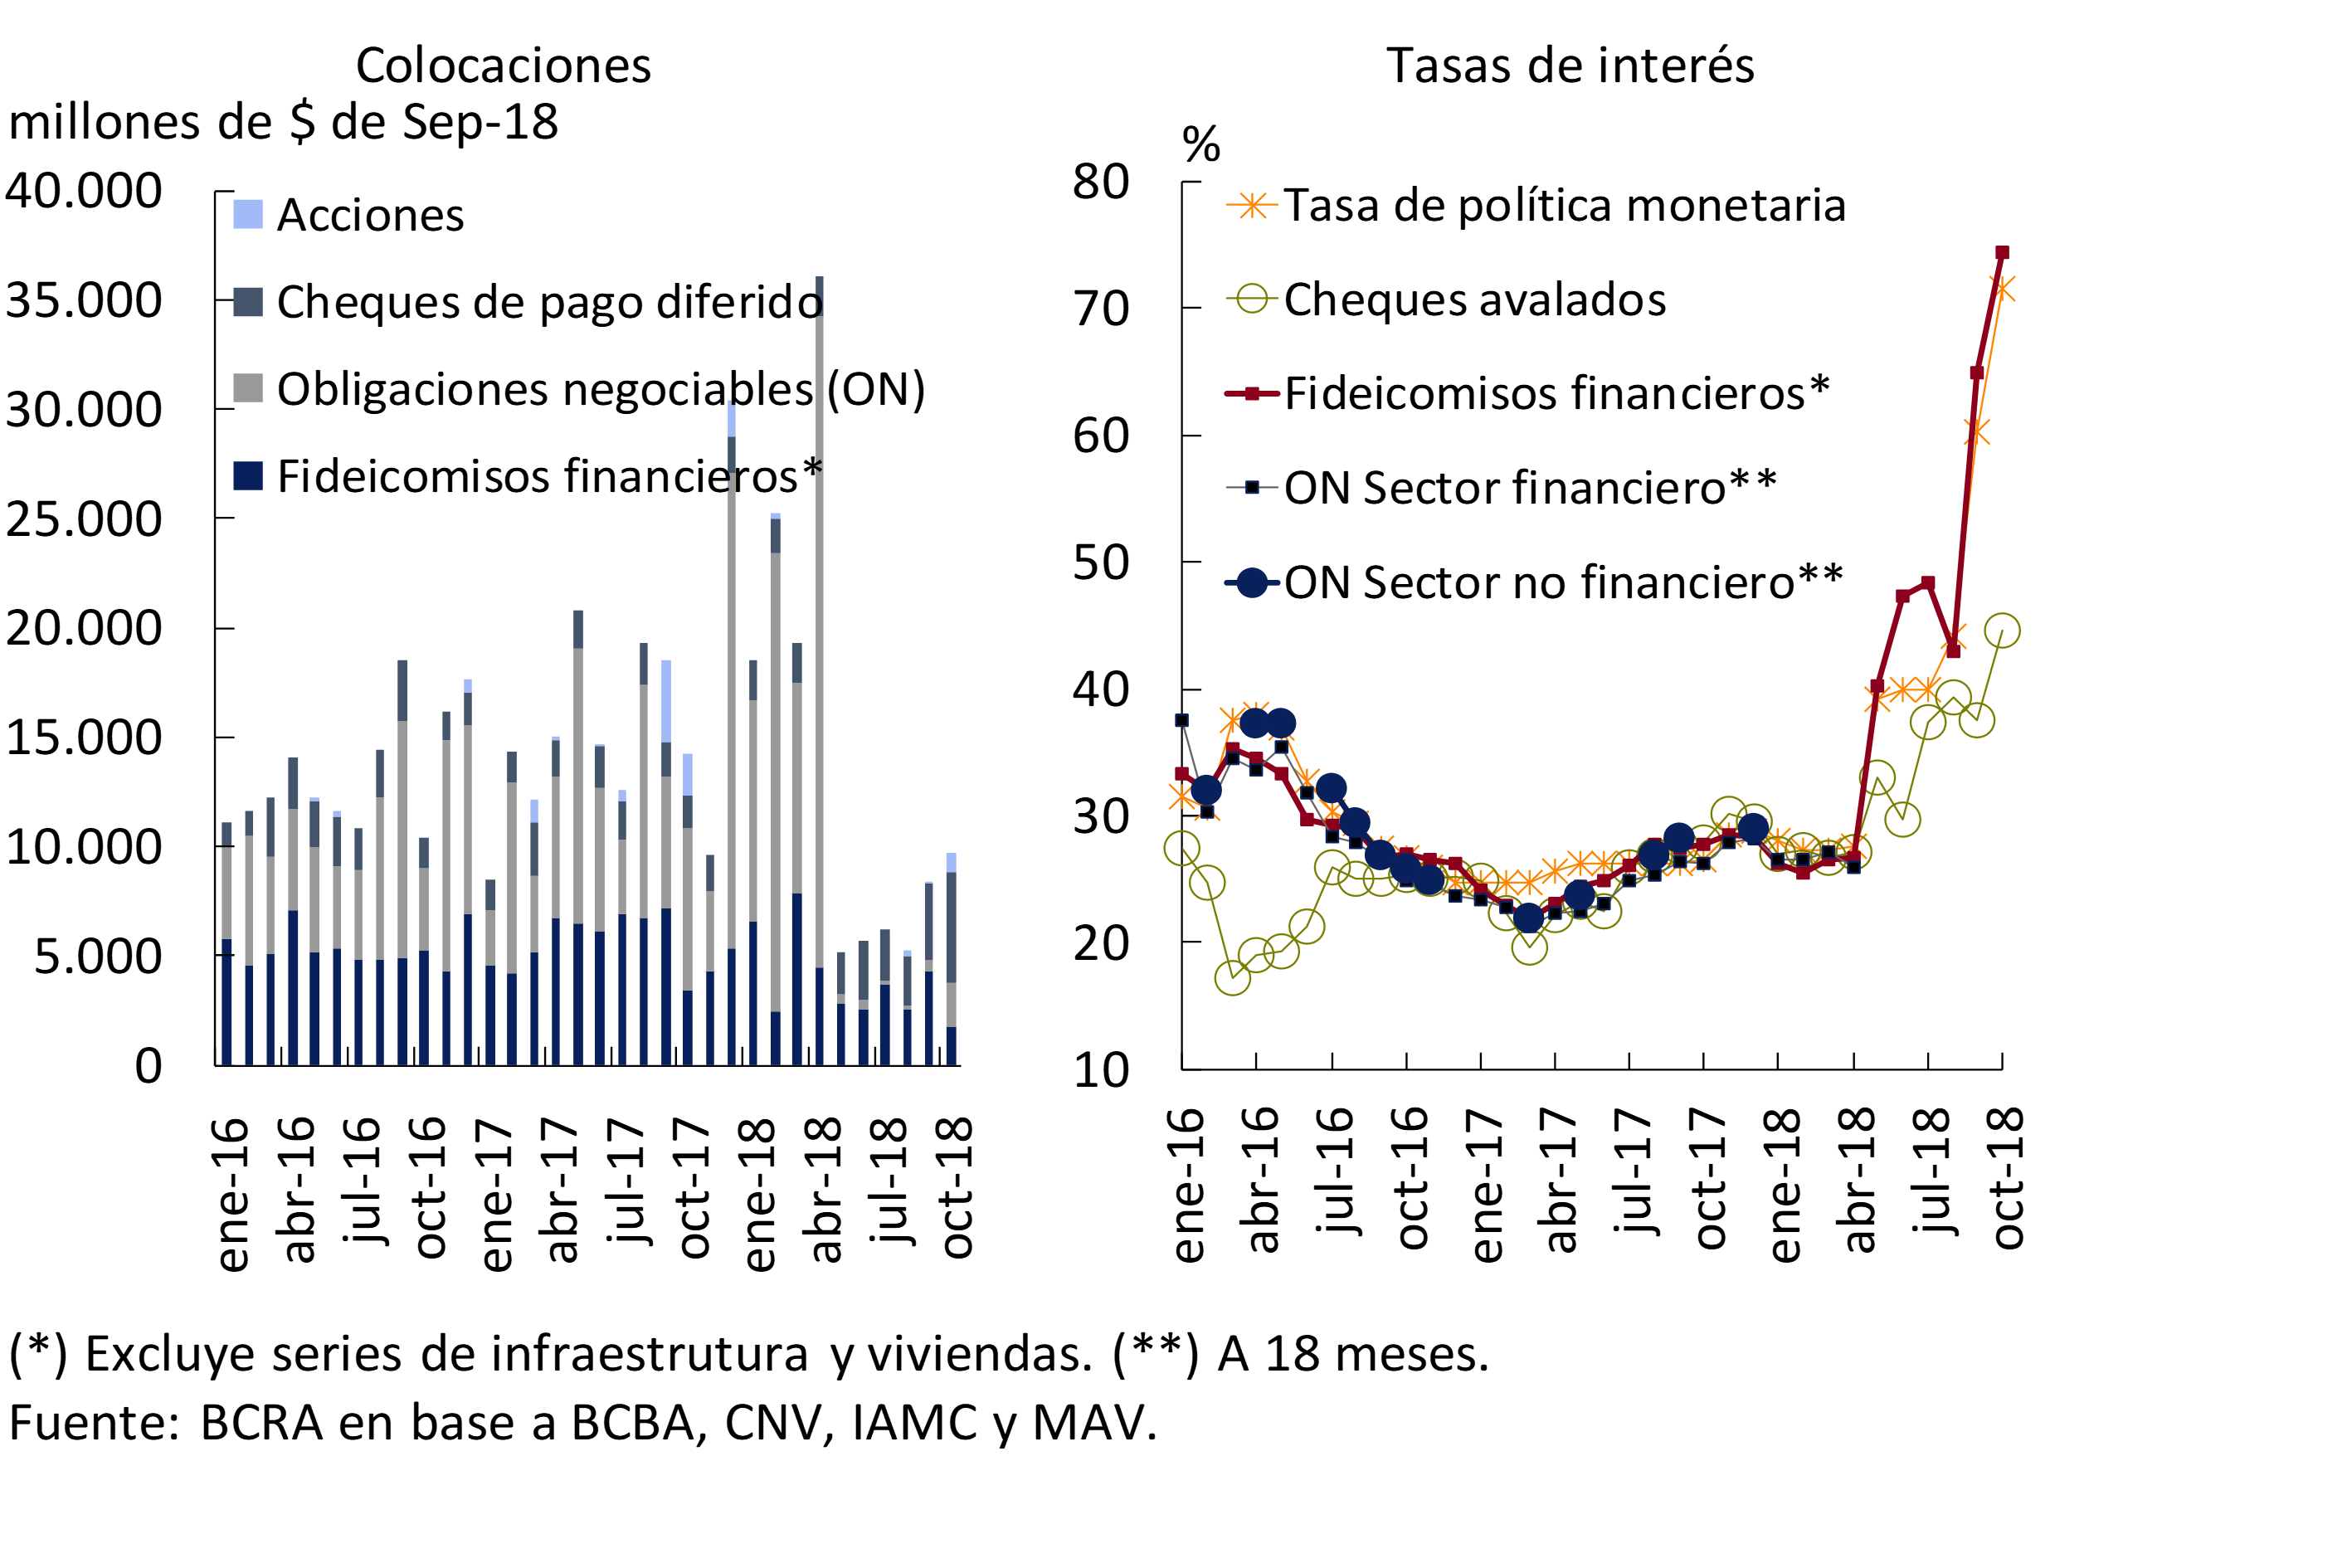
Financing to the private sector through the domestic capital market was particularly affected starting in April (see Figure 1.5), with lower amounts and higher interest rates. The average monthly volume of financing came to represent in real terms a quarter of the value observed during the first four months of 2018. This fall is mainly explained by the market for negotiable bonds, where very few operations were verified from May to the end of October, largely due to the slowdown in placements in the financial sector (see Chapter 2).
Figure 1.5 | Private Sector Financing – Local Markets
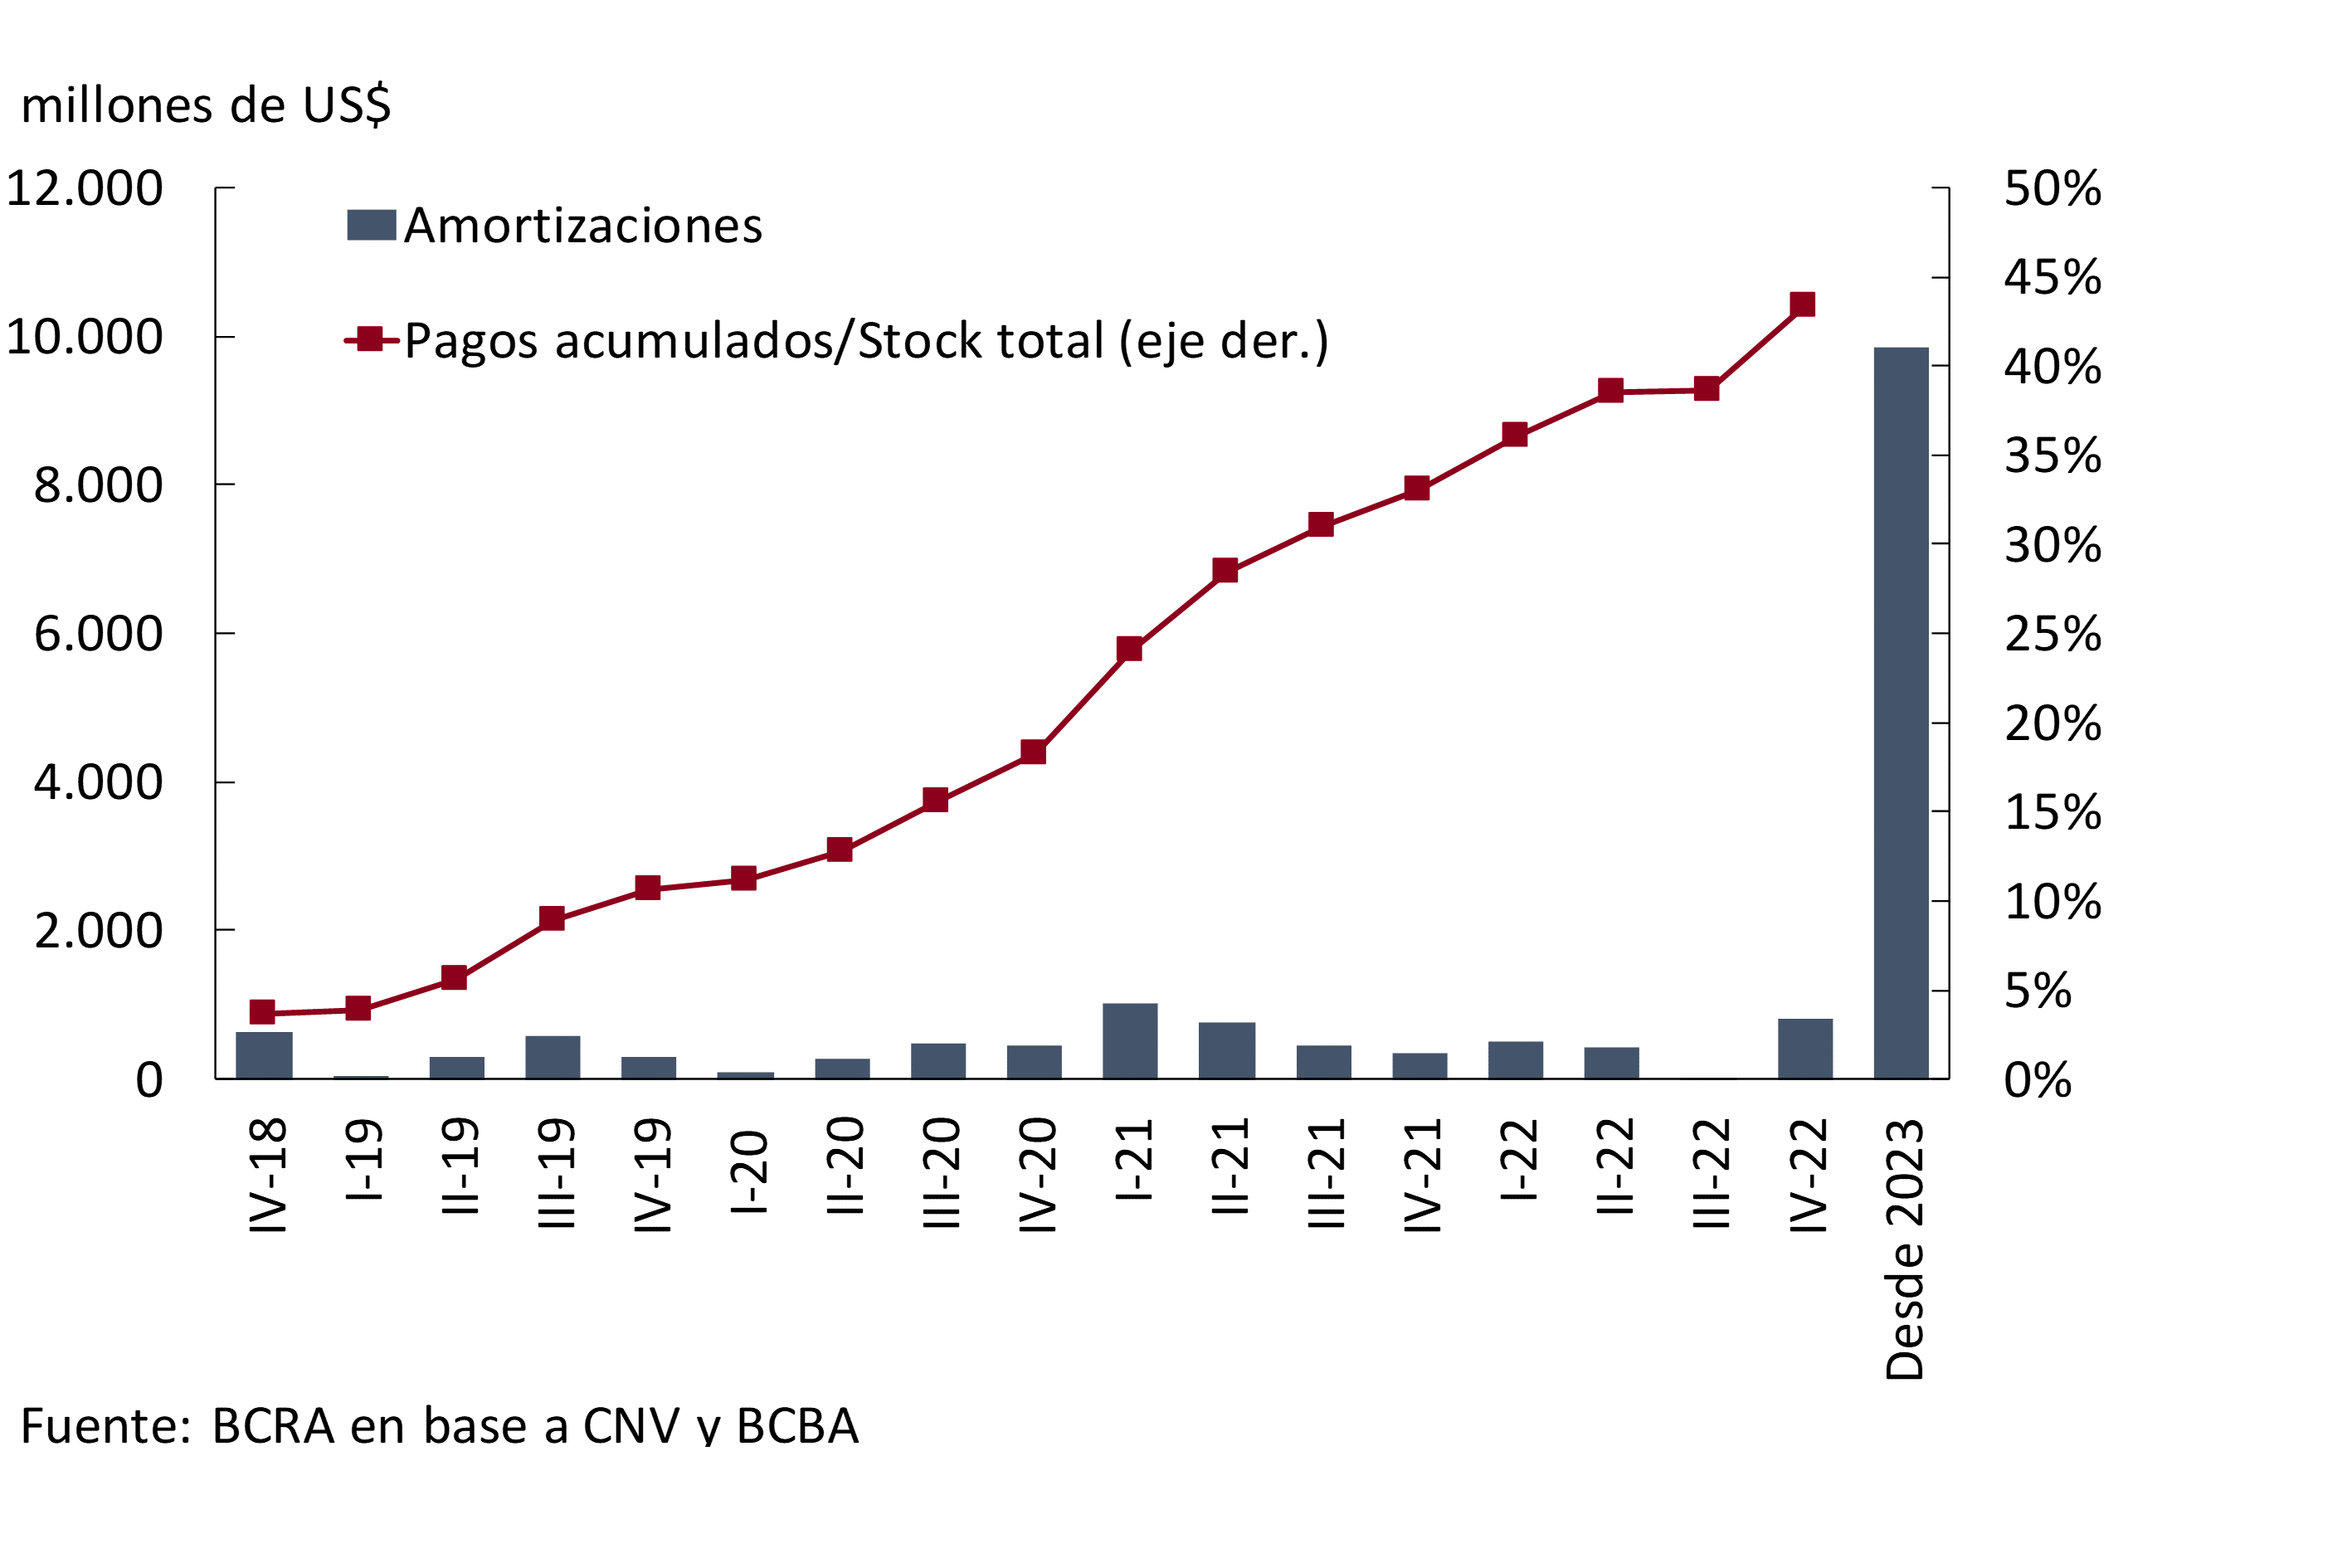
In this context of greater volatility in the exchange rate and increases in interest rates, if the balance sheets of companies with public offerings as of June 2018 (latest available information) are analyzed, it can be seen that the corporate sector shows a mixed variation in its financial ratios until that month (See Table 1.1). Until June, there has been a generalized, albeit slight, increase in the leverage ratio and, in the specific case of companies with dollar bonds placed in international markets, an increase in the mismatch of currencies measured against their assets. 6 However, several of the companies with international bonds have income in foreign currency (natural hedging) and the horizon of amortizations of bonds in foreign currency is relatively clear for companies in the coming years, due to the refinancing operations of liabilities carried out in 2016-2017 (See Figure 1.6). 7
Table 1.1 | Financial indicators of publicly traded companies
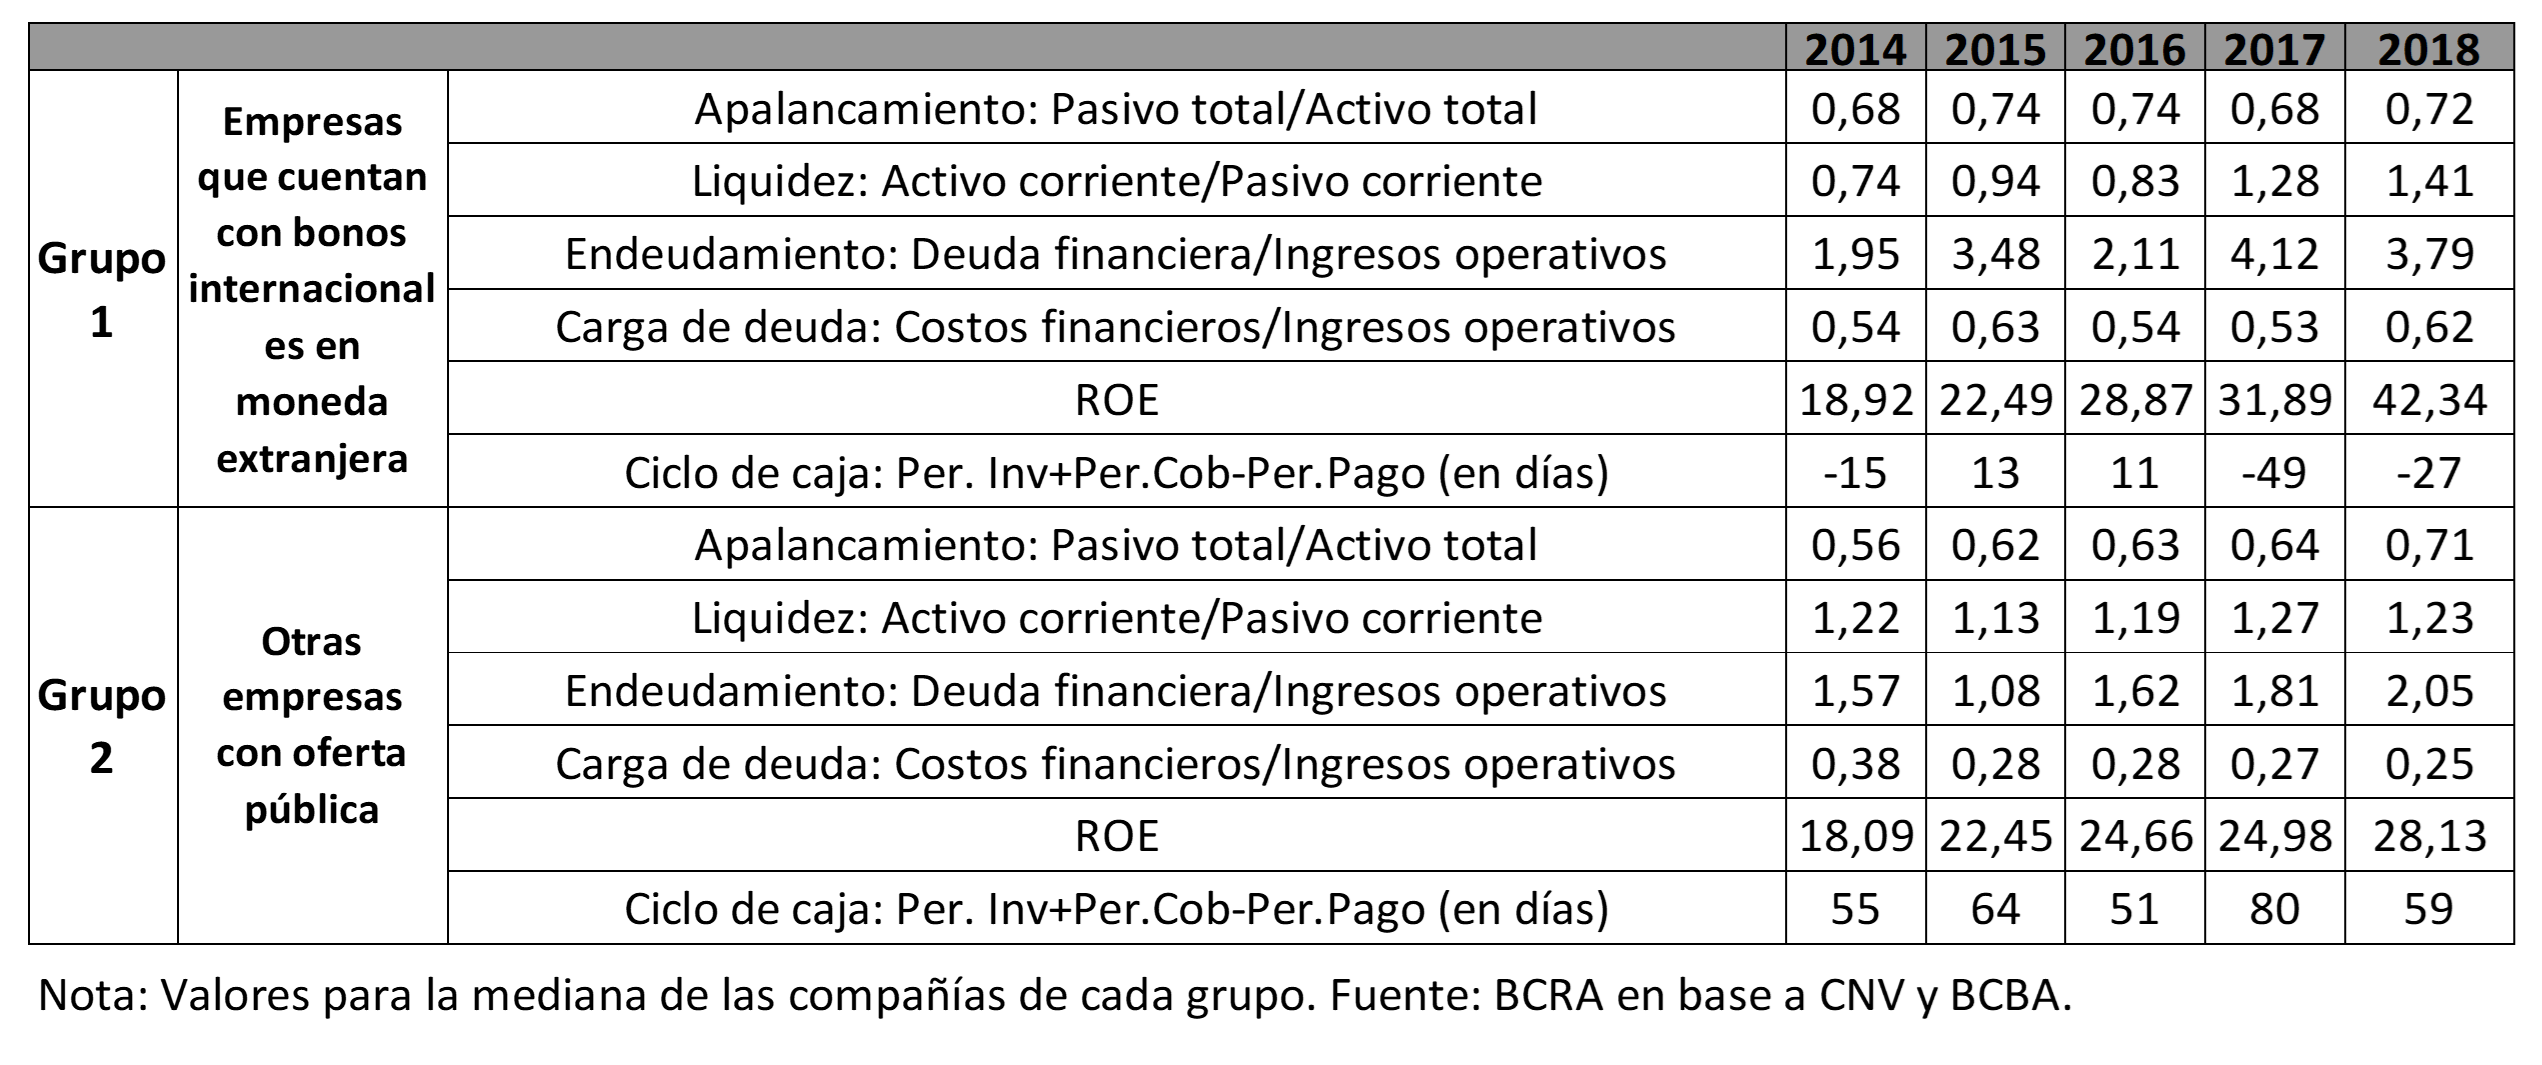
Figure 1.6 | Scheduled redemptions of foreign currency ON
2. Situation of the financial system
In a context of high exchange rate tension, falling economic activity and accelerating inflation – with the consequent tightening of the BCRA’s monetary policy – the financial system has slowed down its intermediation activity markedly since the second quarter of 2018, while maintaining relatively high levels of liquidity and solvency and limited exposures to intrinsic risks. Changes in the composition of the system’s balance sheet reflected the effects of a relatively better nominal return on deposits than loans. The behavior of private sector deposits was relatively favorable in view of the adverse macroeconomic context in which the sector operated (see Chapter 1). Within the framework of the prudential regulatory scheme developed by the BCRA, these behaviors are consistent with a perception of the strength of the financial system by the public (see Chapter 3). The growth of credit to the private sector began to weaken from the middle of the second quarter of 2018. The financial system retains high levels of solvency, although in the second and third quarters of 2018 the regulatory capital integration ratios decreased, reflecting the effects of a growth in risk-weighted assets (due to credit exposures with the private and public sectors) above the evolution of capital. The nominal profitability of the financial system increased in recent quarters, mainly due to higher income from securities and items associated with the variation in the exchange rate. So far in 2018, the year-on-year increase in nominal ROE was lower than the increase in inflation. The sector continues to face the challenge of improving its efficiency levels.
2.1 Slowdown in lending and favorable performance of deposits in view of the adverse context
In a scenario of increasing volatility in the foreign exchange market, greater inflationary pressures and a fall in economic activity in recent months (see Chapter 1), banks’ financial intermediation with the private sector showed a relatively moderate performance in both loans and deposits. Between March and September, the growth rate of deposits in pesos and foreign currency of the private sector slowed down, especially those of individuals. This performance began to reverse as of October, with a significant growth in private sector term loans. 8 This occurred within the framework of the measures taken by the BCRA in terms of increases in policy interest rates and the remuneration of reserve requirements for new fixed-term deposits, improving the transmission mechanism between the policy interest rate and passive interest rates. 9 In general, the performance of private sector loans since the second quarter of 2018 should be interpreted as a positive sign regarding the public’s perception of the sector’s soundness and its ability to withstand adverse shocks (see Chapter 3), as well as the financial policy measures adopted in a timely manner.
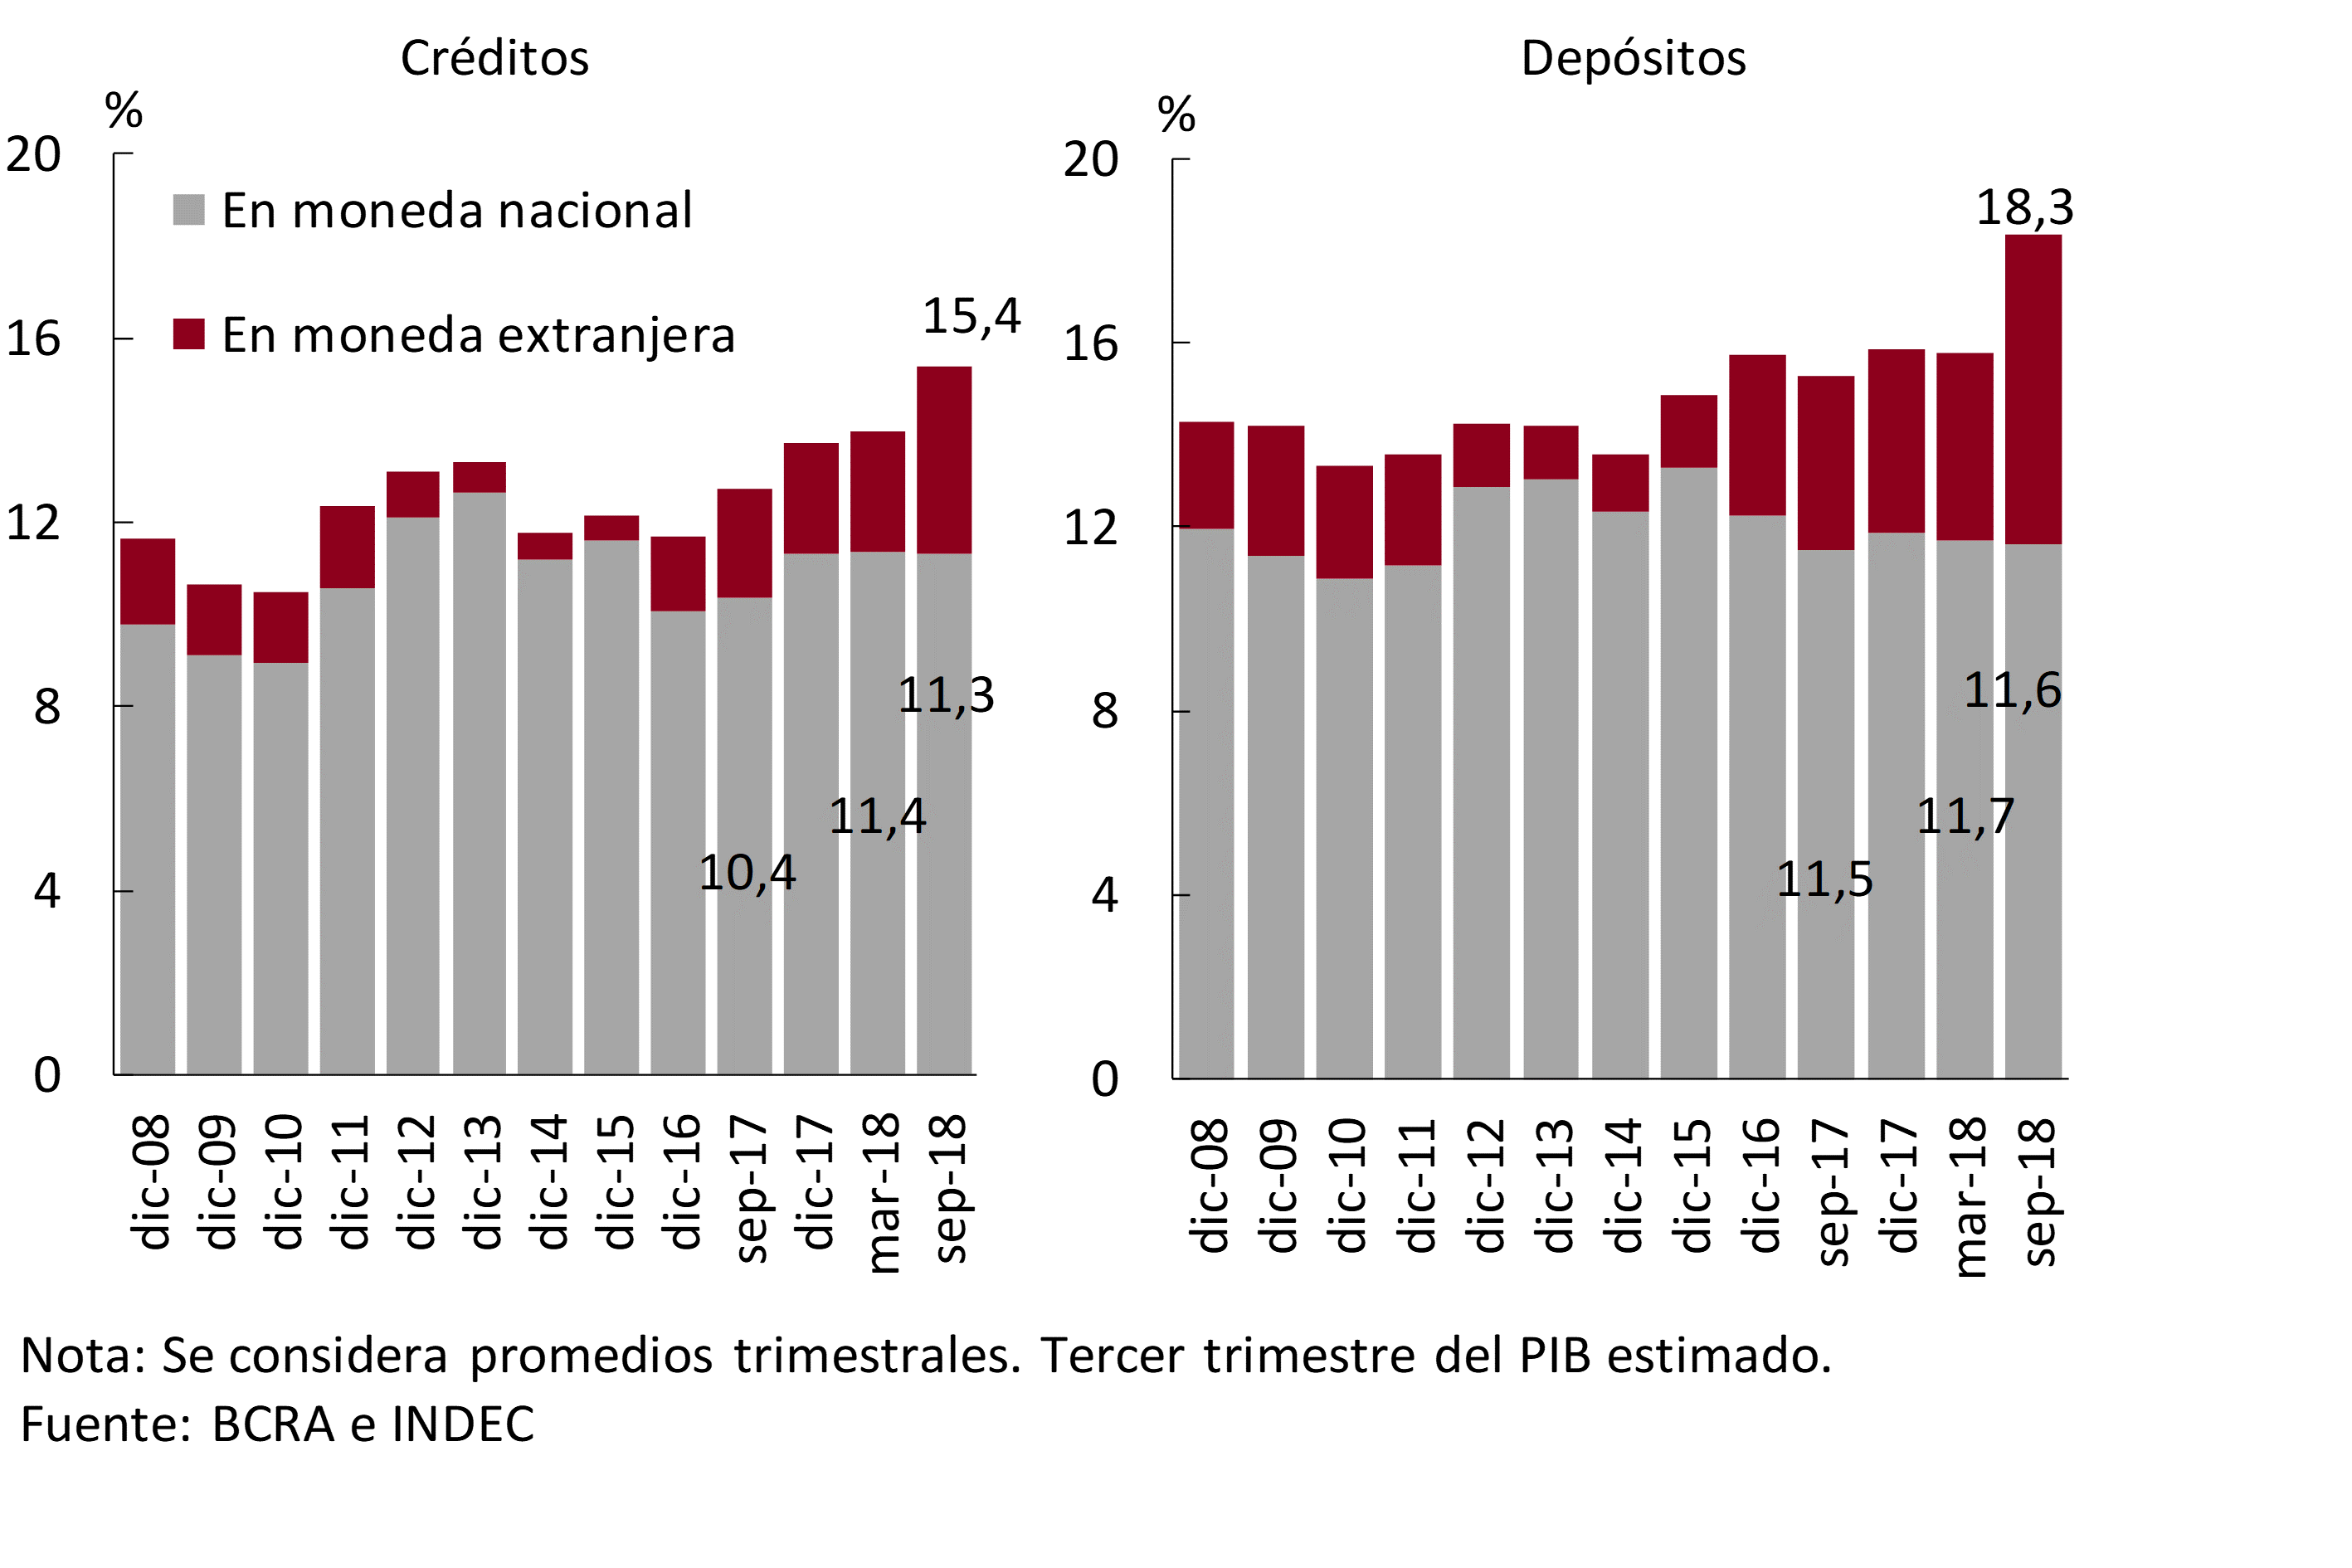
The estimated levels for the credit and total deposit ratios (including items in pesos and foreign currency) of the private sector in terms of GDP for the third quarter of 2018, show a year-on-year growth in the context of a significant depreciation of the peso and a fall in the level of activity. If local currency items are considered, only financing to the private sector registered moderate year-on-year growth in terms of GDP (see Figure 2.1).
Figure 2.1 | Brokering with the private sector – As % of GDP
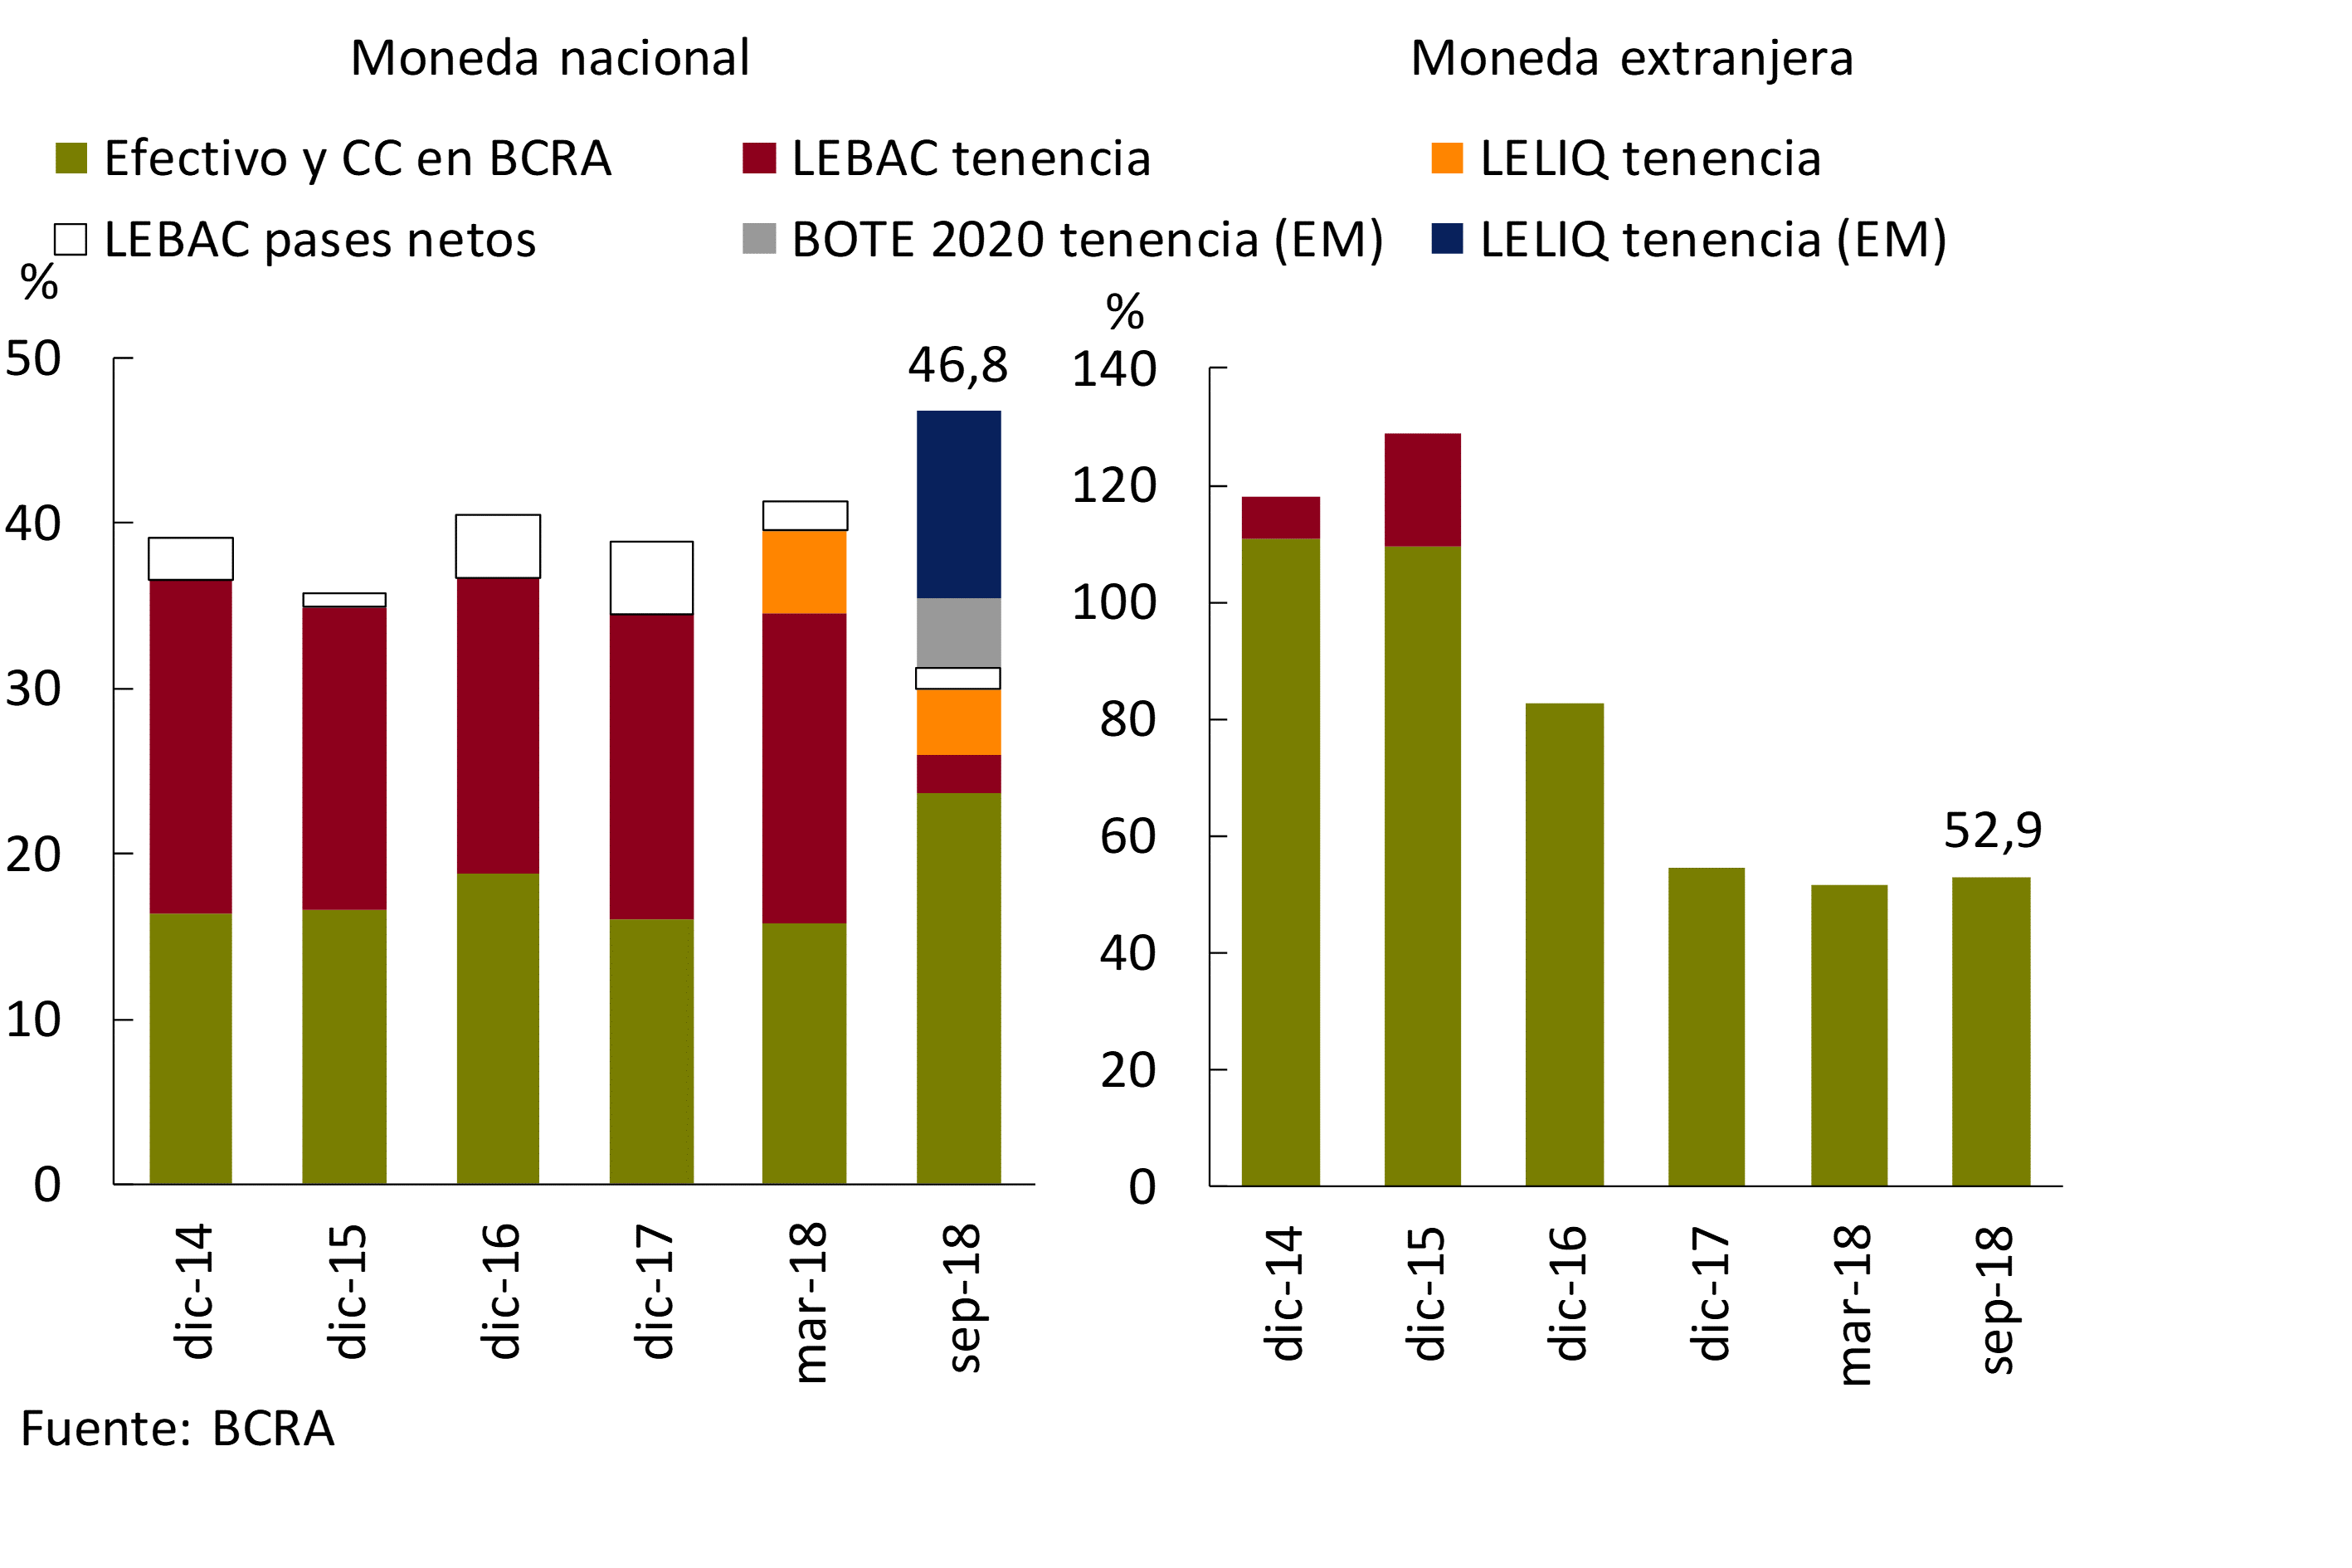
The structure of the balance sheet (influencing the configuration of risk exposures and hedges), given the context and policy changes, showed some significant changes since the last edition of the IEF (March 2018). On the asset side, given the increases in reserve requirements observed since last June and the measures implemented by the BCRA, there was a change in the level and composition of the most liquid assets of financial institutions (see Table 2.1). 10 The liquid assets of the financial system that do not include monetary regulation instruments increased their weighting in assets to almost a quarter of them at the end of the third quarter of the year. The holdings of LEBACs held by banks decreased significantly in terms of assets compared to March, while the holdings of LELIQ increased in recent months. Credit to the private sector lost relative weight in recent quarters, reaching a share of just over 45% in September. 11
Table 2.1 | Equity situation – Financial system
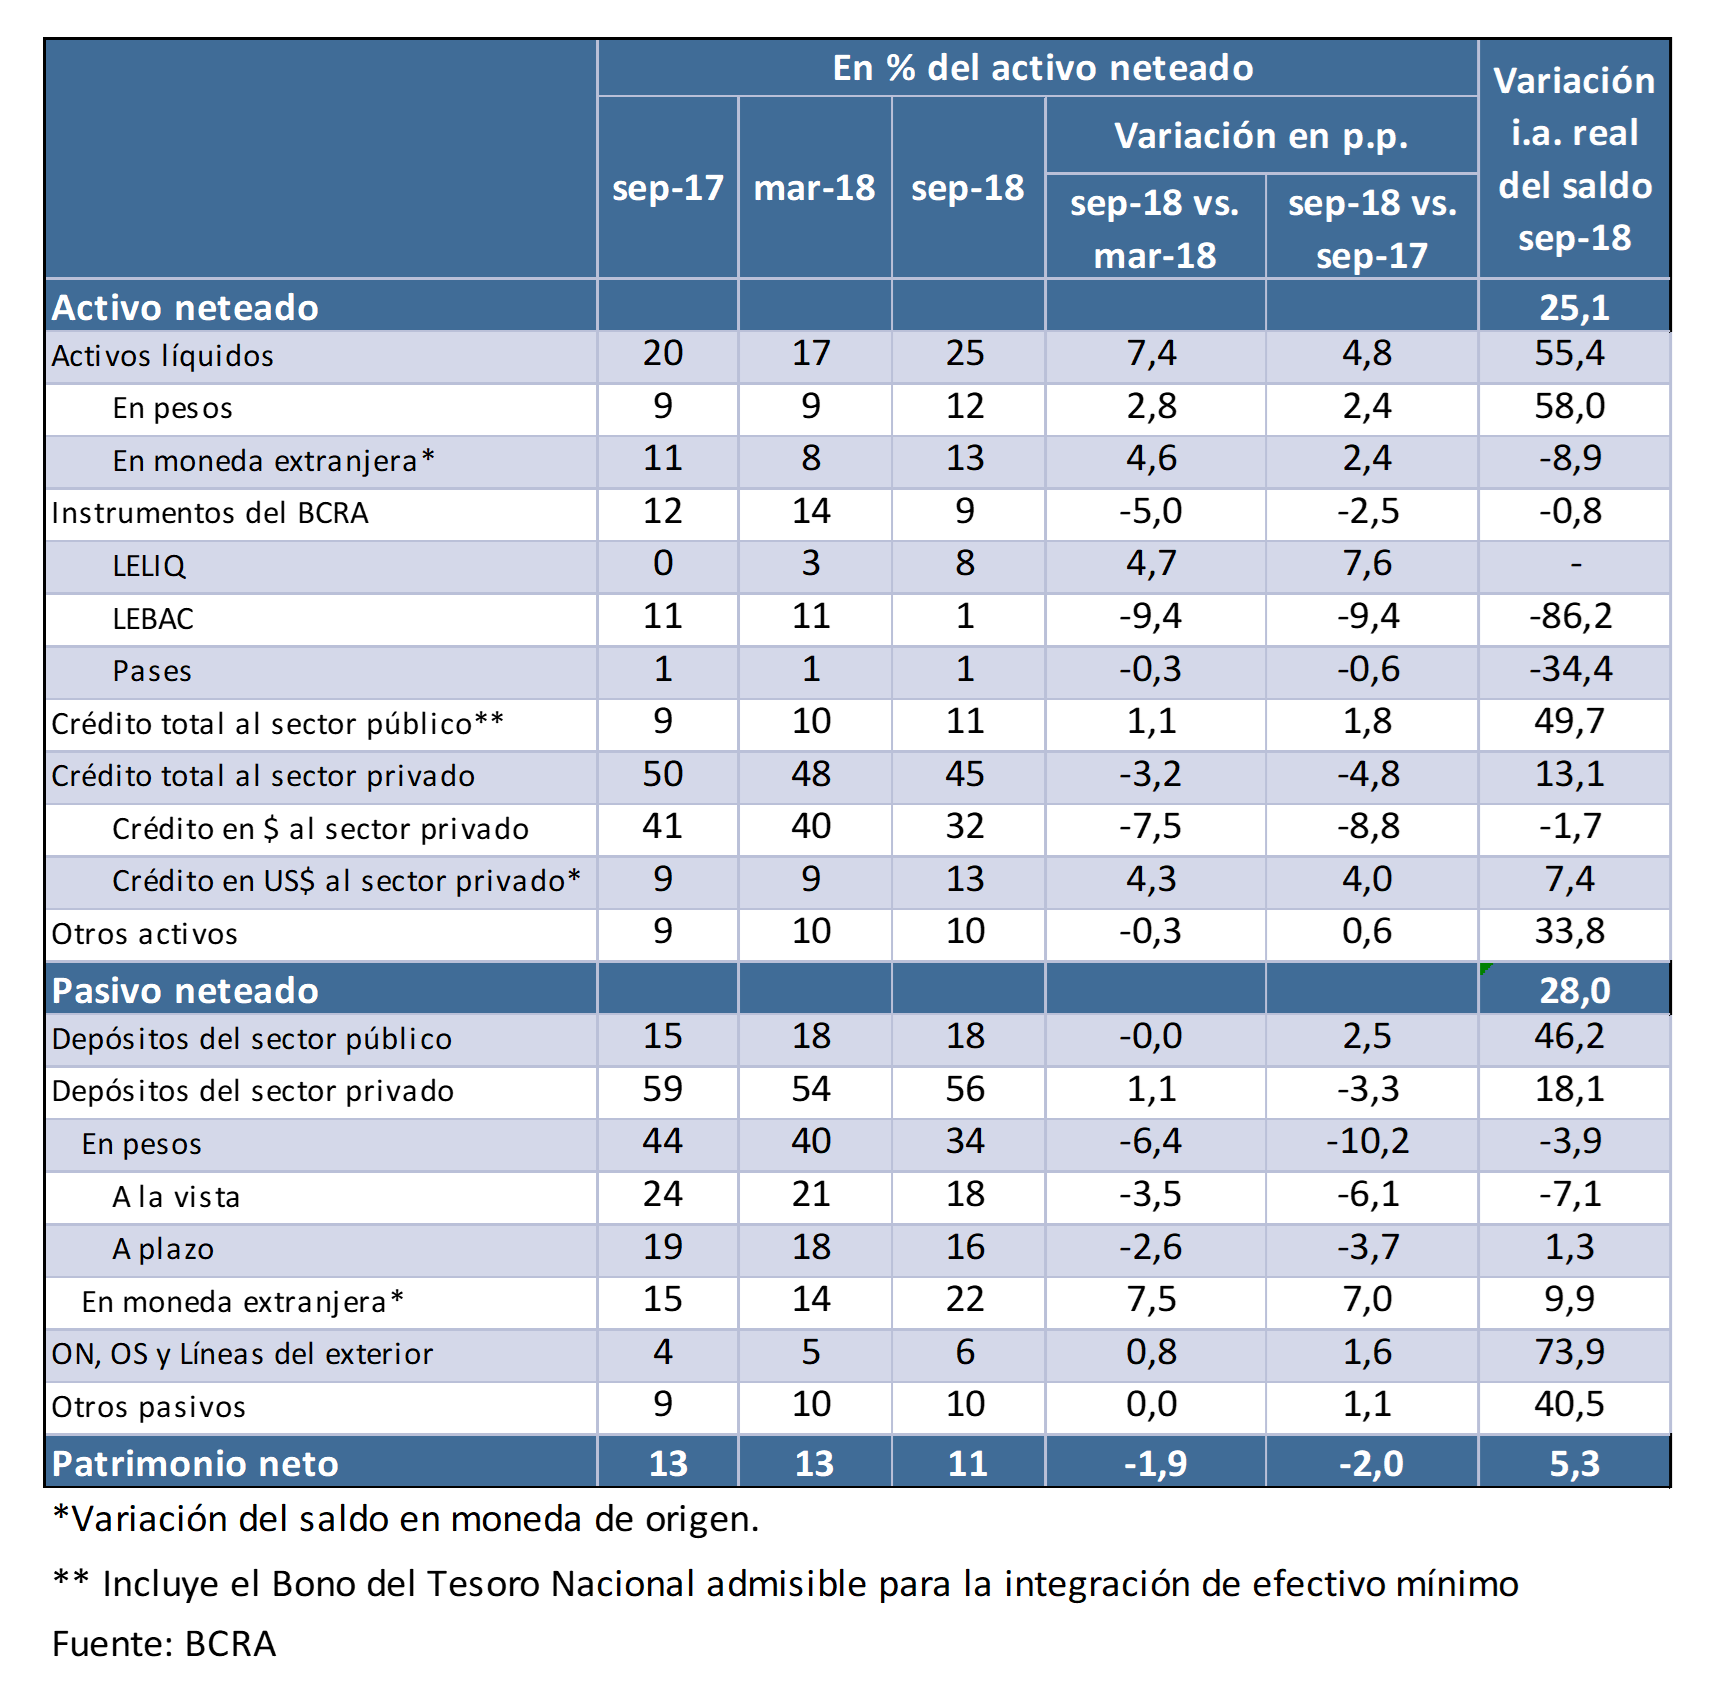
On the liability side, the share of total deposits (in domestic and foreign currency) of the private sector in the assets of the financial system increased slightly compared to March levels, with a change in the composition of the margin. In particular, there was a lower relative weight of local currency placements on the system’s balance sheet due to the moderate dynamism of these deposits in the third quarter and the significant increase in the nominal exchange rate. On the other hand, public sector deposits in terms of total assets increased their weighting in a year-on-year comparison. The aforementioned depreciation of the peso in recent months was also reflected in a slight increase in the relative share of alternative sources of resources for the system (ON, OS and foreign lines). In the particular case of non-commissioned bonds, in the face of a scenario of more restrictive financial conditions, between April and mid-October 2018, entities with practices in this type of funding did not make new placements (see Section 2).
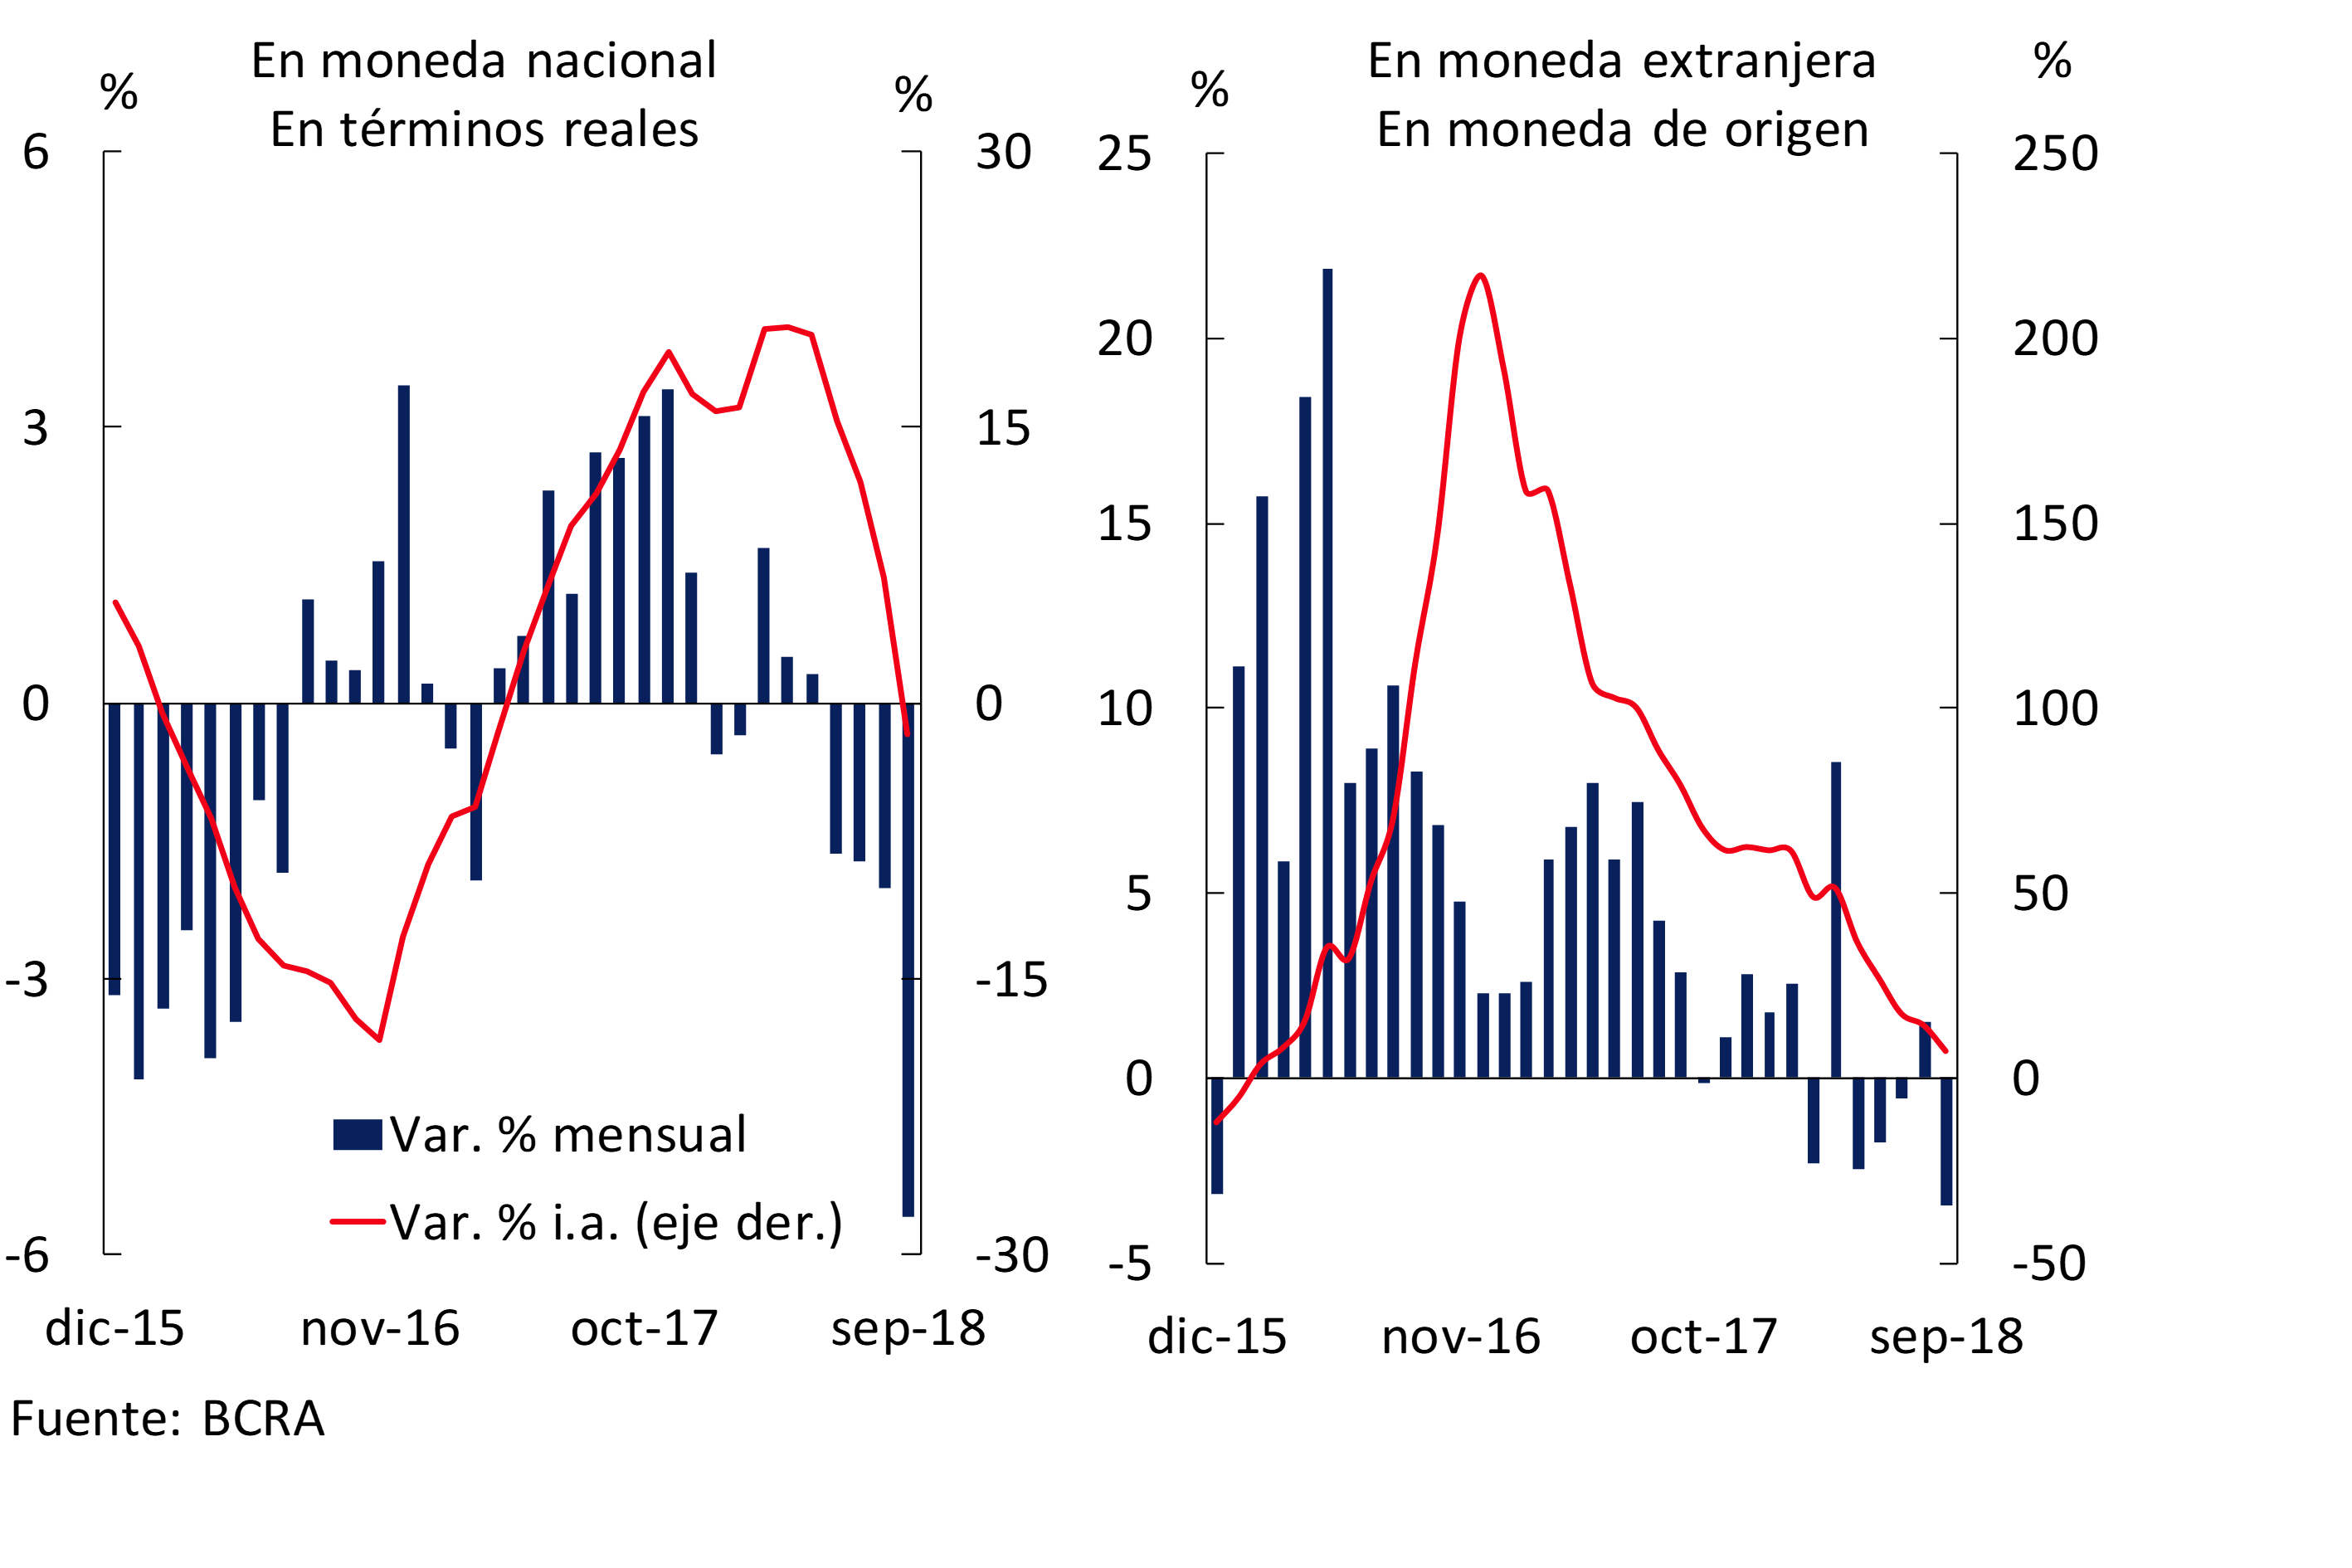
In terms of the dynamics observed in recent months of the main items of the balance sheet, it is worth mentioning first of all that the growth of the balance of bank credit in pesos to the private sector lost strength, registering a year-on-year fall when adjusted for inflation at the end of the third quarter of the year (see Chart 2.2). September marks four consecutive months of real monthly credit decline. The slowdown observed in the real year-on-year growth rate of loans in national currency channelled to companies and households was widespread among all groups of financial institutions (being more significant in non-bank financial institutions and national private banks) and among the different credit lines. Commercial lines in pesos show year-on-year declines at the end of the third quarter, impacting both the resources channeled to large companies and SMEs (see the regulatory framework applicable to financing this sector in Box 2). On the other hand, foreign currency financing maintained a positive year-on-year growth – in the currency of origin – in September, a performance driven by the commercial segment.
Figure 2.2 | Total credit balance to the private sector by currency
Box 2. Regulations related to financing MSMEs
The BCRA regulations present a set of guidelines that seek to address different aspects of the problem of MSME credit, within the general framework provided by the prudential regulation in force for the financial system. Within this group, the financing belonging to the retail portfolio – which includes loans to MSMEs of up to the equivalent of 1 million euros, in line with international standards – which in general tend to be more fragmented and provide greater credit diversification to banks, are subject to a weighting of 75%. lower than that applicable to assistance channeled to other types of companies (weighting of 100%) (Minimum Capitals of Financial Institutions). For its part, it is allowed that the amount of the Minimum Cash requirement can be reduced depending on the weighting of financing to MSMEs in the total credit to the private sector of the entity, with a maximum of 3.6 percentage points of the requirement in pesos. Likewise, some specific measures have been implemented that seek to facilitate access (Credit Risk Fractionation and Credit Graduation), origination (Credit Management) and administration (Debtor Classification) of financing to MSMEs, resulting in a relative improvement in financing conditions.
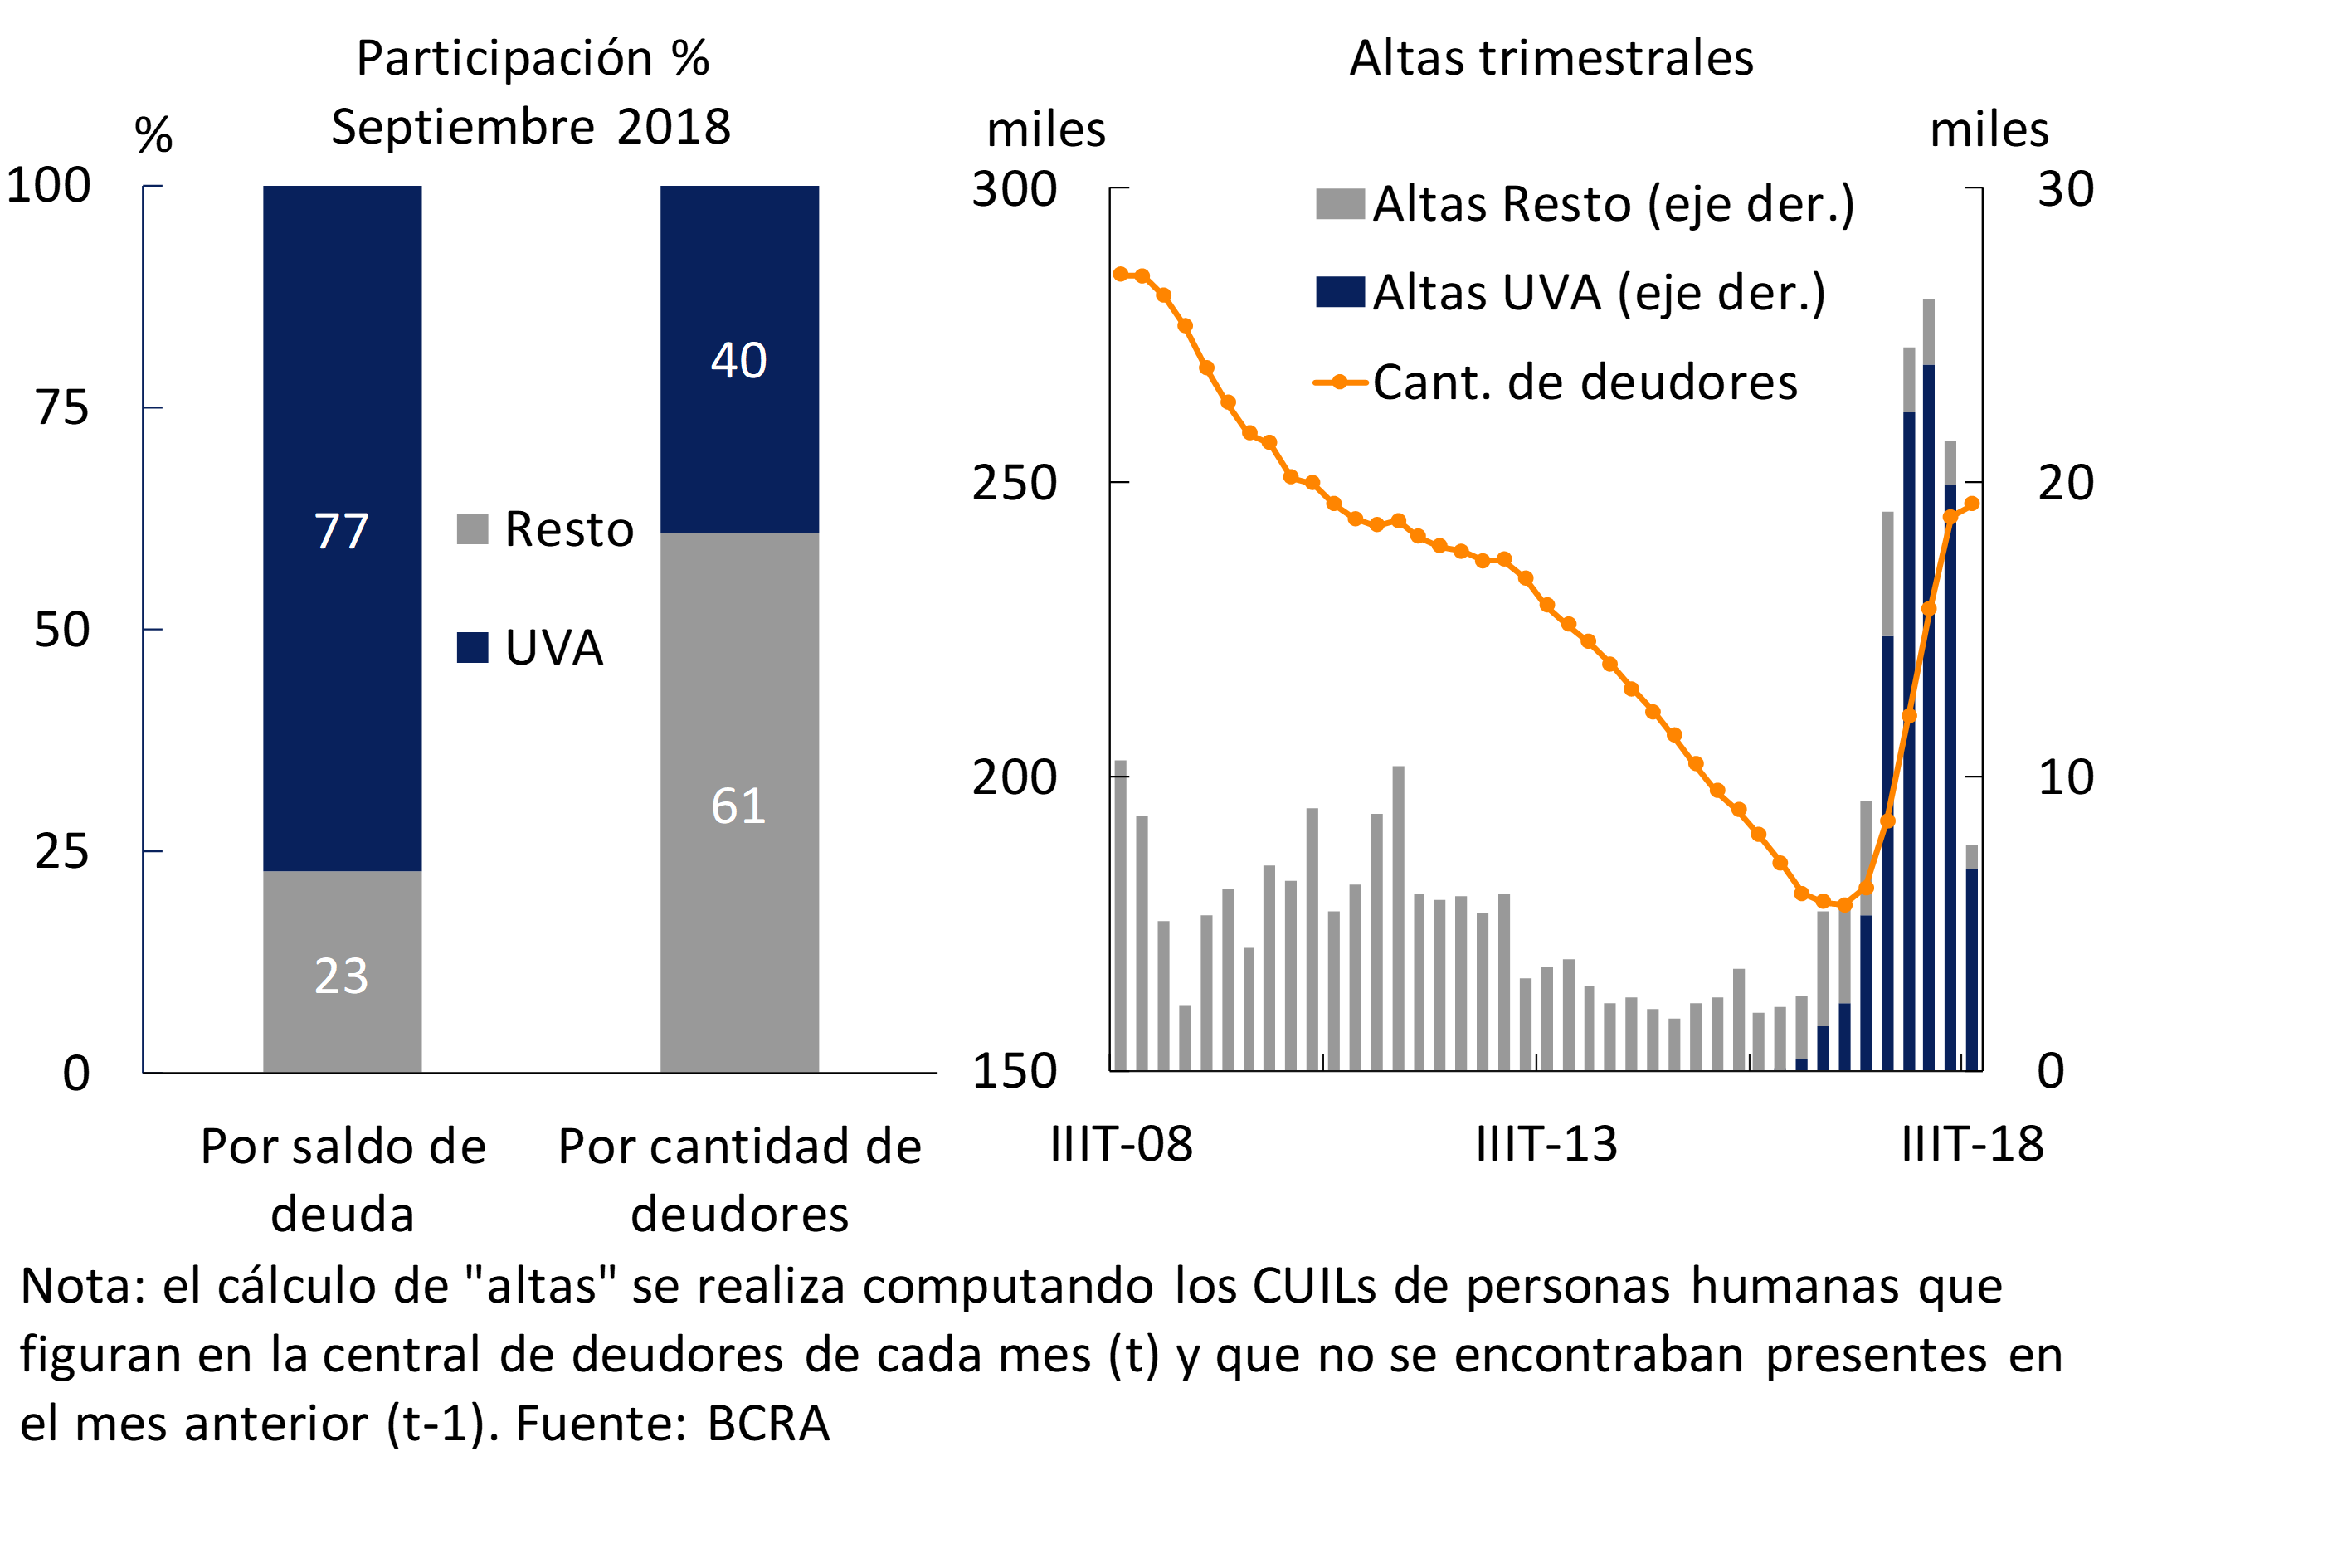
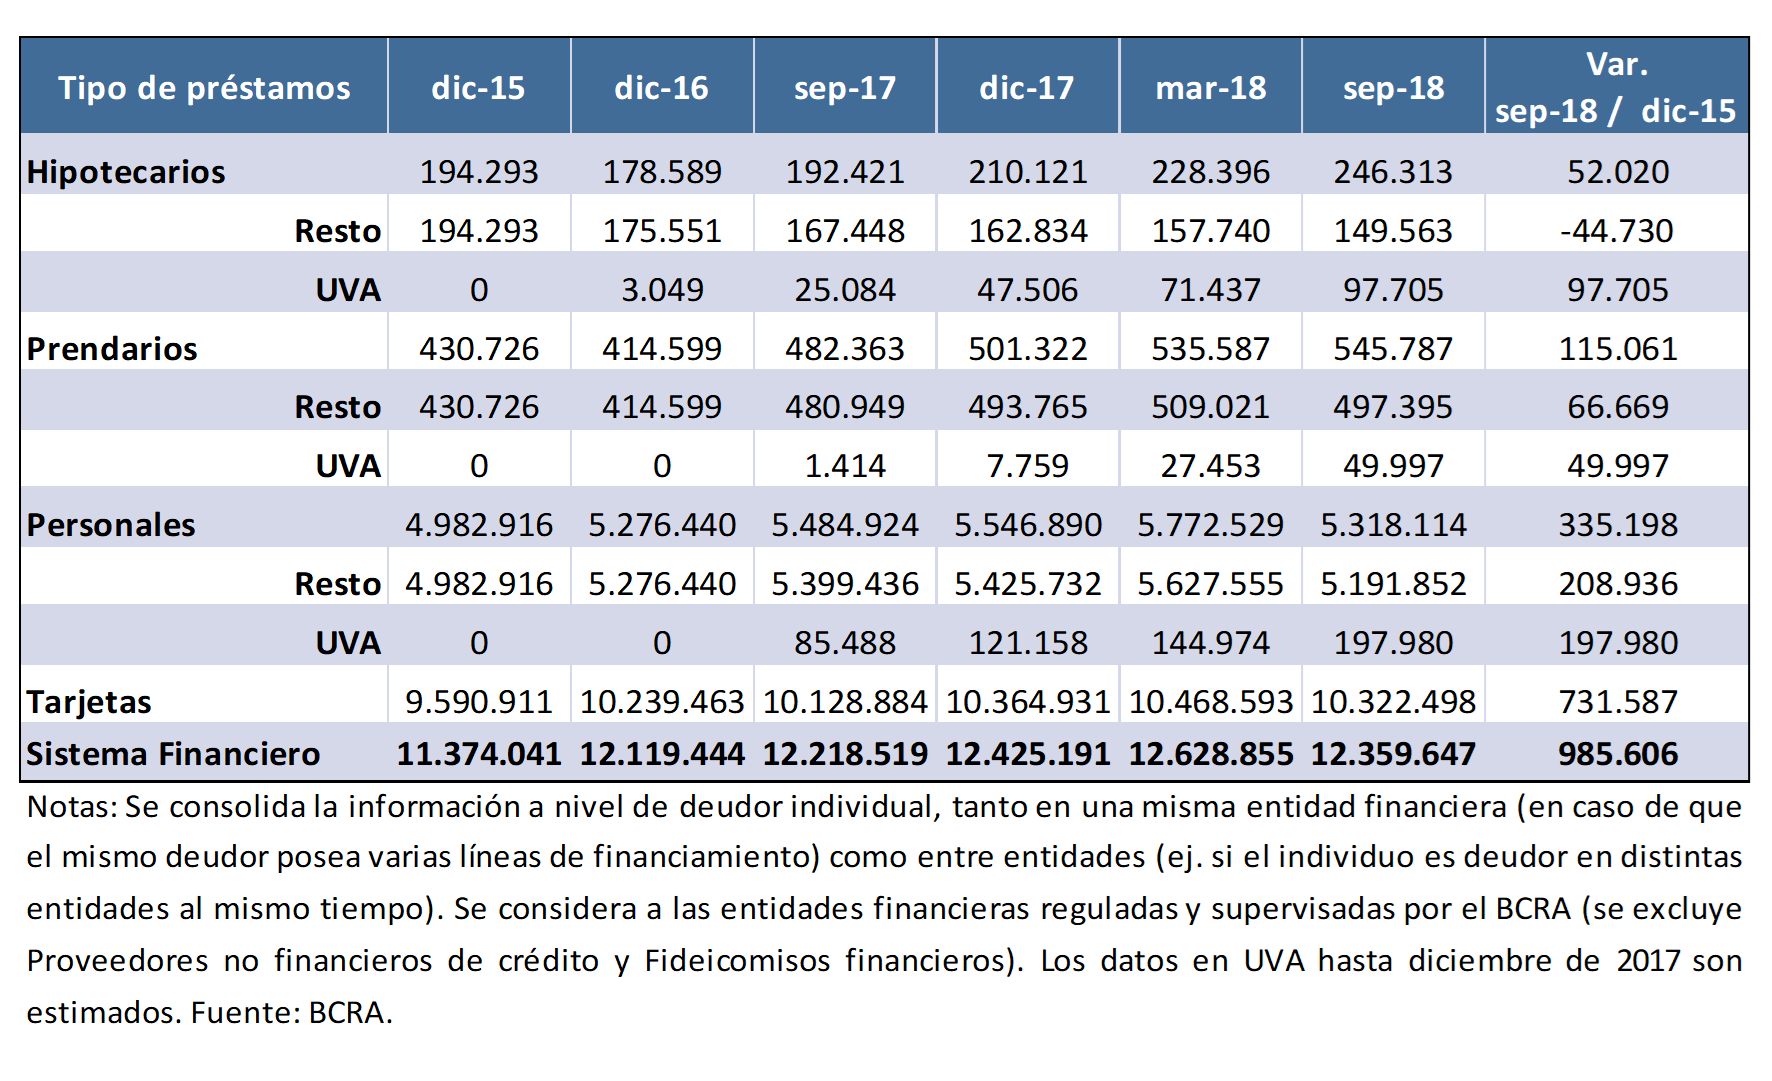
Mortgage loans to households presented a relatively outstanding performance, although as of June they began to moderate the monthly growth rate they had been registering in 2017 and early 2018. This slowdown occurred in a context of greater volatility in the exchange rate, increases in the value of real estate (see Box 3), and some margin constraints made by banks on the standards for approving this type of loan. 12 These loans accumulated a real year-on-year increase of 122% at the end of the third quarter of the year, a variation mainly explained by UVA-denominated financing (see Figure 2.3). In recent months, banks continued to incorporate new mortgage borrowers, although at a slower pace compared to what was observed in the first quarter of 2018 (previous edition of the IEF). 13
Figure 2.3 | Mortgage credit to individuals
Box 3. Home prices in macroprudential monitoring
The introduction of the UVA mortgage loan in April 2016 has facilitated access to housing, by reducing the initial requirement of income in order to constitute a credit subject. Since then, this type of credit has gained momentum, showing a significant growth in real terms not observed in the last 25 years. As mentioned in the IEF for the second half of 2017, the monitoring of the real estate market, together with financing conditions, is of great interest in order to evaluate restrictions on access to housing, analyze the macroeconomic context, and particularly to be able to identify potential sources of systemic financial risks.
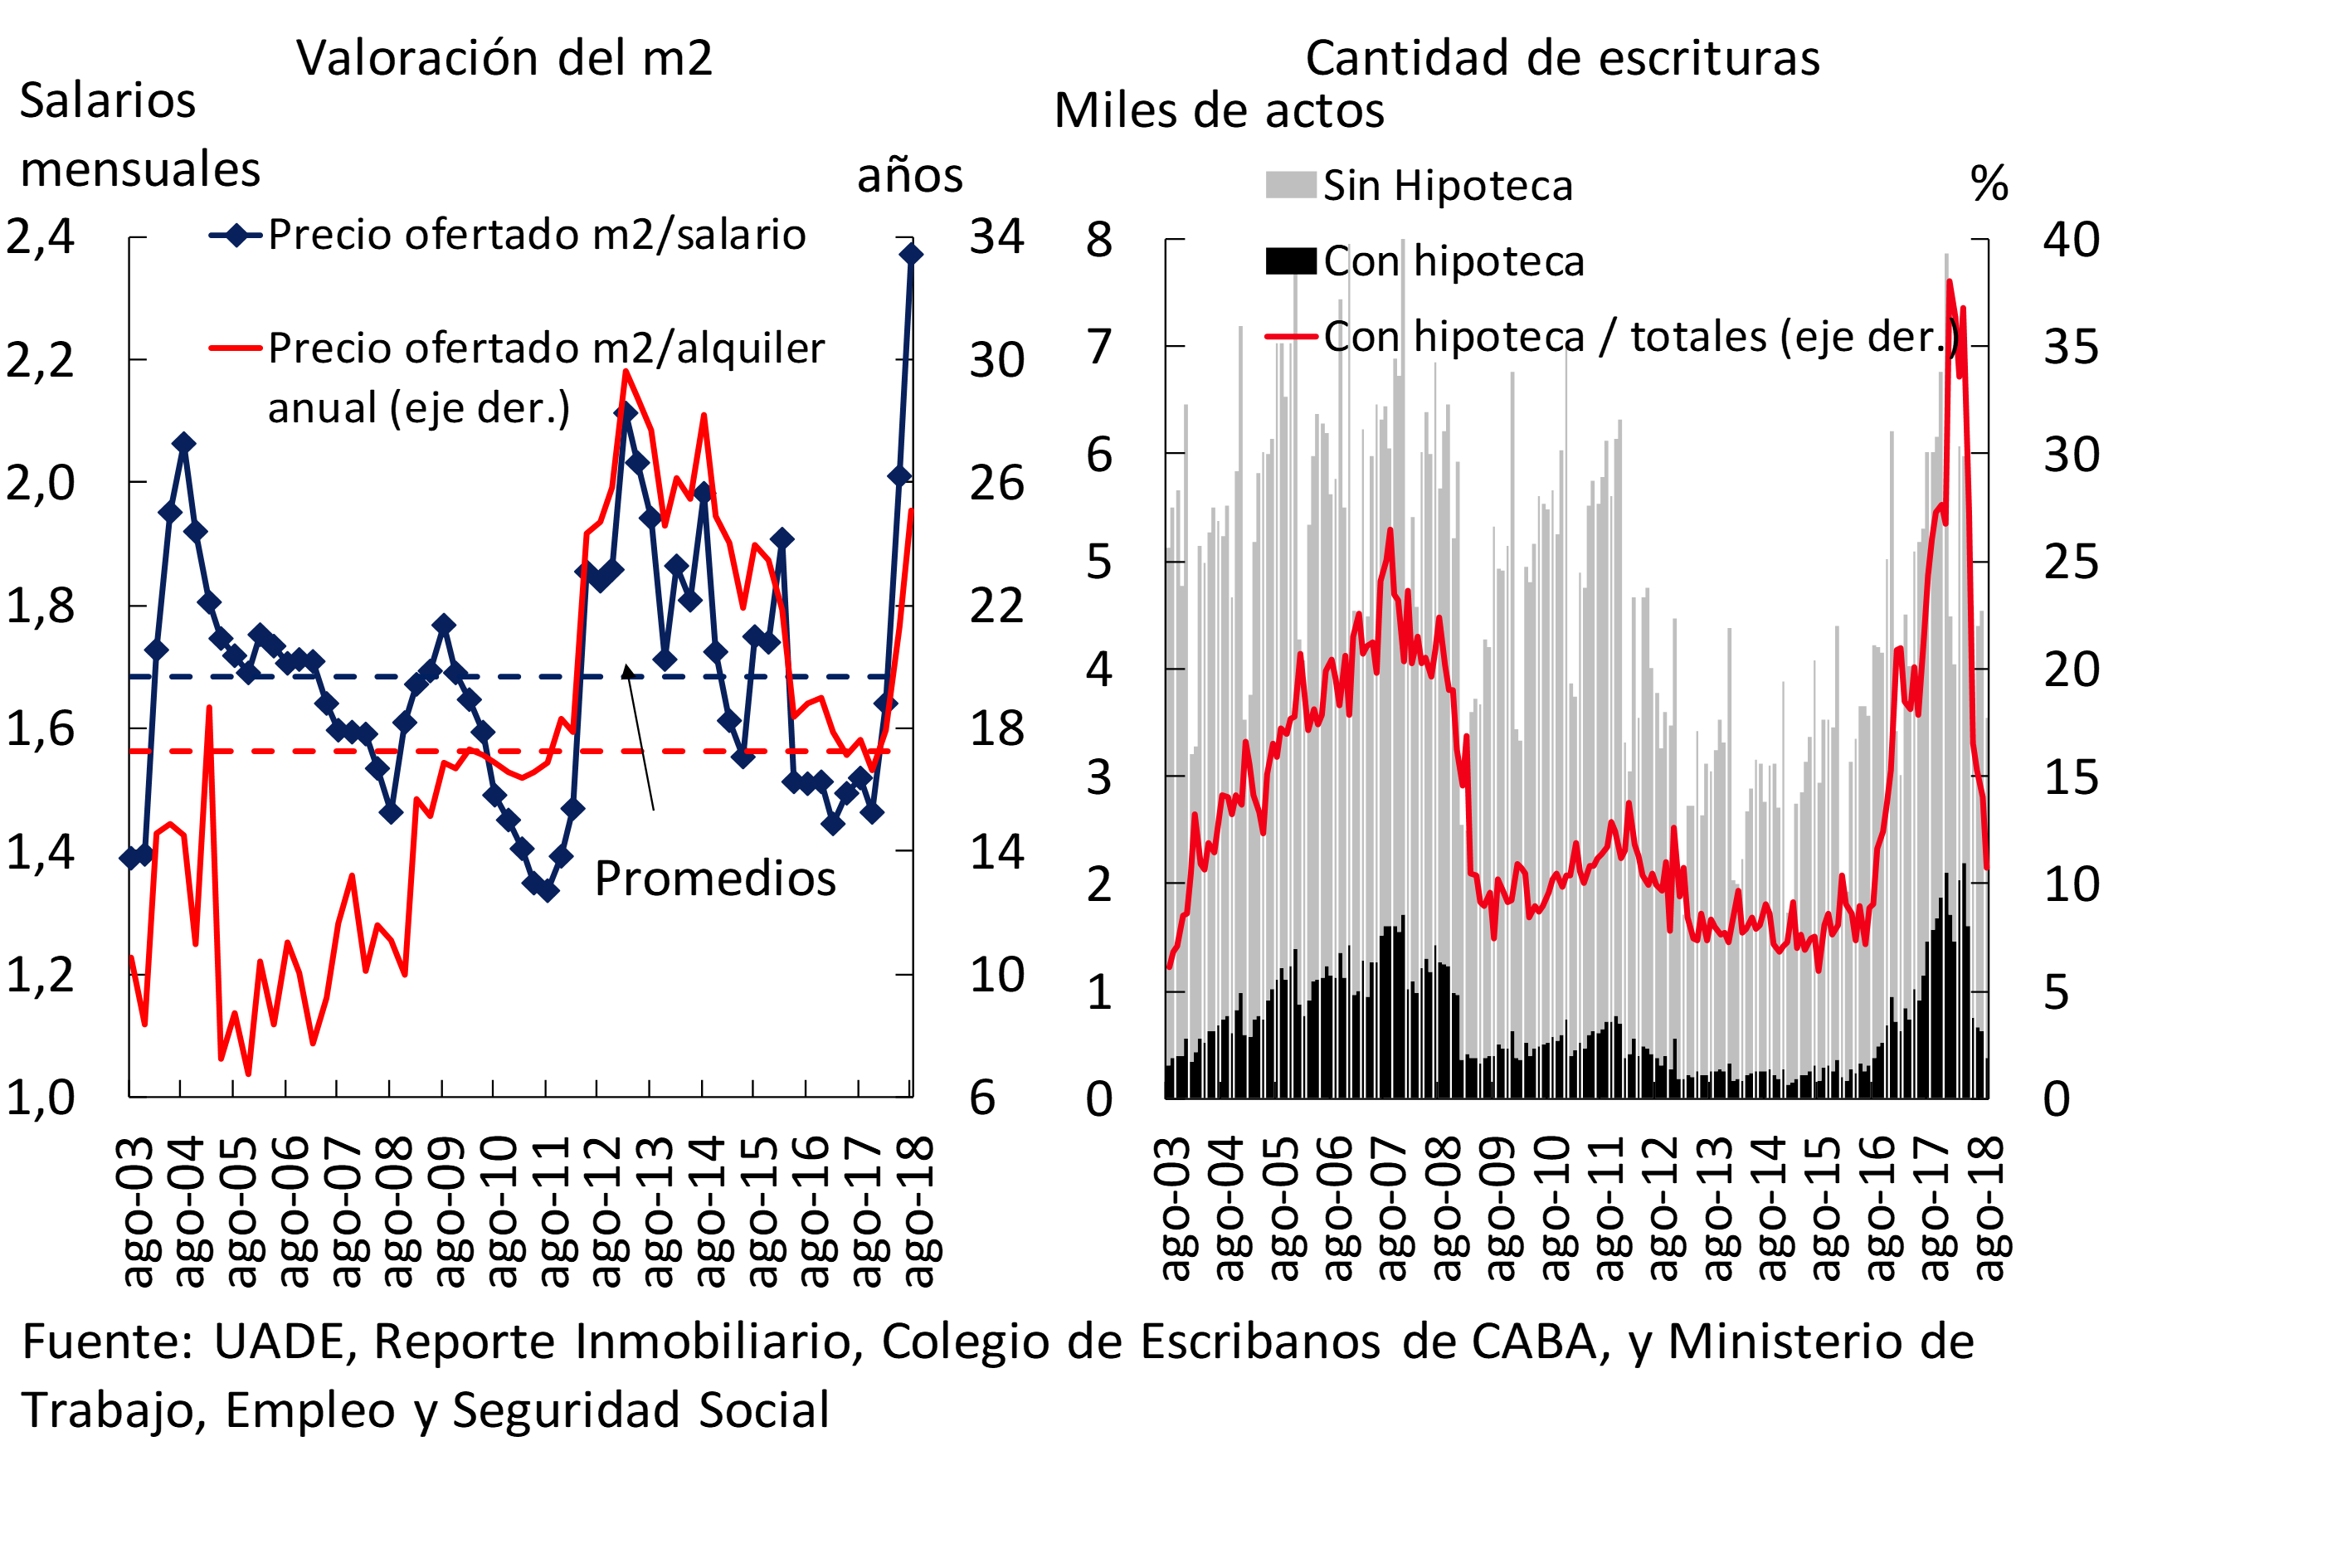
Since the beginning of the period of strong exchange rate volatility (May 2018), house prices measured in pesos at constant prices registered a significant upward trend. Considering the supply price of housing for CABA, the relative valuation indicators show significant increases, reaching high levels compared to previous years. 14 Prices are in a range of high registers both in terms of wages and in terms of rental income (see Figure 2.4). 15 Since the price offered is usually expressed in foreign currency, the real depreciation of the peso against the dollar in recent months largely explained this effect. Under these conditions, purchase and sale transactions, including those with bank mortgages, were reduced (see Figure 2.4). The systemic financial risk associated with this market is low, while mortgage bank credit to households represents only 3.7% of the assets of the financial system. In turn, the non-performing loans of this portfolio are reduced (see Chapter 3).
Figure 2.4 | Prices and operations in the CABA housing market
The future evolution of prices and quantities in this market will depend on the interaction of the different macro-financial variables. It should also be considered that it is a market that operates with a low level of leverage (as of September, mortgage credit to households was close to 1% of GDP), relatively low maintenance costs (taxes and inherent services) and high transaction costs (for purchase and sale). Likewise, there is a lag between the construction stage and the sale of a unit that can be applied to a mortgage.
The total number of individuals who remain debtors to the financial system as of September registered a decrease from the level observed at the beginning of 2018 (see Table 2.2). In particular, between March and September, the number of borrowers of title and mortgage loans increased and fell in the rest of the lines.
Table 2.2 | Number of debtors in the financial system. Human persons – In units
Private sector deposits in local currency fell in a year-on-year comparison to September when adjusted for inflation, mainly due to the behavior of demand accounts (see Figure 2.5). In view of the recent context of marked depreciation of the peso against the dollar and its consequent inflationary impact (see Chapter 1), the BCRA took a set of policy measures to stabilize the market and contain the aforementioned pressures on the price level. This was reflected in higher remuneration for depositors, driving in September and more markedly from October onwards, an increase in the balance of private deposits in real terms, especially those with time deposits. 16
Figure 2.5 | Balance of total private sector deposits
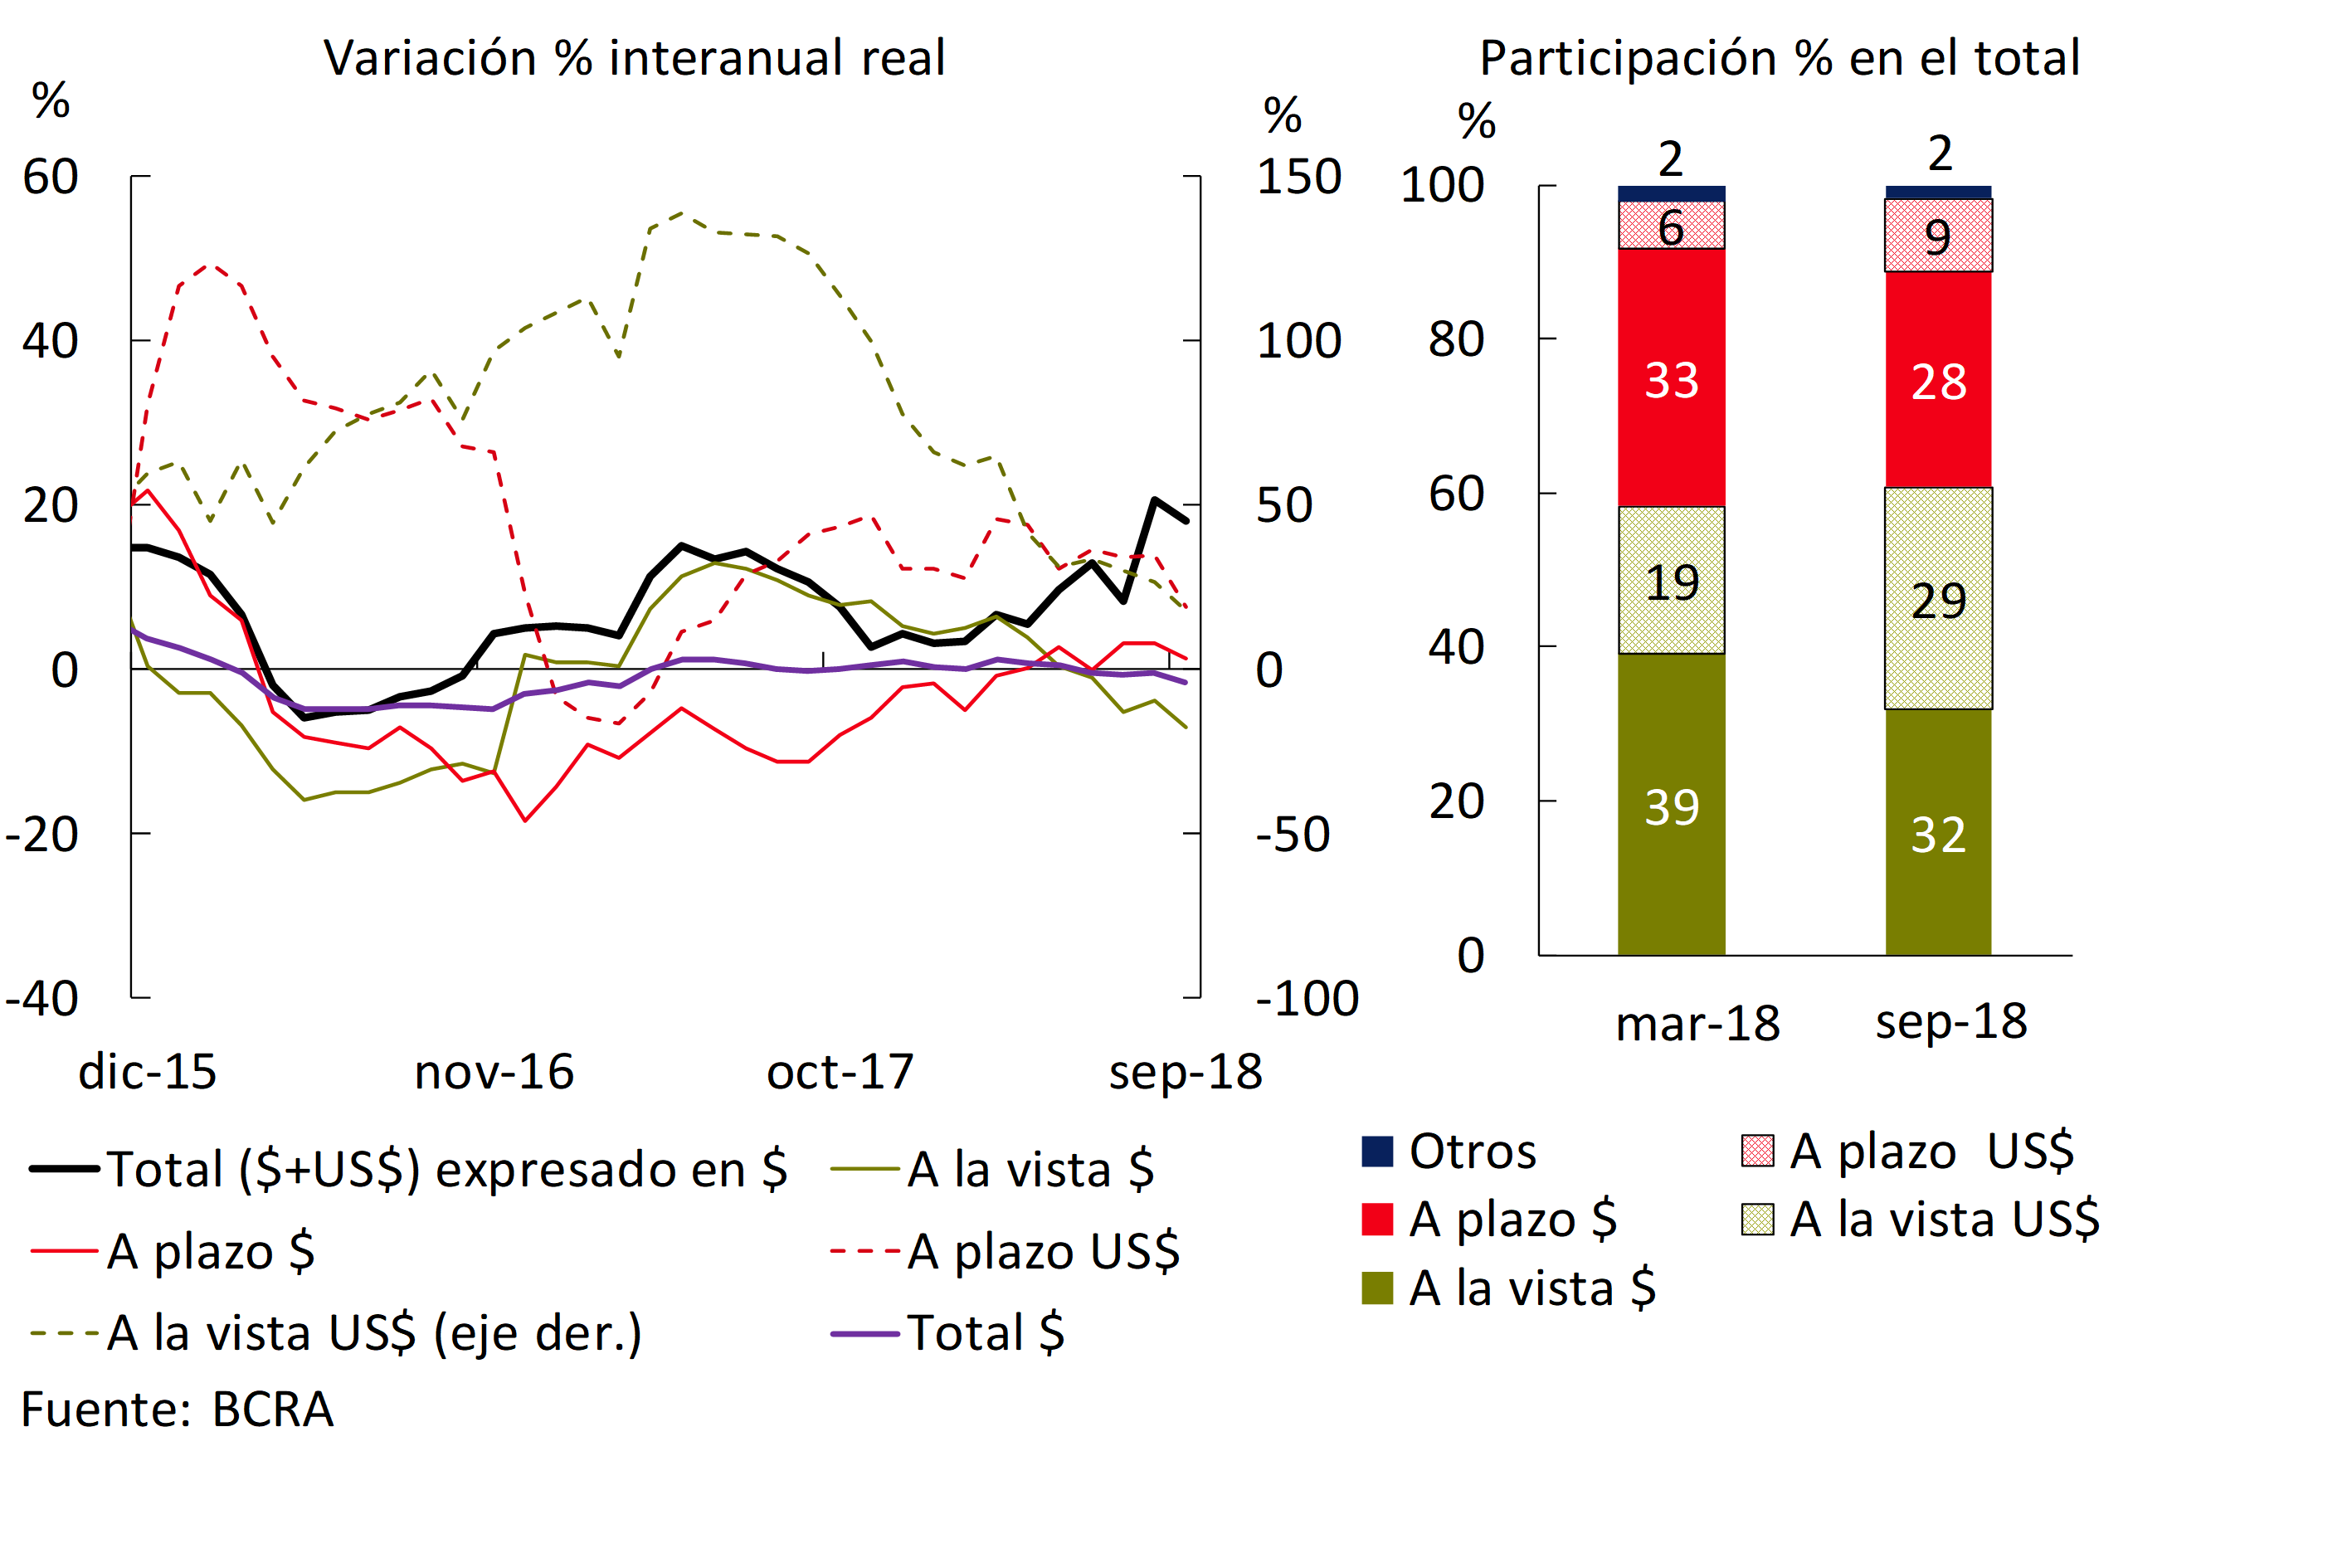
Placements in foreign currency maintained an upward path in recent months, temporarily interrupted from the last days of August to mid-September, reflecting the effect of the aforementioned context of turbulence in the foreign exchange market. The evolution of the aforementioned placements stabilized from mid-September, subsequently gradually growing again.
Conditioned by market forecasts regarding the evolution of economic activity (see Chapter 1), financial intermediation is expected to maintain a relatively weak performance during the last quarter. According to the latest survey by the CCP, all the entities that respond expect that restrictive conditions will continue to prevail in the credit market in the last quarter of 2018. 17 This movement would occur both due to factors linked to greater restrictions on the supply side – tightening of credit standards – and due to the lower demand for financial resources from companies and households. On the other hand, private sector deposits are expected to continue to show a positive performance in the short term, given the context of stabilization of tensions in the foreign exchange market and the prospects of lower price variations towards the end of 2018 and the beginning of 2019.
2.2 Nominal yields grow in a context of higher levels of inflation
In recent months, in the face of accelerating inflation and consequent greater restrictive bias in monetary policy, the usual profitability ratios of the financial system showed a nominal increase. The results in the January-September period represented 3.8% of assets (ROA) (see Table 2.3), 1.1 p.p. above what was observed in 2017. The gains of the financial system in terms of equity (ROE) were 33% y.a. in the first 9 months of 2018, almost 6.4 p.p. above what was recorded in the same period of 2017. 18 This nominal increase was lower than the increase recorded in the level of accumulated inflation between the two periods. 19 In 2018, there is a significant dispersion in profitability between institutions.
Table 2.3 | Profitability of the financial system
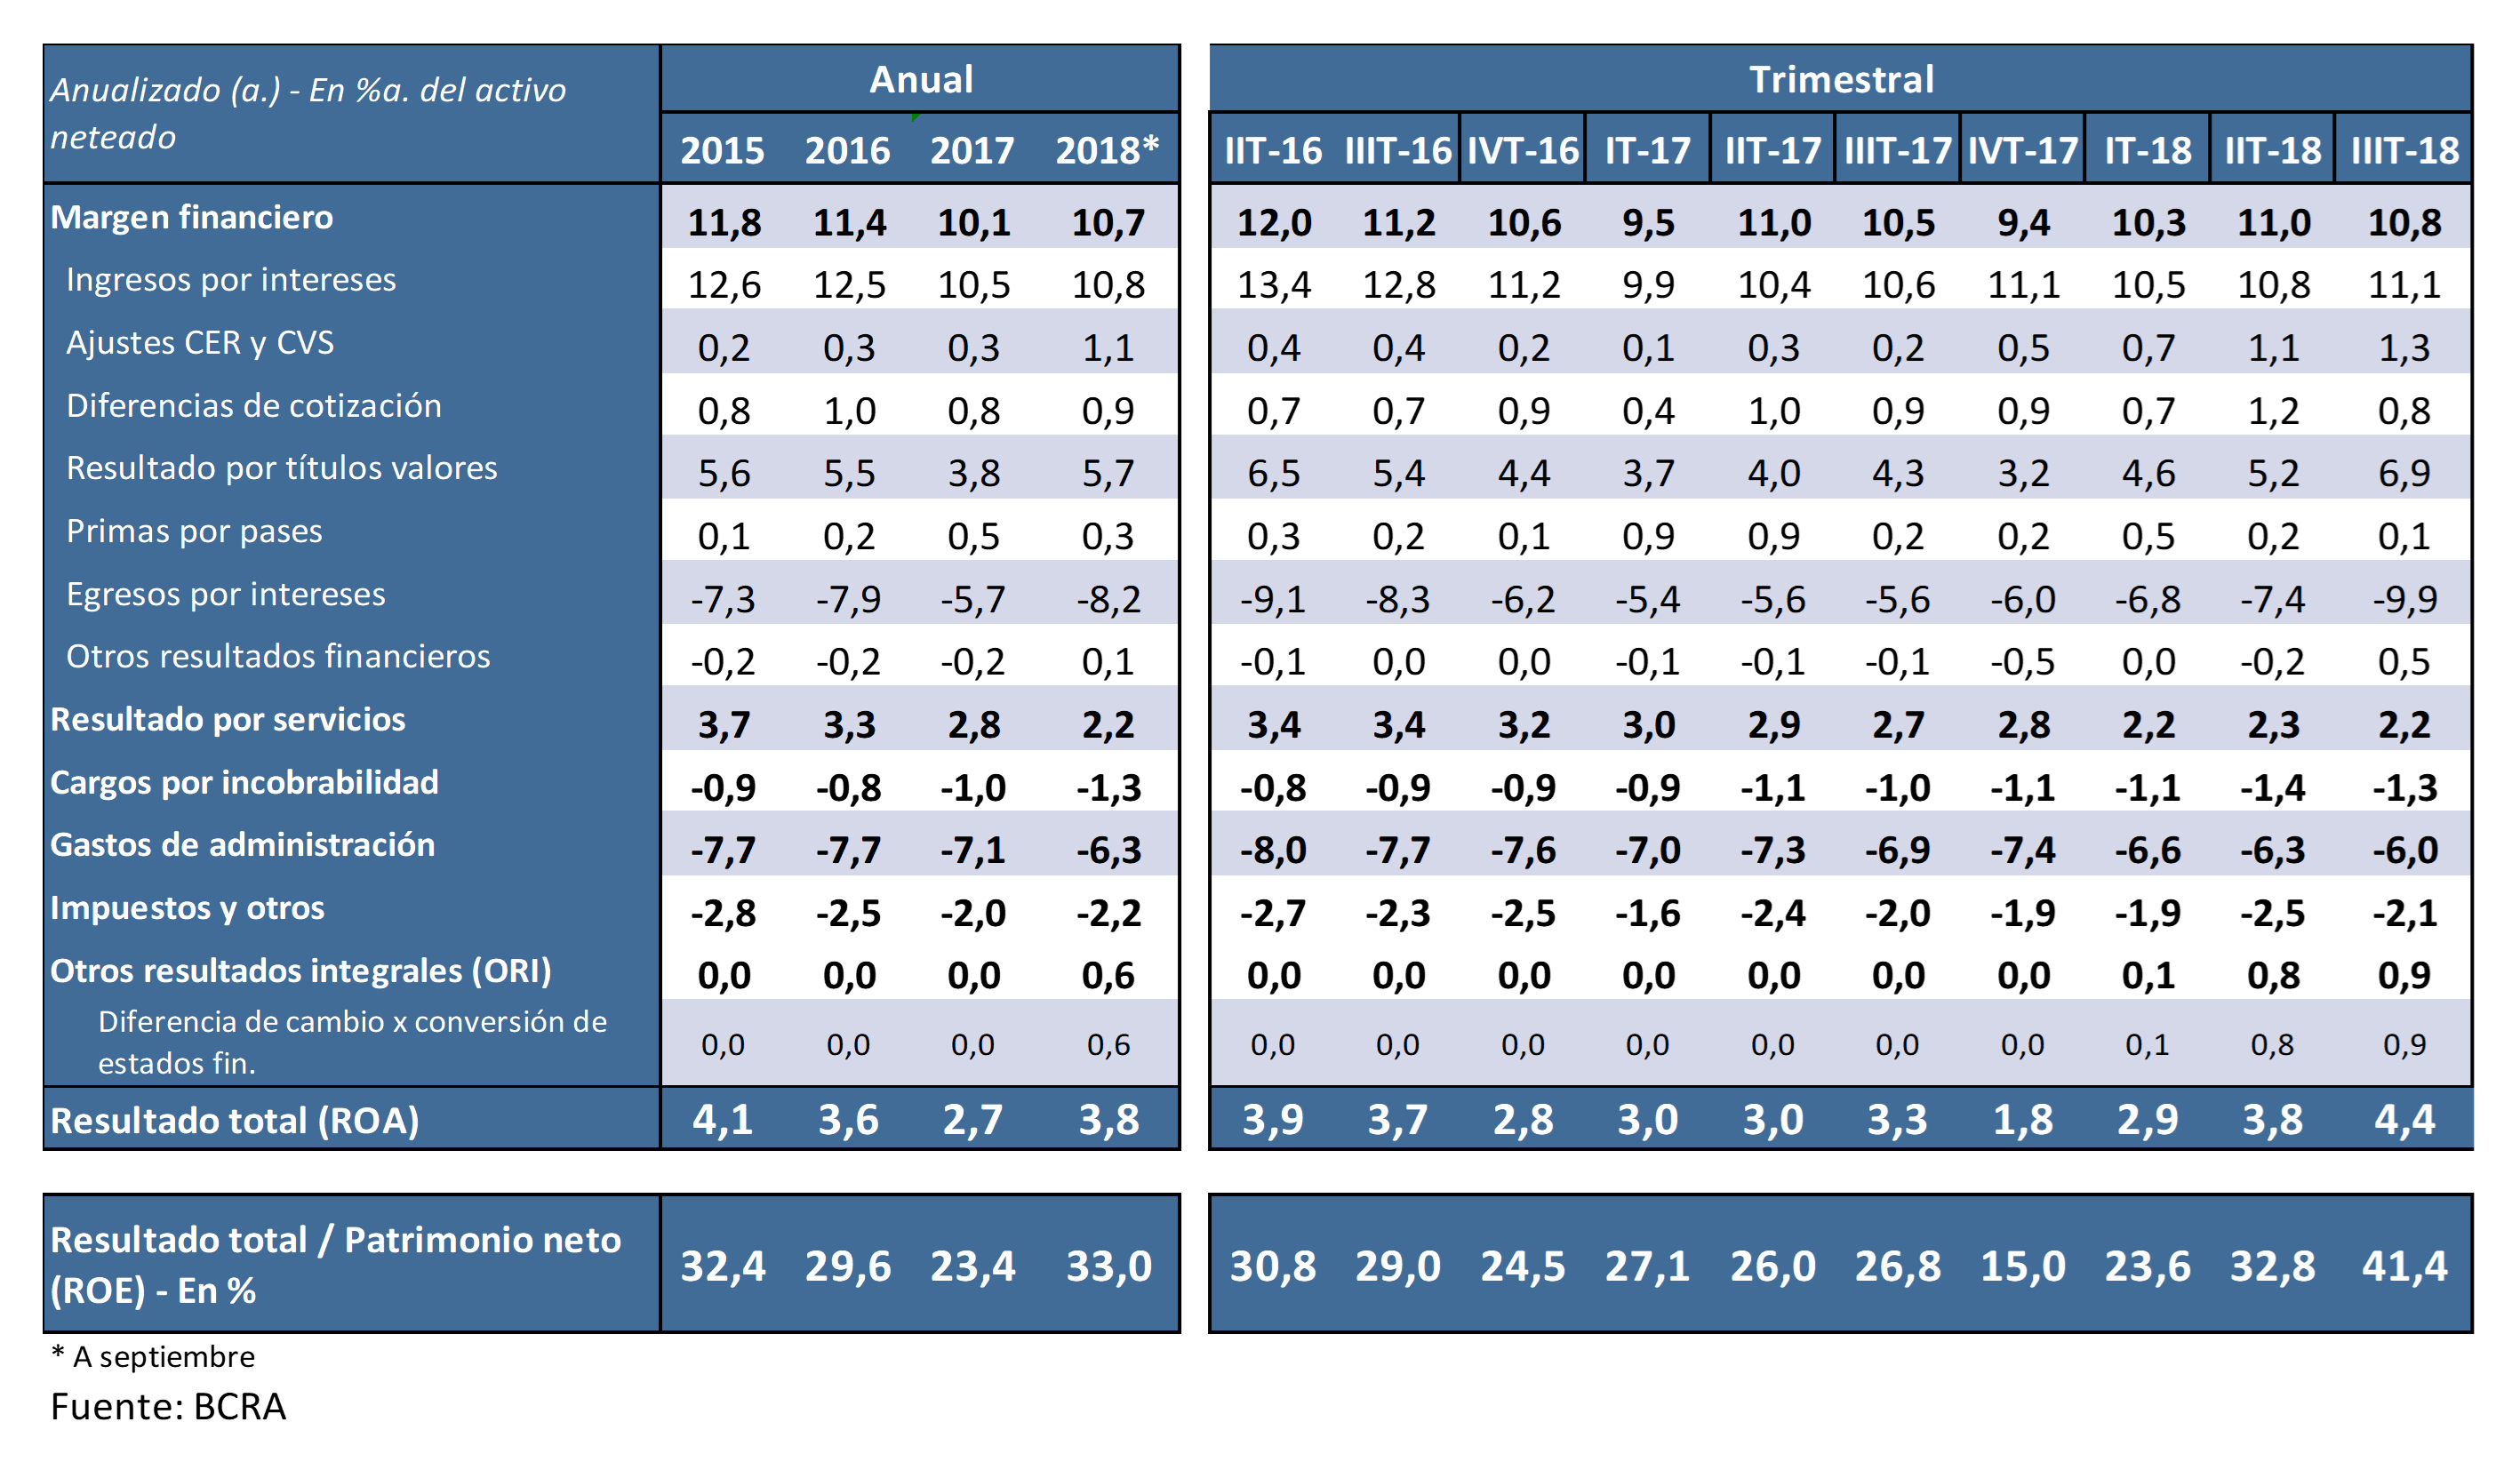
In the third quarter of 2018, the financial system recorded the highest value of nominal quarterly profitability in terms of assets since 2015. In a year-on-year comparison, the increase was mainly explained by the increase in the financial margin, driven by higher results for securities and differences in quotation, in a context of an increase in the nominal exchange rate. On the other hand, interest outflows in the sector grew, hand in hand with higher interest rates for fixed-term placements in line with the impetus of the BCRA’s financial policy. These expenditures increased by 3.1 p.p. compared to the value of the first part of the year. Interest income and CER adjustments considered on an aggregate basis increased slightly, reflecting the effects of lower financial intermediation.
A closer look at the net interest income from deposits and loans shows that in the third quarter the differential between implicit lending rates and the implicit funding cost for deposits fell by more than 3 p.p. compared to the previous period. 20 In view of the increase in reference rates and changes in reserve requirements, the decrease in the spread was explained by an increase in the cost of funding for deposits that exceeded the increase in implied lending rates. 21 However, in recent months it has been observed that the differential in terms of interest rates operated at the margin, for loans to the private sector in pesos and deposits of this sector in the same denomination (both in real terms), increased to above the beginning of the year (see Box 6).
Administrative expenses in asset terms continued to show a downward trajectory throughout 2018. 22 Despite this trend, this concept continues to be high when compared to what is recorded in the financial systems of the countries of the region. As mentioned in previous editions of the IEF, the local financial system maintains an important space to advance in improvements in terms of efficiency, largely from the use of economies of scale.
2.3 The solvency indicators of the system remain high
The integration of regulatory capital for the aggregate of entities remains significantly above the minimum requirement, although it registered a decrease compared to the values at the beginning of 2018 (see Figure 2.6). While private banks presented relatively minor changes in their solvency indicators, the largest change was observed in public entities. The decline in the ratio in public banks is explained by the sharp increase in their risk-weighted assets – due in part to the effect of the increase in the exchange rate on their credit exposures – significantly greater than the expansion of regulatory capital integration. The integration of Tier 1 capital in the financial system, which has the best capacity to absorb eventual losses, represented 88% of the total in September, slightly reducing compared to what was indicated in the previous IEF. The excess capital integration at the aggregate level in terms of the minimum prudential requirement was equivalent to just over 67% in the period, with a surplus capital position in all homogeneous groups of banks.
Figure 2.6 | Integration and excess regulatory capital (Position)
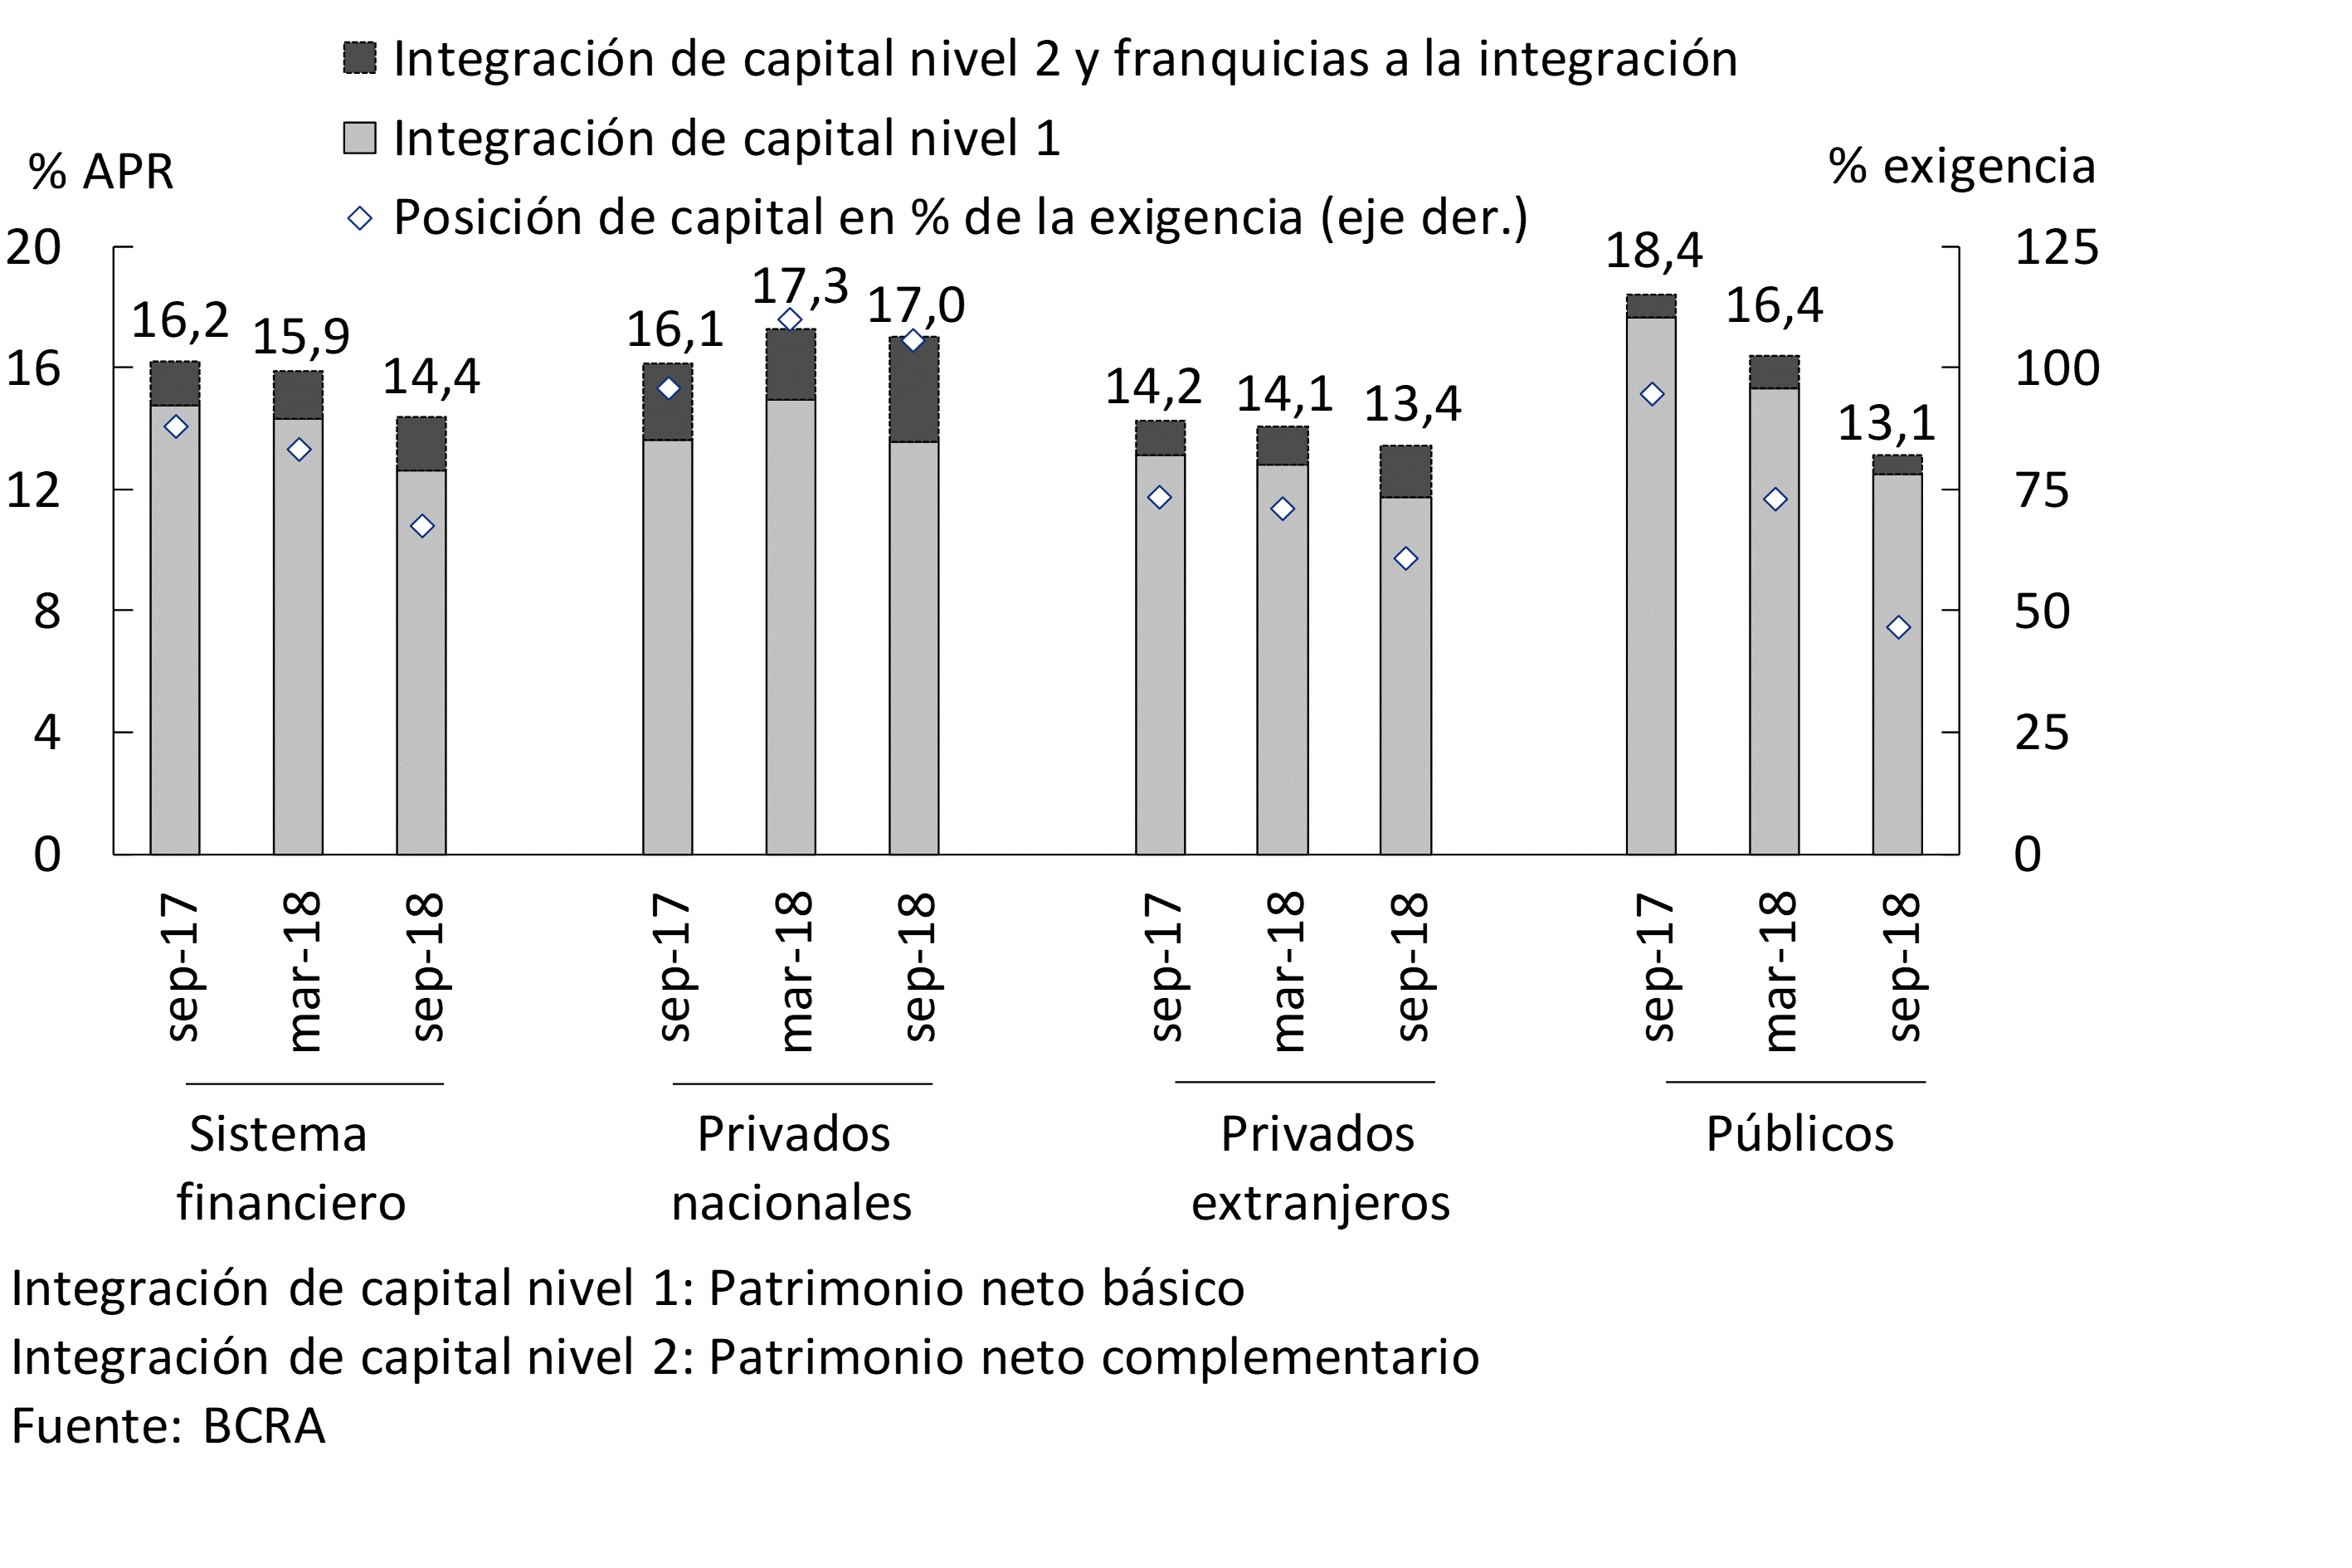
Considering Basel III’s regulatory capital margins as minimum requirements, the banks as a whole presented an excess of core Tier 1 capital integration (common shares and retained earnings) of 2.3% in September, falling compared to March. 23 It was observed that 61 of the 77 that currently make up the system completely cover these margins (71% of total assets).
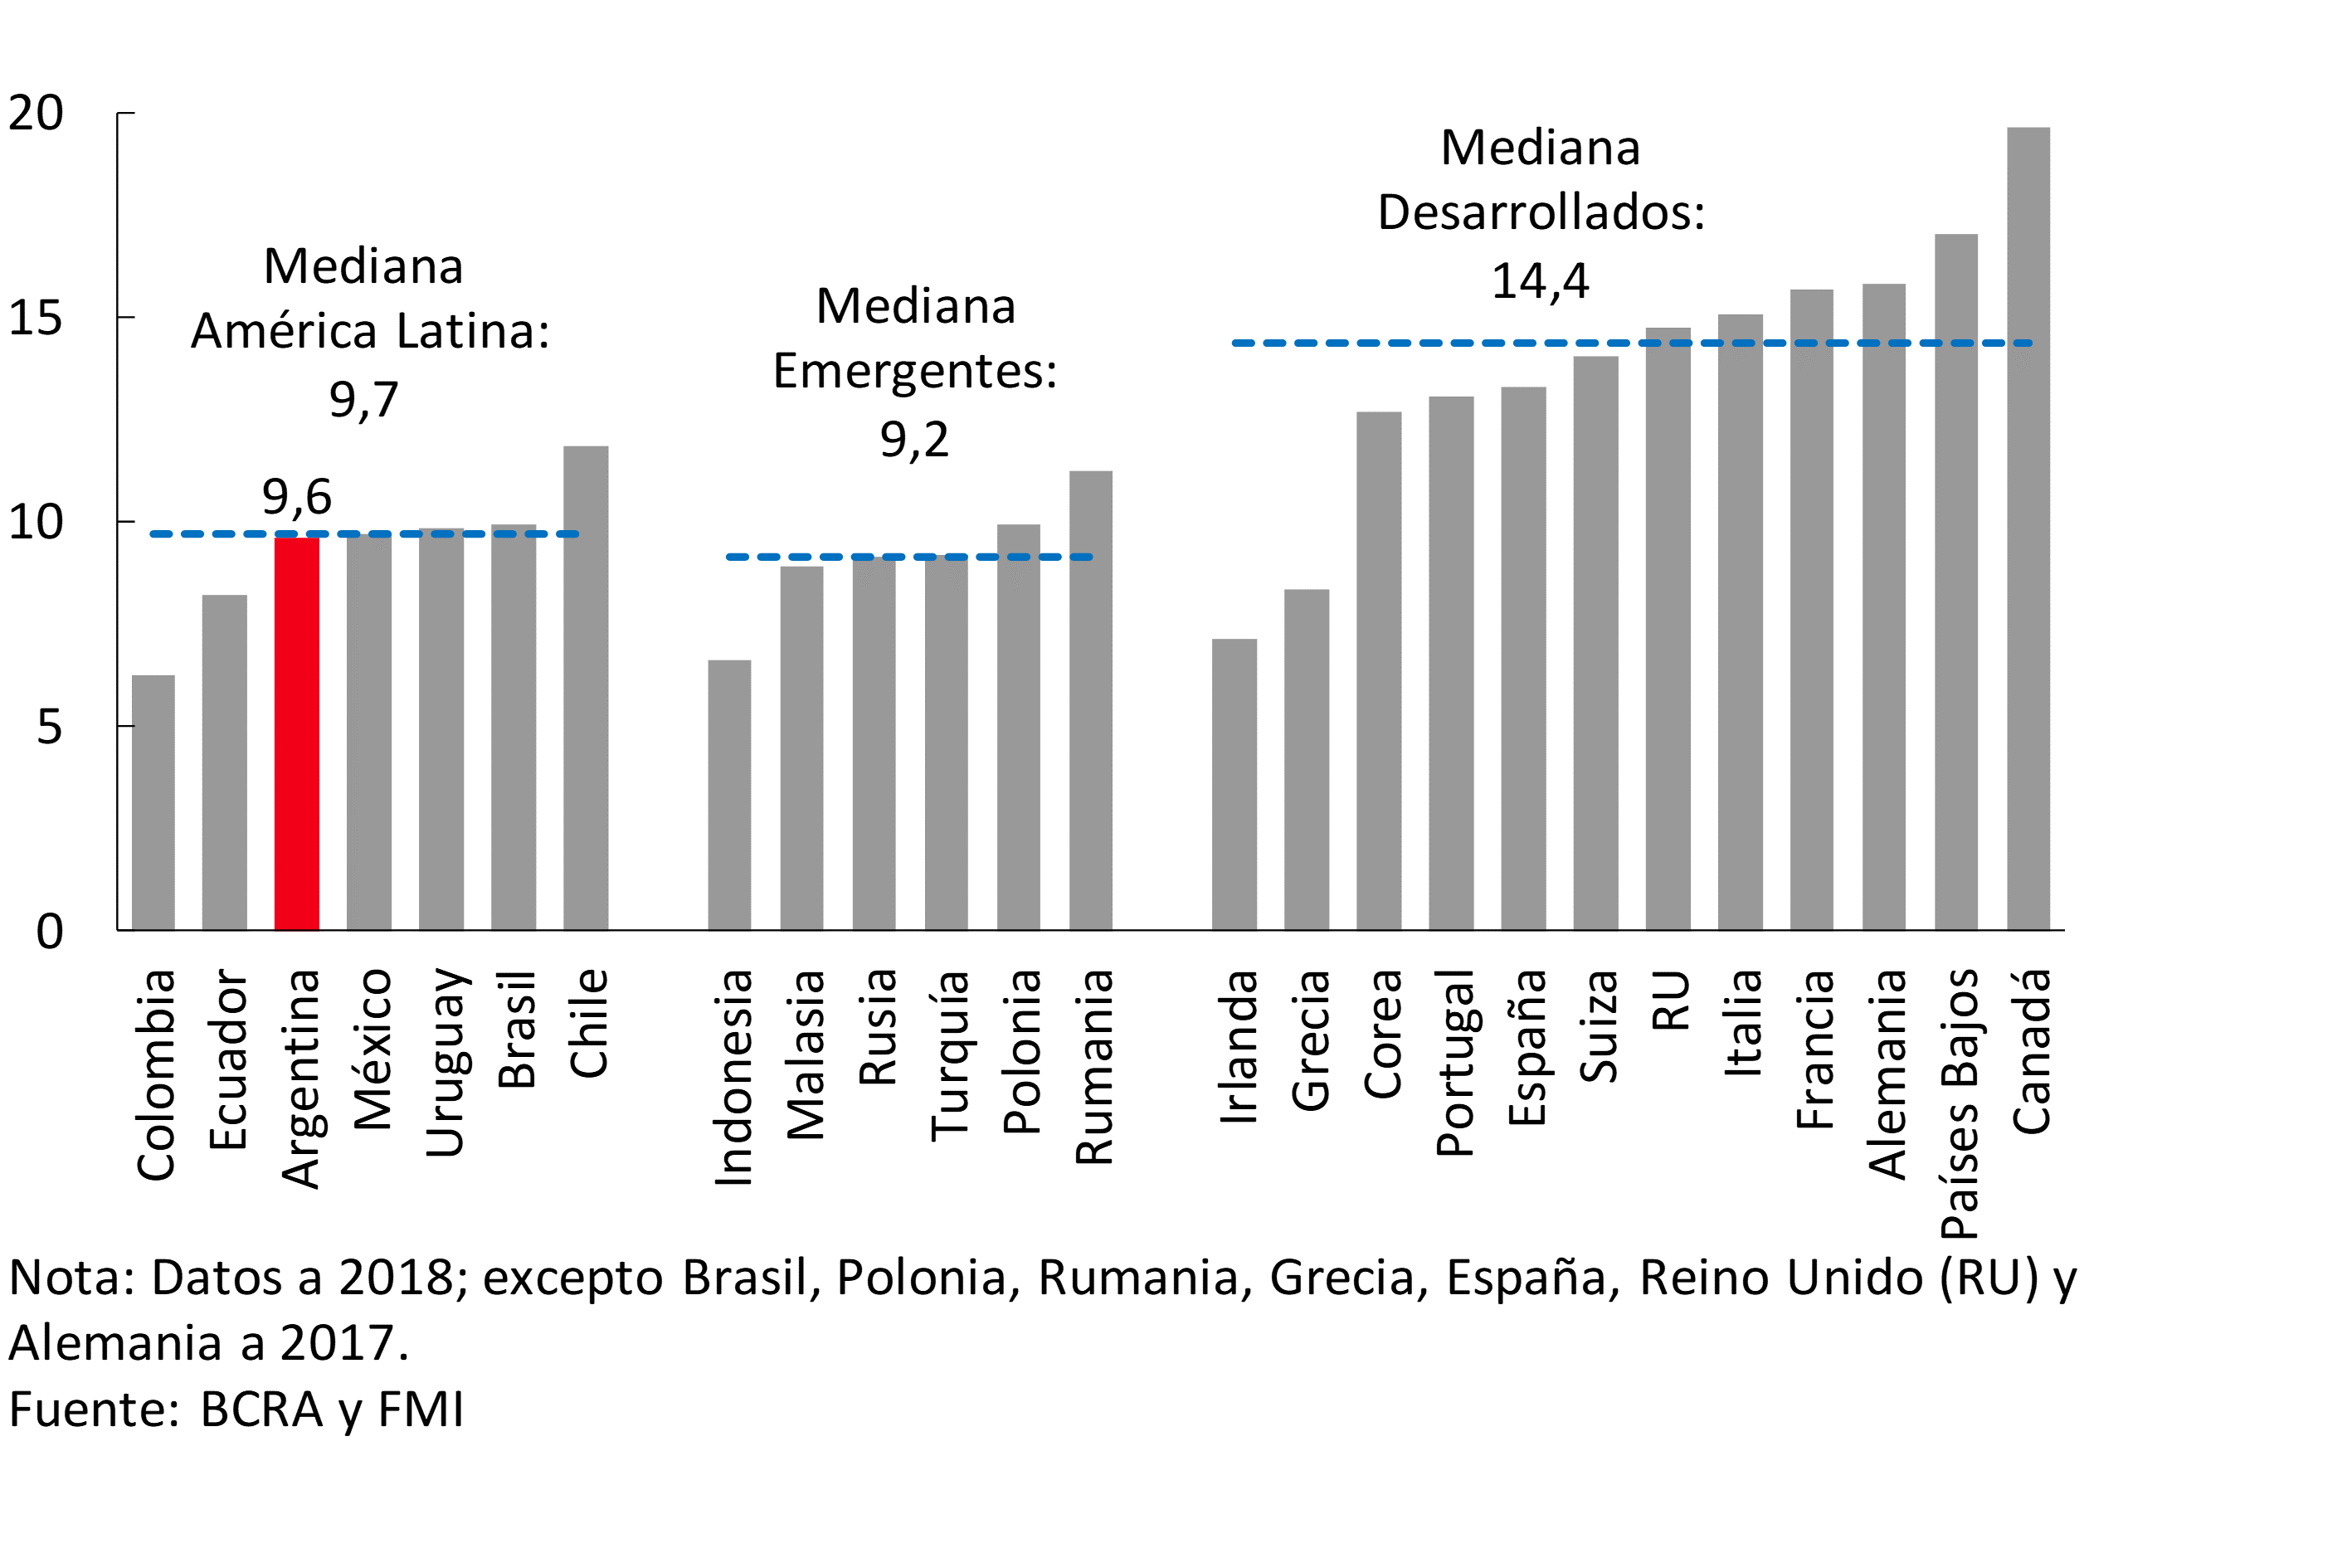
In terms of leverage levels – a simple ratio of assets to net worth – the system shows values in line with those of other emerging economies and below those developed (see Figure 2.7). Regarding the regulatory ratio that arises from the recommendation of the Basel Committee, the Leverage Ratio of the system reached 8.5% as of September, comfortably above international recommendations (3%).
Figure 2.7 | Leverage Level – International Comparison – Assets / Net Worth
In view of the challenges posed by the current macroeconomic scenario for the financial system, it is worth highlighting the levels of capital slack mentioned above. These, in conjunction with the limited levels of credit exposure and irregularity and the high coverage with forecasts, contribute to a situation of relative strength for local banks. Chapter 3 presents the results of sensitivity exercises to provide a first approximation of the level of resistance that could be shown in the face of possible extreme events of credit risk.
3. Stability analysis
Considering the deterioration evidenced in the operational context detailed in Chapter 1, as well as the situation of the financial system presented in Chapter 2, it is estimated that the conditions that make the stability of the sector resisted the adverse shock faced, despite the fact that the financial institutions as a whole faced some materialization of some of the intrinsic risks assumed. The effect observed has been limited, as a result of low to moderate exposures to risks and high coverage of liquidity, forecasts and capital, in an appropriate micro and macroprudential regulatory framework. In relation to credit risk, although the non-performing loan ratio of the portfolio increased in line with the performance of macroeconomic conditions, this indicator remained in an environment of low records both in terms of local history and when compared to other economies. The stress exercises carried out, based on the sensitivity analyses for credit risk, continued to show reduced impacts at the level of the aggregate system, without significant changes with respect to those obtained in previous editions of the IEF. The liquidity of the financial system rose from the increase in bank reserve requirements and the observed slowdown in credit, while a favorable performance of private sector deposits was maintained. The materialization of interest rate risk was relatively small, given the limited transformation of terms in the sector. Currency mismatch remained low, constrained by prudential regulations.
3.1. Exposure to systemic sources of vulnerability with downward bias
The exposure of all local financial institutions to systemic sources of vulnerability is estimated at a moderate level, with a certain downward bias with respect to the assessment made in the previous edition of the IEF. Thus, on the one hand, systemic risks related to common, cross-linked or interconnected exposures (see Sections 3 and 4 and results of stress exercise in this Chapter 3), and to the soundness of institutions considered to be systemically important, remain relatively limited and without significant changes compared to the beginning of the year. On the other hand, given the current phase of the financial cycle, a decrease in the tendency to accumulate systemic risk derived from credit growth is expected. Thus, in the current context of risk materialization, it is important to monitor the prevailing conditions in the credit market, in particular, the bias of all institutions with respect to the evolution of credit standards and terms applied to debtors.
With respect to the current macroprudential regulation on the Countercyclical Capital Margin,24 aimed at addressing the risks associated with “excessive” credit growth, the BCRA regularly conducts a vulnerability assessment that takes into account a broad set of risk indicators. 25 In this context, the latest information analyzed shows signs consistent with maintaining the rate of said additional capital margin at 0% as of December 2018.
3.2. The financial system’s exposure to private sector credit risk was reduced
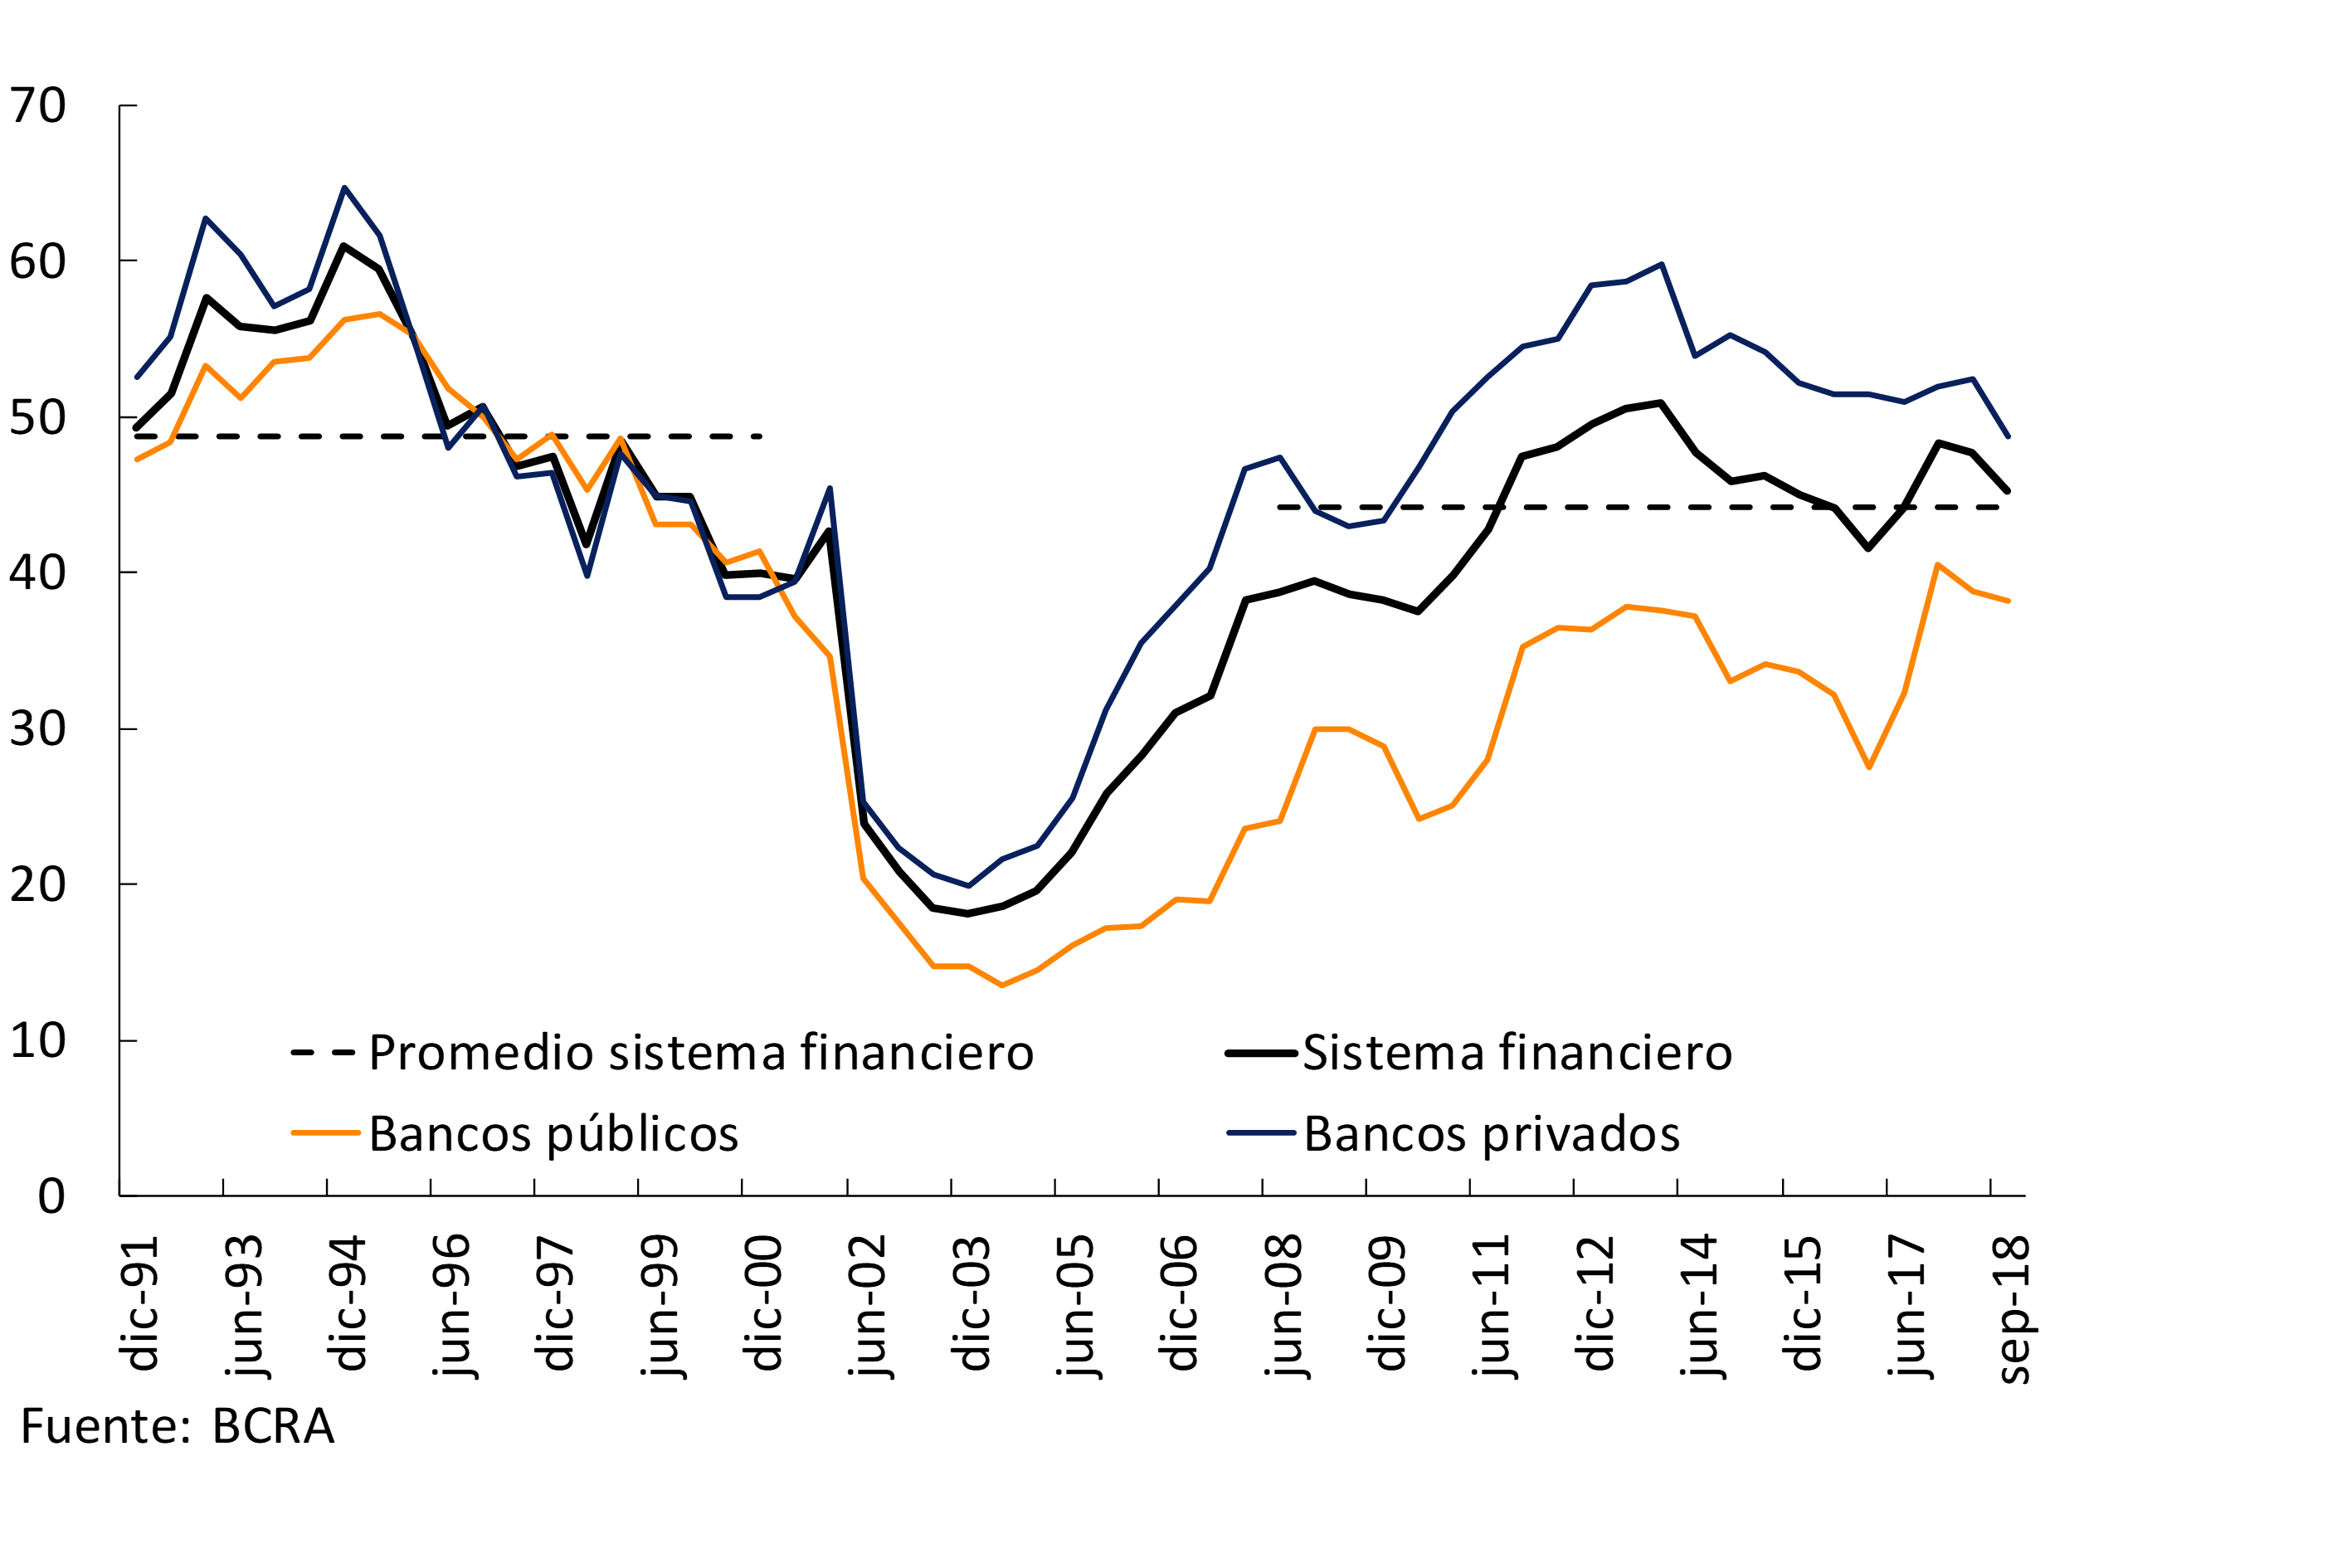
Over the past six months and on a year-on-year basis, there has been a reduction in the gross exposure of banks as a whole to the private sector (see Figure 3.1). This performance was explained by the fall in lending and the evolution of the rest of the components of bank assets at the aggregate level (see Chapter 2). The reduction in gross exposure occurred mainly in private banks and in financing to households. Levels of exposure to the private sector remained subdued—below 50 percent of total assets—similar to the average of the past ten years. These values are below the median evidenced for the countries of the region.
Figure 3.1| Gross exposure to the non-financial private sector – Financing to the private sector as a % of net assets
3.2.1. Credit irregularity remains low, with an increase in 2018, while the level of forecasting remained high
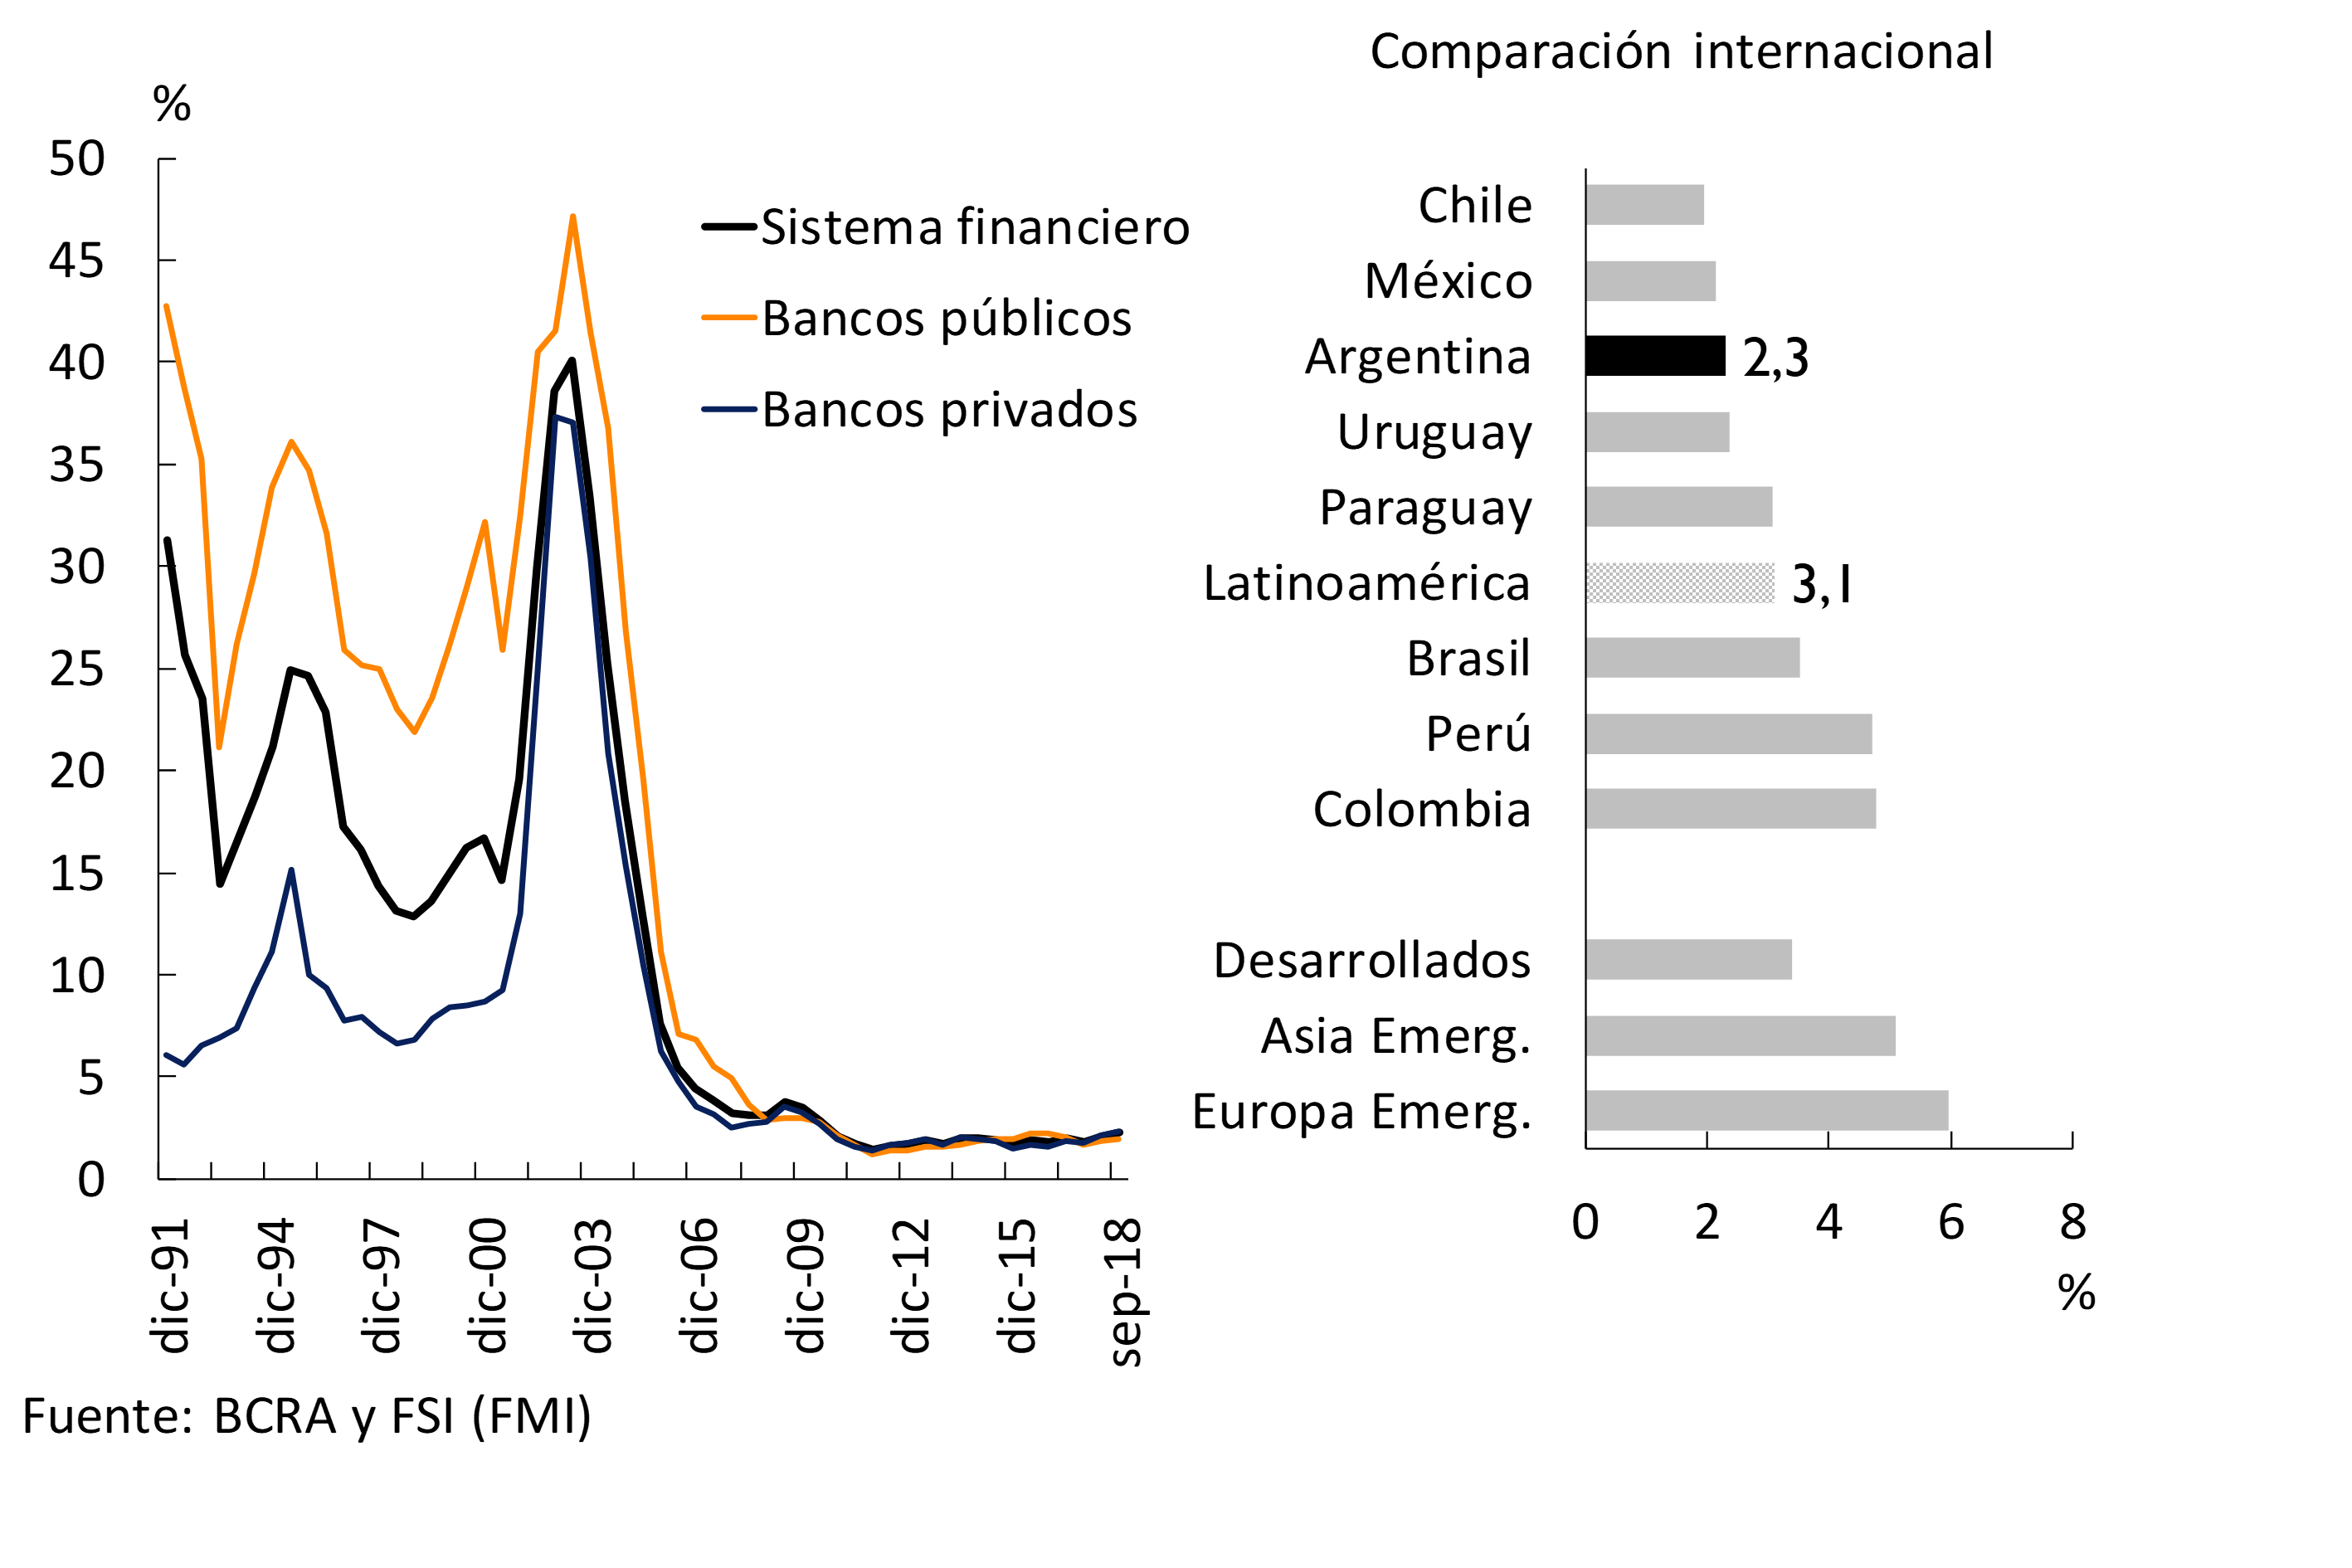
The non-performing ratio of credit to the private sector increased by 0.3 p.p. compared to the level of the last IEF, to 2.3% at the end of the third quarter. Current levels of credit delinquencies are low compared to those observed over the past 25 years and also with those recorded in other financial systems in the region and in other emerging or developed economies (see Figure 3.2). This trend in irregularity is consistent with the low level of indebtedness and financial burden in the sector and with the relative prudence in the generation of credit in the banking sector in the last two years. 26
Figure 3.2 | Irregularity of lending to the private sector by group of banks and international comparison – Irregular portfolio / Financing (%)
The total forecast accounted for by all financial institutions continued to be high and exceeds the portfolio in an irregular situation, representing 125% of it. The combination of low irregularity, limited gross exposure to the private sector, and relatively high forecasting and capital (see Chapter 2) means that the net equity exposure of the financial system to credit risk (EPNRC) remains low. 27 As of September 2018, the EPNRC represented only 2.1% of net worth, registering a slight increase in the last six months.
In addition, it is worth noting the small size of the financial system (see Chapter 2) and the low complexity of its operations – traditional financial intermediation and transactional bias – limiting the possibility of a significant amplification of an eventual materialization of risks to the economy as a whole.
3.2.2. The increase in the irregularity ratio follows the performance of loans for household consumption
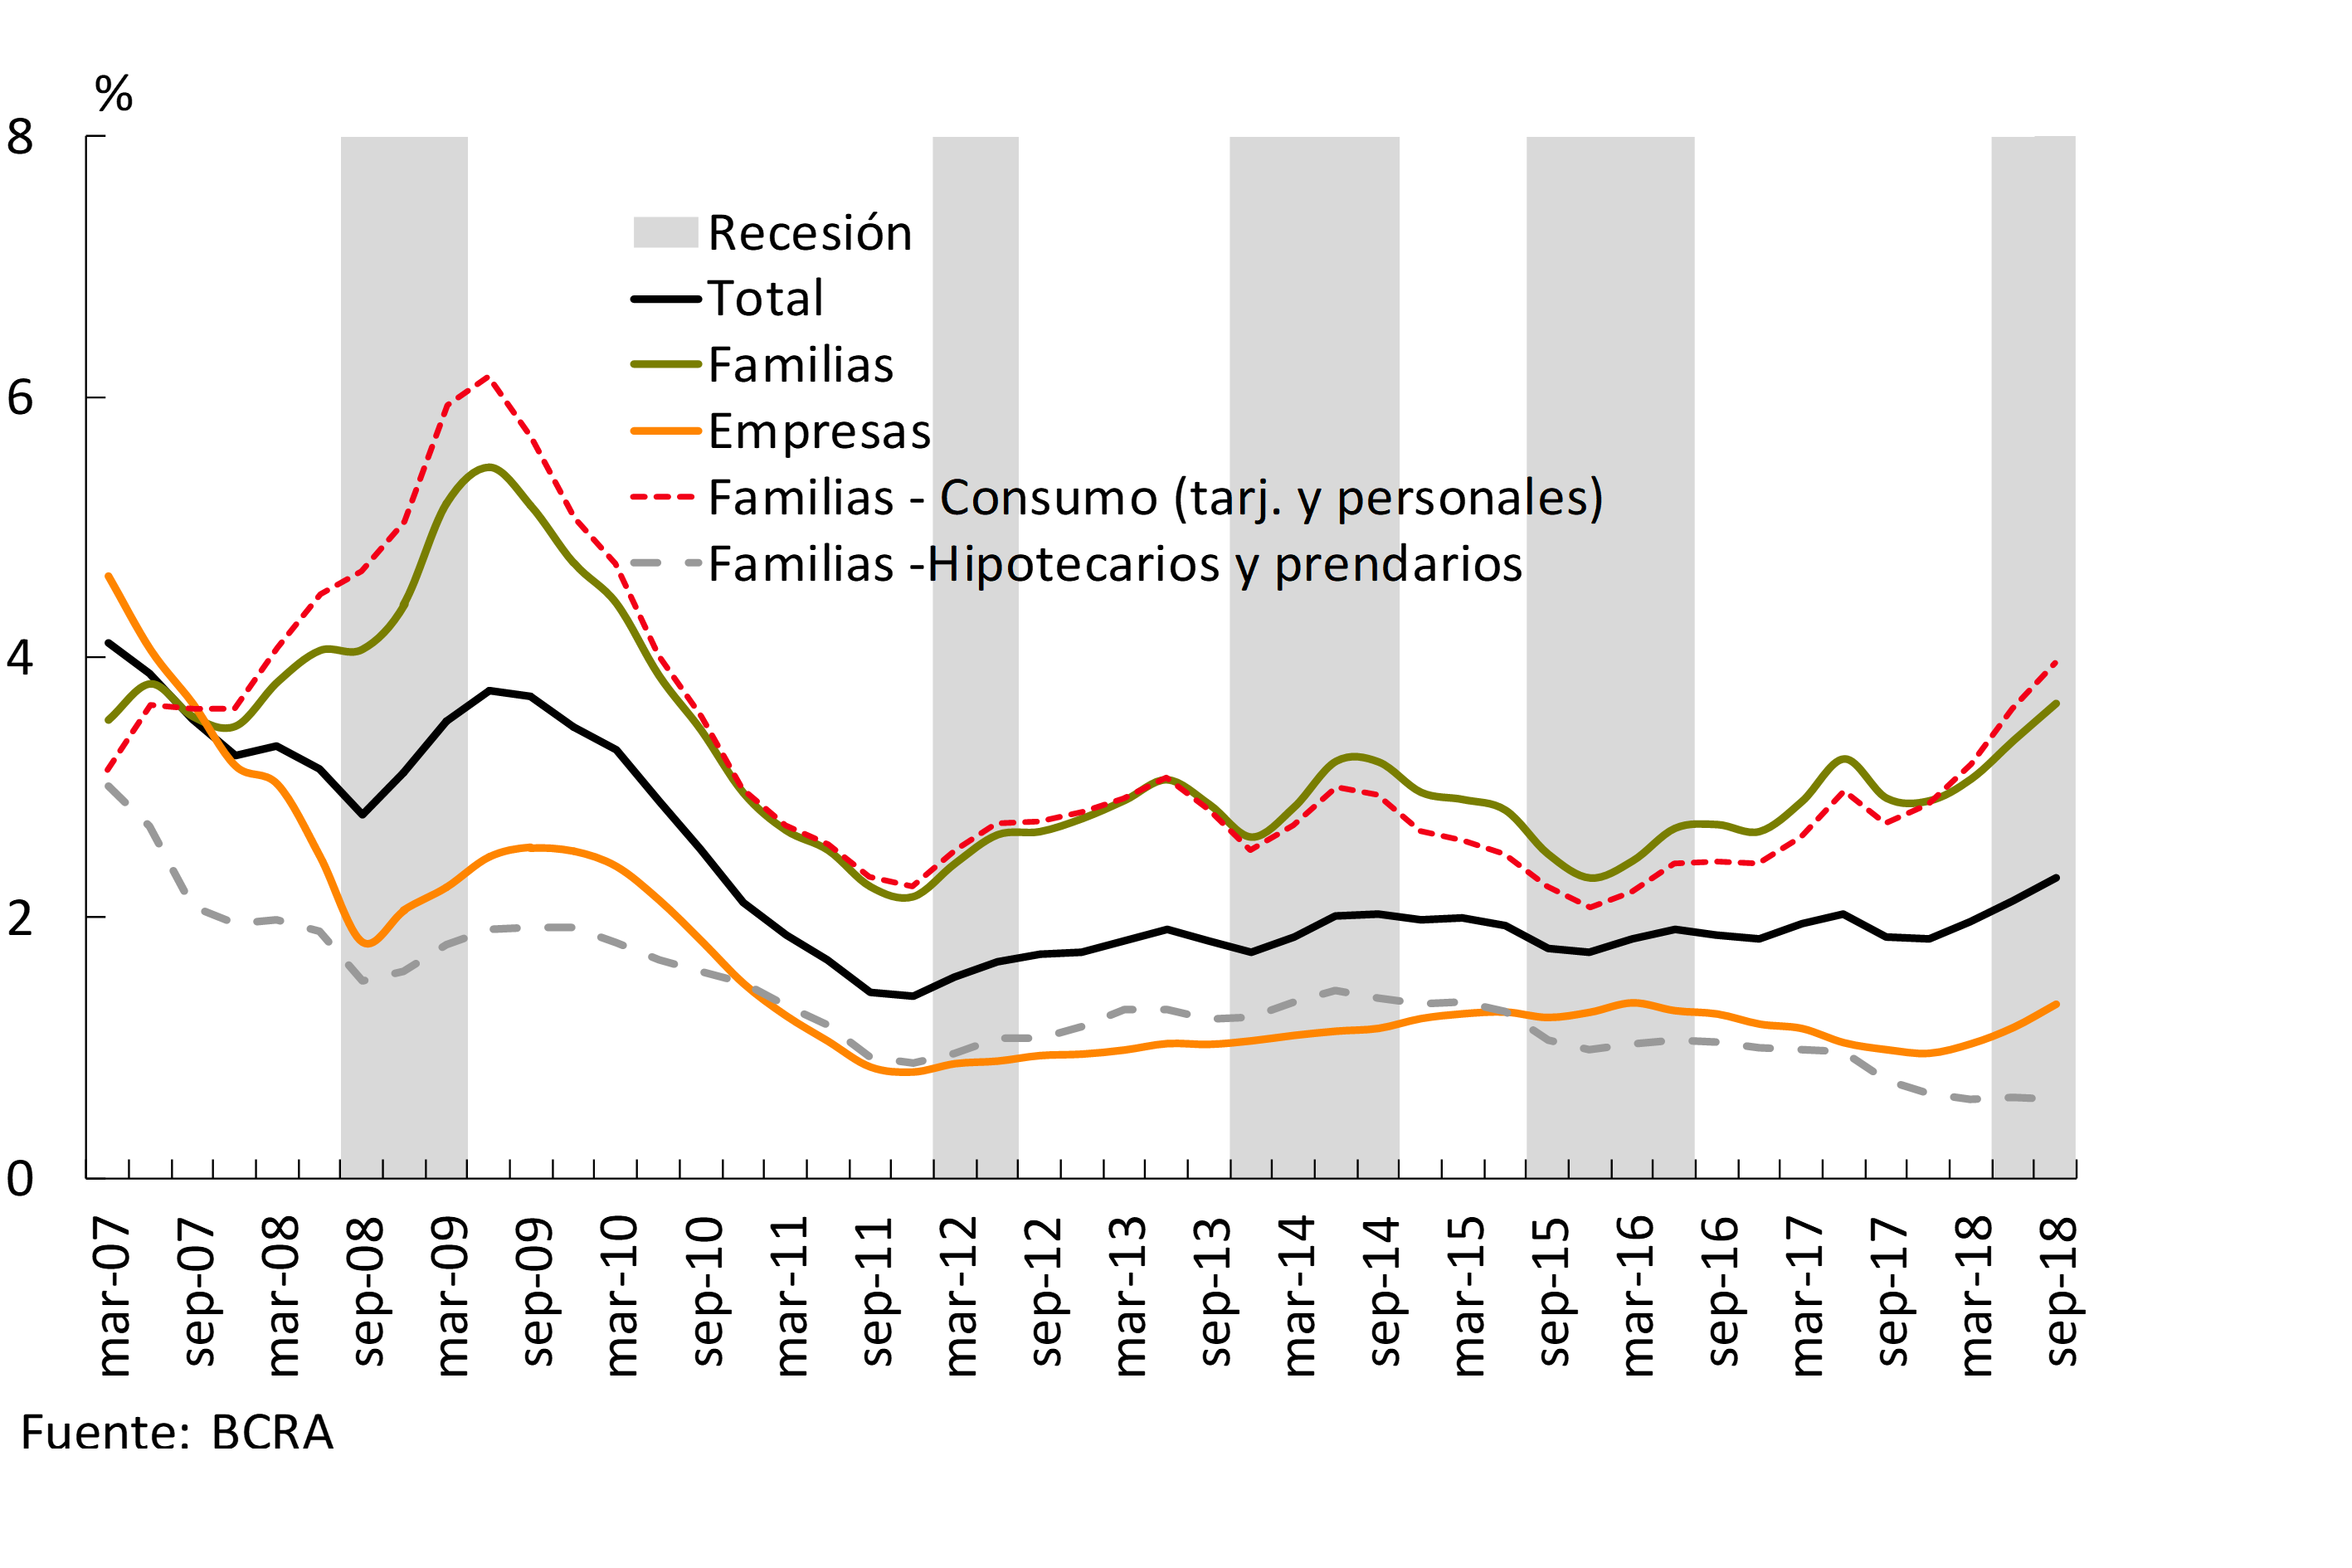
In a context of deteriorating macroeconomic conditions, the increase observed since the first quarter of the year with respect to the irregularity ratio was mainly explained by the segment of loans to households (+0.6 p.p. to 3.6%) and, to a lesser extent, by the financing to companies (+0.3 p.p. to 1.3%). 28 Within the segment of loans to households, the rise in non-performing loans was driven by the performance of consumer loans (see Figure 3.3). The irregularity of pledge loans to households registered a smaller increase, while that corresponding to mortgages remained low (0.2% for total mortgages to families and 0.1% for those granted in UVA – for a detail of the recent evolution of inflation and wages see Box 4).
Figure 3.3 | Irregularity of credit to the private sector by segment – Irregular portfolio / Financing (%)
Box 4. UVA Credits: Salaries, Inflation and BCRA Regulations
In UVA-denominated loans, the capital owed is adjusted for inflation, which is reflected through the adjustment of the installments by the Reference Stabilization Coefficient (CER). When increases in the general price level tend to exceed increases in wages, it could lead to transitory periods of stress on debtors’ ability to pay. 29 In order to address this situation, the BCRA’s prudential regulations on UVA loans provide for the option for customers to extend the originally planned term (up to 25%), to the extent that the installment to be paid exceeds by 10% the value of the installment that would result from having applied a capital adjustment by the Wage Variation Coefficient (CVS) from the granting of the loan. 30
With the latest available public information, it can be estimated that until the end of August 2018, no UVA loan granted between April 2016 (the beginning of this type of line) and July 2018 had installments whose value was 10% higher than those calculated under the assumption of updating by CVS. 31 The dynamics of inflation and wages over the last quarter of the year could lead to this happening in some of the UVA mortgage loans granted.
If this scenario were to occur, the current regulations do not prevent banks from offering other alternatives to address the aforementioned issue. Entities could propose, for example, a voluntary rule for their customers that sets a cap on the monthly installment (to avoid a possible increase in the installment of more than 10% relative to the performance of salaries), while the amounts that are not charged in these monthly installments due to the effect of the aforementioned limit would be capitalized. Thus, the debtor would pay the installment corresponding to the UVA installment until there is eventually a mismatch of more than 10% between the UVA and the CVS, at which time he would pay the maximum installment. When this mismatch is reversed, you would pay a fee below the maximum established fee. Provided that the event was transitory and occurred sufficiently far from the end of the loan, it could be the case that the effect of the mismatch could be mitigated without the need to extend the term of the loan.
Regarding mortgage loans, it is worth mentioning that the harvests of the last two years for this type of operations – mainly in UVA – have been showing a better performance compared to loans generated in previous years. 32 For example, the IIT-18 harvest showed an average irregularity of only 0.04% at the end of the immediately following quarter. 33 The remaining relatively recent harvests also maintain their levels of irregularity unchanged or increase them only slightly. On the other hand, the recent harvests of mortgage loans, with a high participation of those denominated in UVA, also continued to show a notable decrease in their irregularity measured in cumulative terms. 34 For example, both in the irregularity curve for 9 to 12 months and those for 18 to 21 months, a substantial decrease was observed in recent quarters. These results would be influencing, among other factors, the particular characteristics of the UVA instruments (with a relatively lower initial payment/income given the amount of the loan), as well as the standards and terms applied by the entities at the time of loan origination.
Among loans to companies, the increase in non-performing loans reflected the deterioration in the quality of the financing portfolio of all productive sectors with the exception of loans to the primary sector, which maintained their irregularity ratio unchanged. In this regard, as mentioned in previous editions of the IEF, the possibility of changes in the materialization of credit risk for the financial system derived from fluctuations in the nominal peso-dollar exchange rate is significantly limited (see Box 5).
Considering different homogeneous groupings of institutions depending on the type or predominant business model, and in line with the above, the group of private entities specialising in lending to households and of smaller relative size was the one that registered the highest relative growth in NPL ratios (with higher levels compared to the rest of the institutions).
Taking into account only the set of loans to the private sector that are in a regular situation at any given time (situations 1 and 2), so far in 2018 there has also been a slight deterioration in the quality of the portfolio. While at the end of 2017 97.1% of the loans were in situation 1 (normal) and 1.1% were in situation 2, these shares stood at 95.9% and 1.8% as of September 2018.
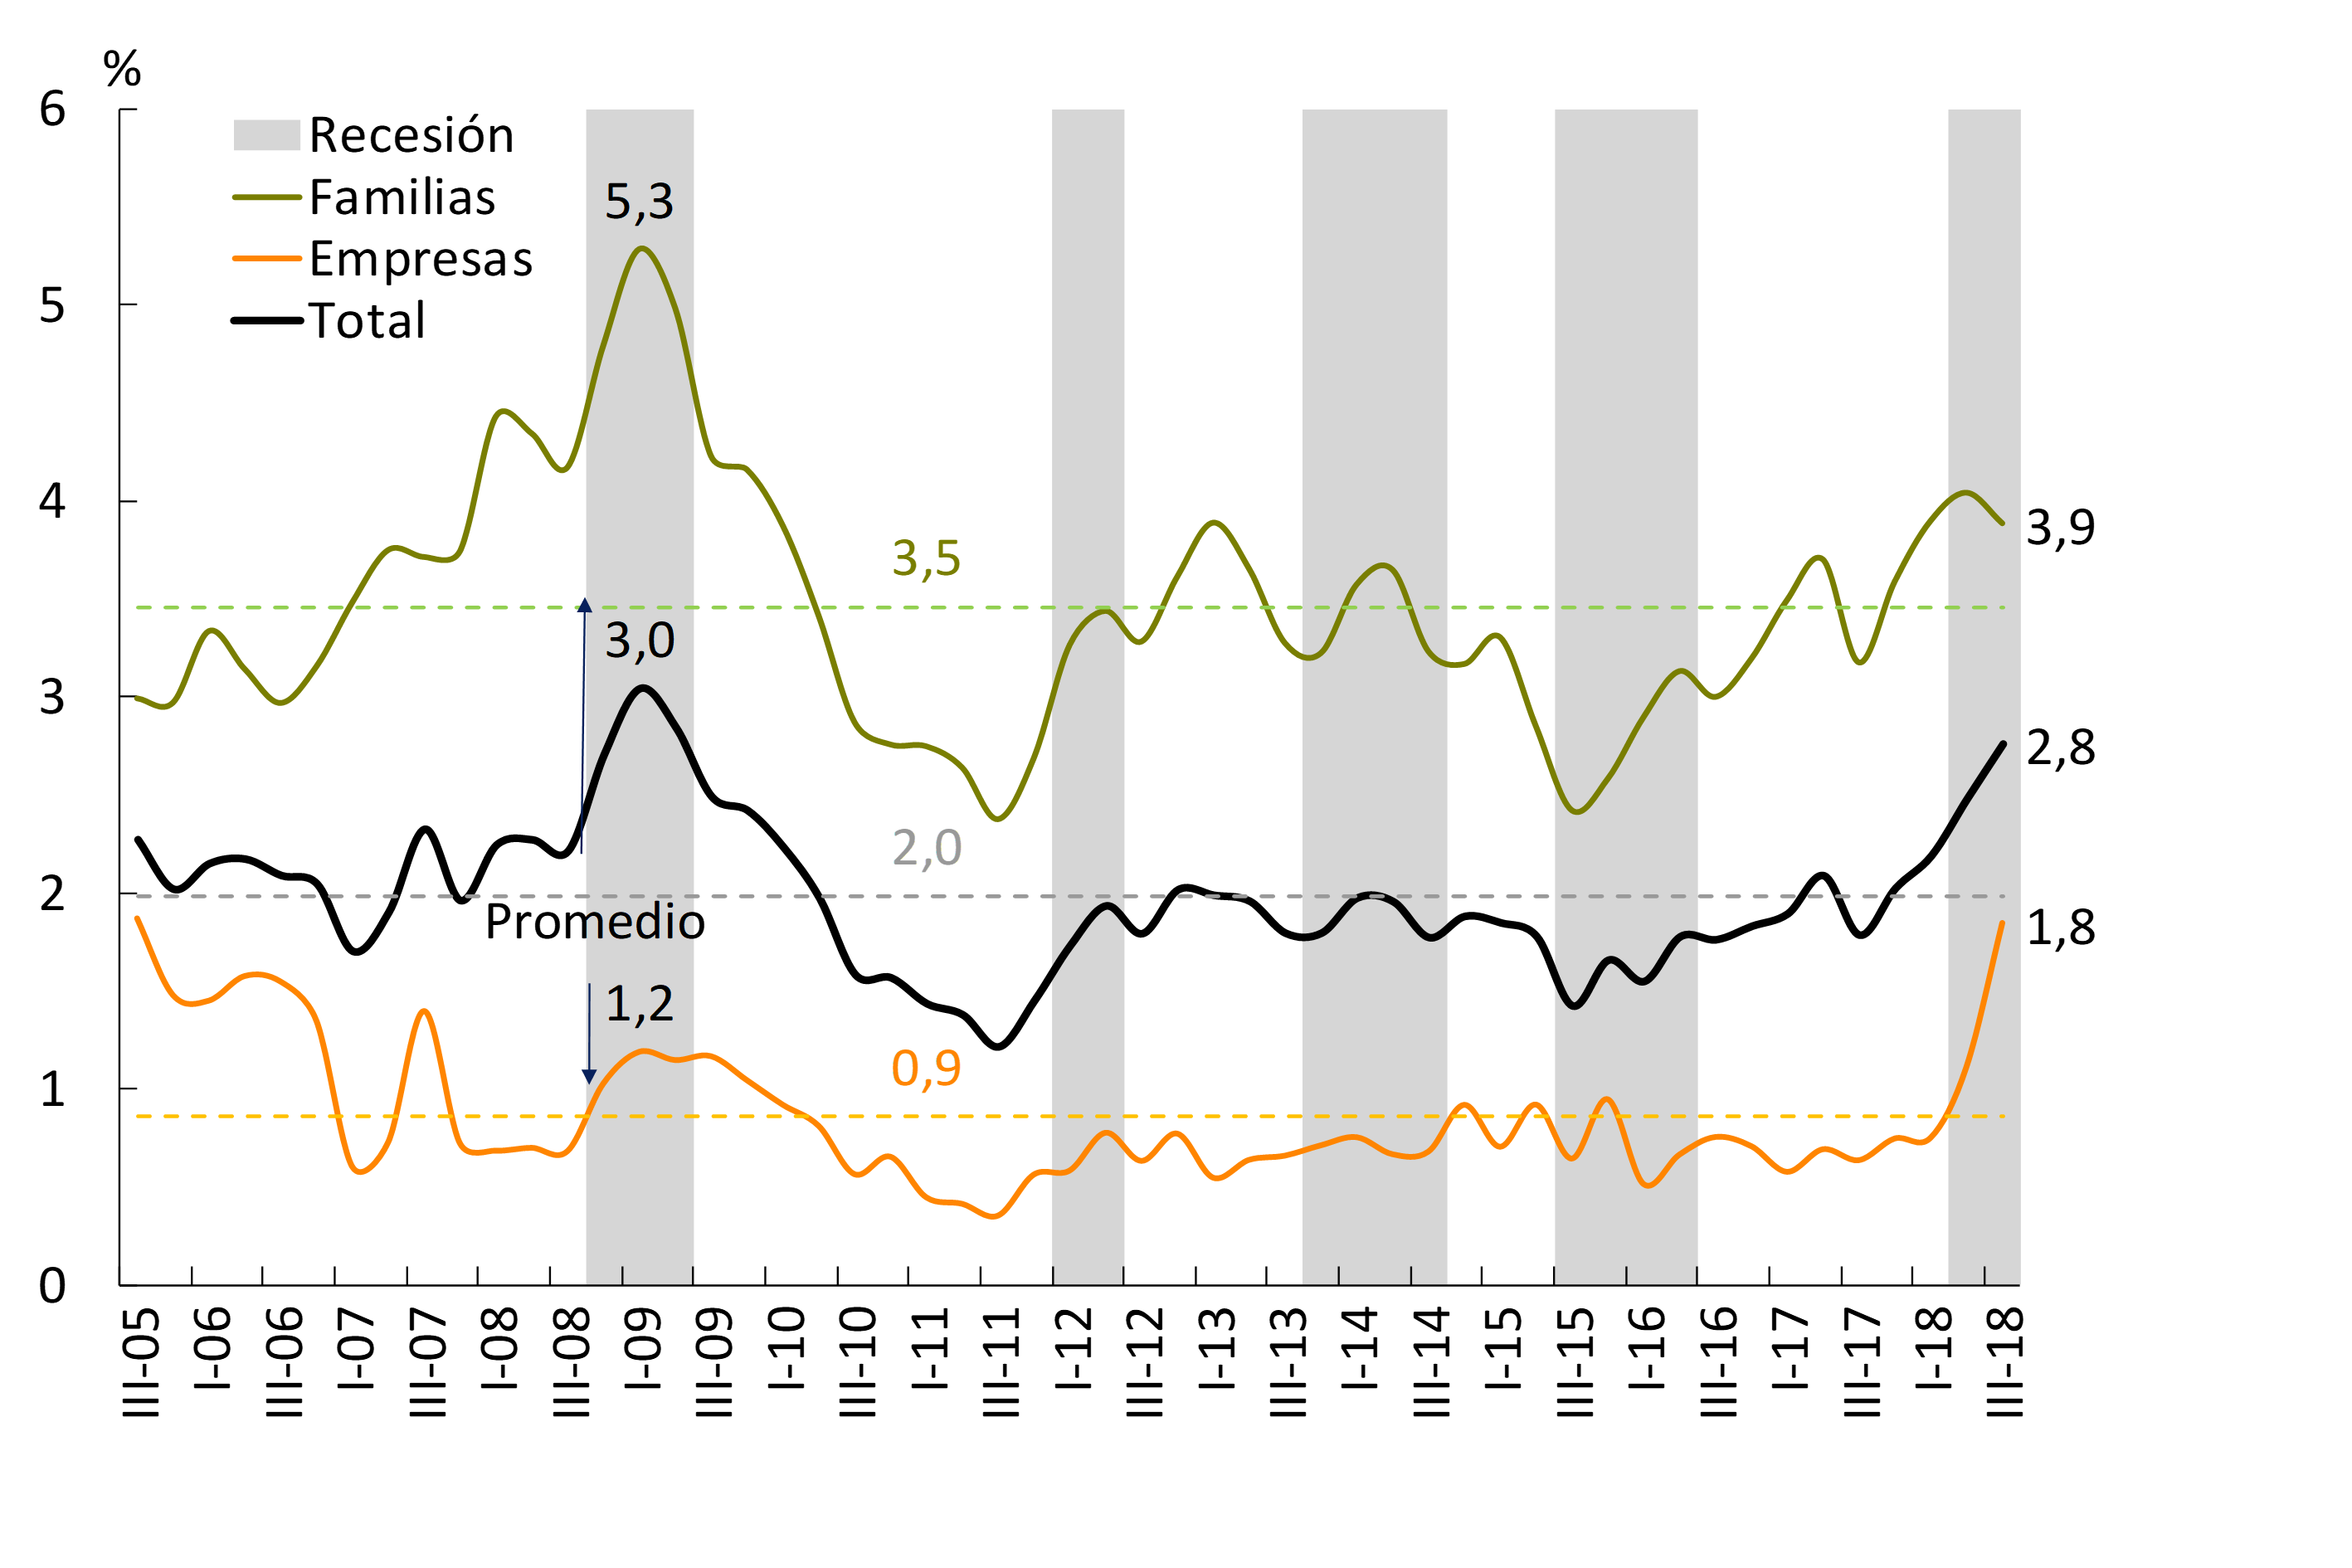
The materialization of credit risk was also reflected in indicators that consider microdata, such as the indicator of the probability of migration to a worse credit situation or frequency of worsening of the debt situation (MPI, see Figure 3.4). 35 This indicator increased during 2018 in loans to companies – reaching the highest in 10 years. The ratio corresponding to loans to households also grew throughout the year, maintaining the upward trend recorded since the end of 2015.
Figure 3.4 | Indicator of the probability of migration to a worse situation (MPI) Quarterly frequency of deterioration of the debt situation by balances
Box 5. Prudential regulation addressing the debtor’s currency mismatch risk
Since 2002, Argentine legislation has established that deposits in foreign currency received by banks must be used, fundamentally, to finance debtors with regular income from foreign trade operations and related activities. 36 This macroprudential measure aimed to address one of the sources of vulnerability in the local financial system, which exposed the sector to exchange rate volatility.
To illustrate the above-mentioned systemic vulnerability, it is useful to mention that by the end of 2000, almost half of bank loans to the private sector denominated in foreign currency (2/3 of total loans) were made by non-tradable debtors whose income was mostly not related to the exchange rate (see Figure 3.5). Against this backdrop, the depreciation of the local currency in 2002 resulted in significant tensions on the debtors’ ability to pay in foreign currency. Subsequently, a broad set of measures was adopted to address the effects on debtors and financial institutions, with a significant impact on society. The implementation of prudential restrictions on the use of foreign currency deposits was aimed at limiting future adverse situations of similar origin.
Figure 3.5 | Credit to the private sector
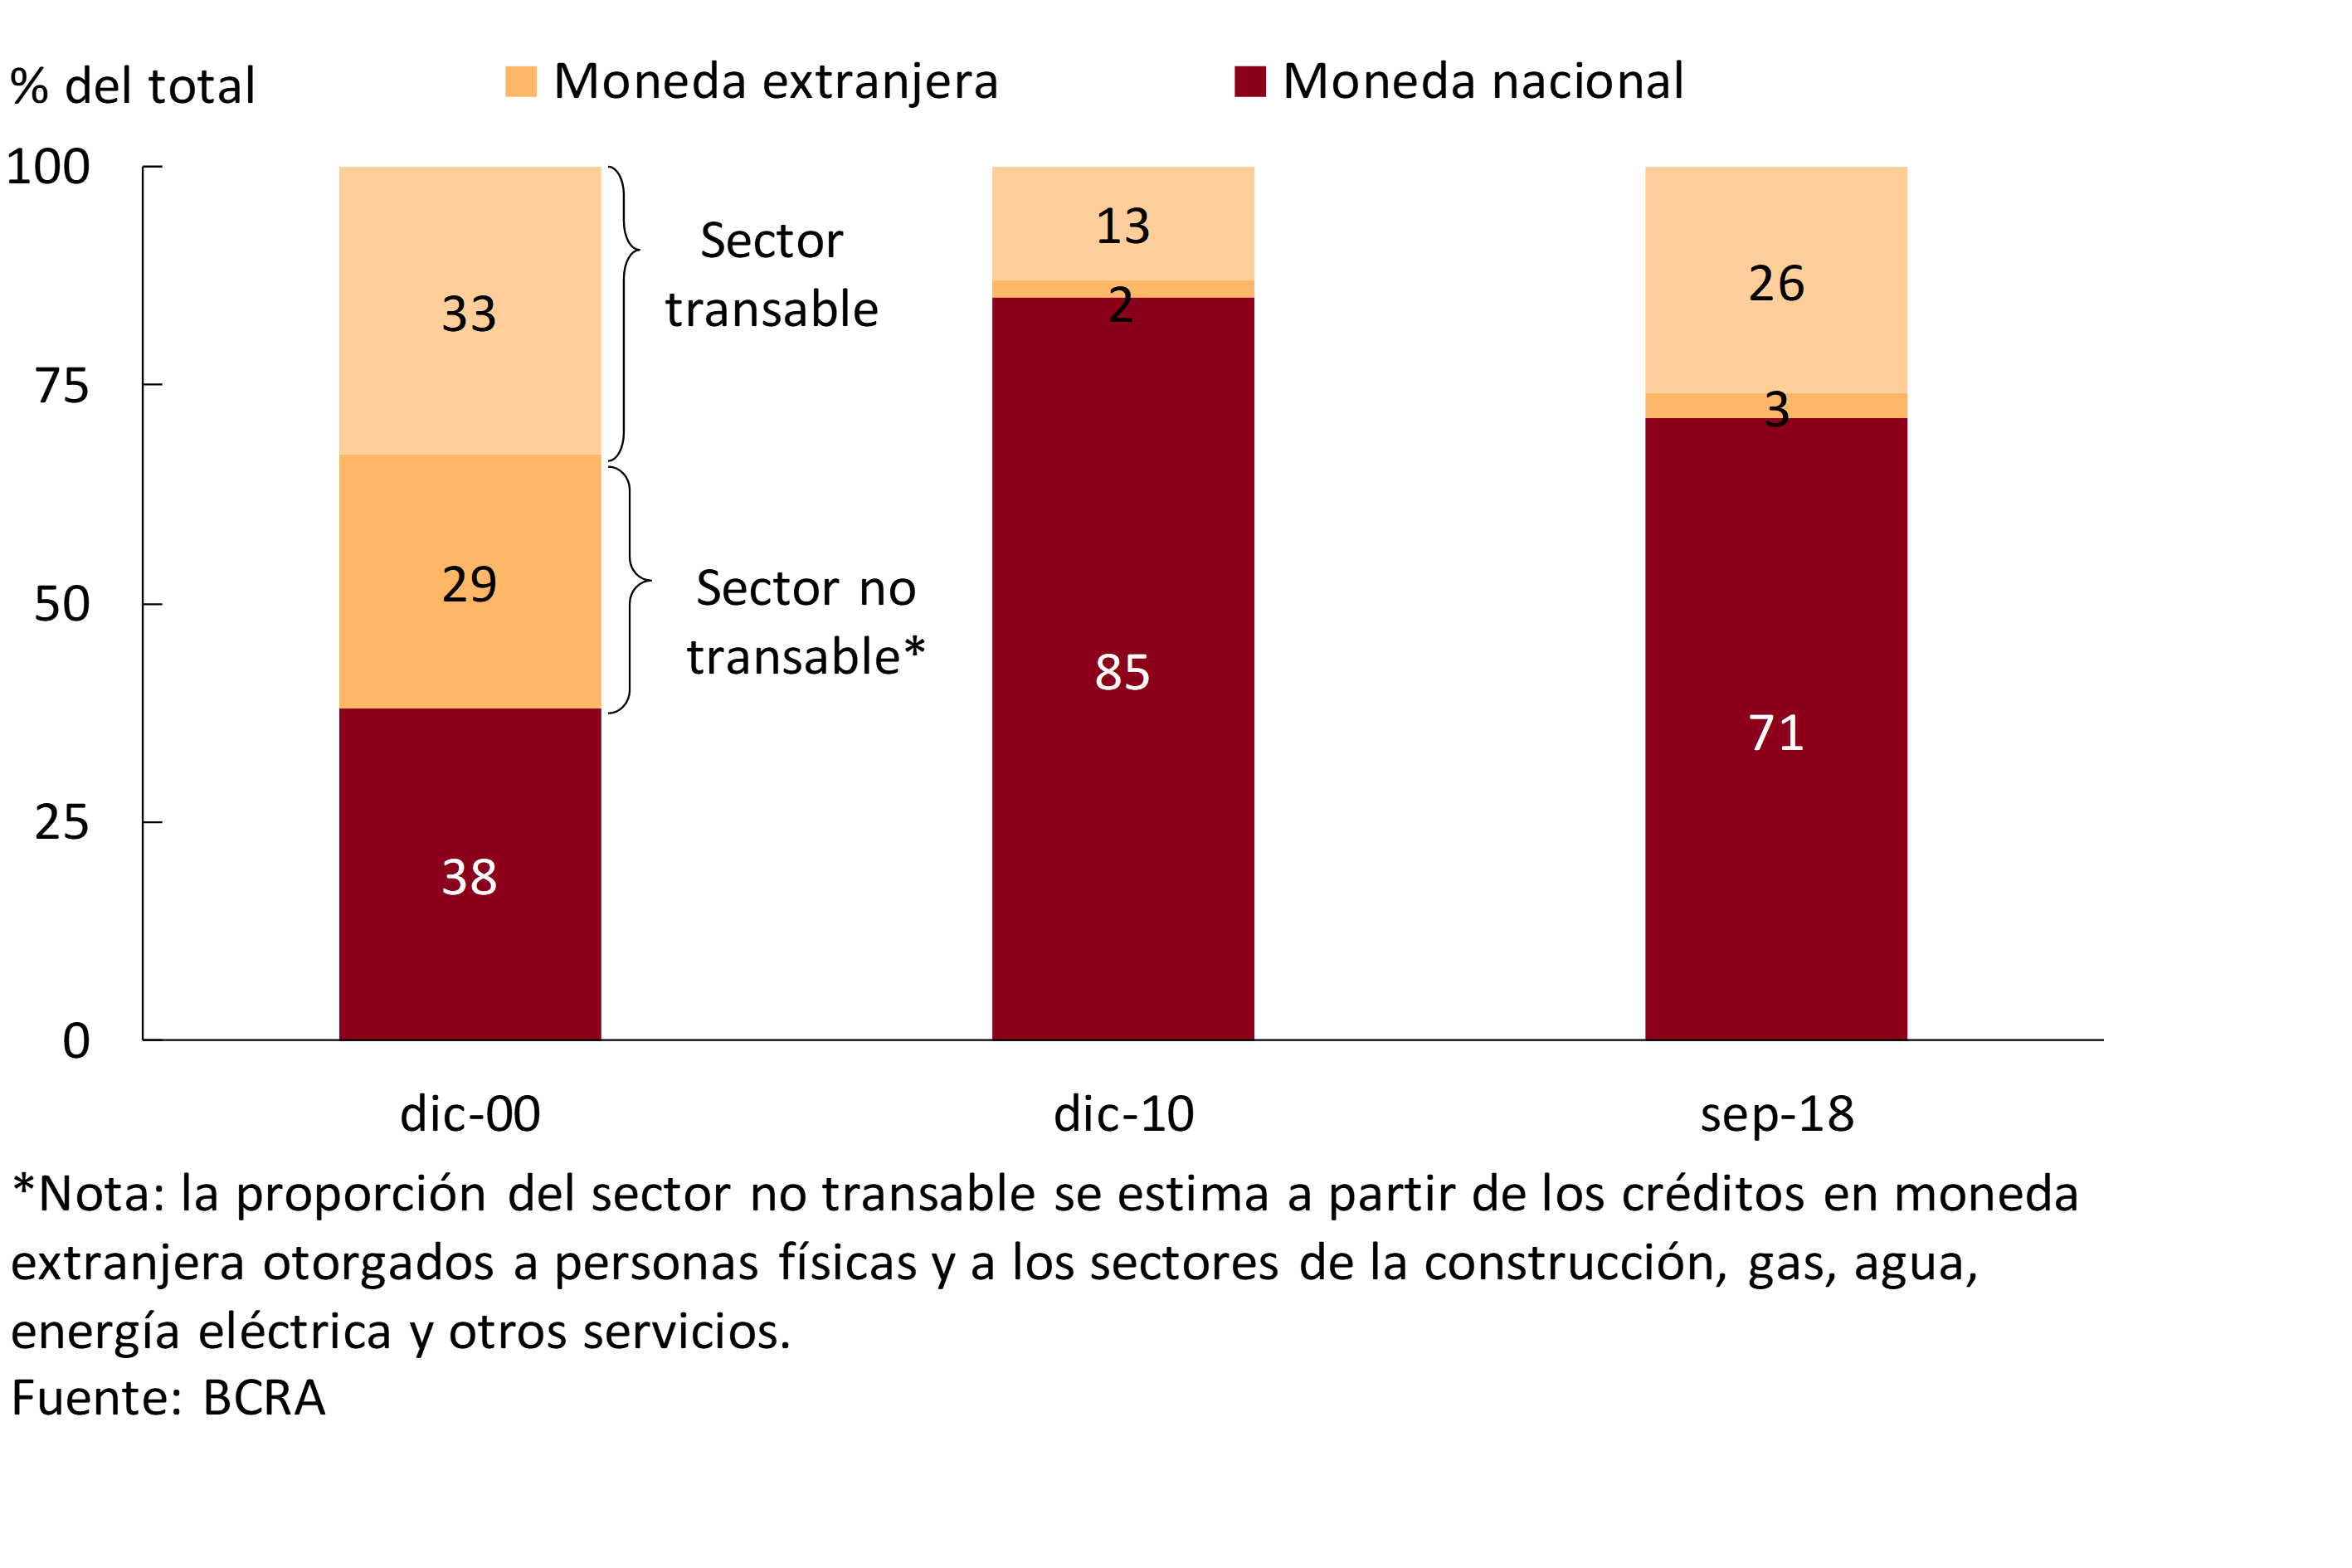
Currently, more than 71% of total credit to the private sector is denominated in local currency. Almost 90% of the balance of loans denominated in foreign currency (26% of the total) is being channeled to the tradable sector of the economy, thus significantly reducing the potential risk of default linked to movements in the exchange rate. 37 During the local impact of the international crisis that began in 2007, and despite the consequent depreciation of the peso-dollar exchange rate, the irregularity of the banks’ loan portfolios only showed a small and transitory increase. A similar situation is being observed throughout 2018, in the face of the increase in the exchange rate, the levels of irregularity show increases of limited magnitude over historically low levels. 38
As expected, it is possible to identify a significant statistical relationship between the variations in the irregularity indicators, the GDP and the real interest rate. 39 In this context, if the performance of the irregularity ratio of credit to the private sector in periods of decline in the level of economic activity in the past is analyzed,40 it can be seen that the relative increase in non-performing loans that has been recorded in the last two quarters of 2018 does not differ substantially from what has been historically evidenced. 41 In this context, and given the economic outlook for the remainder of the year (see Chapter 1), it would be feasible for the levels of irregularity ratios to continue to increase at the margin.
In this context, it is relevant to consider the credit risk assessment that has been carried out by all institutions. Different indicators associated with credit origination standards and loan terms show some recent tightening by banks (increase in spreads, for example), which would be in line with the perception of an increase in credit risk indicators (see Box 6).
Box 6: New indicator on credit risk assessment
In order to explore aspects related to the consistency in the valuation of credit risk made by local banks, it is useful to jointly monitor credit origination standards (EOC), terms and conditions (TC) of credit granting and the expected materialization of credit risk (CR).42
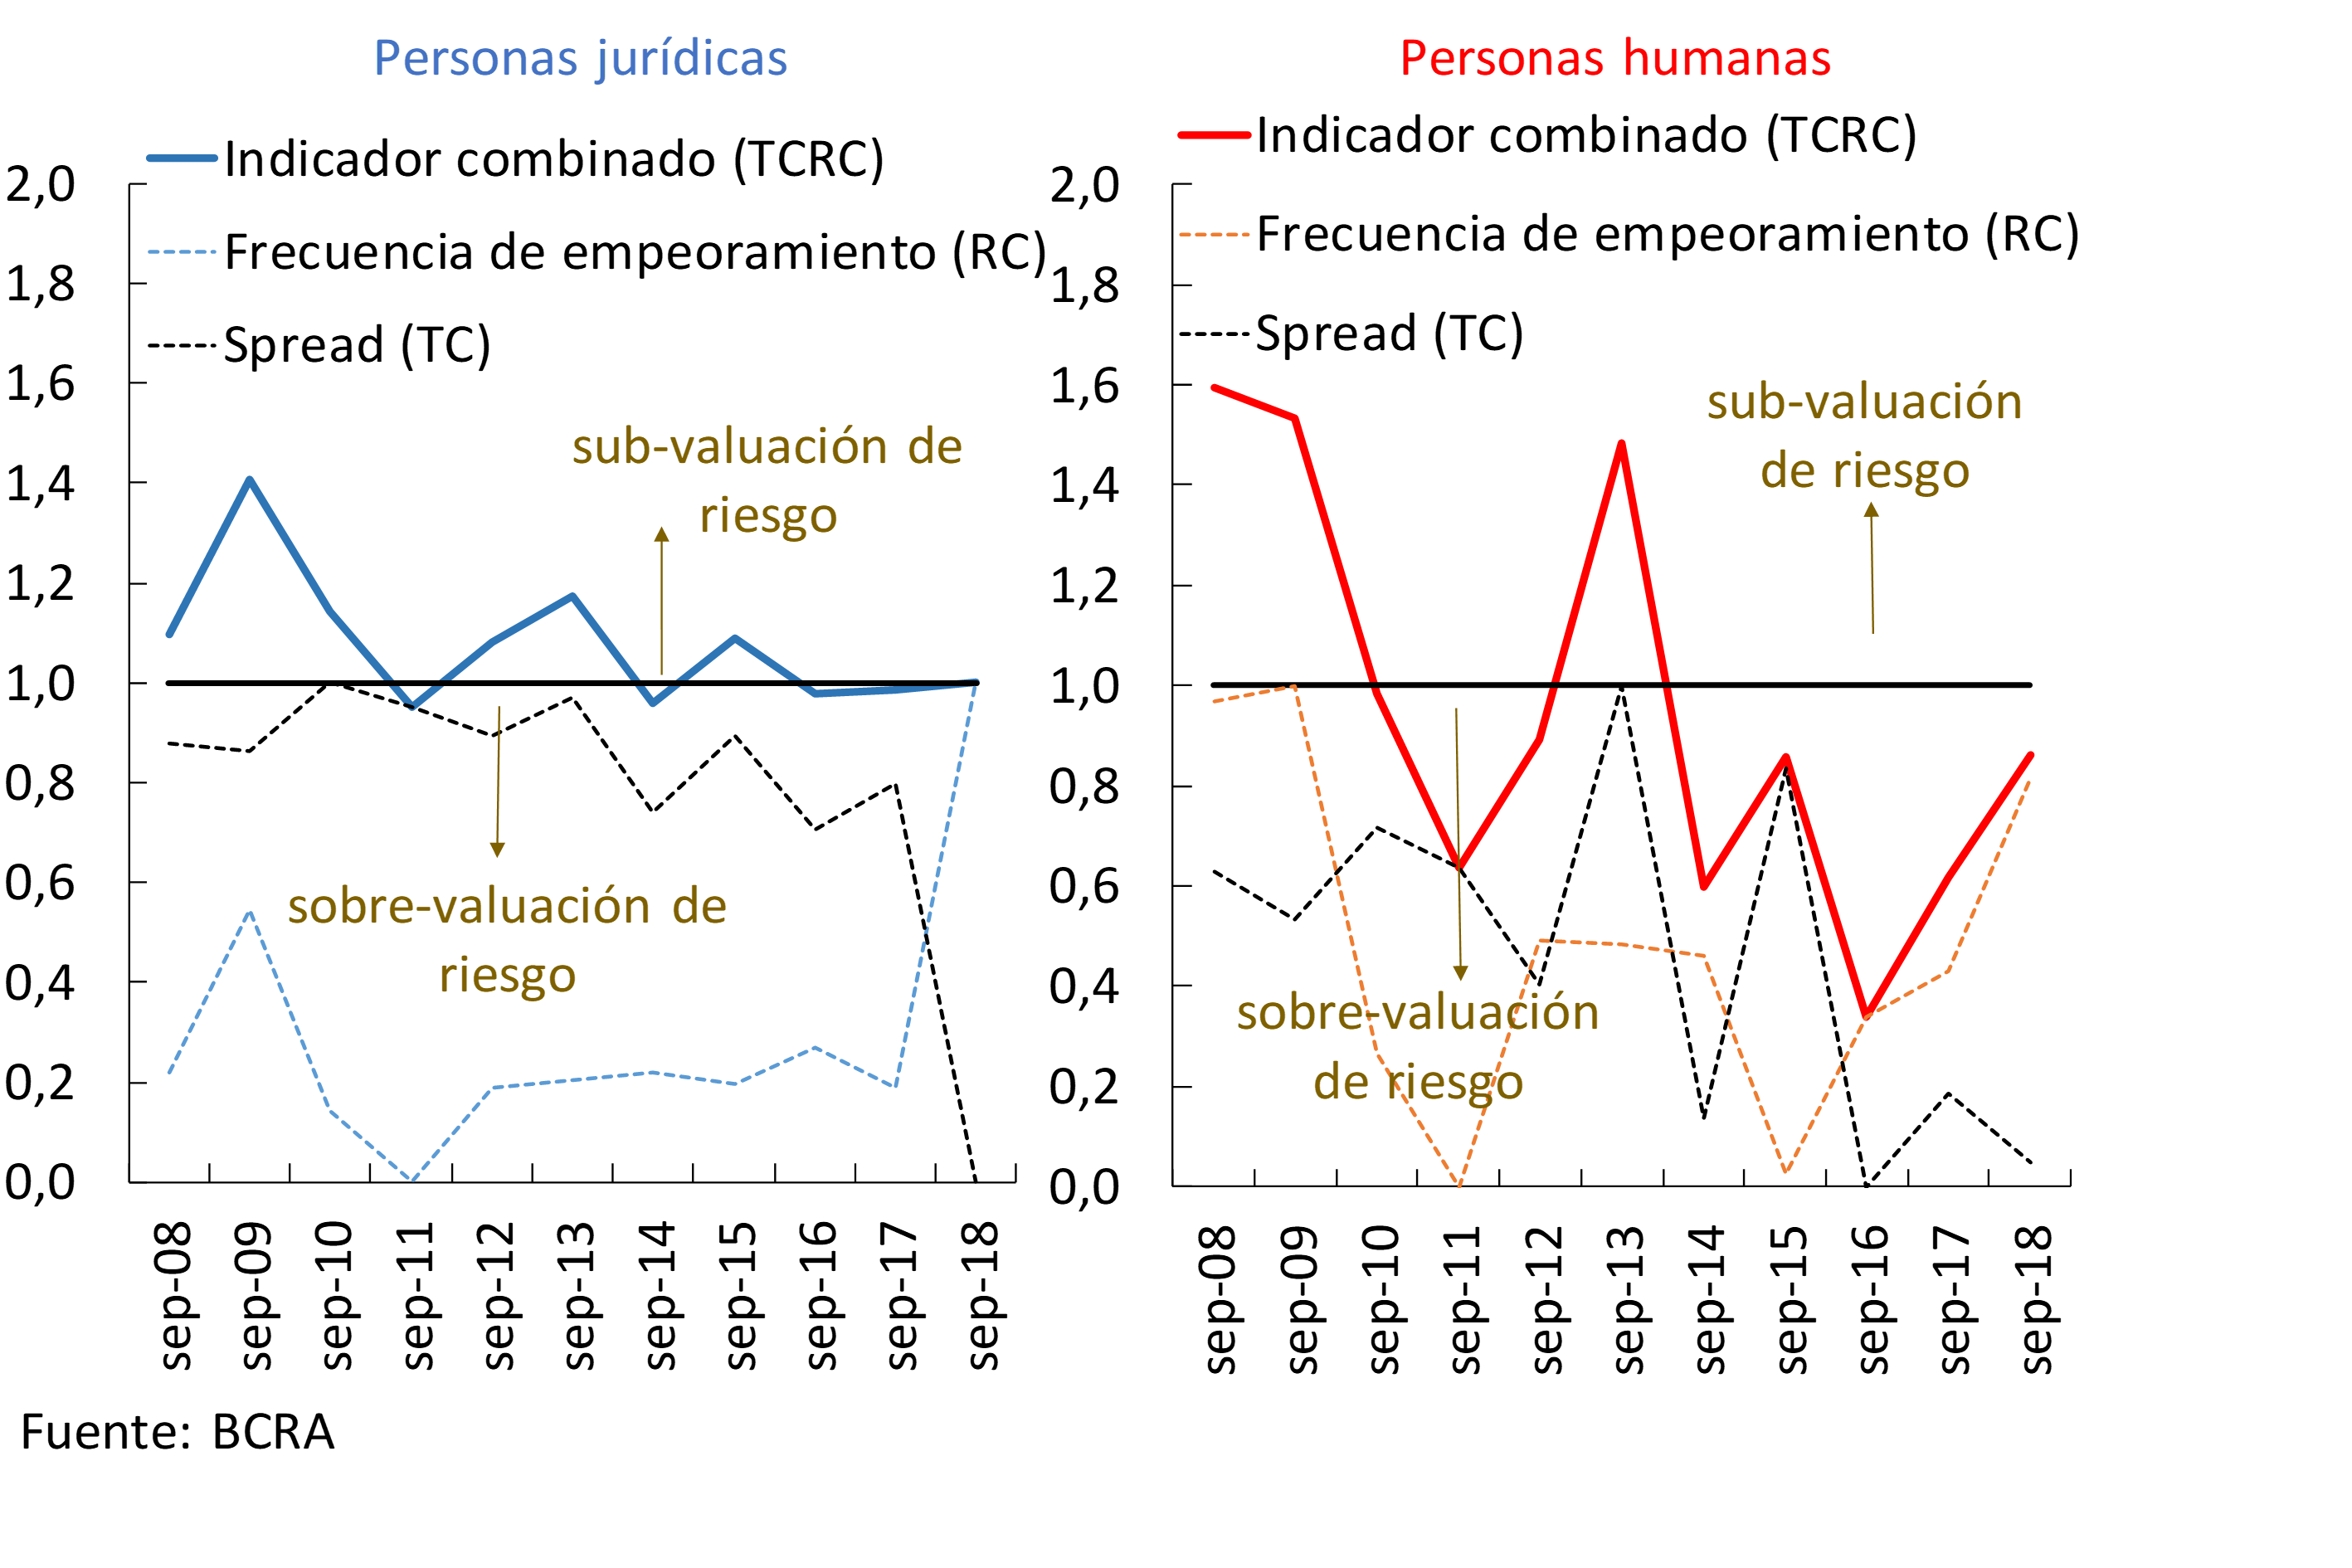
To address this issue, within a set of tools, an indicator is presented here that combines a TC (spread) metric with a CR (IPM) metric. 43 For the construction of the indicator, the time series of these metrics (for the last 10 years) are re-scaled in the interval [0, 1]. In the case of MPI, the value 0 (zero) is taken at the lowest recorded within the period covered and 1 (one) at the maximum. In the case of the spread, the 0 (zero) is taken at the high and the 1 at the low. Then, the re-scaled metrics are added, defining the TCRC indicator, which by construction can take values in the interval [0, 2]. All other factors unchanged, a level close to 1 of the CRGR corresponds to a situation in which the spread and MPI are consistent (a high spread accompanies a high MPI, or a low spread with a low MPI). 44 As CRGR values move away from 1, there could be some bias towards under-under-valuation (between 1 and 2) or over-valuation of credit risk (between 1 and 0). CRCT changes can also provide information, considering that the rest of the relevant factors do not change (e.g., that TC is not responding to CR increases). 45
Both the TCRC for individuals and the TCRC for legal entities were close to unity in the third quarter of 2018 (see Figure 3.6). In legal entities, there were no significant changes compared to the same period in 2017. That is, increases in deal spreads (see Chapter 2) were consistent with increases in the metric related to credit risk (see Chapter 3). In humans, the TCRC was close to 1, in the risk overvaluation zone. The positive correlation was more important in the segment of legal entities.
Figure 3.6 | Estimation of the combined indicator of spread and frequency of worsening of the debt situation
3.2.3. The results of the credit risk sensitivity exercises show limited potential impacts
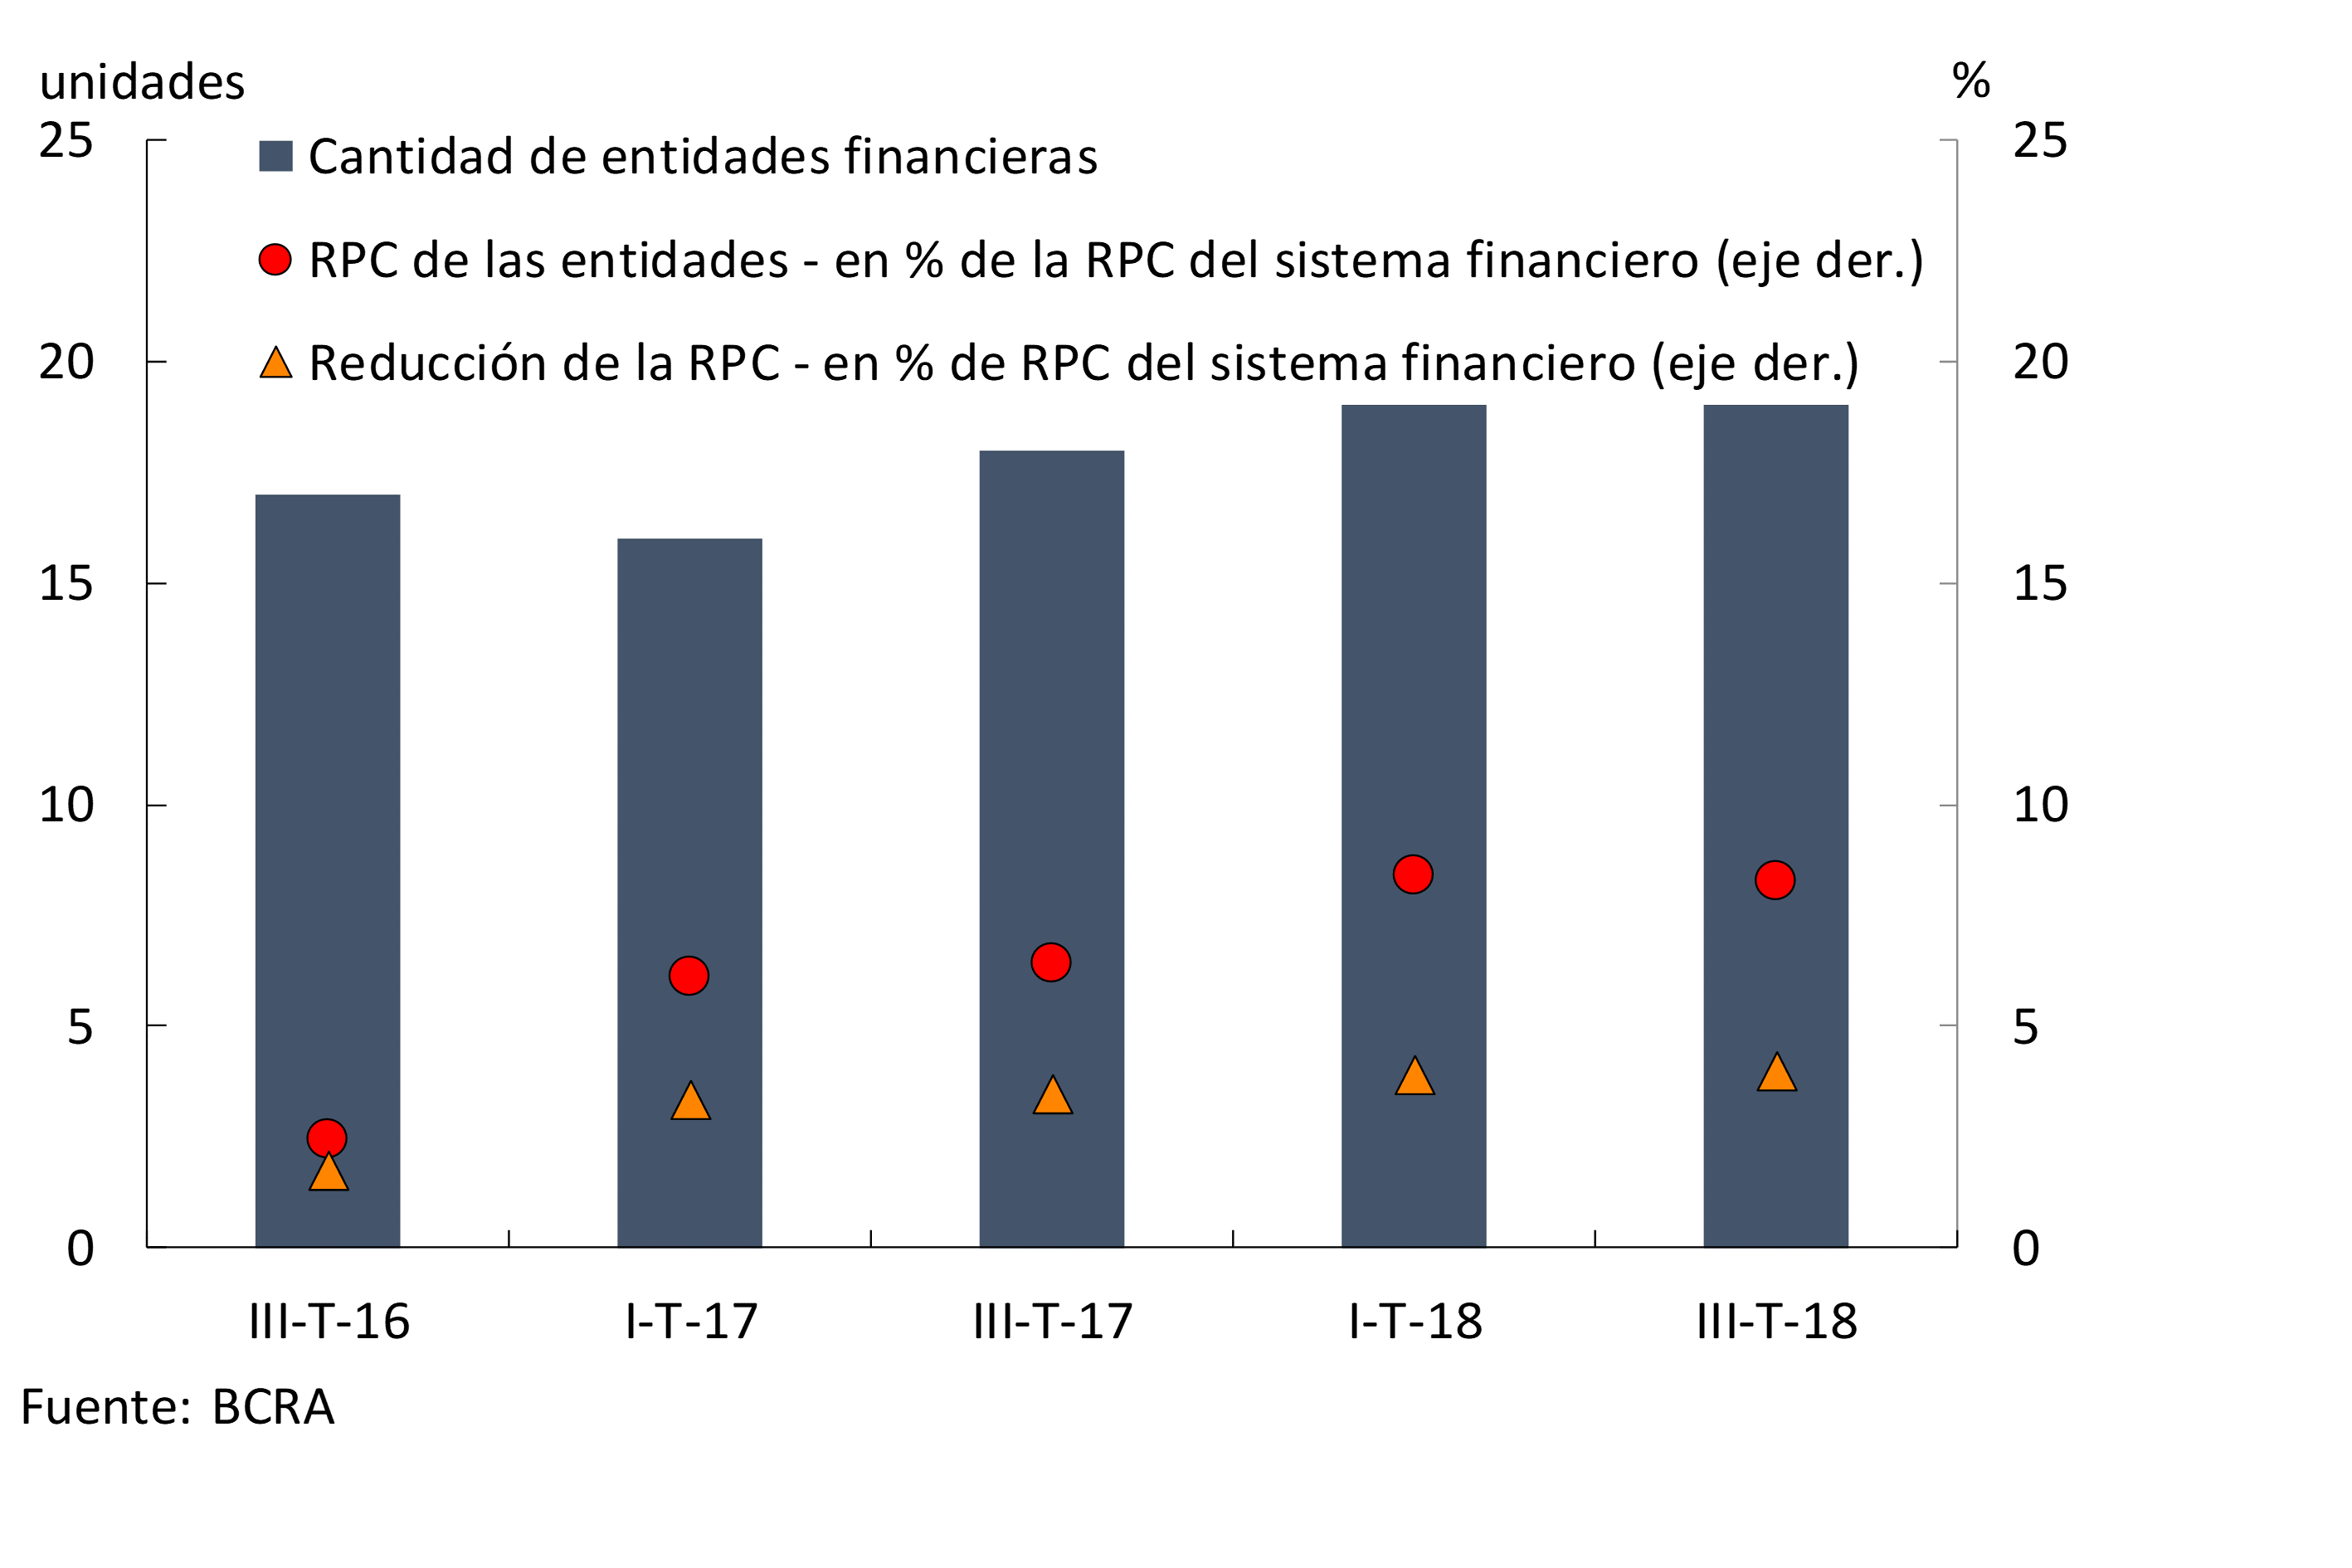
In order to monitor the soundness of the financial system, the BCRA regularly carries out different stress exercises, both in terms of sensitivity analysis and scenarios. 46 Considering together the different sensitivity exercises carried out by the BCRA, for the third quarter of 2018 it is observed that banks would have a level of capital, above what is required by the regulations, high enough to face these adverse credit risk scenarios without significant tensions. In particular, there were no changes in magnitude with respect to what was evidenced in the last IEF in terms of the results obtained from the year, which contemplates a hypothetical increase in the NPL ratio of each entity to the maximum levels recorded, for each of them, in the 2008-2009 crisis (see Figure 3.7). 47 After the simulated adverse shock, by the third quarter the number of entities that would be left with a negative capital position would amount to 19 (together, they represented 8.3% of the total capital of the financial system before the shock). The aggregate equity impact that the simulated failure would mean in this group of 19 entities would be reduced, in the order of 4% of the system’s PRC. 48
Figure 3.7 | Results of Exercise B Sensitivity on Regulatory Capital – Information from Entities with Negative Capital Positions After the Shock
In order to consider “domino” effects among financial institutions, the possible implications of these results were evaluated, taking into account the interconnections in the market for unsecured inter-financial loans. 49 It should be recalled that at a systemic level this market is small, as detailed in Section 5, but it can provide relevant information on systemic credit risk. Thus, of the 19 banks mentioned in the previous paragraph, only 3 were taking funds from 2 other financial institutions in this interfinancial market at the end of the third quarter. Continuing with this hypothetical exercise, it is assumed that none of the 3 banks taking funds would be able to meet their commitments for the interfinancial loans taken, thus causing a loss of capital for the entities that granted these resources. 50 From the results obtained, it is clear in September that none of the 2 entities offering this type of assistance would be left with a capital defect due to this adverse shock.
3.3. High liquidity risk hedge
Indicators of exposure to systemic liquidity risk showed a mixed behavior. In recent months, the concentration of total deposits has increased moderately, mainly in public banks, in a context of lower weighting of deposits by individuals. 51 On the other hand, so far this year the relative weight of less mature liabilities in bank funding has decreased. 52
In a context of regulatory changes and monetary policy measures, and given that deposits performed well despite the macro-financial context of the last two quarters, banks as a whole continued to exhibit a high level of liquidity risk coverage. The most liquid assets in terms of deposits were at a level above that observed in the last edition of the IEF. As mentioned in Chapter 2, in the portfolio of liquid assets for the segment in national currency, the balance of the current accounts that banks have in the BCRA and the securities eligible for minimum cash calculation (LELIQ and BOTE 2020) gained weighting (see Figure 3.8). The composition of liquidity in foreign currency did not show any relevant changes compared to March of this year, maintaining a coverage of around 50% of the total. For its part, the Liquidity Coverage Ratio (LCR), which measures the availability of quality funds in a hypothetical stress scenario, amounted to 2.2 at the end of the first half of the year, growing 0.1 compared to the end of 2017. 53 Thus, the local financial system continued to show levels above international recommendations for this indicator (for 2018 they suggested a minimum ratio of 0.9). In addition, as of this year, the Stable Net Funding Ratio (NFSR) came into force locally, an indicator aimed at ensuring that banks have stable resources with which to finance their longer-term assets. 54 In the middle of the year, the NFSR for the banks as a whole stood at around 1.5, thus exceeding the internationally recommended levels by almost 50%.
Figure 3.8 | Level and composition of bank liquidity by currency – As % of deposits
3.4. The UVA mismatch in the financial system increased slightly, although there was a new boost in the increase in deposits in that denomination
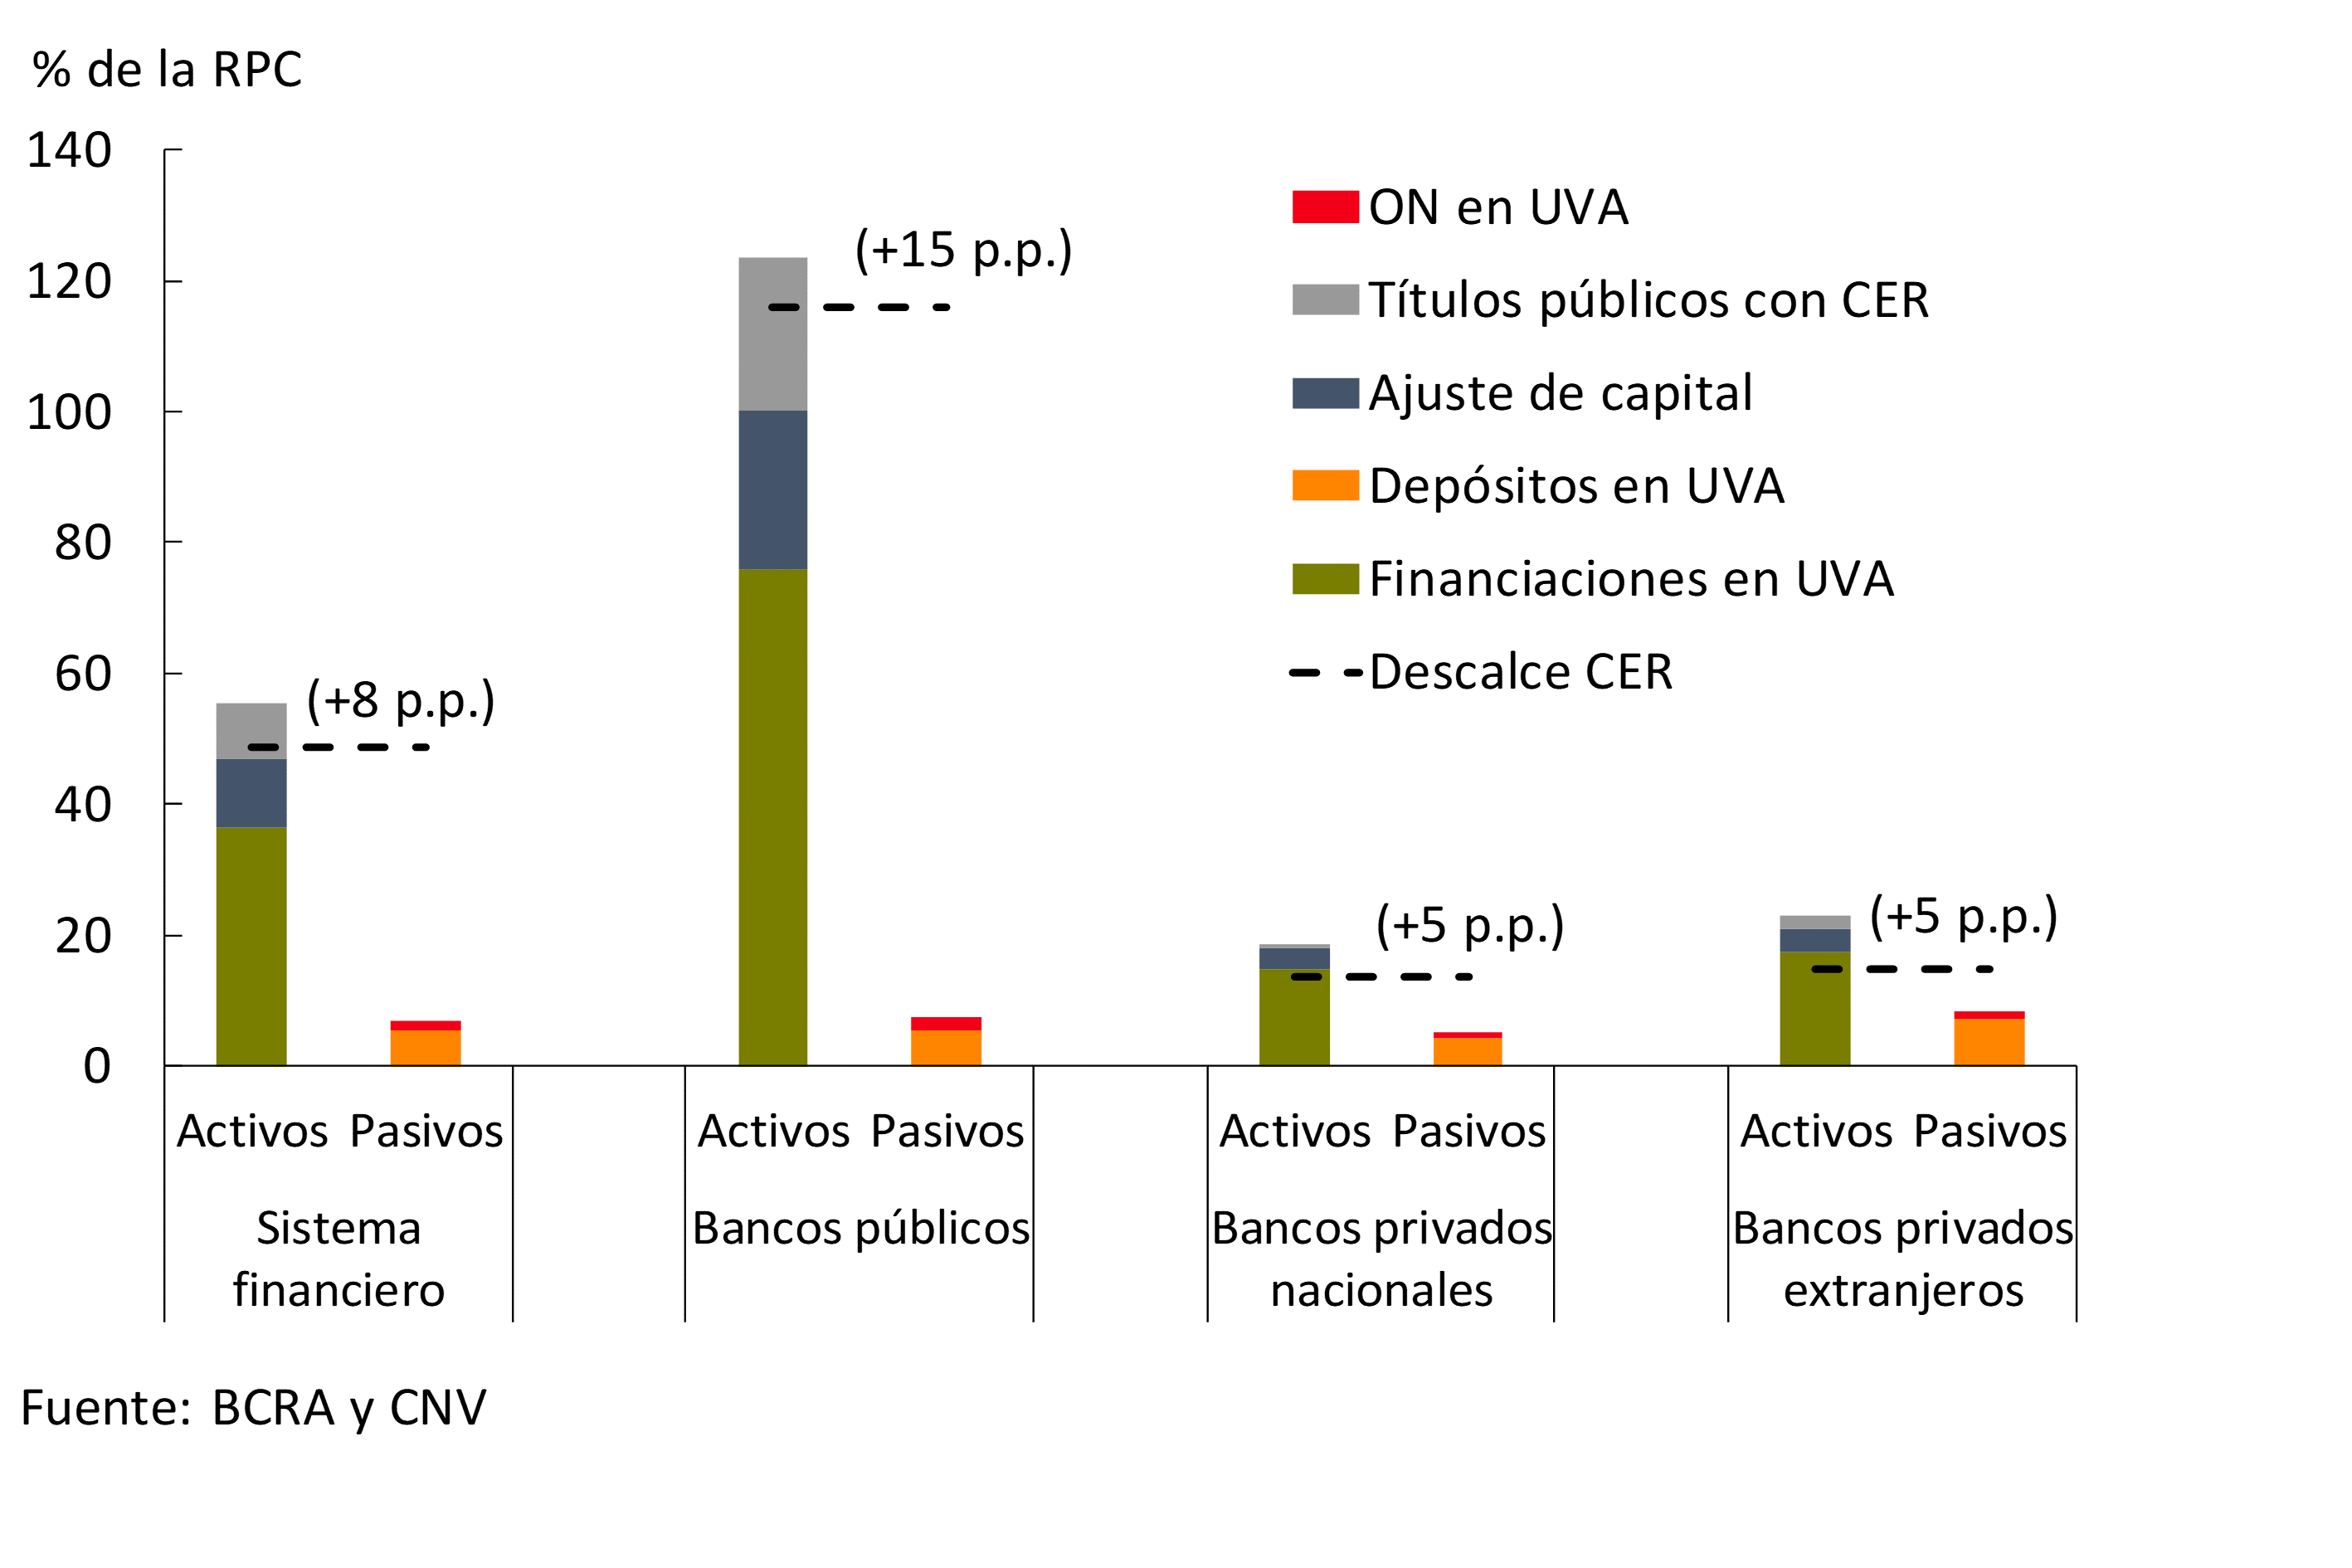
As mentioned in Chapter 2, UVA loans continued to grow in 2018, showing some slowdown since last June. On the UVA funding side, in recent months deposits increased their growth rate (from lower levels) and until September there were no bank debt issuances. 55 Given the active mismatch in UVA, the increase in inflation in recent months generated a re-expression of capital and a greater gap measured in pesos. As a result, this spread for the aggregate financial system represented 37.9% of the PRC in September, almost 10 p.p. above the March 2018 level (more than half of the increase was due to the re-expression of inflation items).
When considering the rest of the balance sheet items adjustable by CER (mainly government securities), the mismatch in terms of these items stands at around 48.7% of the PRC, 8 p.p. more than the level of March this year at a systemic level. By group of entities, it can be seen that this mismatch continued to be mainly explained by public banks (see Figure 3.9). Given the limited size of the CER asset mismatch (including UVA) and the evolution of inflation and interest rates (see IPOM and Chapter 2), the associated risks to the system remain moderate. 56
Figure 3.9 | Estimation of the CER mismatch and its components by group of banks – September 2018 – The variation in the mismatch compared to March 2018 is detailed in parentheses
3.5. Limited levels of exposure to currency and maturity mismatches
The active mismatch of foreign currency in the financial system stood at around 17.8% of regulatory capital (RPC) in September, growing 8.4 p.p. compared to the last IEF. 57 The effect of the re-expression of the mismatch to a higher nominal exchange rate largely explained this increase when measured in terms of the PRC. The system’s currency mismatch is currently at low levels, partly as a result of the regulation on the Net Global Position in Foreign Currency that establishes prudential limits to this equity mismatch of the entities. 58 As of September, the regulatory capital requirement linked to foreign exchange risk amounted to 3.8% of the total requirement (2.4% of the PRC), 1.3 p.p. more than at the end of the first quarter (+0.9 p.p. in PRC terms). These variations were mainly explained by public banks.
On the other hand, banks structurally exhibit little transformation of terms, concentrating, in general, on transactional activities. In recent months, the lower relative growth of loans in relation to deposits and the obligation to accommodate a greater weighting of the latter accentuated the low transformation of maturities. Given the increase in benchmark interest rates, the implicit cost of funding deposits increased more than the implied lending rate, thus reducing the interest margins that banks earned on their balance sheets (see Chapter 2). Given the low exposure, the materialization of interest rate risk had a relatively limited equity effect on the financial system.
At the end of 2017, the BCRA announced changes in the guidelines for the management of interest rate risk in the investment portfolio,59 which came into force in mid-2018. 60 The adequacy of capital due to this risk must be explicitly contemplated in the internal assessments of the institutions (ICAAP) (Internal Capital Adequacy and Assessment Process). Beyond this standardized framework, the quantity and quality of capital must be guaranteed according to the profile and appetite for risk. Given that this risk falls under Pillar 2 (Basel Committee), the supervisor has full power, if deemed necessary, to require capital readjustment. 61
4. Payment system
The BCRA seeks to contribute to the achievement of safer, faster and less expensive transactions, promoting higher levels of financial inclusion. To achieve this objective, this Institution continues to promote measures aimed at encouraging greater use and dissemination of electronic means of payment. The indicators show that since the publication of the last IEF, the trend towards greater use of electronic media by the population continues. In particular, in the accumulated from January to September of this year, electronic means of payment (immediate transfers and low-value vaults, direct debits and credit and debit cards) verified a year-on-year increase of 1.4 p.p. in terms of the economy’s output, reaching a level of 43.7%.
Modernization of the National Payment System
The BCRA continues to promote different initiatives in order to increase the use, as well as expand the universe of electronic payment providers and alternatives. Along these lines, the electronic check or ECHEQ was recently created. The enactment of Law 27,444 on the Simplification and Debureaucratization of Productive Development introduced a series of modifications to the Checks Law, which have made it possible to correct the main drawbacks that hindered the implementation of the purely electronic check. Such is the case of the extension of the requirement of digital signatures. The latter, as of Law 27,444, may be replaced by any electronic method that indubitably ensures the externalization of the will of the drawer, endorser or guarantor in each case, and the integrity of the instrument. Moreover, the aforementioned Law provides the framework for the ECHEQ to become an enforceable title. Subsequently, the BCRA proceeded to regulate it through Communication A6578, providing that as of April 1, 2019, financial institutions must be in a position to receive electronic checks on deposit or pay over the counter, all without prejudice to maintaining the paper format in force (See Box 7).
Box 7. The electronic check
The electronic check (ECHEQ) is a check generated by electronic means that may be issued in favor of a specific natural or legal person, and is framed in the current regulation in the aspects that are applicable to this new modality and in all those aspects related to the clearing and settlement of securities.62
In order to boost the market and enable transactions between the parties involved, it was at least mandatory for financial institutions to deposit electronically issued checks and cash them over the counter. This means that entities that choose not to issue ECHEQ, in any case, must be in a position to receive them for deposit or payment and subsequent accreditation and collection.
The ECHEQ is intended to maintain the functionalities of the traditional check, for example, it can be common or deferred payment, it has the character of an enforceable and endorsable title without the restrictions on the number of endorsements established in the current regulations for physical checks (“one” for common check, “two” for deferred payment checks). In fact, since the endorsement scheme provided for the ECHEQ will give greater traceability to the current operation, the possibility of unlimited endorsements has been contemplated.
Among the expected benefits is the reduction of the reasons for rejection, in particular, those linked to formal defects (e.g. non-coincidence of the signature with the registered one) or aspects that invalidate it as a check (lack of some data, unsaved deletions, etc.), to mention just a few situations that would be impossible in an electronically issued document. In addition, the ECHEQ will facilitate its negotiation, allowing it to be carried out purely electronically and remotely, reducing operational costs, transfer and verification of documents, thus speeding up the discounting of checks in the capital market.
As for the operation designed for the ECHEQ, it has been proposed to create a common repository that will be operated exclusively or shared by the Low Value Clearing Electronic Chamber, which currently performs the clearing of checks. Financial institutions will be able to consult the transmissibility chain in this reservoir and will also have the possibility of carrying out appropriate controls to detect situations that imply risks for them. To this end, they must agree on how to implement access to the consultation in each case according to the corresponding profile. The technical details of this model will be agreed upon through the Interbank Commission of Payment Methods (CIMPRA), within whose scope the conformation of the certificate to be regulated will also be agreed with the aim of allowing the exercise of civil actions in the event of rejections of ECHEQs.
The risks of implementing ECHEQ are associated with the creation of a centralized structure, compared to traditional operations. Whether due to internal failures of these new systems or cyberattacks, the ECHEQ ecosystem presents different risks from the traditional cheque, with which it will coexist. For this reason, the infrastructures that manage the ECHEQ repository system, as well as those responsible for its related processes such as clearing or settlement, will be considered as systemically important financial market infrastructures and therefore the Principles for Financial Market Infrastructures of the Bank for International Settlements (BIS) will be applicable to them. Bank of International Settlement—to mitigate the risk established in current regulations. 63
In this new context, the use of electronic means for the issuance and negotiation of checks has appeared as an opportune means to increase the efficiency of the operation of this instrument of the National Payment System.
With the aim of continuing to contribute to the process of development and modernization of the Argentine payment ecosystem, with the recent creation of the Uniform Virtual Key (CVU), progress has been made in streamlining the interoperability of payment service providers (PSPs) and bank accounts. These relatively new payment services are not linked directly to a customer nominated bank account, but operate through wholesale bank accounts in the name of the payment service provider. Prepaid cards or digital wallets are examples of these payment services. Through the extension of the traditional bank account routing system (CBU) to payment service providers, the interoperability and traceability of these operations is facilitated (See Box 8). 64 With this new scheme, a bank customer with a traditional account can, from their home-banking, make a transfer to a person who has an account in a digital wallet by entering the CVU, in the same way as they currently do to another bank account through the CBU. The use of the CVU makes it possible to identify: a) that it is a transfer destined for a wholesale account, b) the PSP that owns said account and c) the final recipient of the funds. In this way, the clearing house can relate through the bases managed by the CVU with the CBU of the payment service provider, credit the wholesale account and inform the accredited entity of the wallet account data, which allows PSPs to reflect the immediate crediting of their customers’ funds when it occurs.
Box 8. Interoperability and inclusion in Payment Systems
Interoperability between different types of accounts is a global trend. Its implementation seeks to promote financial inclusion and competition. Interoperable payment systems make it easier for people to transact payments immediately and usually at a low cost. In this sense, payment services, especially those provided by non-financial entities, have been one of the main financial innovations in recent years and have grown globally, as well as in Argentina.
Interoperability models can be different from market to market, and they can also present a wide variety of forms of interoperability in the same market. In this context, and taking into account the study carried out by the CGAP (Consultative Group to Assist the Poor) on interoperability,65 two main guidelines are identified in the search for interoperability in countries, related to their scope:
1. Market-wide: These market-wide plans are comprehensive and are usually driven by a regulatory body, or a specific organisation or association close to the Government or whose activity is related to banking or payments activity.
2. Focused: It is oriented towards a subset of suppliers that develop “focused” interoperability mechanisms. They are targeted to specific use cases, in particular person-to-person, and do not provide for the participation of all Payment Service providers. These mechanisms are not commonly linked to a country’s broader banking infrastructure, and are generally almost universally supported by mobile operators.
According to the study, in a universe of 20 countries, six of them apply a “market-wide” approach, whereby some kind of central plan covers most vendors and use cases (Brazil, Ecuador, India, Jordan, Mexico, and Peru). There is usually a regulatory body or government organization driving (the National Payments Corporation of India, Association of Banks of Peru, etc.). On the other hand, four countries are identified as applying a “focused” approach, whereby a subset of non-bank providers have come together to agree on their own mechanism, which is largely independent of traditional banking and focused on person-to-person interoperability (Indonesia, Madagascar, Tanzania, and Thailand). The remaining ten do not exhibit a predominant pattern and a combination of these mechanisms may apply.
In the Argentine market, there are interactions between payment service providers and bank accounts, but their use is at an early stage. In most cases, it is not possible to cash in and out of a digital payment service quickly. The operation is oriented to transactions between accounts of the same payment service provider and the movement between bank and non-bank accounts is under the same ownership, although this varies according to each provider. The implementation of the CVU will speed up transfers between wallet accounts and traditional accounts, allowing transactions between different holders and their immediate crediting.
The use of the CVU will be optional for payment service providers, who may even choose to assign it only to a segment of their customers. However, the development of the interoperability promoted requires that the CVU can be processed by any financial institution, and have a unique alias, in the same way as CBUs. CIMPRA has been the area in which the operational aspects of this implementation have been agreed upon. 66
The move is expected to facilitate the interaction that already exists between traditional bank accounts and the wholesale accounts of payment service providers, adding information to transactions, strengthening their traceability and enabling their instant operation.
Evolution of the National Payment System
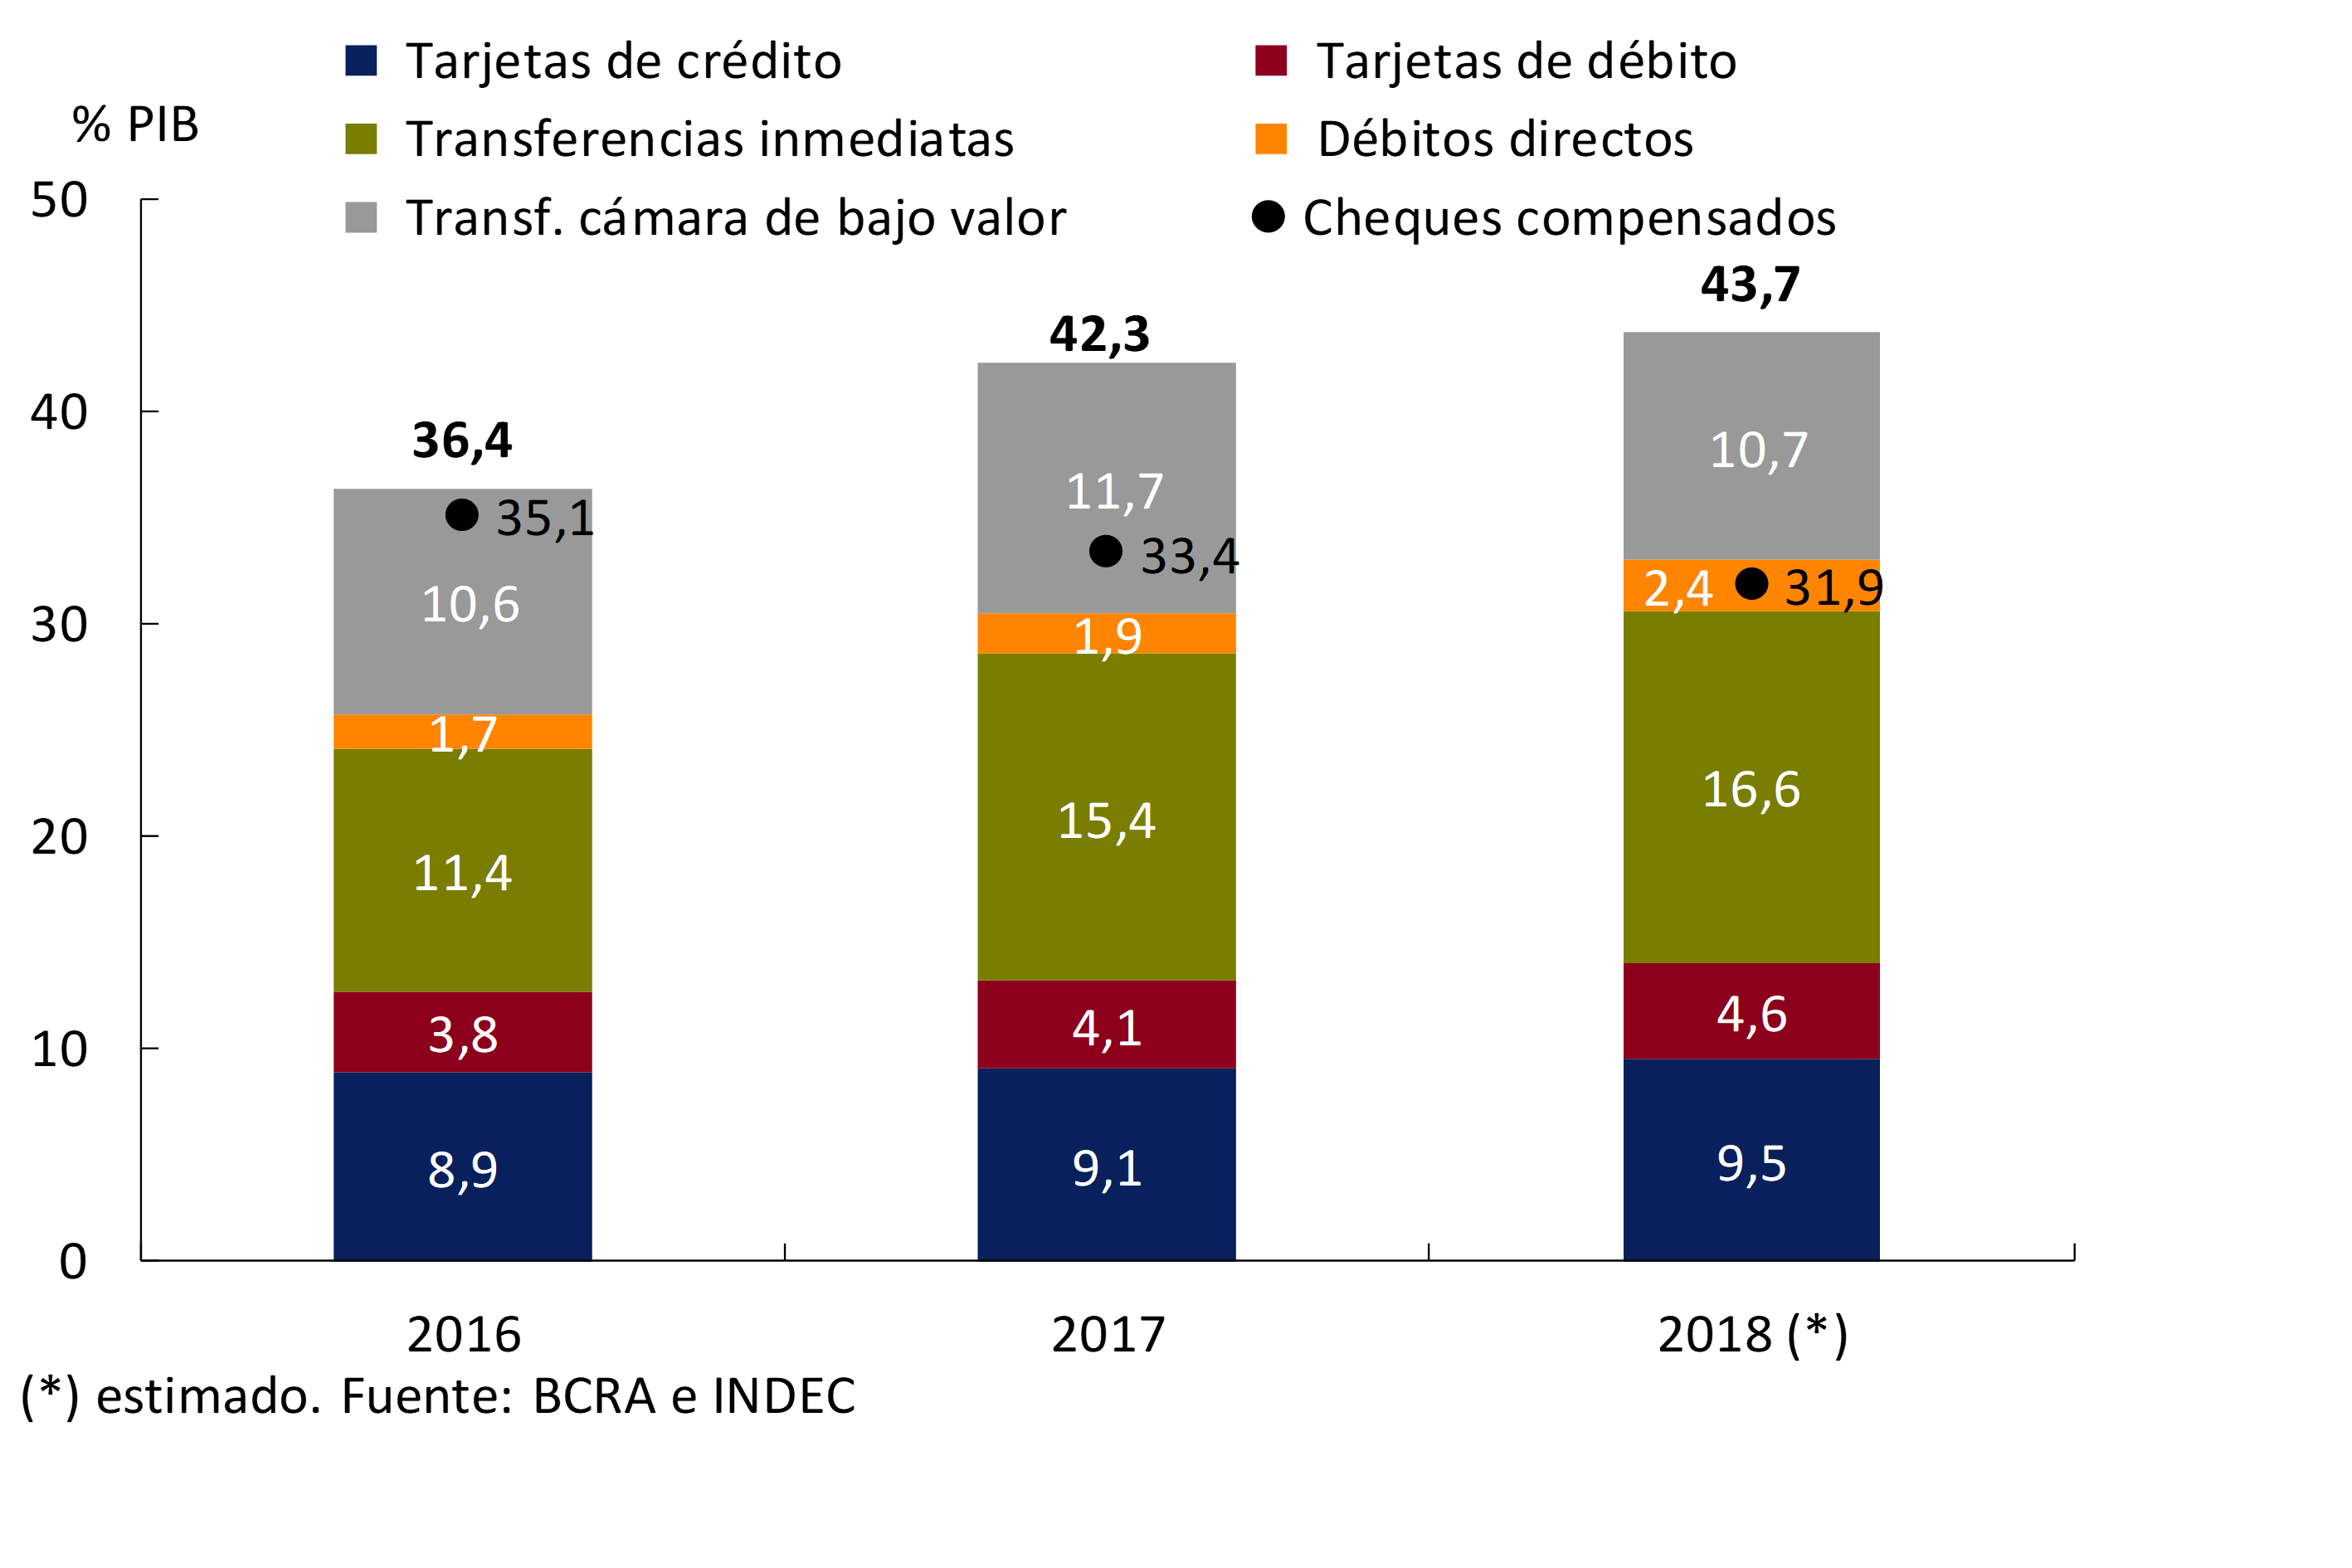
In 2018, a trend towards greater use of electronic means of payment by the population continued to be observed. In this scenario, the amount of immediate transfers in relation to GDP stood at a level of 16.6% in the accumulated January-September 2018 annualized, growing 1.2 p.p. and 5.2 p.p. compared to the same period in 2017 and 2016 respectively (see Figure 4.1). The remaining transfers made mainly by families (through the COELSA low-value chamber) reached 10.7% of GDP in 2018, a value relatively in line with those of previous years. For its part, the volume of purchases with debit cards, as well as credit cards, continued to grow to 4.6% and 9.5% of GDP respectively, slightly above recent periods. There was also a favorable evolution in the performance of direct debits. In this scenario of growing use of electronic means of payment, the value of check clearing in terms of GDP maintained its downward path, standing at 31.9% of GDP in the accumulated January-September period – 1.5 p.p. and 3.3 p.p. less than in 2017 and 2016 respectively. In this way, electronic means of payment (immediate transfers and low-value vaults, direct debits and credit and debit cards) verified a year-on-year increase of 1.4 p.p. of GDP, to a level of 43.7%.
Figure 4.1 | Retail means of payment (excluding cash)67 – January-September annualized in GDP
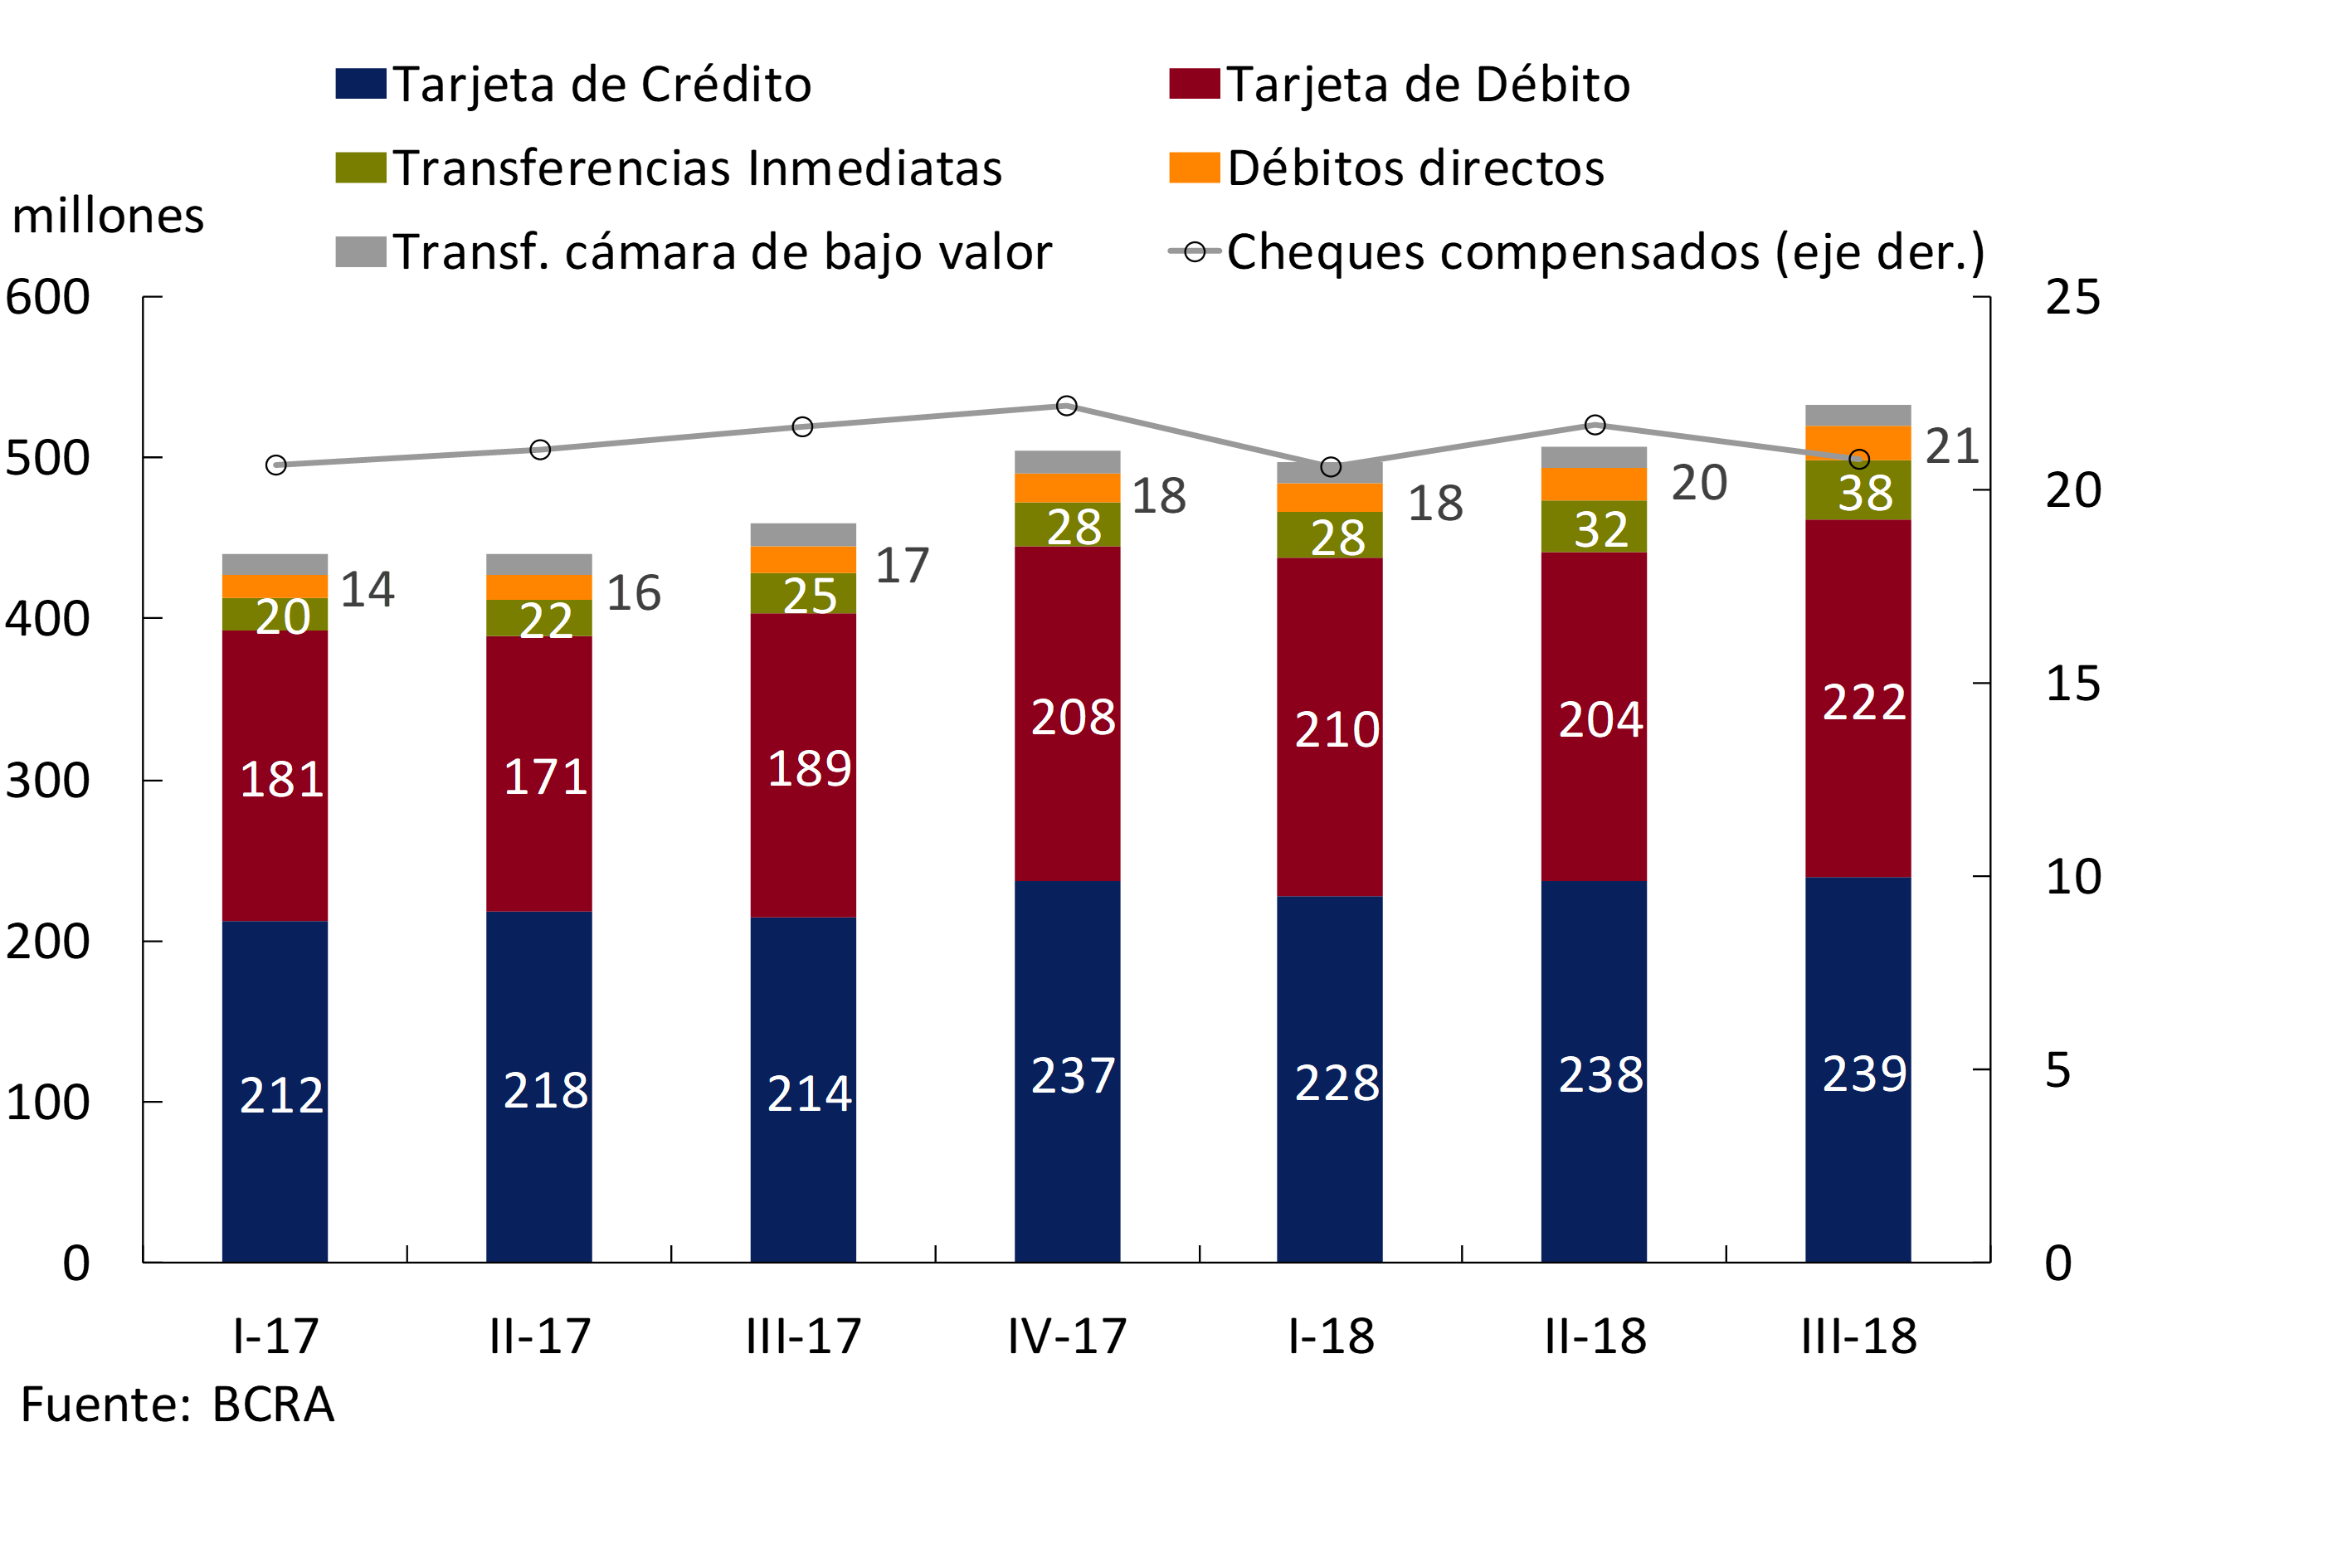
Consistent with what was mentioned in the previous paragraph, the gradual increase in the use of electronic means of payment by the population is also reflected in terms of the evolution of the number of transactions carried out with these instruments (see Figure 4.2). While the number of immediate transfers made grew 51% year-on-year during the third quarter of 2018 (totaling about 38 million), direct debits increased 24% y.o.y. in the same period (just under 21 million transactions). On the other hand, credit card transactions showed a year-on-year increase of almost 12% in the third quarter of 2018 (totaling just over 239 million) and those made with debit cards grew 17% in the same period (reaching approximately 222 million). Finally, in the opposite direction, both low-value camera transfer operations and the number of cleared checks decreased by 5% YoY (13 million and 21 million respectively) in the third quarter of 2018. 68
Figure 4.2 | Use of means of payment – Participation
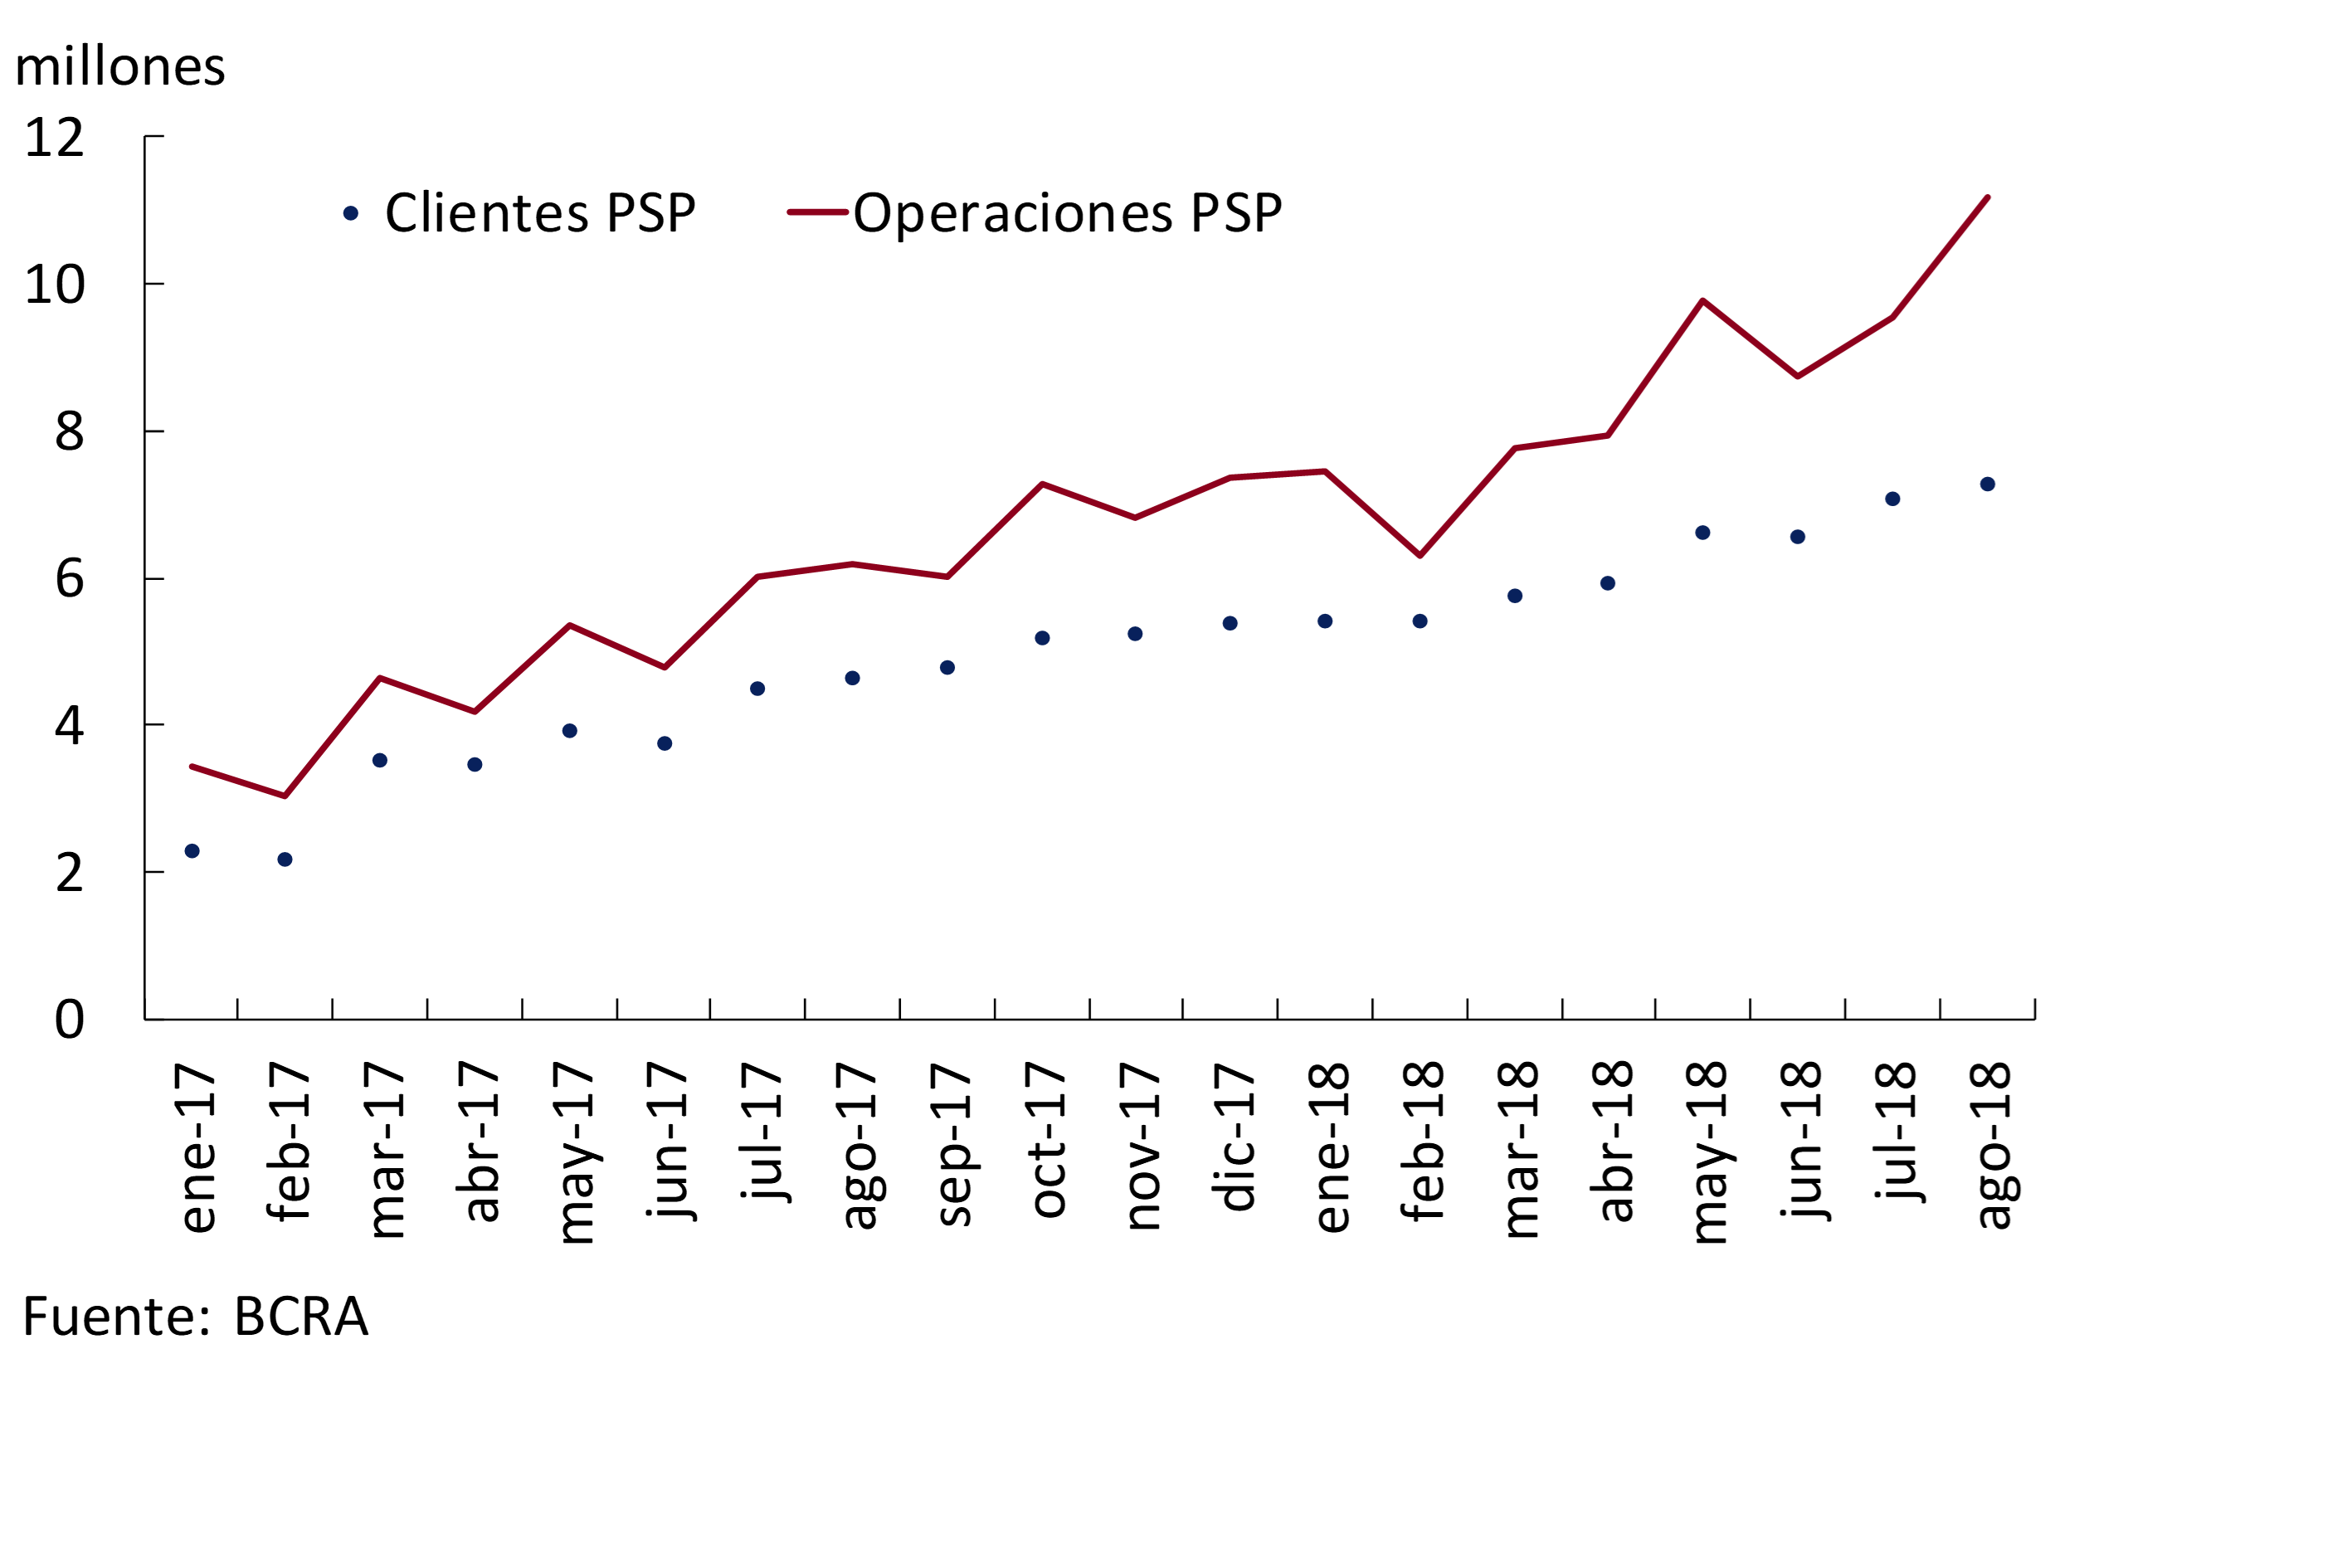
It should be noted that within the evolution of immediate transfers, there is a significant dynamism of the mobile banking channels (BM), as well as business electronic banking (BEE) and ATM (CA). Internet banking (BI) evolved at a slower pace, leading to a slight reduction in its weighting, although it still accounts for most of these types of transactions. Finally, it can be observed that, although the number of transactions channeled through payment service providers is still incipient in the country, it has shown sustained growth in recent periods (see Figure 4.3), a sign of the growing depth they are acquiring among the population’s electronic payment alternatives.
Figure 4.3 | Evolution Customers – Payment Service Providers (PSPs)
Section 1 / Cryptoassets: technological innovation and financial stability
Based on the recent price dynamics of cryptoassets, the development of new financial instruments linked to them, and the growing interest in the technology that supports them, central banks and international standard-setting bodies have begun to discuss their nature, benefits, and risks. Based on the interest expressed at the March meeting in Buenos Aires by the G20 member countries, the Financial Stability Board (FSB) has carried out a review of the potential risks to financial stability posed by the rapid growth of cryptoassets throughout 2018. Along these lines, the FSB has proposed a metrics monitoring scheme to identify potential macroprudential risks in a timely manner (FSB, 2018a and FSB, 2018b).
Supported by cryptography, the Internet and DLT technology, cryptoassets constitute global networks that operate exclusively in the digital world with adjustment to a specific protocol, which takes the form of a programming code, instead of being subject to the rules of a central operator. 69 DLT technology provides a distributed ledger similar to an accounting ledger but distributed among all network participants, which allows for public, complete and unalterable records of transaction history in a secure manner. The fundamental innovation is the implementation of a set of rules that align user incentives to create a payment/transfer technology without the need for a central agent (Nakamoto, 2008; IMF, 2016; BIS, 2018).
There is no single, widely accepted definition of a crypto asset. However, given the variety and complexity of their applications, a preliminary categorization could be made with respect to the economic function they fulfill in each case. In general, cryptoassets are used as a means of payment in the purchase and sale of goods and services; as an investment, either through arbitrage or through derivative financial instruments; or as a vehicle for financing investment projects (BaFin, 2017; UK Cryptoassets Taskforce, 2018).
Cryptoassets have a small level of capitalization in relation to the global stock market. The high prices at the end of December 2017 and the beginning of 2018 implied a capitalization for all existing cryptoassets close to US$ 823 billion. 70 That capitalization value, even at its all-time high, is still relatively small, accounting for only 1% of the global stock market. However, cryptoassets have levels of individual capitalization comparable to global financial institutions. When comparing the maximum capitalization achieved by bitcoin, for example, it is similar to the capitalization levels of companies such as Visa and JP Morgan.
The traded volumes of cryptoassets are growing considerably. In 2015 and 2016, both bitcoin and ether had lower trading volumes compared to traditional assets such as Visa, JP Morgan or a fund linked to the price of gold (SPDR Gold Shares). During 2017, bitcoin nearly doubled JP Morgan’s daily traded volumes, while ether reached Visa-traded levels (Figure A.1.1).
Figure A.1.1 | Volume traded. Daily average – US$, in billions
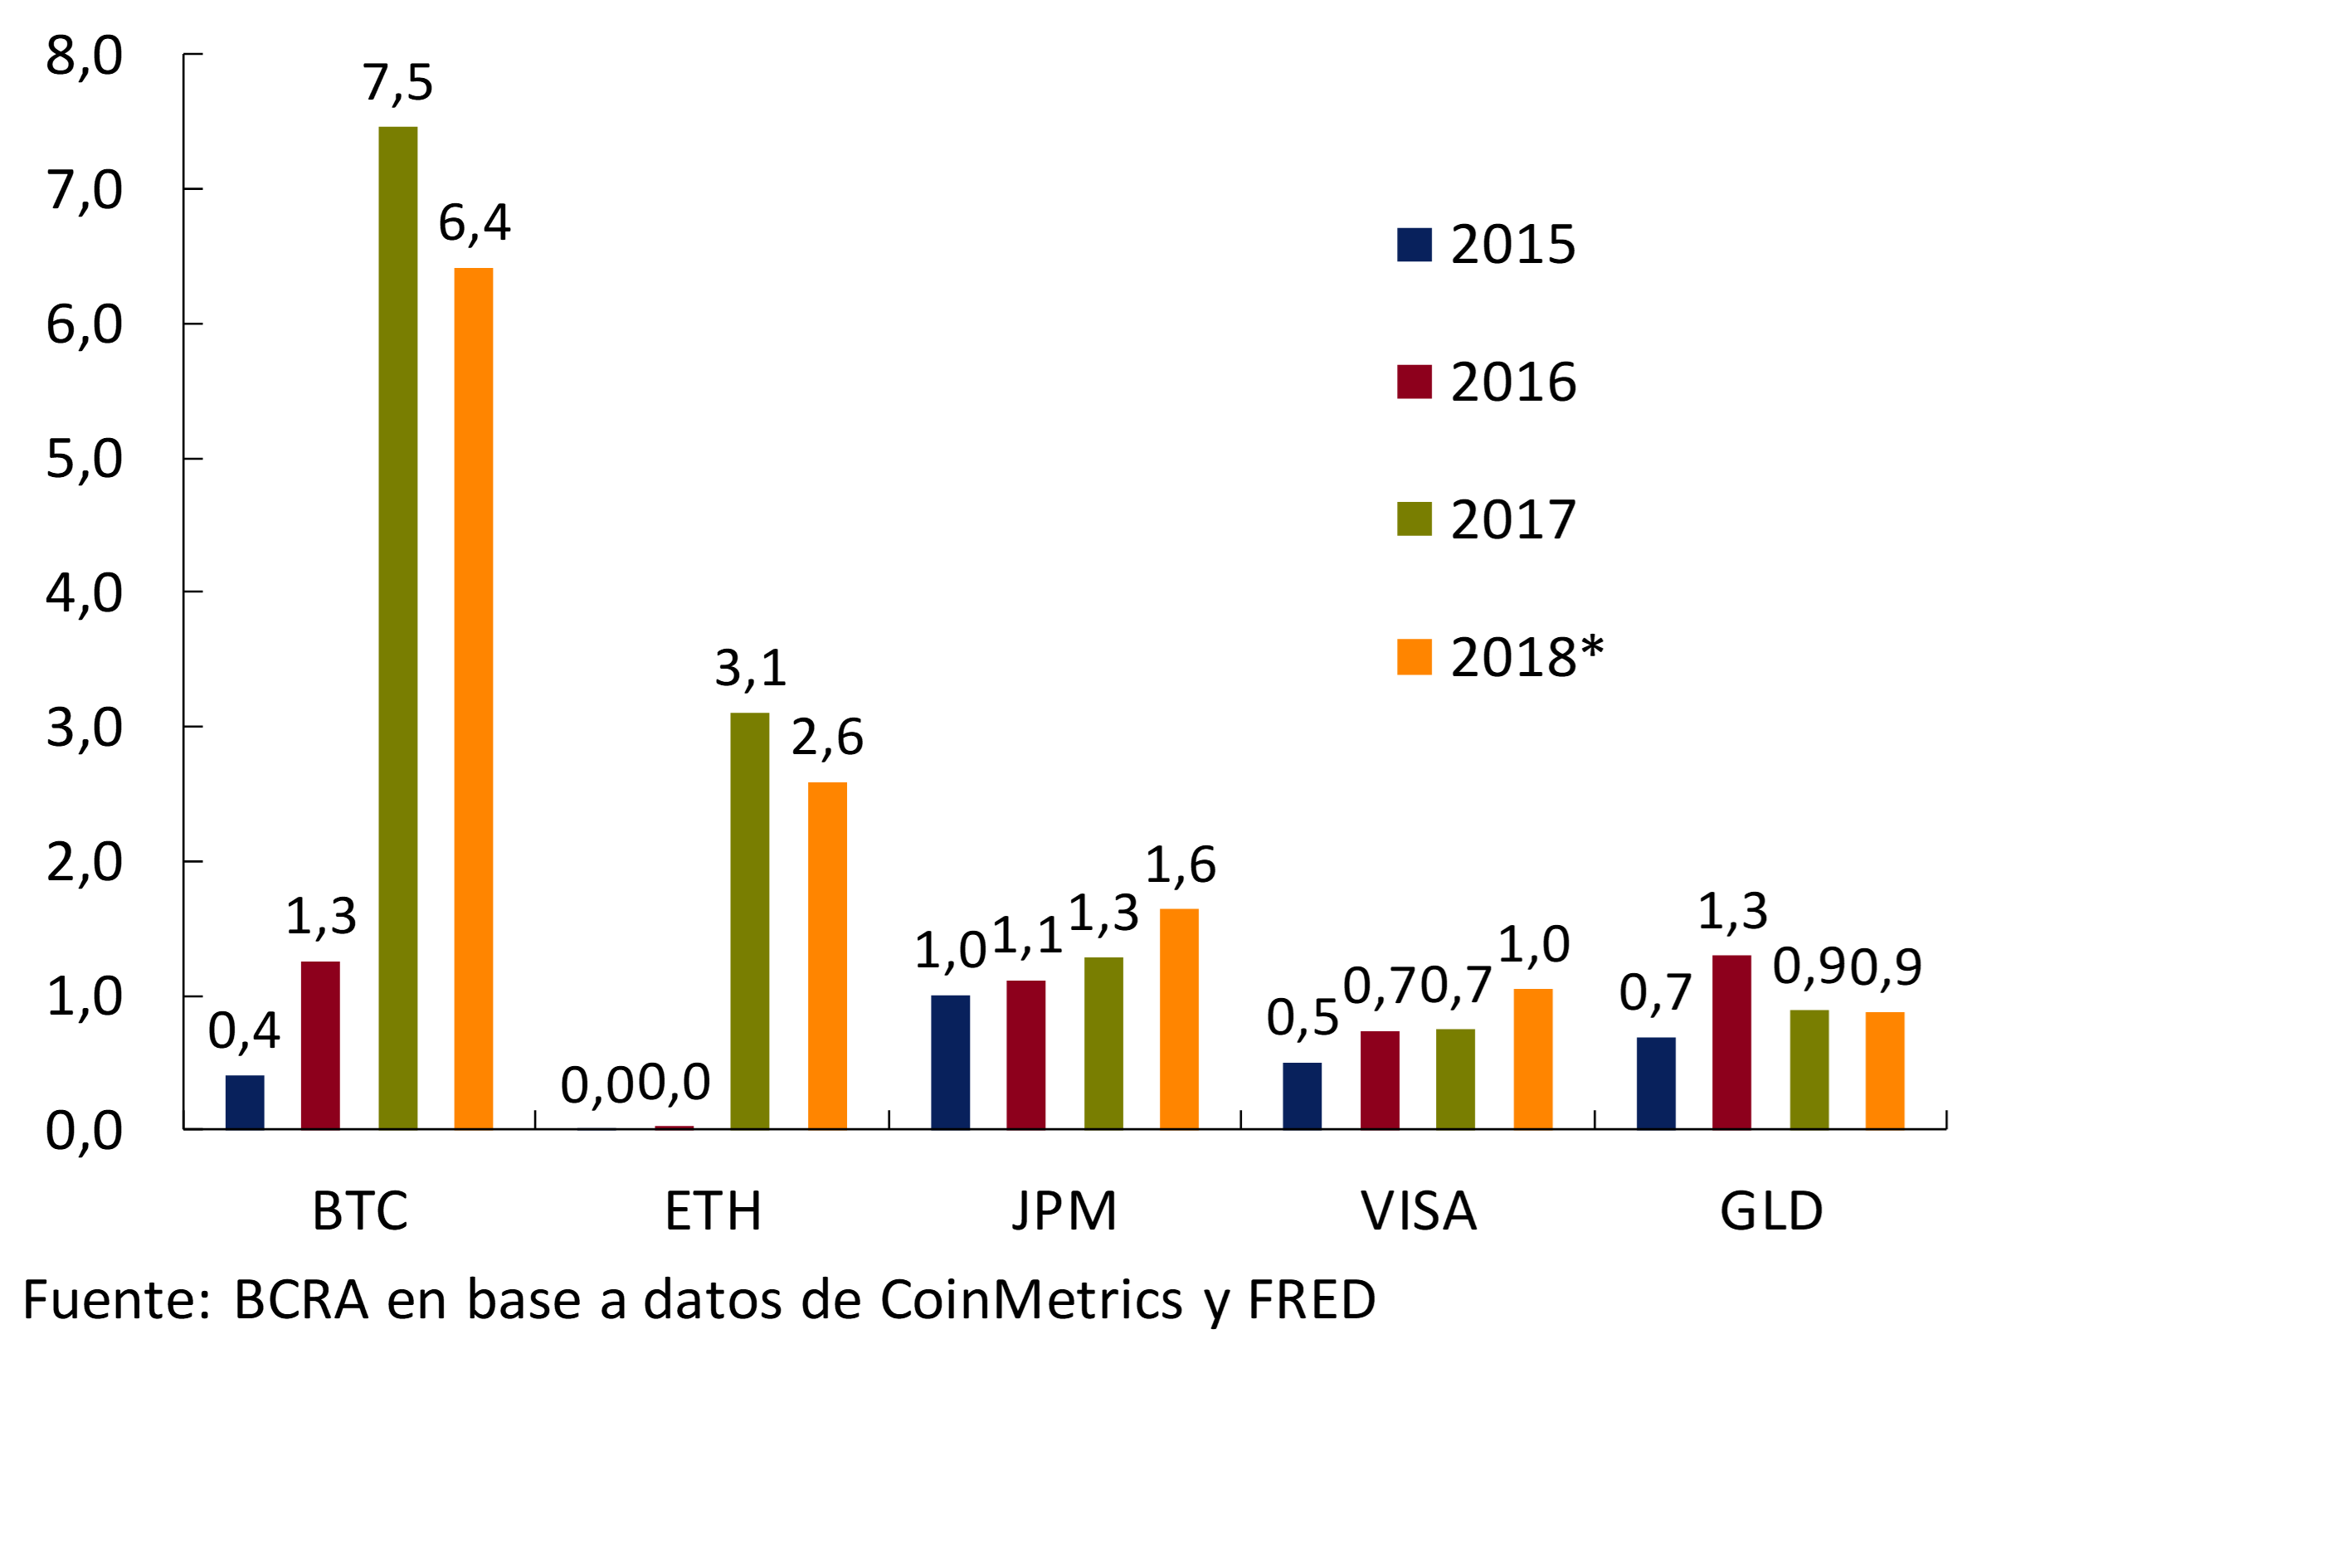
So far, there is no data indicating the holding of cryptoassets by commercial banks. 71 In other words, there are no direct links between the formal financial system and the crypto-asset system. Therefore, the indirect linkages between the two systems will be analysed based on the degree of association between the performance of crypto-assets and traditional assets. In particular, the annual correlation of bitcoin returns and the Dollar Index Spot (DXY), the price of gold (GOLD), and the S&P 500 stock market index (SP500) is estimated. 72 73 Cryptoassets have a low level of association with traditional assets. First, the correlations between bitcoin and the rest of the assets analyzed seem to be low: in no case does the coefficient exceed 0.3. Second, the correlation pattern does not remain stable for the different years. For these two reasons, it could be inferred that there is currently no link between crypto assets and traditional financial assets.
In summary, the preliminary monitoring results indicate that, on the one hand, the cryptoasset system has reduced capitalization levels compared to the global asset markets; although at an individual level they have had a very rapid evolution in terms of traded volume. On the other hand, it is not observed that there is a correlation between the returns of cryptoassets and some traditional assets, Therefore, based on the available information, it is inferred that cryptoassets do not currently represent a source of systemic financial risk, although their rapid evolution suggests active monitoring. 74
Section 2 / Bank funding by means of ON
From the end of April to mid-October 2018 there were no placements of negotiable obligations (ON) by banks. These entities have been the main underwriters of these instruments in recent years (see Figure A.2.1). It was only towards the end of October that operations began to resume in the domestic NO market. That financing window that had opened with the reopening of international credit markets in 2016 was taken advantage of by banks to improve their debt maturity profiles, while since the second half of last year placements in the domestic market and in local currency began to accelerate depending on the outlook for the dynamics of credit to the private sector. In fact, in the first four months of this year, banks obtained funding for about $41,000 million through ON issuances. 75
Figure A.2.1 | Placements and redemptions of bank bonds
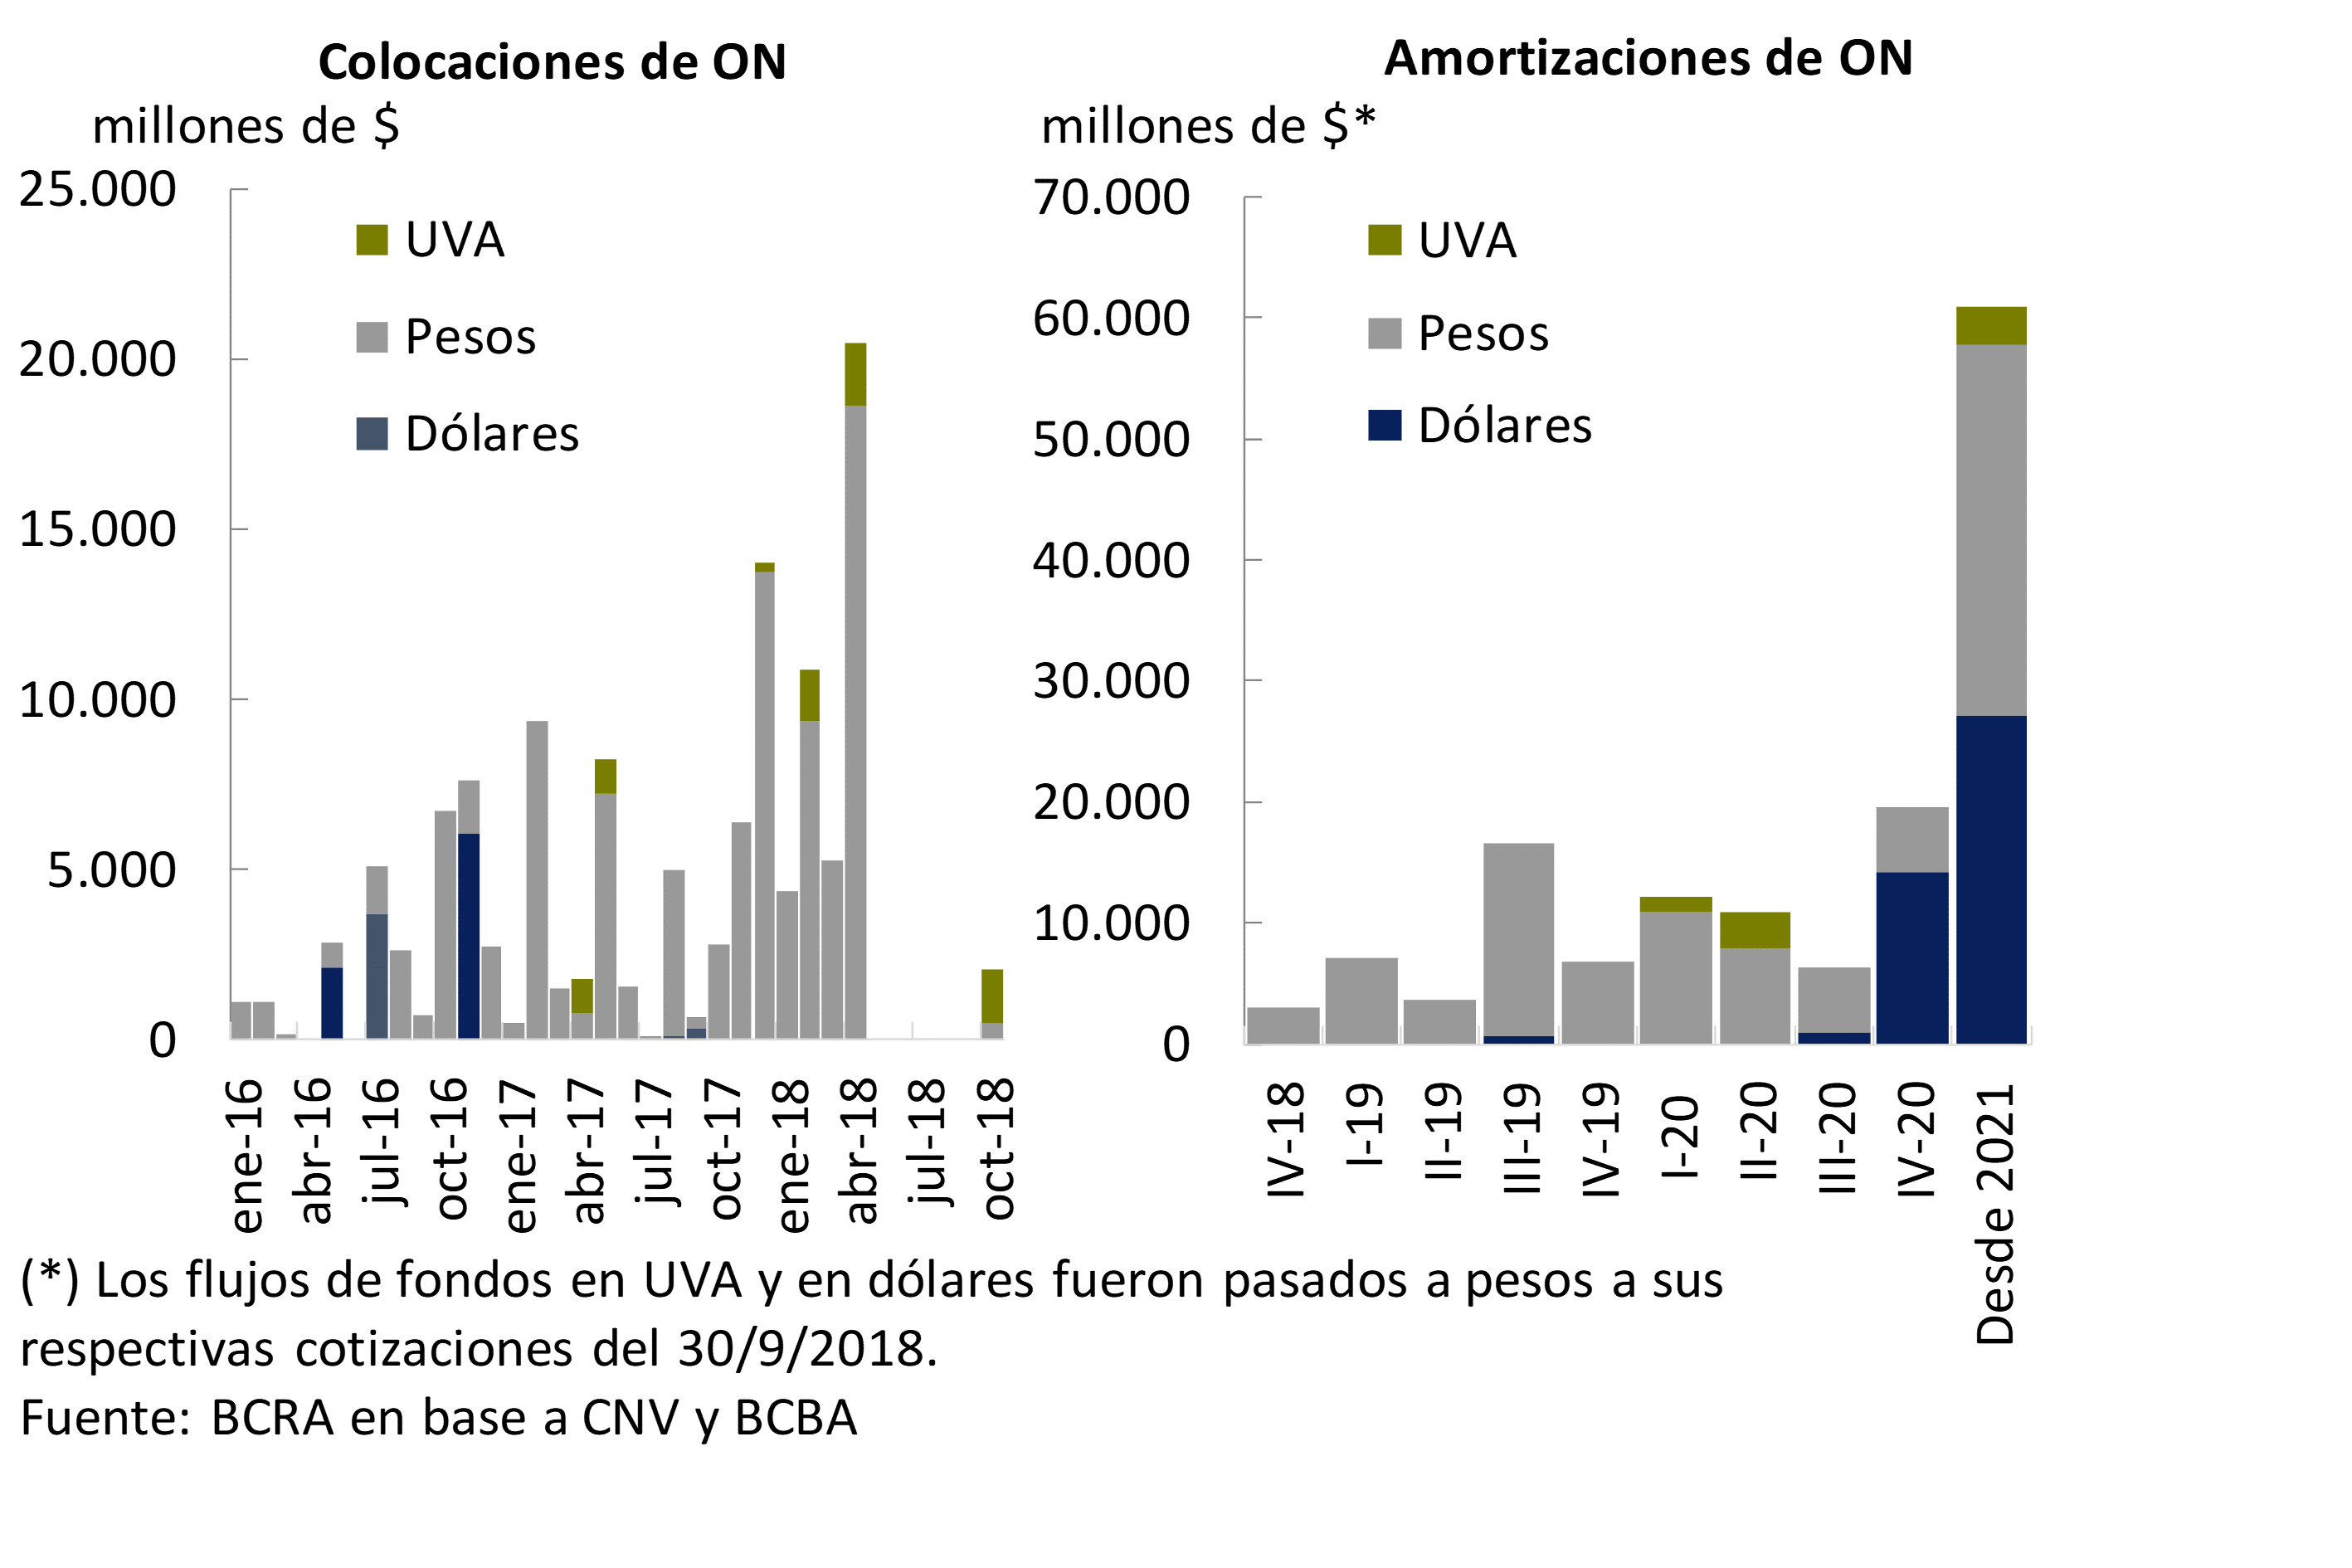
The change in credit demand in a more challenging macroeconomic context and with high interest rates also led to ON buyback operations issued by the same banks for a total of $4,300 million since the publication of the last IEF. At the end of III-18, the banks’ NB balance became about $147,000 million (3% of total funding, liabilities plus net worth of the system or 5.4% measured as a percentage of the funding of banks with outstanding NBs), of which about 2/3 is denominated in pesos. 30% is denominated in dollars and corresponds to about five entities, while the remainder is denominated in UVA. The balance of peso-denominated notes decreased by more than $8,500 million since May to about $97,000 million at IIIT-18, in accordance with the maturities that operated during the period and the aforementioned repurchases. On the other hand, there were no major differences in the balances of ON in UVA and in dollars, with low amortizations and repurchases, with which the increase in indebtedness in local currency was due to the rise in the UVA (close to $950 million additional) and the exchange rate (about $19,000 million additional)
As for the amortization profile of all the bonds that banks accounted for at the end of September, these flows until the end of 2019 are almost exclusively in local currency and add up to about $37,000 million (equivalent to about 20% of the total surplus liquidity at the end of September of the group that has outstanding bonds) (see Graph A.2.1). Of note, for foreign currency debt, there are no major principal maturities until the end of 2020.
Section 3 / Interconnection and systemic risk: network analysis
The international financial crisis that began in 2007 highlighted the need for a better understanding of how the relationships between different financial actors can pose risks to financial stability. In certain circumstances, interconnection contributed to the widening of tension and an unprecedented level of contagion between banks, non-bank financial intermediaries, and money and capital markets, even in cases where there were no direct links between them. 76 Subsequently, a number of studies and methodologies emerged to deepen the analysis of interconnection in financial systems, with a particular focus on its link with systemic risk. In the area of regulation, policymakers have sought to advance initiatives aimed at mitigating the associated risks, while preserving the benefits attributed to the interrelationship between entities. 77
The systemic risk factor associated with interconnection is related to the fact that a failure or financial difficulty in some institution significantly increases the probability that others will experience difficulties, given the network of contractual obligations and links in which these institutions operate, eventually generating a failure in the functioning of the set of institutions with the possibility of having an impact on the economic system. 78 It is possible to define two types of interconnection between financial institutions: direct and indirect. The first refers to the links between entities through financial transactions, obligations, and other agreements that are explicitly documented or directly observable. Indirect interconnection refers to the channels through which one troubled entity can affect another, even in the absence of a direct link between the two. 79
Regarding the study of interconnectedness and systemic risk, there are a variety of approaches that have been developed at both academic and regulatory levels. These methodologies range from network analysis,80 co-risk measurement models based on market data, voltage tests and simulation exercises, among others, to analyze direct and indirect interconnection. 81 The practices of analysis of this issue carried out by regulators in each country are very varied, responding to the characteristics of the structure of their financial systems and the restrictions in terms of the availability of relevant information. In general, it is recommended that the approach to the analysis of interconnection and systemic risk be carried out based on the different methodologies, which are complementary to each other.
In terms of direct interconnection, it is relevant to mention that there are conflicting views in the academic literature regarding the relationship between the architecture of the financial system (or of a particular market) and systemic risk. 82 For example, Allen and Gale show that in the event of an adverse shock, the spread of contagion depends crucially on the pattern of interconnection between banks. 83 In a fully connected (so-called “complete”) network, the impact of a shock is attenuated, as each bank suffers a small loss and there is no significant contagion, resulting in a relatively robust structure. 84 Later work questions the conclusion that “full” networks are relatively more resilient. In Haldane, the concept of “robust but fragile” is coined in reference to interbank networks, stating that depending on the magnitude of the shock, it may or may not be absorbed by a network. 85 In Gai and Kapadia86 it is noted that a shock of a certain size can have a very different impact depending on which node in the network is affected. 87 On the other hand, more recent research tends to analyze the spread of shocks and contagion from the perspective of networks considering the complex interactions between agents in the different markets (multilayers). 88
On the other hand, from a regulatory perspective, the joint guidance made by the Financial Stability Board (FSB), BIS and IMF – in response to a request from the G20 – is mentioned, which provided a framework for evaluating financial institutions, markets and instruments with systemic importance. 89 In particular, the degree of interconnectedness was identified as one of the key aspects within the regulations for the consideration of systemically important institutions at global and local level. In terms of prudential regulations, one of the international recommendations is the application of an additional capital requirement. 90
As part of the improved approach to macroprudential policy, the BCRA is working on developing a set of monitoring methodologies referring to this particular source of systemic vulnerability. 91 The workstreams under way include the use of network analysis and sensitivity exercises92 and models based on market data (indirect interconnection). As part of this, the characterization of the architecture of financial interconnection in Argentina, the identification of key elements and the analysis of the topology, as a first stage and the study of the propagation of both direct and indirect shocks and for different markets and/or scope, which may result in policy recommendations, are sought. Among the most important constraints are the availability of data on counterparties in the different financial markets and the characteristics of these markets (depth limitations that make it difficult to use widespread methodologies, such as models based on market data).
An application of network analysis in the local interfinance lending market
By way of example, some preliminary results and conclusions of the application of network analysis for cross-exposures in the short-term unsecured interfinancial loan market in Argentina (call) are detailed below. The objective in this instance is fundamentally to carry out a first characterization of the type of interconnections generated in the recent past. 93 The data used come from the BCRA’s Centralized System of Computer Requirements (SISCEN). 94 Monthly data from January 2007 to September 2018 were analyzed. It should be noted that, at the aggregate level for the Argentine financial system, the total balance of calls is relatively small (it represents 0.4% of the assets of all financial institutions for the average of the last 5 years, with a monthly maximum of 0.7% in Dec-17). However, for some individual entities, the importance of the call market is relatively greater. On the other hand, since the end of 2010 secured inter-financial loans (passes) have exceeded the call volume, although there is no information available regarding counterparties in passes.
According to traditional metrics in network analysis, it can be seen, for example, that the number of nodes (participating entities) varied between 55 and 77 in the period, with an average of 68 (for reference, the total number of financial institutions as of Sep-18 was 78). It can be observed that the average degree – the number of neighbors with whom each node is related on average – decreases in moments of tension (end 2008-mid-2009, April 2018 onwards) (see Figure A.3.1). Similar behavior is observed in terms of density – the number of real links of a network (graph) in relation to the possible ones. 95 The diameter—the maximum value of the shortest path between two pairs of nodes—remained relatively stable at 9 (median). It would seem that its variability increases in moments of tension, which is interpreted in the same direction as the decrease in the average degree. It is noteworthy that the number of communities or clusters in the network also shows some stability, with 6 being the median for the period analyzed, which seems to indicate that it is a structural variable that depends on long-term processes. 96 The distribution of the degree of the network on the side of the credit provider (degree of exit) and of the borrowers (degree of entry) was analyzed. A preliminary conclusion indicates that, in times of tension, distribution is more concentrated on both sides (provider and borrower). A first particular application of direct interconnection analysis based on network structure is presented in Chapter 3 of this edition of the IEF. There, sensitivity exercises aimed at assessing the robustness of the system to adverse credit risk shocks are enriched, allowing the propagation of effects between institutions. Going forward, it will seek to test the changes in the topology of the network based on the shocks or periods of tension observed and analyze effects on the clusters. Based on the available information, it will also seek to extend the analysis to the financial sector by incorporating other agents.
Figure A.3.1 | Network Metrics and Graphs for the Call Market
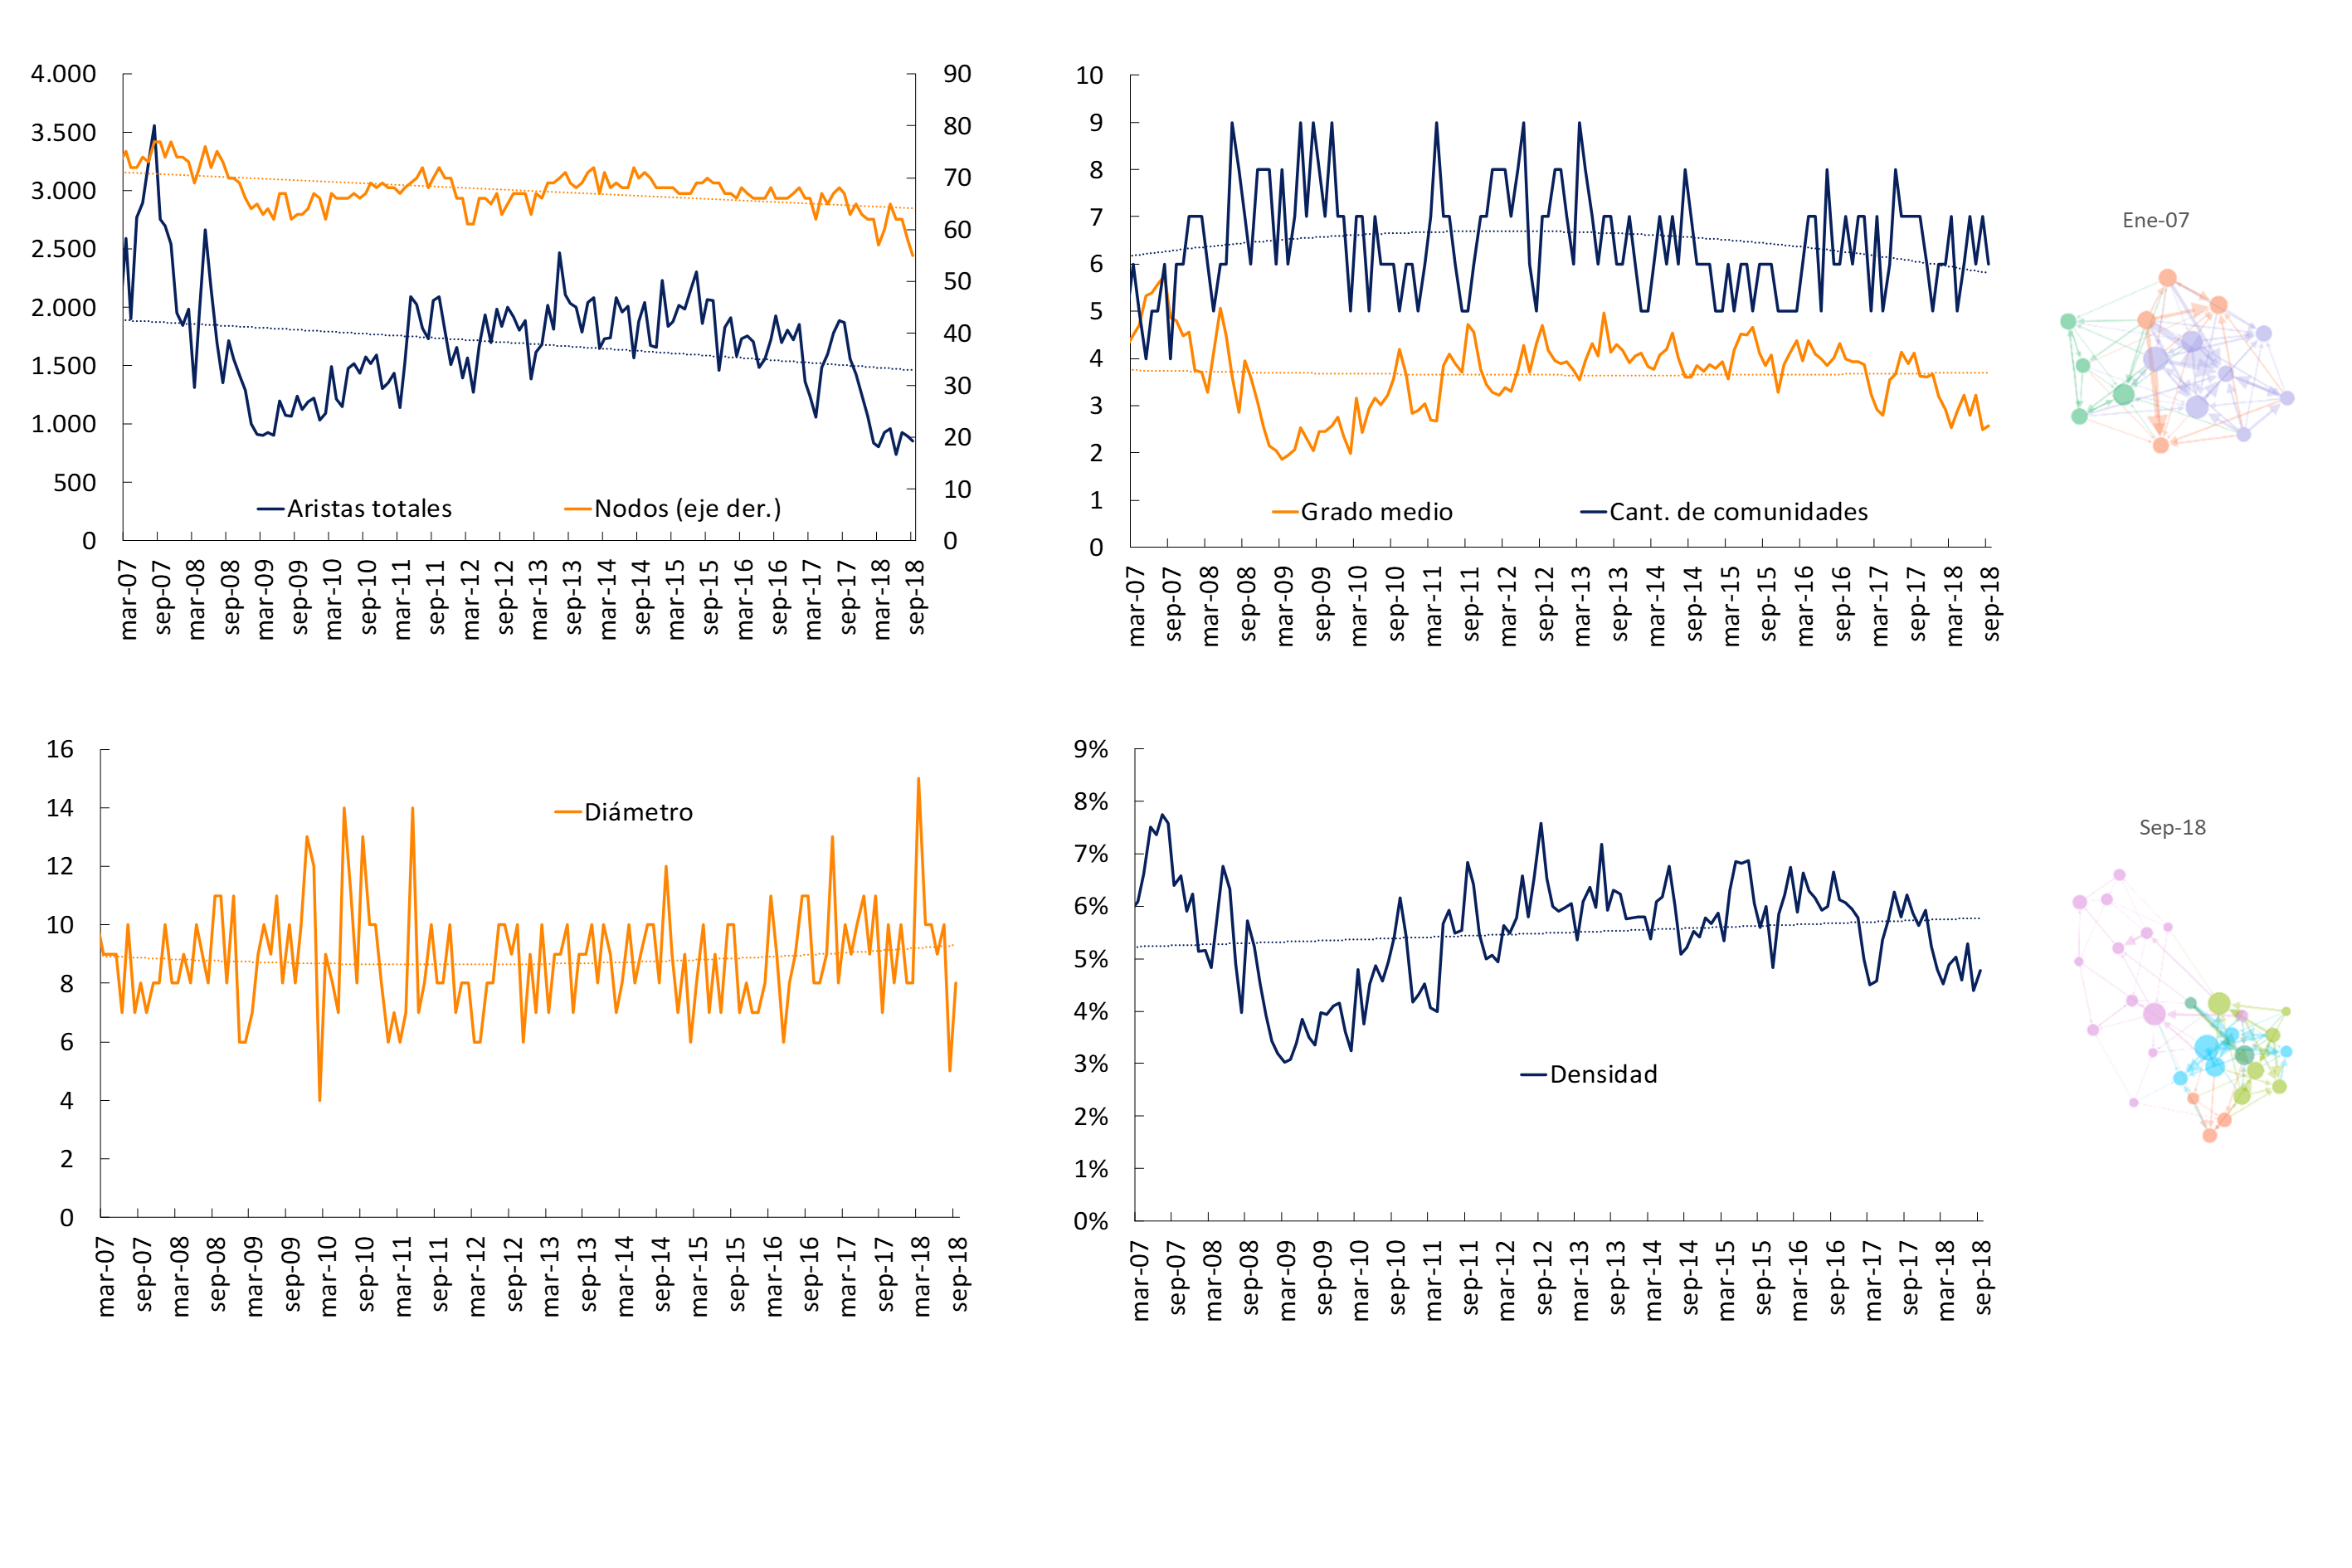
Section 4 / First cyber exercise of the financial system
In recent years, traditional financial services have begun to be subject to a process of strong technological innovation, incorporating a greater degree of digitalization in their processes. This has led to a growing dependence of the sector on technology service providers, generating a new layer of interconnection of financial networks from the technology infrastructure. Although new business opportunities are opening up for the sector, deriving potential benefits for society (facilitating financial inclusion, for example), at the same time new risk factors appear that must be taken into account in the monitoring of financial activity. 97 In this scenario, several serious cybersecurity incidents are already publicly known. 98
Faced with the possibility of an incorrect use of technology and information systems that could cause a disruption of essential financial services, thus undermining financial stability, various international forums are promoting various actions to achieve an adequate approach to this issue. At the G20 meeting in early 2017, member countries asked the Financial Stability Board (FSB) for specific actions in this regard. 99 Thus, with the aim of analyzing both the possible systemic implication of cyber risk and the tools available to prevent and/or mitigate it, the FSB initiated a series of activities among the participating jurisdictions. 100 There, the need for better tools for response and recovery from cyber incidents in the financial sector was detected. It was also identified that the simulation exercise was the most widely used practice to measure both the level of preparedness and resilience to attacks.
There is consensus regarding the usefulness of simulation practices in this area, as they promote greater awareness and coordination between the different actors of the system, leading to improved response and recovery capabilities in the event of cybersecurity attacks. There are different types of exercises, ranging from “desk exercises” to “simulations of real situations”. The first consist of recreating the actions to be followed in simulated crisis situations, previously coordinated and developed during a meeting. While the latter are role-playing games, simulating a real-time attack on IT infrastructures. These exercises recreate cyber incident scenarios. 101
At the beginning of 2018, the BCRA promoted the realization of a first “cyber exercise”, seeking to obtain an overview of the local problems of cybersecurity in the field of the financial system. On this first occasion, the exercise was carried out with the voluntary participation of a group of entities. The test carried out corresponded to a simulation, with characteristics of a “desktop exercise”, for which a guide of actions and events to be tested in a computer environment prepared for that purpose was planned. The responses to these events – which could eventually generate crisis situations – and the communication between the participating entities and within each entity were tested.
The “cyber exercise” promoted by the BCRA allowed for a first approach to the communication, coordination and response capacities in the event of cybersecurity crises among participants in the financial sector. It was also useful for each participant to analyze the level of preparedness of their organization. It is understood that this type of exercise generates important inputs to advance in the proposal of a cybersecurity strategy according to current challenges.
References
1For more information on the external context, the impact on the Argentine economy and the measures applied, see the Monetary Policy Report of October 2018.
2On the one hand, concerns linked to Italy, with potential contagion to the rest of the region, given the financial and trade interconnections. On the other hand, negotiations are still open regarding the process of the United Kingdom’s exit from the European Union, with the risk of a disorderly dynamic materializing in the event of not reaching an agreement between the parties within the required deadlines.
3According to data from the foreign exchange capital and financial account, portfolio investments by non-residents began to show negative net flows in April. These flows showed an improvement from October.
4For its part, national public debt represented 77.4% of GDP in the second quarter of 2018 (of which 35.1 p.p. correspond to debt with the private sector). According to the 2019 National Budget Bill, by December 2018 the national public debt would reach 87% of GDP (if liabilities with public sector agencies are deducted, it is reduced to 45% of GDP). Although an increase in this ratio during 2018 would imply a 30 p.p. increase in GDP, it is estimated that the faster convergence to fiscal balance will contribute to generating a downward trajectory of the public debt ratio in the coming years.
5For more information on the evolution of the domestic economy, see Monetary Policy Report of October 2018.
6As there have been no international debt placements by Argentine companies since May 2018, there was no significant change in the absolute level of mismatch liabilities in foreign currency (liabilities minus assets in foreign currency), remaining at around US$22,500 million. However, its level measured in terms of nominal variables in pesos did increase. Given that there is no systematic information on income in foreign currency or that follows the exchange rate or on the use of derivatives, this measure presents limitations that may imply an over-estimation.
7For example, until the end of 2020, some US$3,200 million (18% of the total balance of bonds in foreign currency) mature. Maturities from 2023 onwards account for more than 55% of the total stock.
8For more detail, see Monthly Monetary Report for October 2018.
9For more detail, see Chapter 1 and the Normative Annex.
10For a detailed detail, see Regulatory Annex.
11The fall in the share of credit to the private sector in banks’ assets tends to be a behavior observed, in general, in the latest events of fall in the level of economic activity (for example, those verified from 2005 onwards).
12For more details, see Credit Conditions Survey – Third Quarter 2018.
13It is estimated that in the third quarter of 2018, 7,600 new mortgage debtors (gross registrations) were incorporated, 90% of which correspond to new debtors of loans denominated in UVA. This was below the estimated quarterly average of 22,500 additions observed in the previous four periods.
14The availability of data forces the use of prices offered per m2 as a reference for the price of homes.
15The first ratio is the quotient between the price offered in dollars per m2 and the average remuneration of registered workers in the private sector converted to dollars (wholesale exchange rate or spot with settlement between Nov-11 and Nov-15), while the second ratio is the quotient between the price offered in dollars per m2 multiplied by 60m2, and the annual rent of a 3-room apartment expressed in dollars using the same methodology as the previous case.
16For more detail, see Monthly Monetary Report for October 2018.
17Credit Conditions Survey corresponding to the Third Quarter of 2018.
18The nominal ROE of public entities was 39%y. in the period (+12.3 p.p. year-on-year) and 30%y. in private banks (+3.3 p.p.).
19In this context, since the publication of the previous edition of the IEF, the aggregate financial system would reflect a certain fall in real terms in net worth (adjusted for dividends and capitalizations).
20The implied lending rate is the quotient between the flow of accrued interest and the average loan balance in the period analyzed. The implicit funding cost for deposits is the quotient between the flow of accrued interest and the average balance of deposits adjusted for reserve requirements in the period. The data correspond to the non-financial sector. Implied interest rates (ex post) are related to flows that originate in operations agreed in the past.
21Since lending operations (mostly fixed-rate) are generally agreed for longer maturities than deposit transactions, marginal changes in market interest rates tend to be reflected relatively faster in the flow of interest outflows than in the income flow in the income statement.
22In this sense, various indicators continue to show increases in the productivity of the financial system in recent months. For example, there is an upward trend in terms of the ratio between intermediated volumes (loans and deposits in real terms) and the number of employees for the different homogeneous groups of banks.
23Capital conservation of 2.5% of RWA, which is increased to 1 p.p. in the case of the identified systemic banks. In accordance with the BCRA’s prudential regulations, the aforementioned margins do not constitute a minimum regulatory requirement, but their non-compliance imposes restrictions on the distribution of dividends (Consolidated Text of Distribution of Earnings). In the theoretical exercise presented here, the aforementioned margins are assimilated to traditional regulatory requirements.
24See rule on “Distribution of results”. This regulation is in line with the Basel Committee’s recommendations on the matter.
25In general terms, the local methodology weights the evolution of the credit/GDP ratio gap with respect to its long-term trend (within the framework of the international standard), GDP growth and its cycle, and quantitative and qualitative indicators referring to the relative strength of the financial position of credit providers and demanders. as well as asset valuation indicators. For more details on the methodology see IEF I-2016.
26There was no significant relaxation of credit origination standards in the period. For more details, see Graphs 1 and 4 of the latest edition of the IIIT-18 of the BCRA’s Credit Conditions Survey . In addition, in a context of inflation, and in view of the usual practices of granting certain loan lines (French system with a fixed interest rate), a marked downward trend in the debt burden measured in terms of the income of the credit subjects may be generated.
27The EPNRC is defined as the portfolio in an irregular position net of the estimate of the forecasts awarded to this portfolio (excluding the minimum forecasts corresponding to the portfolio in regular position), in terms of equity.
28Considering the denominator “lagging”, the ratio also increased (with lags of 3 and 6 months, +0.4 p.p. and +0.5 p.p. with respect to IT-18, respectively).
29For more detail, see Section 3.1.4. of the IPOM of October 2018.
30For further development, see Box 6 of IEF I-18 and BCRA Consolidated Text “Credit Policy”.
31Latest CVS data as of August 2018, released in late October.
32For a detailed methodological development, see Section 6 of IEF I-18. The results obtained up to that time showed an auspicious performance of the most recent mortgage loan harvests, with relatively very low levels of delinquency. Subsequently, in the second quarter of the year and in a context of reduced economic activity, these results were corroborated in a Note published in Ideas de Peso of the BCRA (“Did mortgage loan delinquencies change significantly in the face of recent changes in the macroeconomic context? An analysis of harvests”).
33The percentage stands at 0.03% in the case of loans denominated in UVA exclusively, and 0.15% for the rest. 92.8% of the balance of the harvests originated in the first half of 2018 were denominated in UVA.
34This implies considering the credits as irregular if at some point in their lives they were. Its methodology can be found in more detail in Section 6 of IEF I-18.
35The MPI is an estimate of the probability that a debtor will worsen its credit situation within a period of three months. The methodology is detailed in the IEF I-17 . The behavior of the MPI was similar to that of the Estimated Probability of Default (EDP), defined as the proportion of loans that were initially in credit situation 1 and 2 (regular) and are now in situation 3, 4, 5 and 6 (irregular) at the end of the period under analysis.
36Decree 905/02, text according to art. 63 of Law 26,546. Duly regulated by the BCRA through “Credit Policy”.
37Although the remaining 10% is not directly channeled to the tradable sector of the economy, by BCRA regulations they must be linked to the aforementioned sector and/or have their income correlated with the exchange rate.
38The irregularity ratio of total loans to companies reached 1.3% as of September 2018, with an increase of only 0.3 p.p. since the beginning of the year. In particular, the ratio corresponding to pre-financing and financing for exports was only 0.7% as of September, with no significant changes since December 2017.
39Using quarterly data for the period 2005-2018, a simple credit risk model is estimated to allow a first assessment of the sensitivity of the quality of the financing portfolio to fluctuations in the level of activity. In particular, the estimate analyses the relationship between the credit risk loss rate and the evolution of GDP and the real interest rate. The natural persistence of the dependent variable led to the specification of a dynamic model. The results indicate that changes in GDP have a statistically significant impact on the rate of losses due to credit risk, although in economic terms the impact would not be high for the financial system as a whole.
40The experiences of the last 25 years are taken.
41In this exercise, the relative variation of the irregularity ratio is considered compared to 1 p.p. of fall in GDP (in other recessions). The current performance of the ratio is then compared with the median of past experiences.
42For example, during periods of high competition, banks may relax EOCs and/or TCs excessively to gain market share, to the point of not adequately covering the associated CR. Or in the event of an increase in credit risk (increase in CR), the lack of an adequate adjustment in EOC or TC may end up impacting the banks’ assets.
43To measure the TCs, the spread is used between (i) the average lending rate operated in pesos (in real terms) for loans to the private sector (the analysis for individuals and legal entities is separated) and (ii) an estimate of the average funding cost operated in private sector deposits in pesos (in real terms); and for the CR measure, the indicator of probability of migration or the quarterly frequency of worsening of the debt situation (MPI) is considered, and the analysis between individuals and legal entities is separated. A similar indicator is found in the Financial Stability Report of the Czech Republic.
44Other factors that influence the spread are the weight of operating costs, hedging other risks, etc.
45See footnote above.
46For more details on the sensitivity exercises, see Financial Stability Report for the First Half of 2016. Scenario analyses are carried out once a year, taking into account extreme adverse macroeconomic conditions.
47This version of the exercise assumes that the irregularity ratio of each bank’s private sector loan portfolio increases from the current level to the maximum reached during the peak of the 2007-2009 international financial crisis, and then defaulting debtors default on their payment obligations, generating losses due to loans not covered by forecasts.
48It should be considered that after the shock, the remaining group of entities (58 in total) would present an excess of capital (above what is required by regulations) equivalent to 29% of the initial aggregate PRC of the financial system. In other words, the aggregate availability of regulatory capital after the shock is significantly higher than the equity impact generated by failing entities.
49In this case, only direct spread or contagion by exposures on the active side is taken into account. That is, the effect that it would have on an entity offering funds in the call market, if it keeps in its assets (credit) a bank that was severely affected by the initial shock of credit risk derived from the sensitivity exercise.
50It should be clarified that this analysis was carried out in isolation from the previous one. On the one hand, the result of the credit shock and the current behavior in the market of unsecured inter-financial loans were analyzed.
51Concentration data as of June 2018, latest information available.
52A one-month residual term.
53Latest information available.
54The ratio is the quotient between the available amount of stable funding (MDFE) and the required amount of stable funding (MFED).
55Towards the end of October and the beginning of November, 3 entities issued negotiable obligations in UVA (see Chapter 1).
56It should be remembered that when faced with a UVA or CER mismatch, the financial system is exposed to currency risk and real interest rate risk. With respect to currency risk, if the denomination of the assets (UVA) differs from that corresponding to the liabilities that fund them (pesos), different effects may be generated on the balance sheet items (and consequently on the results) if the conversion unit (inflation) fluctuates. Real interest rate risk arises when, in addition, there is a mismatch of terms (with different sensitivity in the renegotiation of interest rates between assets and liabilities): long-term assets (such as mortgage loans) at a fixed interest rate, and short-term liabilities (such as deposits) whose interest rate is renegotiated following fluctuations in the reference rate. In other words, the financial system is exposed to increases in the real interest rate. If the nominal reference rate increased more than inflation, the increase would be reflected almost instantaneously in the interest rate on deposits, generating higher outflows, while the modification of interest rates on loans would occur more slowly (due to the longer relative term). This would occur in a framework in which the re-expression of assets (due to inflation) would generate income that, at least temporarily, would not compensate for the aforementioned increase in expenditures.
57Foreign currency (EM) mismatch is defined as EM assets minus EM liabilities plus EM forward net purchases without delivery of underlying (off-balance sheet items). This indicator is used for analytical purposes and not in regulatory terms.
58See Ordered Text on “Global Net Foreign Currency Position”.
60Information based on the new guidelines will be available by the end of November (see Communication A6561).
61Either by requiring additional capital or by forcing exposure reductions, or a combination of both.
62Rules on “Regulation of the bank current account” and “National System of Payments-Checks”.
65Consultative Group to Assist the Poor (CGAP) (2016-12). “Digital Finance Interoperability and Financial Inclusion: An Analysis of 20 Countries.”
67Operations not included. ATM and Merchant Withdrawals, Prepaid Cards, Wallets, Checks/Intrabank Transfers, Cancelling Checks, Debits, Wholesale Payments (MEP), Operations in USD.
68On the other hand, those transfers made through the high-value camera registered a positive variation of 18% y.o.y. (totaling 19 million).
69While all crypto assets use some form of DLT, not all applications of this technology involve the creation of these instruments.
70Source: CoinMarketCap.
71For a description of direct linkages, see, for example, ESRB, 2016.
72The data covers from 2015 to 2018.
73Source: FRED, Federal Reserve Bank of St. Louis.
74Notwithstanding the implications for financial stability, cryptoassets pose relevant policy challenges, such as the need to protect consumers and investors, strengthen the integrity of markets, and fight money laundering, among other aspects. At the domestic level, policymakers have sought a balance between mitigating risks and vulnerabilities without stifling innovation. However, the global reach of the crypto-asset network demands cooperative efforts in monitoring these systems and in the coherence of the regulatory approach. In this regard, the recent trend is characterized by the search for a coordinated approach in the development of harmonious regulatory frameworks across jurisdictions (IMF, 2018; ECB, 2018).
75Operations for terms of between 12 and 18 months closed with rates of around 26%, in a context of a monetary policy rate mostly located at 27.25% in the first four months of the year.
76Espinosa Vega, M.A. Solé, J. (2014). “Introduction to the Network Analysis Approach to Stress Testing”. In Li Ong. “A Guide to IMF Stress Testing: Methods and Models”. IMF.
77See for example Yellen, J. L. (2013), “Interconnectedness and Systemic Risk: Lessons from the Financial Crisis and Policy Implications Remarks” in American Economic Association/ American Finance Association Joint Luncheon.
78FBS-BIS-IMF (2009). “Guidance to assess the systemic importance of financial institutions, markets and instruments”.
79An example of direct interconnection is credit exposure between two banks (loans, funding), relationships due to the use of market infrastructure (payment system, clearing and settlement entities), etc. An example of indirect interconnection is exposure to common assets, due to losses due to valuation at market prices in a framework of generalized sales, etc.
80This type of study seeks to measure and capture on a map the relationships and flows between a group of agents called nodes or vertices while the links or edges between them are the interrelationships, being a tool for the study of complex systems from different disciplines (physics, biology, social networks, etc.), with a common methodology. See Barabási, A.L. (2016). “Network science”. Cambridge University Press.
81See Arregui, N., Norat, M., Pancorbo, A., Scarlata. (2013). “Addressing Interconnectedness: Concepts and Prudential Tools”. No. WP/13/199), IMF and “Understanding interconnectedness risk” (2015), DTCC.
82For a survey on the discussion between network topology and systemic risk in interbank markets, see Hüser, A.C. (2015), “Too Interconnected to Fail: A Survey of the Interbank Networks Literature”. SAFE WP 91.
83Allen, F. and Gale, D. (2000), “Financial Contagion,” Journal of Political Economy, Vol. 108, No. 1, p. 1–33.
84Freixas, Parigi and Rochet analyse a centre-periphery network structure, identifying different patterns of contagion depending on the position of the insolvent and the size of the debt (see Freixas, Parigi and Rochet (2000) “Systemic Risk, Interbank Relations, and Liquidity Provision by the Central Bank.” Journal of Money, Credit and Banking, vol. 32, no. 3, p. 611–638).
85Haldane, A. (2009). “Rethinking the financial network”. Speech at the Financial Student Association, Amsterdam.
86Gai, P. y Kapadia, S. (2010), “Contagion in financial networks,” en “Proceedings of the Royal Society of London A: Mathematical, Physical and Engineering Sciences”, Vol. 466, pág. 2401–2423, The Royal Society.
87Acemoglu et al. try to reconcile these different perspectives by looking at the different stages of transition depending on connectivity and the size of the shock. See Acemoglu, D., Ozdaglar, A., and Tahbaz-Salehi A. (2015). “Systemic Risk and Stability in Financial Networks.” AER, 105(2): 564-608.
88Korniyenko, Y, Patnam, M., del Rio-Chanon, R.M., Porter, M.A. (2018) “Evolution of the Global Financial Network and Contagion: A New Approach”, WP 18/113, IMF.
89FBS-BIS-IMF (2009). “Guidance to assess the systemic importance of financial institutions, markets and instruments”.
90See BCRA. “Methodology for the identification of systemically important entities at the local level”.
91In terms of the regulatory framework for the Argentine financial system, it should be noted that the “Credit Risk Fractionation” rule is in force, which contemplates limits on credit exposures between banks, with the aim of limiting, to a certain extent, the sources of contagion between them. The aforementioned limits are established based on the regulatory capital of the entities, depending on the type of entity, as well as the rating that the SEFyC gives to them. The aforementioned standard will soon be appropriate according to the recommendations made by the Basel Committee in terms of the treatment of large credit exposures.
92According to the methodology suggested in Chan-Lau, J. A., Espinosa M., Giesecke K., Solé J., “Assessing the system implications of financial linkages”, Chapter 2, GFSR, IMF (2009).
93See Anastasi, A., Elosegui, P. Sangiácomo, M. (2010) “Determinants of the Interbank Loan Rate in Argentina”, Ensayos, BCRA, 95-125. for description of the operation of the call market, its relationship with other markets and econometric estimation.
94This database provides detailed information on the conditions of these operations arranged on a daily basis, which includes intervening entities (who grants and who receives), amount, term, interest rate, currency, among others.
95This measure is around 5.5%.
96A high correlation is observed between the number of edges and the metrics of average grade, density and clustering coefficient.
97In particular, it is possible to integrate technological risk into the so-called operational risk. As defined by the Basel Committee on Banking Supervision in 2006, operational risk is the possibility that institutions face losses from failures in internal processes, personnel or systems, or those that are the result of external events. As a particular case of the above, technological risk mainly contemplates the problems or failures of the information systems and technologies used to support the financial institution’s business.
98Examples of these attacks include the Bank of Bangladesh in 2016, which was affected by $81 million, the Wannacry Ransomware in 2017 compromising 250,000 computers in 150 countries, and the Equifax personal data security incident in 2017 involving 143 million records. See, among others, “Cyber risks, market failures and financial stability”, Kopp, Kaffenberger and Wilson, IMF Working Papers 17/185.
99Official communiqué of the G20, Baden-Baden, Germany, 17-18 March 2017.
100Among them, a survey of the tools used by the different jurisdictions to analyze cybersecurity vulnerabilities and the creation of a common cybersecurity glossary for the financial sector stand out.
101For example, distributed denial-of-service (DDoS) attacks, theft of financial services customer information, fraud, and other attacks on critical infrastructure.
Glossary of abbreviations and acronyms
€: Euro
to.: Annualized
AFIP: Federal Administration of Public Revenues
ANSeS: National Social Security Administration
RWA: risk-weighted assets
ATM: Automated Teller Machine
BADLAR: Buenos Aires Deposits of Large Amount Rate (interest rate paid for 30 to 35-day fixed-term deposits, more than $1 million, average of entities)
ECB: European Central Bank
BCBA: Buenos Aires Stock Exchange
BCBS: Basel Committee on Banking Supervision
BCRA: Central Bank of the Argentine Republic
IDB: Inter-American Development Bank
BIS: Bank for International Settlements
BoE: Bank of England
BONAD: Argentine Nation Bond linked to the Dollar
BONUS: Argentine Nation Bond
BONCER: Treasury bonds in pesos adjusted for CER
BONUSES: Fixed-rate Treasury bonds in pesos
CABA: Autonomous City of Buenos Aires
CAFCI: Argentine Chamber of FCI
Call: Interest rate on unsecured financial market operations
CCP: Central Counterparty (Contraparte Central)
CDS: Credit Default Swaps
CEMBI+: Corporate Emerging Market Bond Index Plus
CER: Reference Stabilization Coefficient
NVC: National Securities Commission
MUST: Immediate Debit Payment Method
DPN: National Public Debt
DSIB: Domestic Systemically Important Banks
ECAI: External Credit Assessment Institution
ECB: European Central Bank
ECC: Credit Conditions Survey
USA: United States
EFNB: Non-Banking Financial Institutions
EMAE: Monthly Estimator of Economic Activity
EMBI+: Emerging Markets Bond Index
EPH: Permanent Household Survey
FCI: Mutual Funds
Fed: US Federal Reserve
Fed Founds: US Federal Reserve Benchmark Interest Rate
FGS: Sustainability Guarantee Fund
IMF: International Monetary Fund
FSB: Financial Stability Board
GBA: Greater Buenos Aires (includes all 24 matches)
A.I.: Year-on-year
IAMC: Argentine Institute of Capital Markets
IBIF: Gross Domestic Fixed Investment
IEF: Financial Stability Report
INDEC: National Index of Statistics and Censuses
CPI: Consumer Price Index
IPIM: Domestic Wholesale Price Index
IPMP: Commodity Price Index
IPOM: Monetary Policy Report
VAT: Value Added Tax
CSF: Liquidity Coverage Ratio
LEBAC: Central Bank Bills (Argentina)
LETES: U.S. dollar treasury bills
LFPIF: Financing line for production and financial inclusion
LR: Leverage Ratio
MAE: Electronic Open Market
MERCOSUR: Southern Common Market
Merval: Buenos Aires Stock Market (benchmark stock market index)
MF: Ministry of Finance
MH: Ministry of Finance
MSCI: Morgan Stanley Capital International
MULC: Single and Free Exchange Market
OECD: Organization for Cooperation and Development Ec.
ON: Negotiable obligations
OPEC: Organization of the Petroleum Exporting Countries
P.B.: The Basics
P.P.: Percentage points
PEN: National Executive Branch
PGNME: Global Net Foreign Exchange Position
GDP: Gross Domestic Product
PN: Net Worth
PPM: Mobile Payment Platform
SMEs: Small and Medium Enterprises
REM: Market Expectations Survey
ROA: Return on assets
SWEE: Return in terms of equity
ROFEX: Rosario Futures Exchange (Mercado a término de Rosario)
RPC: Computable Patrimonial Liability
SP: Standard and Poor’s (Index of the main stocks in the US by market capitalization)
s.e.: Series without seasonality
SEFyC: Superintendence of Financial and Exchange Institutions
NFPS: National Non-Financial Public Sector
TCR: Real exchange rate
TN: National Treasure
TNA: Annual Nominal Rate
Trim.: Quarterly / Quarter
ICU: Utilization of Installed Capacity
EU: European Union
US$: US Dollars
UVA: Unit of Purchasing Value
ICU: Housing Unit
UVP: GDP-Linked Units
Var.: Variation
VIX: SP 500 volatility
WTI: West Texas Intermediate
Share on


