Summary
The physical infrastructure of the financial system expanded slightly in 2023 driven by ATMs and complementary financial services agencies (ACSFs) | Financial service access points (PDAs) registered a year-on-year increase of 1.8% in terms of population. The growth of ATMs (+864 devices) and ACSF meant that new localities, with less than 5,000 inhabitants, have added at least one PDA. Thus, 52.7% of the country’s total localities, equivalent to 92.5% of the adult population, had physical coverage.
Point of sale (POS) terminals continued to grow during 2023 | The number of POS reached 5.3 million devices and showed an increasing trend in the last 5 years, in line with the increased use of electronic means of payment.
Account access continued to grow throughout 2023 | More than 1 million people joined the group of individuals with at least one bank or payment account. The coverage of the adult population with at least one account is practically absolute. In addition, the number of people who simultaneously have bank and payment accounts continued to grow, and stands at 6 out of 10 adults.
Account usage grew | The proportion of account holders who carried out operations with one of their accounts amounted to 70.3% in the fourth quarter of 2023 compared to 56.7% in the same period of 2022. Electronic payment transactions continued their upward trend during 2023 at a faster pace than in previous years | Adults made an average of 30 electronic payments per month, 68% more than during 2022. Immediate payments (transfers and Transfer Payments), with benefits in terms of costs and crediting times for merchants, were the means of payment that drove growth.
Mutual Funds (DCFs) gained importance in savings and investment products for individuals (PH) | The share of DCFs in the balance of PH savings and investment products went from 4.3% to 8.1% during 2023, while PSP accounts with balances in DCFs went from 6 million to 14 million. This happened in a context of a contraction of the savings and investment balance of PHs of 16.6% at constant prices.
During 2023, credit to individuals (PH) continued with the trend of new customer incorporation but with a lower average balance per debtor | PHs with financing in the expanded financial system (SFA), which includes financial institutions and non-financial credit providers (NFPs), grew 4.2% compared to December 2022, while the average balance per debtor fell by 29% at constant prices. This dynamic that has been recorded in recent years was mainly explained by the PNFCs.
More than one million micro, small and medium-sized enterprises (MSMEs) had credit in the SFA as of December 2023 | This number is slightly below that recorded in December 2022. The financing balance continued its downward trend and registered a year-on-year fall of 11.9% at constant prices. Regarding credit to the non-financial private sector (NFPS), financing to MSMEs grew 5 p.p. against December 2022 and represents 56% of it.
Companies and organizations (E) with accounts reached 495,300 units while those with financing in the SFA amounted to 230,100 | E with accounts and with a financing balance in the SFA grew 27% and 38% respectively in relation to March 2019. However, the average funding balance per E has fallen by 60% since then.
Indicator Table | Financial inclusion in Argentina
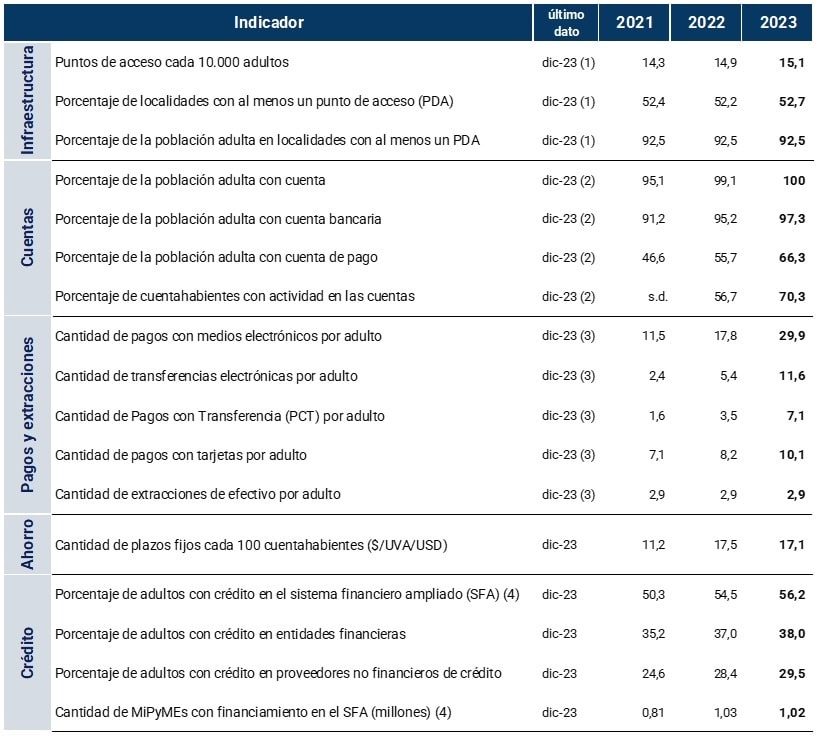
Notes:
(1) This includes access points for financial institutions (branches, mobile branches, ATMs, self-service terminals and complementary financial services agencies) and ATMs operated by non-financial institutions.
(2) Given that as of the date of this publication, data by age group from the 2022 National Census of Population, Households and Housing (INDEC) are not available, work continues with the projections of the 2010 Census. The indicators developed in this IIF in relation to the adult population should be taken as provisional until updated information from the last census is available. In this sense, the percentage of the adult population with at least one account shows a value of 101.7% in December 2023.
(3) Monthly average for each year.
(4) The SFA comprises financial institutions and non-financial credit providers.
Introduction
Financial inclusion refers to the access and use by individuals and businesses of various useful financial products and services, which are affordable and meet the needs of users (transactions, payments, savings, credit and insurance) and which are provided responsibly and are sustainable for suppliers1. Over the last few years, the Central Bank of the Argentine Republic (BCRA) has developed different initiatives and regulations aimed at improving financial inclusion, such as:
Access points: the possibility of installing non-bank ATMs was opened and it was provided that all types of ATMs must allow operation through biometric identification of people.
Access to accounts: free savings banks were provided, the possibility of remote opening and the entry of new actors into the financial system such as payment service providers was contemplated.
Electronic means of payment: the use of immediate transfers through an Alias-CBU/CVU was facilitated, the interoperability of bank accounts and PSPs was ensured, a means of payment with immediate crediting and reduced fees (payment by transfer) was created.
Credit: credit was oriented towards micro, small and medium-sized enterprises (MSMEs), the use of electronic credit invoices within the financial system was encouraged, as well as the information available for credit evaluation was improved.
Financial education: financial education programs were undertaken in conjunction with various provinces of the country and financial institutions (EEFF) with the aim of improving the financial capabilities of the population.
One of the objectives of the BCRA was to continue redoubling its efforts to promote financial inclusion and the modernization of payment methods. The integration of households and businesses into financial services is a necessary step towards deeper and more equitable financial systems that promote greater economic growth and the sustainable development of nations. In this sense, the international community has recognized financial inclusion as a priority for the development of nations.
To monitor the progress of financial inclusion, the BCRA monitors the variables that make it up2 . The metrics surveyed are disaggregated by gender, age and geographic location. This makes it possible to assess the progress and state of financial inclusion to guide policy decisions that are needed.
Financial inclusion, however, is not independent of the country’s macroeconomic performance, which can impact some of its components such as access to credit for individuals (PH) and MSMEs or savings.
In this sense, the second quarter of 2023 marked the beginning of a new recession in Argentina. Gross domestic product (GDP) fell 1.6% in 2023 compared to 2022, dragged down by a 6.7% drop in exports and a 1.9% drop in investment, while private consumption grew 1.1%3 .
The labor market presented mixed results during 2023. On the one hand, activity and employment rates grew in the quarterly average of the year while unemployment fell from 6.3% to 5.7%. The flip side of the increase in employment was a fall in labor income, which during 2023 marked an average drop of 3.6% (-16.5% for unregistered, -2.3% for registered private and +1.2% for the public sector)4 . On the monetary front, the monetary policy reference rate went from 75% nominal annual rate in January to 133% in October, followed by a reduction in December to 100% under a new monetary and exchange rate policy regime.
On the other hand, digital infrastructure, which enables the use of digital financial services, continued to advance. Internet access was expanded through mobile phone networks and wireless modems. In 2023, the number of mobile internet accesses increased by 3.3% YoY, above the variation of the adult population. In addition, the authorization of the entry of satellite internet companies by the National Communications Agency (ENACOM) in February of this year favors a greater arrival of connectivity to remote places5.
In this context, financial inclusion showed solid and sustained progress in some of its main components during 2023. Access to accounts and the use of these through electronic means of payment configured a positive dynamic that seems to strengthen a trend towards greater digitalization and less use of cash. In this way, Argentina fits into the global dynamics in terms of the adoption of digital payments and resembles developed economies in terms of universal account ownership by its population.
These analyses and the measures adopted in this area are communicated biannually through the Financial Inclusion Report (FIR). As a novelty, this report presents a more detailed analysis of the coverage of localities by points of access to financial services and some initial approximations on the possession and use of accounts at an early age and on the financial inclusion of companies and organizations.
1. Financial infrastructure
Financial services access points (PDAs) registered an increase of 2.9% in 2023, mainly explained by the growth of ATMs and complementary financial services agencies (ACSFs). In terms of the adult population, as of December 2023, 15.1 PDAs per 10,000 adults were counted, which represents a year-on-year growth of 1.8%. These new FLWs generated a slight increase in the percentage of localities with at least one access point to reach 52.7% of the national total (52.2% in December 2022), while the percentage of the adult population living in localities with FLW remained constant at 92.5%.
Graph 1 | Number of PDAs by type and set of countries
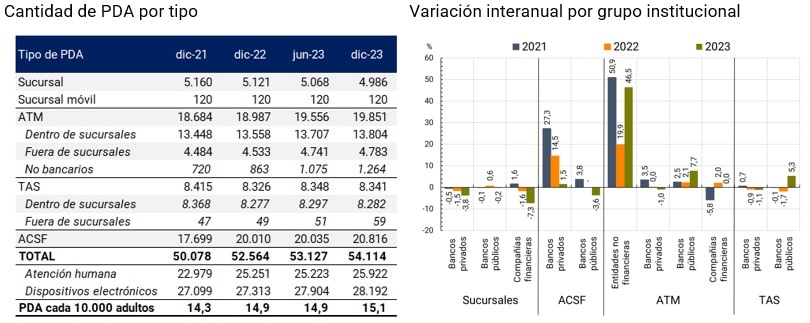
Source | BCRA, networks and INDEC.
First, the number of ATMs showed an annual growth of 4.6% (864 units), and almost tripled the increase observed during 2022. 46% of these ATMs corresponded to ATMs operated by non-financial companies (non-bank ATMs) while 54% were installed by financial institutions (EEFF), driven entirely by public banks. In recent years, the expansion of the number of non-bank ATMs stands out, which were mainly located in service stations and non-bank collection premises.
Non-bank ATMs contribute to increasing the number and coverage of these devices, although they offer a more limited range of operations than bank ATMs – mostly concentrated on obtaining cash, checking balances and making payments and recharges – and their use can entail a cost for users. On the other hand, these ATMs offer advantages for the businesses where they are located: (i) they help reduce the costs associated with handling cash, since the devices can be recharged with the cash collected; and (ii) their presence can increase customer traffic, which is beneficial to the business.
Most ATMs, both bank and non-bank, were located inside branches, and accounted for 69% of the total. However, since branches are usually located in urban areas, this may mean that some people will need to travel long distances to access them. Likewise, in relation to their time availability, 3 out of 4 were available 24 hours a day, either inside branches with unrestricted access or outside them in places without time limitations. On the other hand, 31% of ATMs were located outside branches, in places such as public roads, service stations, shopping malls or companies.
For its part, ACSFs recorded a growth of 4%, although there was a slowdown in their adoption by the EEFF (compared to a 13% increase in 2022). ACSFs, incorporated into the regulation at the end of 2018, were mainly introduced by private banks through the use of the infrastructure of extra-bank collection networks. Six EEFFs share all the authorized ACSFs, and in some cases, the merchants provide services to more than one entity simultaneously. The slowdown in the growth of ACSFs could be due to the fact that the number of ACSFs enabled is close to the total number of service points of the extra-bank collection networks6.
Branches continued with a downward trend (-2.6%), led by private banks (-123 vs. -3 by public banks). This behavior is part of a global context in which traditional physical infrastructure such as branches and ATMs are progressively decreasing their presence, as a result of a greater adoption of digital financial services and strategies by ESFFs to reduce their operating costs7 .
The drop in the number of branches did not have a negative impact on the coverage of localities (See Graph 1), given that all the branches that closed did so in localities where there was at least one other branch. However, the reduction had an effect on the density of the financial infrastructure in the affected localities, as users in these jurisdictions registered a lower number of PDAs available to make use of face-to-face financial services.
In terms of territorial coverage, the number of localities with at least one PDA increased during 2023, driven by the expansion of ATMs and ACSFs. 56% of the localities gained coverage through ATMs, while 40% did so through ACSF and 4% through both PDAs. Likewise, some localities registered ATMs and ACSFs as the only type of PDA. Most of these are localities with few inhabitants: of the 260 in which the only type of PDA was an ACSF, 232 localities had less than 2,000 adult inhabitants and 167 less than 1,000, while for localities with only ATMs, 250 had fewer than 2,000 adults and 195 less than 1,000. In this way, these types of FLW contribute to improving the coverage of the financial system, especially in smaller populations.
Graph 1 | Localities with at least one PDA
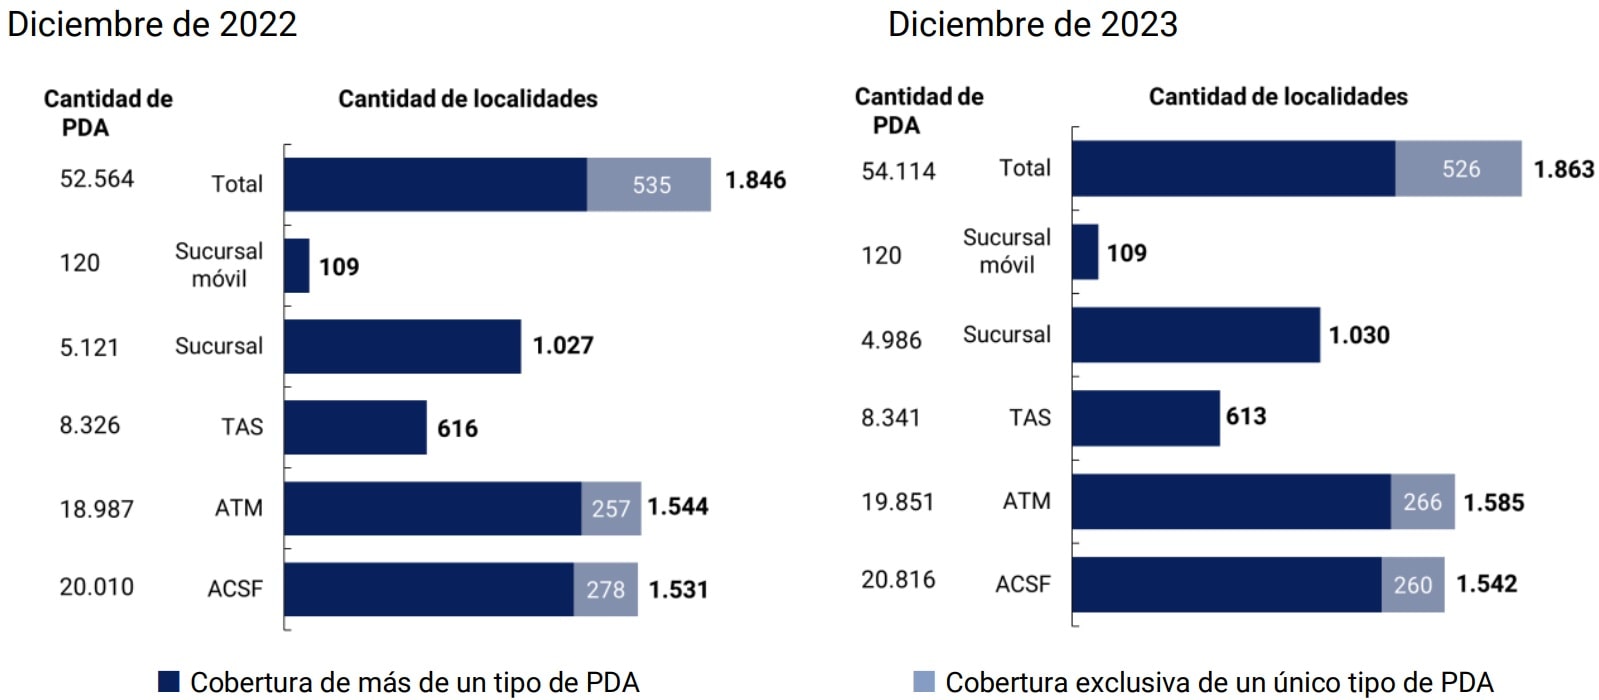
Source | BCRA and networks.
The percentage of the population living in localities with at least one FLW remained unchanged at 92.5%. This value did not increase since the localities that obtained their first PDA during the year 2023 had an adult population of less than 5 thousand adults. As mentioned in previous Financial Inclusion reports, the challenge lies in the coverage of localities with fewer inhabitants, given that 99.5% of localities with more than 10 thousand adults had at least one PDA as of December 2023.
On the other hand, localities with fewer than 10,000 adults had lower bank account coverage (i.e., a lower percentage of the population with an account) than localities with more than 10,000 adults and with a lower absolute number of FLW. However, the percentage of bank account holdings in less populated localities has improved substantially in recent years. This improvement was explained by various factors, such as the possibility of remote opening of bank accounts, the greater adoption of digital financial services and the mandatory opening of accounts, for example for the collection of salaries or social benefits. This means that the existence of a greater number of people with an account implies the need for more PDAs to deal with financial and non-financial transactions. Improving the density of ADP is an objective shared by localities with different levels of account holders, but it is a priority for those that are remote and have few inhabitants since the alternatives to the nearest ADP are further away.
As of December 2023, 30% of the localities that had PDA coverage registered a level of PDA in relation to the number of bank accounts below the national average (4.6 PDA per 10,000 accounts). These localities were home to 57% of the country’s adult population, while 7% were concentrated in localities without FLW or in rural areas. Although there has been an improvement in this indicator in recent years, the challenge of improving the physical infrastructure that supports bank account users is evident.
Graph 2 | Distribution of localities according to the number of PDAs per 10,000 bank accounts
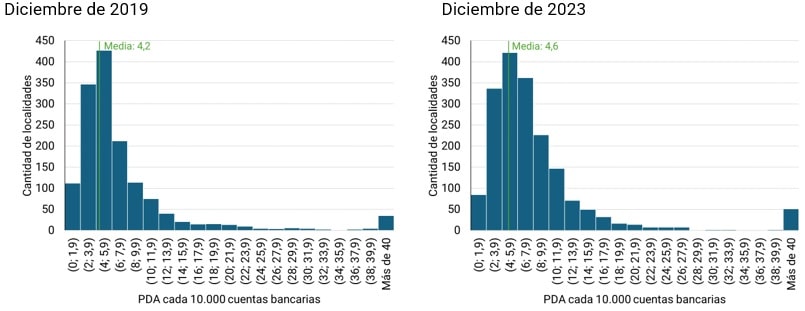
Source | BCRA and networks.
Box 1 | What role do POS play in the infrastructure for access to financial services?
Point-of-sale (POS) terminals function as a complement to PDAs for the access and use of financial services. The current regulation allows cash withdrawals through this type of device8, while in the ACSF its functionality is expanded by allowing the withdrawal and deposit of money9. Additionally, POS makes it possible to use electronic means of payment for the purchase of goods and services with debit and credit cards or QR payments. In other countries, POS are considered as access points within the financial infrastructure (for example, in Colombia and Mexico10).
Graph 3 | POS Devices
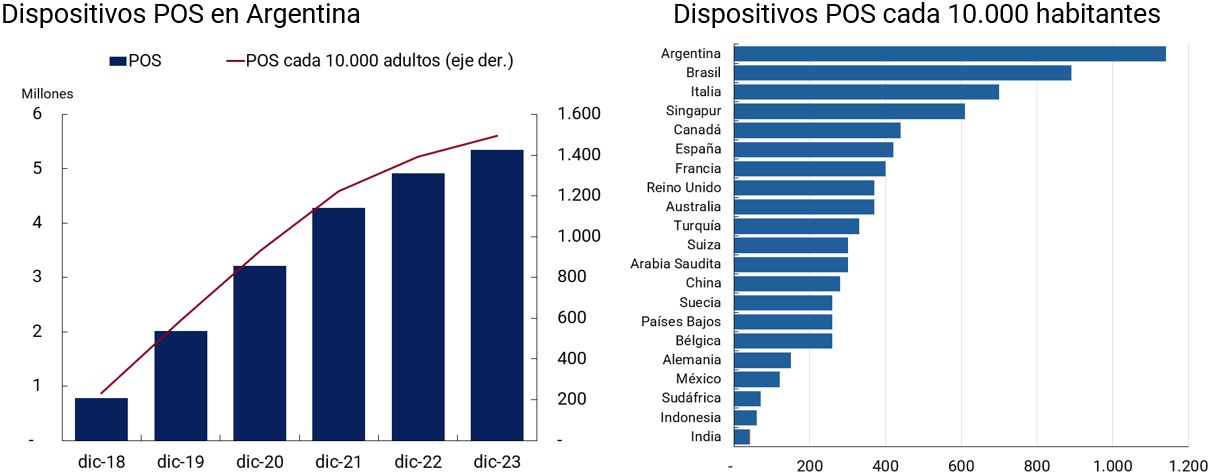
Note | The number of POS in Argentina includes active fixed POS and mPOS. Throughout the series, the relative importance of mPOS decreased, although due to the lack of information, it is not possible to calculate them. Graph on the right: BIS data to 2021, except Argentina BCRA data to 2023.
Source | BCRA, INDEC and BIS.
In Argentina, the number of POS terminals has grown significantly in recent years, having gone from 780 thousand in December 2018 to 5.3 million in December 202311 and reaching 1,496 terminals per 10,000 adults for that year. These devices are provided by both EEFF and payment service providers and include fixed POS and mobile POS (mPOS). The increase in the number of POS could have been driven in part by the low cost of acquiring and maintaining the terminals, their easy movement and use, as well as the extensive supply of devices by suppliers and the expansion of the use of electronic means of payment (see Section 3.2.).
In addition to being a channel for the use of electronic means of payment, POS allows cash withdrawals in businesses that offer the service to their customers. Through this system, customers can obtain cash (which is debited from their account) by using debit cards in stores such as supermarkets, service stations and extra-bank collection locations. This system has several benefits: (i) for users, it works as a complement to bank access points to obtain cash; (ii) for businesses, it generates an improvement in cash handling and can attract new customers; and (iii) for the financial system, it allows for the decongestion of PDAs. As of December 2020, 18 thousand businesses offered this service12 . The possibility of withdrawing cash reinforces the importance of POS for financial inclusion, as they improve the capillarity of the financial infrastructure, reach more distant places and have greater time availability.
2. Account Access and Use
The number of individuals (PH) holding accounts stood at 36.3 million as of December 2023. This variable registered a net increase of 1.3 million compared to December 2022, which meant a year-on-year increase of 3.7%. This implies that the adult population reached levels close to full coverage of accounts to make payments and transfers and to constitute savings and/or investments13 .
As mentioned in previous Financial Inclusion reports, the continuous increase in individuals with bank and payment accounts (up 3.8 million) to the detriment of the group of people with only a bank account (drop of 2.7 million) was highlighted. Adults with bank and payment accounts accounted for more than 60% of the adult population in December 2023. This migration began after the COVID-19 pandemic when the adult population with only bank accounts went from representing 76% to 43% of the adult population between December 2019 and December 2021.
Figure 4 | Individuals with accounts
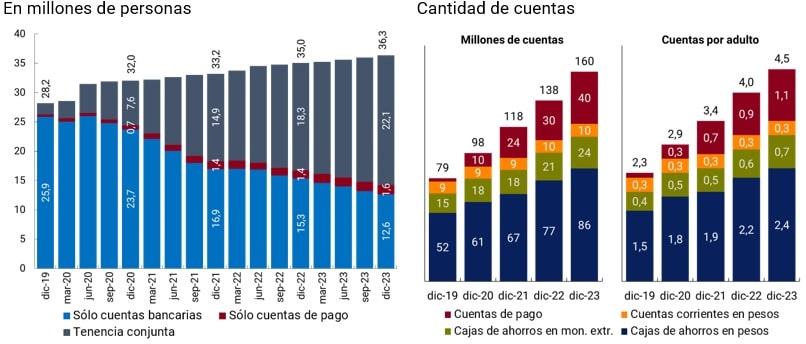
Note | Joint tenancy: people who have bank and payment accounts.
Source | BCRA based on COELSA and INDEC.
Likewise, during 2023, there was evidence of a significant opening of bank accounts14 , which even exceeded that of payment accounts (12.2 million vs 9.8 million). This behavior, in addition to reflecting that people seek to expand and complement their financial services by opting for a different type of account (payment accounts) than the one they had, would show that individuals are willing to add new bank accounts, since their offer is likely to fit additional needs. The commercial policy of public and private banks (through more personalized discounts and remuneration of account balances), the simplicity of remote opening, and the fact that savings banks in pesos are free of charge could explain this behavior15. It should be noted that in recent years some financial institutions (EEFF) have completely replaced their mobile banking applications, facilitating account opening and operations.
In terms of account activity, there is a trend towards a reduction in the gap between people who have accounts and those who register activity in their accounts. The number of PHs that registered at least one credit or debit transaction16 in any of their accounts amounted to 25.5 million during the fourth quarter of 2023, that is, 70.3% of the PH account holders as of December 202317 . This set of PHs registered a net increase of 7.6 million compared to the same month of the previous year, which translated into a year-on-year increase of 42.5%.
Graph 5 | Individuals who account holders have activity in one of their accounts
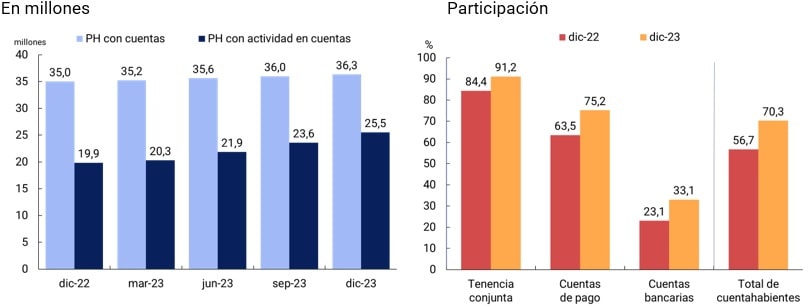
Note | “Accounts” considers bank and payment accounts. “Activity” is determined by the transactional credit or debit transactions cleared by COELSA.
Source | BCRA based on COELSA and INDEC.
When considering tenure by type of accounts, PHs with joint tenure registered the highest activity ratios. Holding both types of accounts offers practical advantages by leveraging their interoperability to transfer funds at no cost. This expands the range of transactional services and savings and investment options that PHs can access according to their needs, which contributes to higher activity rates and improves the conditions for financial inclusion in the country. It should be noted that the higher activity rate of the group of people with joint account ownership could be associated with the fact that people in a relationship of dependency, while receiving their salary in bank accounts, also tend to use the CDFs offered by PSP to safeguard the purchasing power of their income (see section Savings and investment modalities) and subsequently channel immediate payments through electronic wallets (see section on Media Electronic Payment Board).
The levels of joint account holding were moderately high in all provinces, although with different intensities, within a range between 40% and 75%. Similarly, the activity rate, that is, the proportion of PH account holders who registered movements in one of their accounts, ranged between 45% and 85%. A positive relationship was observed between those provinces that registered a higher participation of PHs with joint account holding, and those that registered high levels of activity in some of their accounts18 . In general, people with joint tenancy tend to take advantage of both bank accounts and payment accounts and the interoperability between both types of accounts.
Graph 6 | Type of account holding and activity rate by province
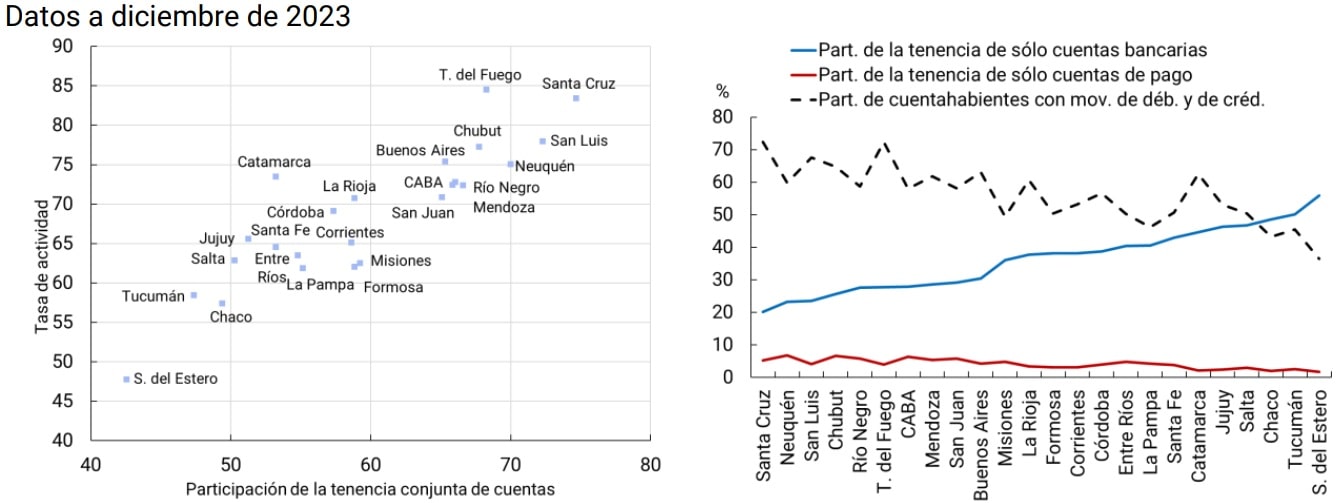
Source | COELSA.
On the other hand, the realization of debits and credits, which is presented as the complete combination of operations, decreases as the exclusive holding of bank accounts increases, but not the exclusive possession of payment accounts. On the one hand, the indicator does not capture debit card transactions and transfers between bank accounts, which could add operations in both directions, debit and credit. On the other hand, factors of various kinds, some linked to the structure of the province and others specific to account holders, could affect the degree of activity in these provinces such as income level, internet connectivity and the ability of the population to operate in digital environments.
Box 2 / Possession and activity of minors
A few years ago, the BCRA allowed the opening of accounts for authorized minors (0 to 17 years old)19 and adolescent minors (13 to 17 years old)20. The motivation was to provide financial services from an early age to facilitate the realization of everyday transactions. The accounts have an associated debit card through which purchases, transfers, withdrawals at ATMs or points of sale, transfers, fixed-term deposits in pesos and other daily operations can be made. In addition, the BCRA and the CNV21 issued a regulation that made it possible to set up and redeem Mutual Funds (CDFs) from the accounts of adolescent minors.
As of December 2023, 7.7% of the population under 18 years of age had only payment accounts, a figure that exceeds those who had only a bank account (4.2%) and joint ownership (3.7%). Within the adolescent population (13 to 17 years old), these values amounted to 28.3%, 13.3% and 13.7% respectively, indicating a preference for opening payment accounts. Only a third of adolescents who have a payment account owned both types of accounts, which contrasts with the adult population that usually uses payment accounts as a complement to bank accounts.
Table 2 | Account Ownership and Activity Rate at Early Ages
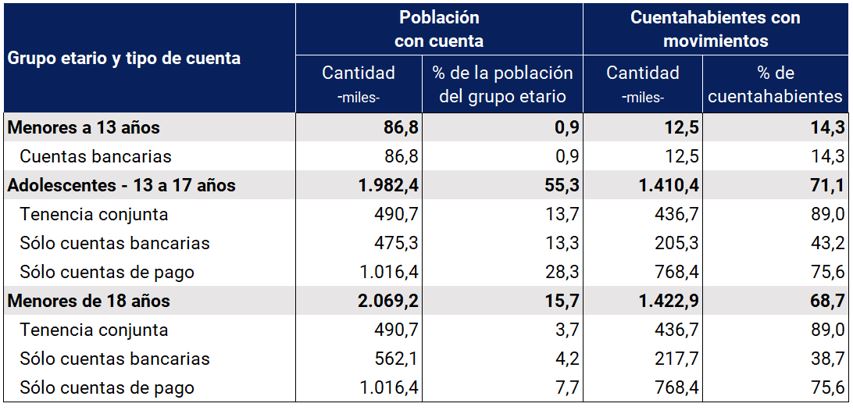
Note | The population with an account corresponds to December 2023 and the activity rate refers to the fourth quarter of 2023.
Source | BCRA based on COELSA and AFIP.
On the other hand, the activity rate for people under 18 years of age was 68.7% in the fourth quarter of 2023. In particular, 89% of those who had both types of accounts registered movements, either debits and/or credits, while for those who only had payment accounts the activity ratio rose to 75.6%, which contrasts with those who only had a bank account, who registered activity levels below 40%.
Digital natives tend to incorporate the learning of technology more easily and intuitively, given their approach to the internet, computers and cell phones from an early age22 . This could be a relevant explanatory factor in the preference of adolescents for the use of paid accounts.
3. Electronic means of payment and savings and investment modalities
3.1. Electronic means of payment
The global trend shows that electronic payments continued to advance in a context where immediate payments became an important driver of electronic payment ecosystems. At the same time, cash withdrawals in relation to GDP continued to decline, while the use of electronic payments expanded in low-value day-to-day operations.
Argentina is in tune with this global trend of expansion of electronic payment methods and, in addition, a decrease in the use of cash. This occurs in a market where in recent years there have been substantial changes in the acquisition and sub-acquisition of electronic means of payment (MPE). On the one hand, the BCRA regulated the exchange rate23, which encouraged competition and the emergence of new acquirers or acceptors24 . On the other hand, the emergence of aggregators or sub-purchasers of MPE25 transformed the market and allowed businesses to receive payments with different brands of cards and accounts in the same device, mainly supported by the use of new technologies (QR codes, payment buttons, mobile POS, among others).
In 2023, adults, on average, performed:
More transactions with each of the available MSEs and, in particular, with instant payment instruments;
More payments by MPE for each cash withdrawal, which amounted to 10 payments, while a year earlier it reached a value of 6 and 7 years ago just 2. In addition, the relative weight of cash withdrawals over GDP fell by 4.4 p.p.
As a result, the average amount of each electronic payment continued its downward path, which could indicate a replacement of the use of cash by digital methods in transactions of lower amounts26 .
Volumes and amounts transacted. The year 2023 was the year in which electronic payments grew the most in Argentina. PEMs continued their upward trend at a faster pace and recorded a new record in the increase in the number of transactions per adult27 . In the last 12 months, each adult made an average of 30 electronic payments per month, 68% more than during 2022 and almost 8 times more than in 2016.
Instant payments (transfers and Transfer Payments -PCT-) were the ones that drove the growth and accounted for 6 out of 10 payments per adult. Its use implies greater benefits for businesses in terms of accreditation periods and commissions. In the span of two years, the retail market for electronic payments substantially changed its composition and the weight of cards in the number of transactions decreased in response to the relative increase in immediate payments. All this within a framework of expansion of all electronic payment instruments in terms of the number of operations. On the other hand, the improvement in electronic payments was reflected in their advance in GDP (102.9% for the fourth quarter of 2023 vs. 73.9% for the same period in 202228)29 .
Figure 7 | Evolution of MPEs and cash withdrawals
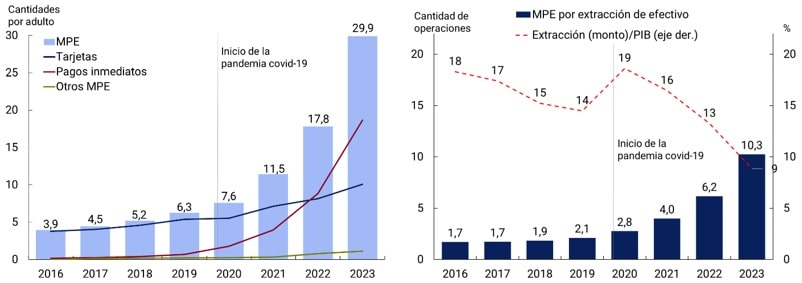
Note | The amounts represent the monthly average for the years considered. The ratio of withdrawals to GDP arises from dividing the amount of cash withdrawals during the fourth quarter of the years considered (annualized) by GDP at current values of the same period for the respective years.
Source | BCRA, INDEC and networks.
Amounts per adult at constant prices30 of PEMs also expanded, although at a more moderate rate (30% y.o.y.) than the quantities. Thus, the average amount per operation further accentuated its fall (-23% YoY), which would indicate that people continued to incorporate MPEs in transactions of lower amounts. PCTs and debit card payments were two of the instruments with the lowest average amounts per transaction (9.5 thousand pesos and 11.5 thousand pesos, respectively) and the most used (24% and 20%, respectively)31 . This would reflect the capillarity of these electronic payments by reaching operations of relatively low amounts that are traditionally carried out in cash.
The advance in the amounts channeled by MPE is also evident in relative terms to the average salary of the economy. In recent years, the ratio between the amount of MPE per adult and the average salary in the private sector has grown substantially. This analysis is also valid in the case of cash withdrawals as a proxy for the use of cash as a means of payment32, since there was a decrease in relation to the average salary in the private sector33.
Table 3 | Transactions by electronic means of payment
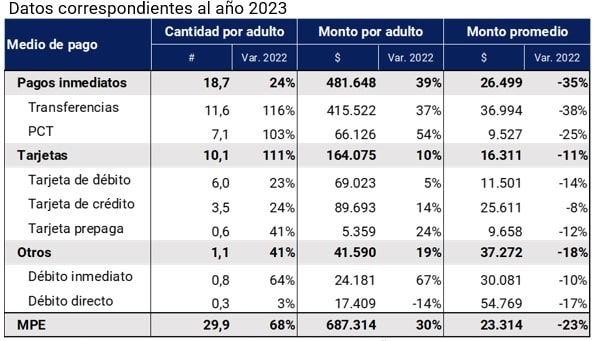
Note | The figures represent the monthly average for the year 2023. Transfers: includes interbank transfers, transfers to and/or to a payment account and transfers between payment accounts of the same payment service provider (PSP) and does not include transfers within the same financial institution. PCT: includes payments with interoperable transfers and payments with transfer between the same PSP.
Source | BCRA, INDEC and networks.
Immediate payments.
(i) Wire Transfers. During 2023, total transfers were consolidated as the most used electronic instrument to make payments for the second consecutive year34. For the first time, within the environment of interbank transfers, more transfers were made by mobile banking than via home banking. This is in line with the advance of interoperable wallets that promote transfers between third parties and between accounts of the same holder. In terms of amounts, transfers continued to increase participation in the total of MPEs. 60% of the amounts per adult were traded through these instruments in 2023, 3 p.p. more than a year earlier.
Interoperability between accounts continued to be consolidated hand in hand with the growth of joint account ownership (see Accounts section). The number of transfers between bank accounts and payment accounts per adult grew above (155% YoY) the amount of total transfers (116% YoY). Transfers originating from and going to an account within the same PSP accounted for 33% of the total amounts and 9% of the amounts at constant prices in 2023, registering a slight increase of 1 and 2 p.p., respectively, in relation to 2022.
Table 4 | Instant payments
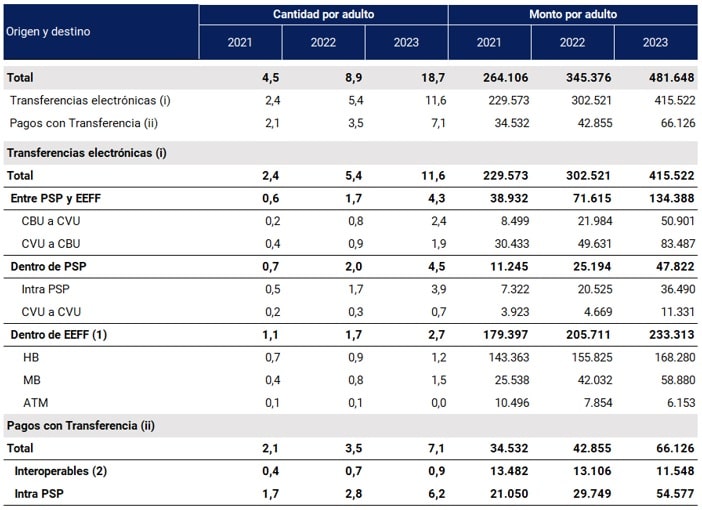
Note | The figures represent the monthly average for the respective years; (1) CBU to CBU, interbank. Does not include intrabank transfers. (2) Interoperable PCTs are carried out between different PSPs and EEFFs.
Source | BCRA, INDEC and networks.
(ii) Transfer payments (PCT). During 2023, PCTs ranked for the first time as the second most traded instrument by individuals, on average, and displaced debit cards (24% vs. 20%, respectively, of total amounts). The year-on-year growth of PCTs (103%) was driven by those made between users of the same payment service provider (PSP). On the other hand, within interoperable PCTs, those initiated 35 in a QR code drove growth with a rate of variation higher than the total due to the drop in POS and payment button channels.
Intra-PSP PCTs accounted for more than 80% of all PCTs during 2023, both in quantities and amounts at constant prices, with increases of 6 and 13 p.p., respectively, compared to what happened 12 months earlier. On the other hand, if the set of immediate payments (transfers and PCT) is considered, those operations channeled within the same PSP averaged, for the year 2023, 54% of the total amounts, while in amounts they accounted for 19%, in both cases with a year-on-year variation of about 3 to 4 p.p.
Figure 8 | Participation in intra-PSP operations
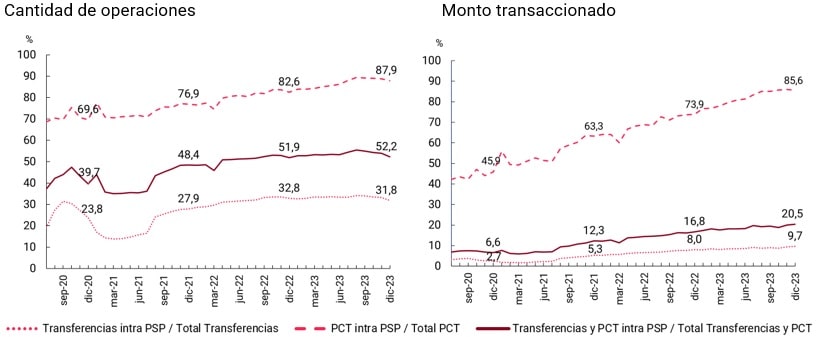
Source | BCRA, INDEC and networks.
Cards. Debit and credit card payments had a similar dynamic during 2023 with a growth of around 24% y.o.y. On average, each individual made almost twice as many monthly transactions with debit cards (6) as with credit cards (3.5). This behavior is replicated in many economies, mostly developed but also developing36 .
The greater boost in the digitization of everyday payments from the pandemic reversed the trend that existed in Argentina where each adult made more transactions with credit cards than debit cards. Measured by holder of each instrument, between 2019 and 2023, bank accountholders37 doubled debit card transactions (108%) while credit card holders increased these payments by 44%38 .
However, 2023 saw an upturn in credit cards, both in amounts (+24% YoY) and amounts (+14 YoY) per adult and reached the highest YoY variations in the series since 2016. In both cases, they had grown by only 4% YoY in 2022. The recovery could be linked to its operation as a credit instrument given that during 2023 more debtors were registered with this type of assistance (see section on Credit to individuals). In particular, credit cards continued to be the payment leaders in the e-commerce segment (75% of the total for 2023) in a framework where almost one and a half million new buyers were added (totaling approximately 23.2 million) and 11% more purchase orderswere generated 39.
3.2. Savings and investment modalities 40
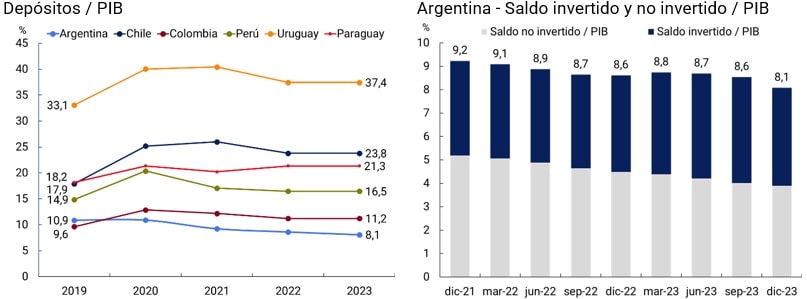
Individuals (PH) have the possibility of allocating their money among various savings and investment products, depending on their liquidity objectives, term and risk-return ratio. If the products offered by financial institutions (EEFF) and payment service providers (PSPs)41 are considered, the balance of savings and investment products in PH42 represented 8.1% of the Gross Domestic Product (GDP) in 2023.
Between 2019 and 2023, deposits in the financial system of other economies in Latin America experienced an increase relative to their GDP43. However, Argentina followed a trend contrary to that of its regional counterparts and registered a drop of 2.8 percentage points. In addition, Argentina’s savings ratios to GDP have been lower than the regional average during this time period. The macroeconomic context, characterized by high inflation and mainly negative real interest rates, reduced investment positions in financial institutions and induced people to cover the loss of purchasing power of their transactional deposits through the use of Mutual Funds (CDFs).
Figure 9 | Balance of savings and investment products in relation to GDP
Note | Graph on the left: The IMF’s Financial Access Survey (FAS) indicator “Households’ active deposits in commercial banks (% of GDP) was used, which includes demand deposits, savings banks, time deposits, and money pools. For Argentina, the FAS series for the year 2019 was used, while for the period from 2020 to 2023, own estimates were used. Graph on the right: to obtain the coefficients over GDP, the moving average of the last 12 months was taken for the savings and investment balances (numerator) and for GDP the moving average of the last 4 quarters (denominator) was taken.
Source | BCRA, IMF (FAS), CAFCI and INDEC.
As of December 2023, the savings and investment balance of PHs was worth $26.2 trillion44, with a year-on-year reduction at constant prices of 16.6%. The second half of the year was characterized by a context of greater uncertainty due to the electoral process and, towards the end of the period, the implementation of a new monetary and exchange rate policy framework (see Introduction)45 . The decrease in the monetary policy rate resulted in a reduction in the minimum annual nominal fixed-term rate from 133% to 110%46 and the reference exchange rate47 between the peso and the U.S. dollar went from $366.5 to $800. On the other hand, the inflation rate accelerated in the last months of the year and registered a year-on-year variation of 211% as of December 2023.
Table 5 | Savings and investment balances of individuals
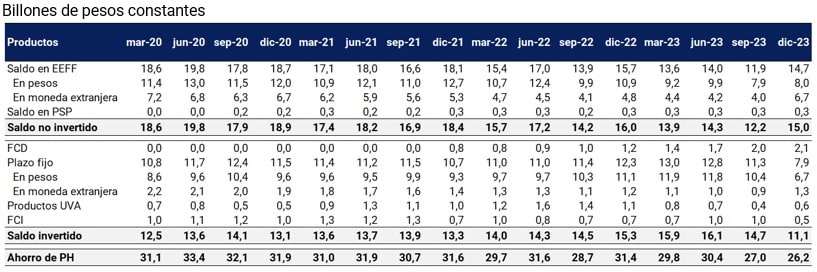
Note | The savings and investment balances of the PHs consider products in local and foreign currency. A trillion equals a trillion. Balances in foreign currency are expressed in pesos and valued at the BCRA reference exchange rate (Communication A 3500) on the last business day of the month.
Source | BCRA, CAFCI and INDEC.
These changes in interest rates and in the general price level generated a drop in the real monthly return of maintaining liquid balances, both on demand in EEFF and PSP accounts, of FCDs and short-term fixed terms. However, since the beginning of the year, DCFs stood out for being the product whose balance grew the most in real terms and registered a year-on-year increase of 68.1% as of December 2023. This reflects an increase in the preference for remunerated liquidity over liquid balances (26.9% drop), as these products allow a positive interest rate to be obtained with almost no loss of liquidity. Additionally, there was a 40% year-on-year drop in fixed-term balances in pesos, which would indicate that the return of placing the money in the short term (close to 30 days) did not compensate for the liquidity and return offered by the CDFs.
On the other hand, the balances invested in UVA products, which had lost attractiveness during 2023, grew again in the last month of the year, with a monthly growth of 91%. However, its participation in savings and investment products was low, with a value of 2.3% as of December 2023.
Finally, the valuation of foreign currency deposits at a higher exchange rate in December 2023 was a factor that had a positive impact on the balance in EEFF. Although this effect does not reflect a change in the behavior of PHs in their savings and investment decisions, it generated an increase in purchasing power (expressed in constant pesos) over holders of demand and term balances in foreign currency48 .
Figure 10 | Real monthly interest rate on fixed terms and money pools
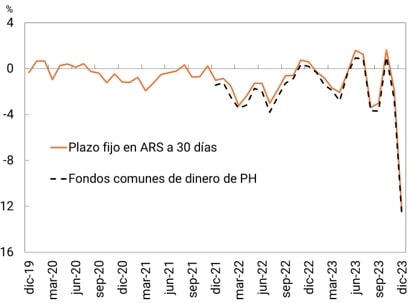
Note | FCD performance is calculated as the weighted average of Net Worth (NP) in the total FCD market.
Source | BCRA and CAFCI.
The evolution of certificates in pesos and term holders in the last two years shows improvements in the level of use of the product. Thus, the number of fixed-term loans in pesos made by PH increased from 3.6 million in December 2021 to 5.9 million in December 2023 and the number of PH holders of fixed-term loans went from 2.9 million to 4.3 million within the same period. In turn, the average balances per holder registered a downward trend in recent years, reflecting a loss in the purchasing power of holders.
Figure 11 | PH Fixed-Term Utilization Metrics
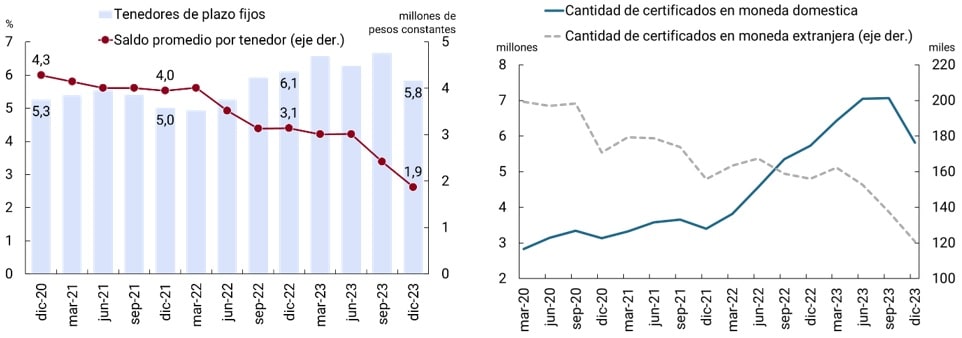
Note | The percentage of holders estimates the proportion of PH account holders with a fixed term. The number of certificates includes fixed terms in pesos, dollars and UVA without the option of pre-cancellation.
Source | BCRA and COELSA
The percentage of account holders with fixed terms grew during 2023, although it exhibited a significant reduction in the last month of year49. The values of this indicator reflect the low use of fixed-term loans as a savings and investment instrument, considering that the levels of activity in bank accounts50 show higher values within the same period.
On the other hand, liquidity management showed a greater use of DCFs to remunerate liquid balances. In 2023, this product increased its relative importance compared to other savings and investment products, where its share went from 4% in December 2022 to 8% in December 2023 and from 8.1% to 18.8% in the set of balances invested within the same period of time. This growth was reflected in the number of PSP accounts with a balance in DCF, which went from 6 million in December 2022 to 13.8 million in December 2023, and in the percentage of payment accounts with DCF, which rose from 20% to 34% in the same period. The structure of this market has some particularities: (i) two of the PSPs account for 90% of the number of payment accounts with CDFs and 85% of the balances of the DCFs subscribed from PSPs in both cases; (ii) 10% of PSPs offer this investment alternative. On the other hand, within the PH CDF industry, the share of DCFs subscribed from PSP rose from 38.7% in December 2022 to 51.5% in December 2023.
Figure 12 | Liquidity Management
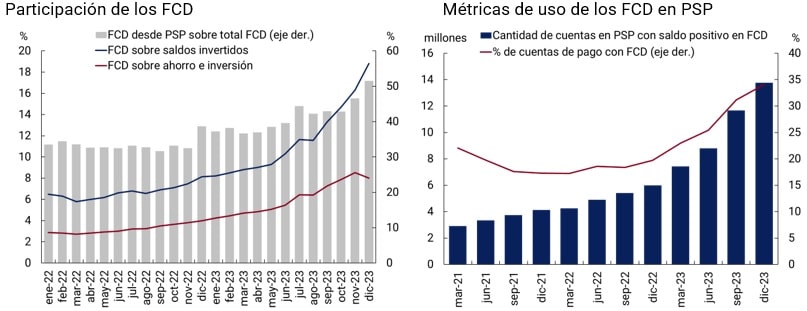
Source | BCRA, CAFCI and CNV.
If the products previously analyzed are considered, the decrease in the purchasing power of savings and investment of PHs reduces their ability to cope with unforeseen events, which is known as precautionary savings. On the other hand, the fall in the real return of savings and investment alternatives could generate a migration of resources to options that are outside the perimeter of the financial system, both in terms of cash flow and stock. This combination of factors could decrease the number of people participating in financial savings and investment products and create obstacles to the incorporation of new people into the system, which would have a negative impact on the level of financial inclusion. However, the possibility of remunerating liquidity through DCF attracted a considerable number of individuals. This option, as an entry point to savings and investment decisions, is an effective mechanism for managing short-term liquidity.
4. Credit
4.1 Credit to individuals
The expanded financial system51 (SFA) continued during 2023 with the incorporation of new individuals (PH) to credit with an average balance per debtor in constant reduction. This phenomenon, which has been recorded in recent years, is mainly driven by other non-financial credit providers (OPNFCs) that grant personal loans for small amounts and through electronic means.
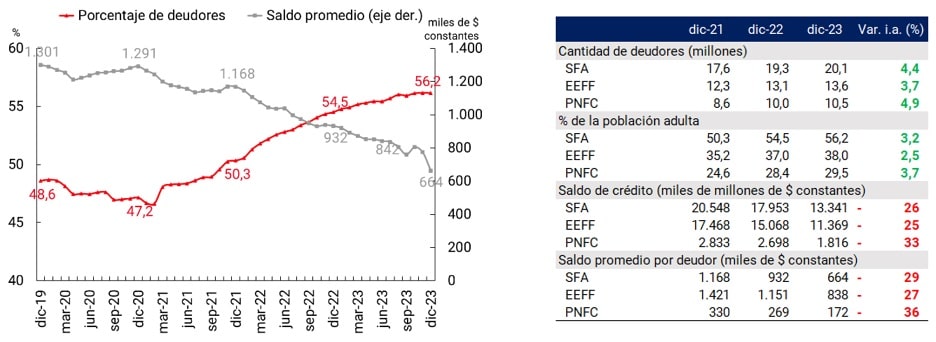
As of December 2023, 20.1 million people registered at least one SFA financing, which represents an increase of 4.2% compared to December 2022. However, in the same period the average amount per debtor fell by 29% and reached a value of 664 thousand pesos (vs. 932 thousand pesos a year earlier, at constant values52). The acceleration of inflation is a relevant explanatory factor in the sustained fall in the average balance per debtor.
Figure 13 | SFA Financing to Individuals
Source | BCRA and INDEC.
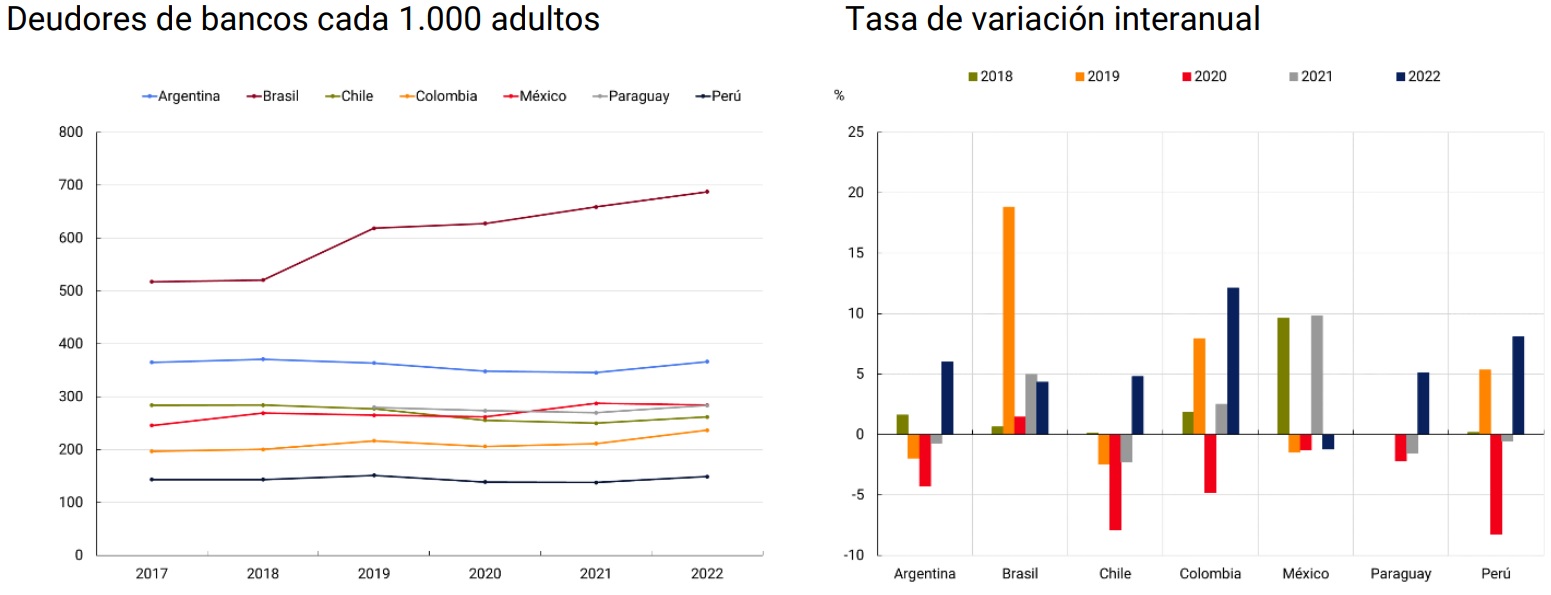
The available data allow a comparison of the banks’ credit holdings at the regional level. As of December 2022, our country registered 367 debtors per 1,000 adults and ranked second after Brazil, which reached 687 debtors per 1,000 adults. Thus, the evolution of access to credit in Argentina is in line with what has been observed in the rest of the region.
Figure 14 | International Credit Access Comparison
Note | Debtors of commercial banks in the household sector are shown. Source | BCRA (Argentina data) and Financial Access Survey, IMF.
Credit providers53. As of December 2023, financial institutions (EEFF) provided financing to 13.6 million adults, which is equivalent to 38% of the adult population. Non-financial credit providers (NFCPs), on the other hand, financed 10.5 million adults, or 29.5% of the total. In terms of balances, the average per debtor of EEFF reached 838 thousand pesos, while for PNFC it was approximately 1/5 of that value (172 thousand pesos).
Within the EEFF as a whole, during 2023 private banks increased the number of people they provide financing to by 4% and reached 27.4% of the adult population of our country. Public banks, for their part, increased their number of debtors by 5% and covered 14.1% of adults by December 2023. Both groups of entities reduced the average balance per debtor by 23% and 26% respectively and continued with a sustained downward trend.
For PNFCs, non-bank credit card issuers (ETCNBs) reduced their number of debtors by 1% during 2023 and ended the year providing financing to 14.6% of adults, while the average balance per ETCNB debtor decreased during 2023 by 26%. OPNFCs continued to incorporate new debtors, although at a slower pace than in previous years (10% increase during 2023, vs. 37% in 2022 and 89% in 2021). As of December 2023, the OPNFCs had provided financing to 19.1% of the country’s adults, but deepened the reduction in the average balance per debtor, which ended the year with a 47% drop. The addition of new people with OPNFC financing is related to the increase in the number of payment account holders. It should be remembered that PSPs can also register as PNFCs and offer credit to their customers. Holding a transactional account gives financing providers information to assess their customers’ credit and mitigates credit risk. In this way, accounts act as the first step towards greater financial inclusion54.
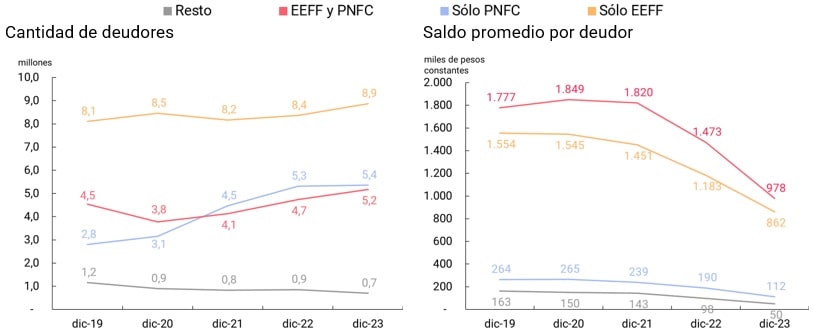
Debtors can have credit with a single group of suppliers or both groups simultaneously: as of December 2023, 8.9 million registered debt exclusively with EEFF, 5.4 million exclusive financing from PNFC and 5.2 million from both groups simultaneously. During the last year, the number of exclusive debtors of PNFC did not suffer considerable variations, after having registered a strong increase in previous years. People who had debt in PNFC and EEFF simultaneously, however, increased by 9%. These values would indicate that the PNFCs began with the inclusion in formal financing of people who did not register debt with EEFF, and then moved to focus on those who already did.
In terms of balances, concurrent debtors of both groups of suppliers had the highest average balance per debtor, followed by those with only EEFF debt. The three sets of debtors registered a sharp drop in the average balance, although the reduction is greater for the exclusive debtors of PNFC.
Figure 15 | Number of debtors and average balance per debtor
Note | EEFF only: indicates that debtors registered financing only in EEFF (and not in PNFC, although they can register debt in financial trusts -FF). PNFC only: indicates that the debtors registered financing only in PNFC (and not in EEFF, being able to register debt or not in FF). EEFF and PNFC: indicates simultaneous financing of EEFF and PNFC (being able to register debt or not in FF). Remainder: includes debtors who registered debt only in FF55 .
Source | BCRA.
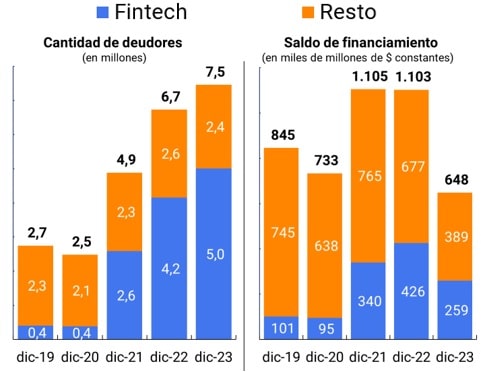
In order to deepen the analysis of the behavior of OPNFCs, companies can be classified according to certain common characteristics56 . The fintech group comprises those companies that grant loans through electronic channels. In a context of greater adoption of digital financial services, the fintech subset drives the phenomenon of new people joining financing, which went from 2.6 million debtors in December 2021 to 5 million in December 2023. The rest of the OPNFCs, on the other hand, did not register significant changes in the number of people to whom they provided financing in the same period.
Figure 16 | OPNFC – distribution of debtors and balance
Note | The categories included in the “Rest” set are: cooperatives and mutuals, other retail chains, sale of household appliances, leasing factoring and other providers.
Source | BCRA.
During 2023, the total balance financed by both fintech and other providers was reduced, by 39% and 43% respectively. However, for the fintech group, the reduction in the financed balance in conjunction with the strong incorporation of new debtors, led to a sharp drop in the average balance per debtor. The fintech companies that drove the increase in people with financing focus their credit offer on personal loans for low amounts mainly intended for consumption.
Type of assistance. Credit cards remain the most chosen type of financing by the population and reached 39.3% of the population as of December 2023, which represents a year-on-year increase of 1.8%. The increase in the number of people with financing through a credit card occurred in an unfavorable context, marked by the increase in interest rates, the reduction in the supply of interest-free installments and the fall in consumption and activity, among other factors. In part, it could be explained by people who joined the job in a relationship of dependency and contracted this credit product as part of a package with the opening of an account for the payment of salaries. Throughout 2023, the average balance per debtor of this type of assistance was reduced by 20% to reach 455 thousand pesos per debtor.
Personal loans, driven by the behavior of OPNFC, reflected the incorporation of new debtors with a 6.3% increase during 2023. As of December 2023, 30.2% of adults in the country had such assistance. In terms of balances, the average per debtor fell by 45% in real terms and closed the year at 249 thousand pesos.
Both credit cards and personal loans registered a slowdown in the incorporation of new debtors and a deepening of the fall in real financed balances compared to the previous year. This phenomenon could be linked to the macroeconomic context of 2023, marked by a contraction in economic activity, an acceleration in the inflation rate, and a fall in labor income (see Introduction).
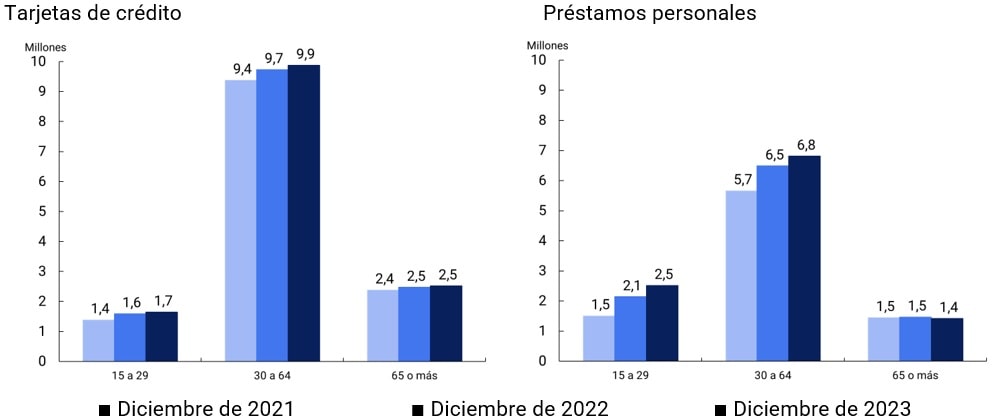
Figure 17 | Number of debtors by age and type of assistance
Source | BCRA.
Between December 2021 and December 2023, a greater number of people under 30 years of age were registered with personal loans than with credit cards, while for those over 30 there is an inverse relationship. Likewise, it is observed that the population under 30 years of age concentrated the largest incorporation of new debtors of personal loans, while for older adults (over 65 years of age) there was a drop in the number of debtors. The strong digital component of the personal loans offered by the OPNFCs could explain, at least partially, this behavior.
Financing repayment behavior. At the SFA level, the repayment behavior of people with financing has maintained relatively stable values since June 2021, when the flexibility scheme of applicable criteria for the classification of debtors established during the COVID-19 pandemic ended. As developed in previous Financial Inclusion (FII) reports57 , there is a marked difference in the conduct of EEFF and PNFC debtors, with a gap of 21 percentage points in December 2023. At that time, 94.3% of the debtors of the EEFF maintained a fair situation (i.e. they adequately fulfilled their financial commitments), in contrast to 73.2% for the PNFCs. In turn, the balance of debtors in a regular situation represented 97.2% of the total balance for EEFF and 88.2% for PNFC. These differences could be associated, among other factors, with a lower proportion of debtors with a dependent relationship for the second group58 . It is also observed that the PNFCs registered an improvement in the repayment behavior of their debtors as of 2021, which could be explained by the incorporation of new people with financing and a good repayment capacity.
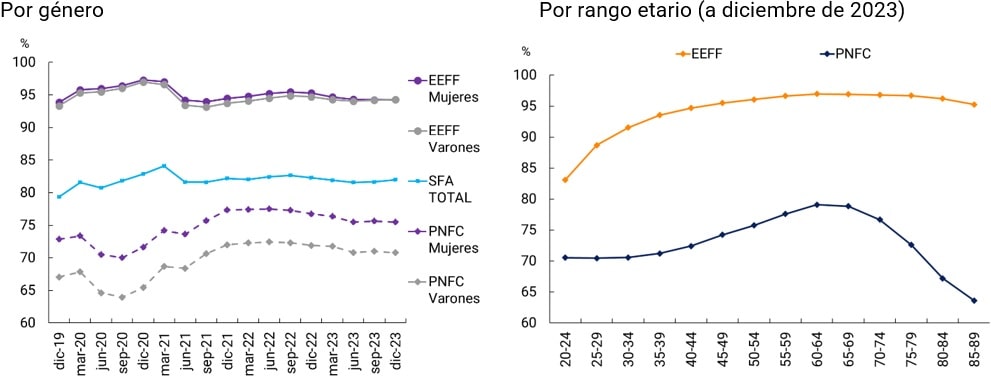
In terms of gender, there are no differences in the regularity of payments of EEFF debtors, with 94.3% regularity for men and women as of December 2023. Such is not the case for the PNFC as a whole, where differences are observed: as of December 2023, men with PNFC financing registered a regularity of 70.8%, while for women with financing it was 75.5%. Although, as mentioned above, the level of regularity of PNFC debtors has increased significantly, the difference in the repayment behavior of men and women within this group remains, although with a slight tendency to reduce (6.2 p.p. gap in December 2020 vs. 4.7 p.p. in December 2023).
Figure 18 | Percentage of debtors in a regular situation
Source | BCRA.
At the age range level, repayment levels improve with age until they peak around age 65, in both EEFF and PNFC, and then fall thereafter. However, both the initial improvement and subsequent fall is milder in EEFF: most of the improvement occurs before the age of 40 and the fall after the age of 65 is slight. For the PNFCs, the opposite occurs: repayment levels grow rapidly only after the age of 40 and show a pronounced drop after the age of 70.
4.2. Credit to productive units
Micro, small and medium-sized enterprises (MSMEs) in developing countries, pillars of production and generators of employment, face difficulties in accessing financing. According to the World Bank, the estimated gap59 between potential demand and actual supply reaches 18% of GDP for formal companies and 11% for informal ones. Reducing these barriers in credit markets could boost the productivity of economies and promote their growth.
At the regional level, although the density is higher in the highest-income countries (Uruguay and Chile), the importance of MSMEs in the productive fabric is similar, since they represent 98% to almost 100% of it, with microenterprises accounting for from 75% (Chile) to 96% (Argentina) of the MSME universe. In formal employment, concentrations are lower, but still high: MSMEs account for more than 45% in the selected economies and, in the average of the sample, more than 60% of formal employment.
Table 6 | International Comparison of MSME Metrics
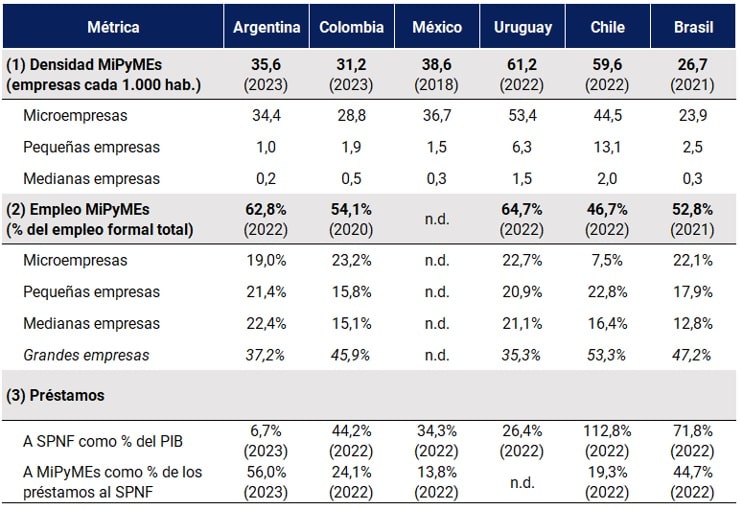
Source | Argentina: Ministry of Productive Development, MTESS, BCRA and Ministry of Economy; Colombia: Confecámaras and MINCIT; Mexico: INEGI; Uruguay: ANDE; Chile: SII; Brazil: SIDER. For (3): Argentina (BCRA) and for the rest of the countries: NFPS as a % of GDP (World Bank) and MSMEs as % of NFPS loans (OECD).
The ecosystem of productive units in Argentina is mainly composed of MSMEs. These represent almost all companies, employ 63% of the country’s formal workers and in relation to the population reach a value of 35.6 units per 1,000 inhabitants60 .
In terms of the financing that flows to this type of firms, Argentina combines a high percentage of credit to MSMEs with respect to credit to the non-financial private sector (NFPS) (56%) with a low ratio of credit to MSMEs to GDP (3.7%). This can be explained by the coexistence of a low credit-to-GDP ratio in the economy in general with public policies aimed at directing financing to MSMEs. In contrast, the rest of the region’s economies have higher credit-to-GDP ratios and lower shares of credit to MSMEs in NFPS credit.
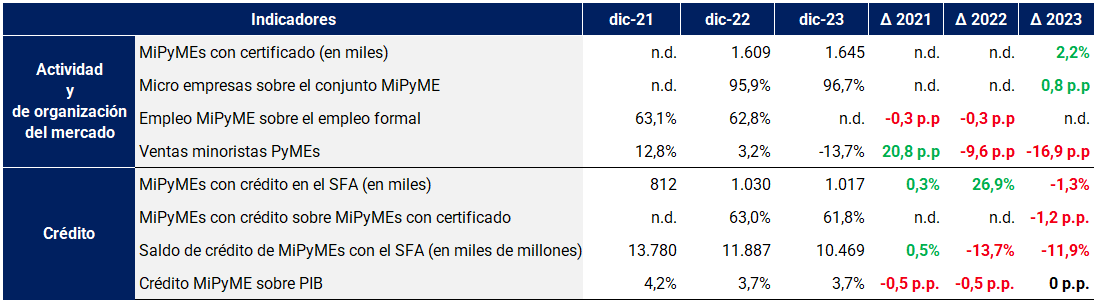
Table 7 | MSME Monitor. Activity, organization and financing
Source | BCRA, MTESS, INDEC, Ministry of Economy, CAME.
General metrics. In terms of access to credit, out of a total of 1.6 million companies with MSME certification, 62% (1.02 million companies) had financing in the expanded financial system (SFA) in December 2023. This implies a reduction against December 2022 of 1.3% (-13,000 companies) and an increase of 1.5% against June 2023 (+15,000 companies). The year-on-year drop is explained only by the performance of small enterprises (-12.2%), as both micro and medium-sized enterprises grew (0.9% and 6.1%, respectively).
Figure 19 | Benchmarks on MSME financing
Source | Open Data on Productive Development, INDEC and BCRA.
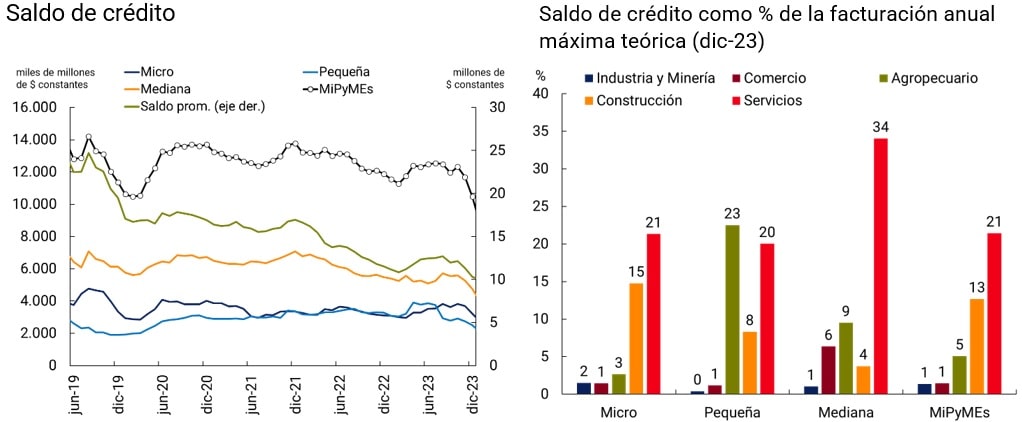
As already mentioned in previous Financial Inclusion (FII) reports, the level of access varies according to size, being full (100%) for small and medium-sized enterprises incorporated as legal entities (PJ) and between 59% and 74% for microenterprises of natural persons (PH) and PJ respectively61. In other words, for small and medium-sized enterprises, if there were one, the challenge would be one of intensity and not of access to credit, while for microenterprises it would also be one of access. From the comparison of credit ratios against theoretical annual turnover by sectorof activity 62 , a higher level of leverage can be observed in the Services sector, with ratios ranging from 20% of theoretical annual turnover for small companies and reaching 34% in medium-sized companies. The lowest theoretical credit-to-turnover ratios occur in Industry and Mining, which do not exceed 2% for any size of MSMEs.
Regarding the financing balance, MSME credit with the SFA reached $10.5 billion in December 2023, 11.9% real year-on-year less than in December 2022 and 16.1% less than in June 2023. Since the fall in the number of companies assisted was less than the fall in the balance of financing, the average balance per company fell (-10.8% YoY).
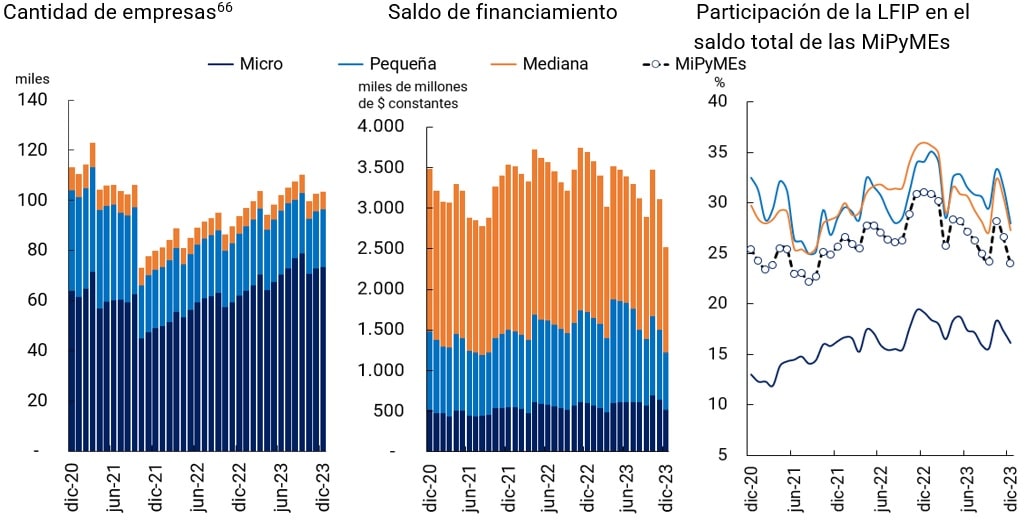
Through the Financing Line for Productive Investment (LFIP)63, the EEFF granted loans for approximately $2,589 billion as of December 202364 (about 24% of the total financing balance to MSMEs). It should be noted that this line of financing partially absorbed the funds from the deposits, since for every $100 pesos that the EEFFs can lend, at least about $10.765 had to be allocated to MSME credit.
Figure 20 | MSMEs with financing under the LFIP
Source | BCRA.
The LFIP financing balance by size was distributed in a similar way to the general SFA financing to MSMEs, which was concentrated in medium-sized enterprises (50% of the total vs. 45% in the SFA). However, the numbers did not do so, given that only 63% were microenterprises vs. 84% in the SFA, while small and medium-sized enterprises were favored, raising their degree of participation from 15% and 1.4% in the SFA to 20% and 6% in the LFIP. Against December 2022, microenterprises gained 6 p.p. of participation in the amounts and 4 p.p. in the balance.
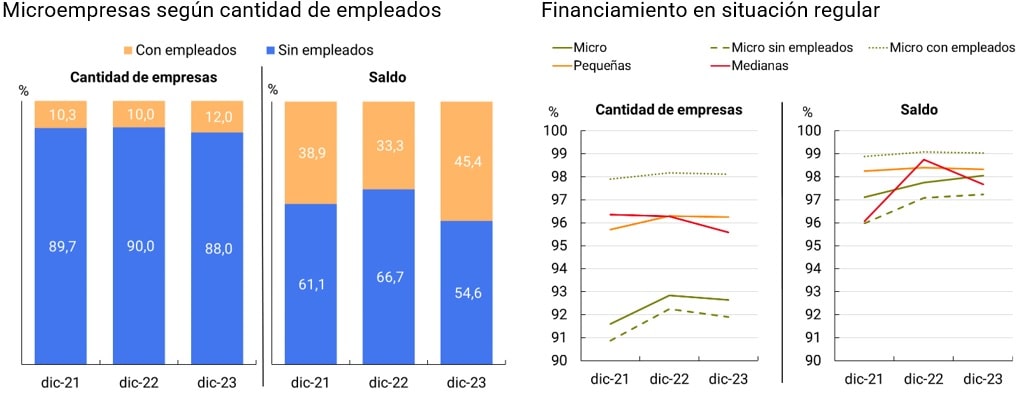
Microenterprises. Microenterprises, within the MSME universe, presented problems of both access and intensity in their relationship with SFA credit. To investigate this situation, different characteristics of MSMEs with financing were analyzed that could give the indication of potential barriers to access to financing.
In the first place, the number of employees can account for the level of formality67 of microenterprises. Within the set of microenterprises that registered financing as of December 2023,68 companies without employees reached 88.0% and accounted for 54.6% of the total financing balance of microenterprises. These values show that the SFA grants financing to micro enterprises that do not have employees (which can be associated with levels of formality and lower incomes) in a significant proportion, so it does not seem to constitute an obstacle to access to credit.
Figure 21 | Possible limitations on access to credit
Source | BCRA.
Second, another factor that, a priori, could have an impact on the lower level of access of microenterprises to credit is their repayment behavior, since a higher level of irregularity could limit the supply of financing by the EEFF and PNFCs to microenterprises that do not have credit in the SFA. It should be noted that microenterprises generally have a more limited credit history than larger companies. However, the proportion of micro-enterprises that adequately comply with the repayment of their obligations is only slightly lower than for small and medium-sized enterprises. As of December 2023, 92.6% of micro-enterprises were in a regular situation, while 96.3% of small enterprises and 95.6% of medium-sized enterprises. In terms of balances, a similar situation is observed, given that the 3 sizes of MSMEs presented similar levels of regularity. In this way, the repayment behaviour of micro-enterprises does not differ substantially from the rest of the sizes, without this being an explanatory factor for the access limitations suffered by the subset of micro-enterprises.
However, the analysis does not end there, as the reasons for the lack of access could either be found in other aspects of supply not investigated in this section or related to issues of demand from microenterprises. To complement this analysis, information is required on microenterprises that do not have financing in the SFA and qualitative data on the demand for credit by this group of companies.
Section 1 / Financial inclusion of companies and organisations
Companies and organizations (E)69 are relevant actors for the functioning of societies. In the case of companies, their ability to organize production, generate employment and promote improvements in factor productivity contributes to the economic development of countries and their inhabitants. As for organizations, their objectives are usually broader, with a focus on the social development of nations in various dimensions70.
For these reasons, it is relevant to analyze the link between E and financial services. As a first approximation, this section investigates the access and use of accounts and financing of E, and considers that: (i) the use of accounts is essential for the development of their basic activities, in a context of accelerated growth in the use of electronic means of payment and electronic commerce, and (ii) access to financing contributes to the viability and growth of the business model or social purpose chosen. However, since E pursue objectives different from those of human persons (PH), the approaches to analysis regarding their financial inclusion differ from those applied to the latter.
According to the information available from the BCRA, each legal entity was assigned a categorization of company or organization based on the legal form of the company71 . The first subset is made up of almost 80% de facto companies, public limited companies and limited liability companies, while the second subset is made up of almost 90% associations, foundations and cooperatives.
Account holding. The use of accounts facilitates the performance of E activities by allowing them to receive or make payments and manage their funds. For E, the use of electronic means of payment (EPM) responds to their greater security and efficiency72 , to the need for treasuries to manage a large number of operations with suppliers and customers located in different geographical regions, to the growth of their use among consumers and to the cost of managing the movement of cash.
Likewise, the use of MPE is generally a necessary condition for the development of business models linked to online sales, which are increasingly widespread among companies. Finally, the fact that MSEs generate a digital footprint makes their use attractive by those M who want to improve their access to credit. However, the holding of accounts by EyO usually has a cost associated with it. This marks an important difference with PHs where the opening and maintenance of savings banks is free.
Figure A.1.1 | Businesses and organizations with accounts
Source | BCRA based on COELSA and INDEC.
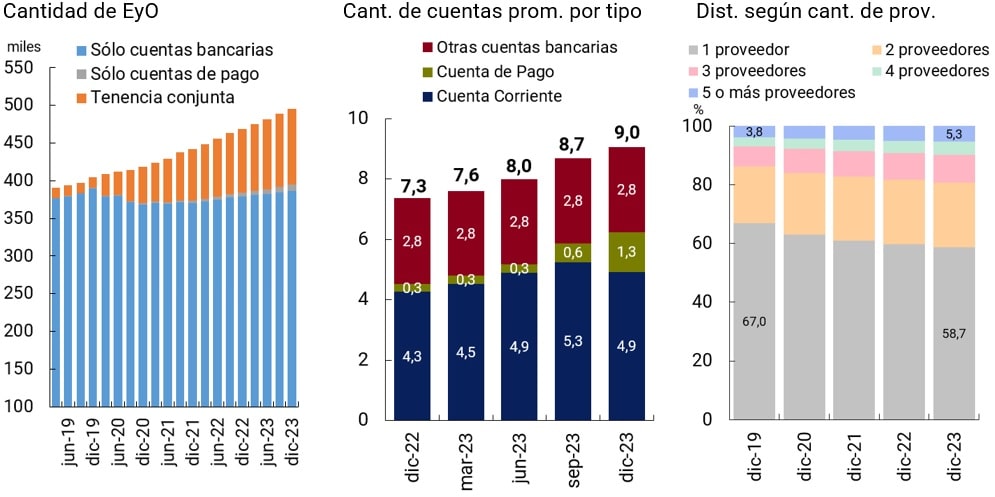
In recent years, the number of E with accounts continued to grow, which went from 391 thousand in March 2019 to 495.3 thousand in December 2023 (+27%). Both E with sole payment account holding and those with joint ownership (bank and payment) have grown steadily since then. Those with payment accounts went from 573 to almost 7,700, multiplying by a factor of 13 and those with joint tenure by a factor of 7. The number of E with exclusive bank account holdings did not grow uninterruptedly, although as of December 2023 it was 3% higher than in March 201973 .
Despite growing rapidly, the proportion of E who owned only payment accounts is still small, reaching just 1.5% of all E with accounts. The proportion of E with payment accounts (exclusive or not) reached 22% of the total compared to 98% with a bank account (exclusive or not).
The holding of payment accounts (exclusive or not) was concentrated, as of December 2023, in E, whose main activity was related to trade (38.3%), the manufacturing industry (15.2%) and the provision of certain services (22.2%)74. These activities, compared to March 2019, lost 9.3 p.p. of participation in the total, marking a diffusion of the use of payment accounts in the rest of the sectors of the economy. In March 2019, commerce accounted for 54.8% of the holding of payment accounts, compared to only 16.8% of the holding of all types of accounts.
The preponderance of commerce in the holding of payment accounts is in line with the expansion of these accounts among individuals, which went from representing 3.3% of the adult population in March 2019 to 66.3% in December 2023, and the wide spread of electronic means of payment (EMP). and, in particular, those provided by PSPs (see section on Electronic means of payment).
Finally, on average, each E with an account had about 9 accounts in December 2023, which represented an increase of 1.7 units compared to the previous year. This increase was due to the growth of 1 account in payment accounts and 0.7 accounts in current accounts, with no change in other bank accounts. Likewise, more than half of account E operated with a single account provider (EEFF or PSP) in December 2023, although the trend in recent years has been to hold accounts in more than one.
On the other hand, it should be noted that the average account tenure by E was double that of the average account tenure of individuals (4.5 accounts per adult. See Section 2. Account Access and Usage). This aspect could be associated with the need to use financing lines from different EEFFs, to have a wide range of EEFFs to choose the most convenient rates for the deduction of documents, to concentrate the payment of payroll or suppliers in certain EEFFs, among others.
Financing in the Expanded Financial System (SFA). The possibility of accessing credit in the SFA is relevant for the development of E insofar as it broadens the spectrum of financing available to them beyond their own funds, whether from accumulated profits or from capital injections75 . In general, access to financing allows EyO to fund fixed investments, hire and train personnel, develop and launch new products, overcome shocks or liquidity problems, among other issues that contribute to its viability and growth.
Figure A.1.2 | Amount of E funded in the SFA
Note | Graph on the right: “Other” includes companies and organizations that do not fit the definition of MSMEs, such as large companies or organizations that are not eligible for MSME certification because of their objective.
Source | BCRA based on COELSA and INDEC.
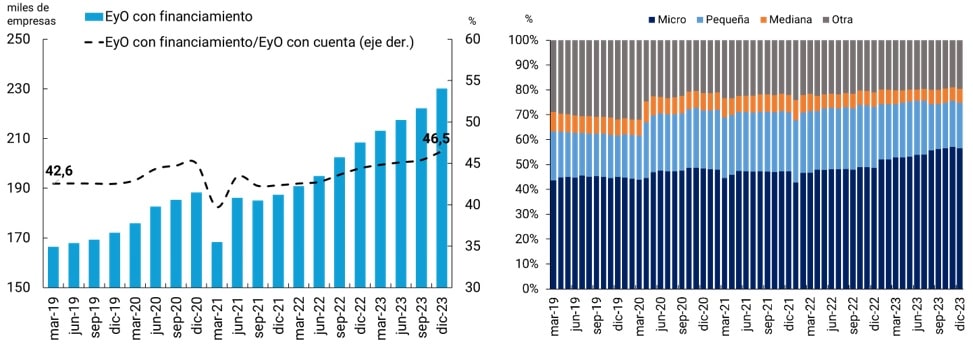
In December 2023, the amount of E financed in the SFA was 230,100, up 10.5% from December 2022, up 5.9% from June 2023 and 38% up from March 2019. In relation to the amount of E with an account, 46.5% had access to financing in the SFA as of December 2023, which represents an increase of 3.9 percentage points compared to March 2019.
Figure A.1.3 | Funding of E in the SFA
Note | “Working capital without credit card” includes advances, personal loans, documents and discounts on titles; “Secured loans” includes pledge and mortgage loans; “Advanced loans” includes foreign trade lines and negotiable obligations and financial trust titles.
Source | BCRA based on COELSA and INDEC.
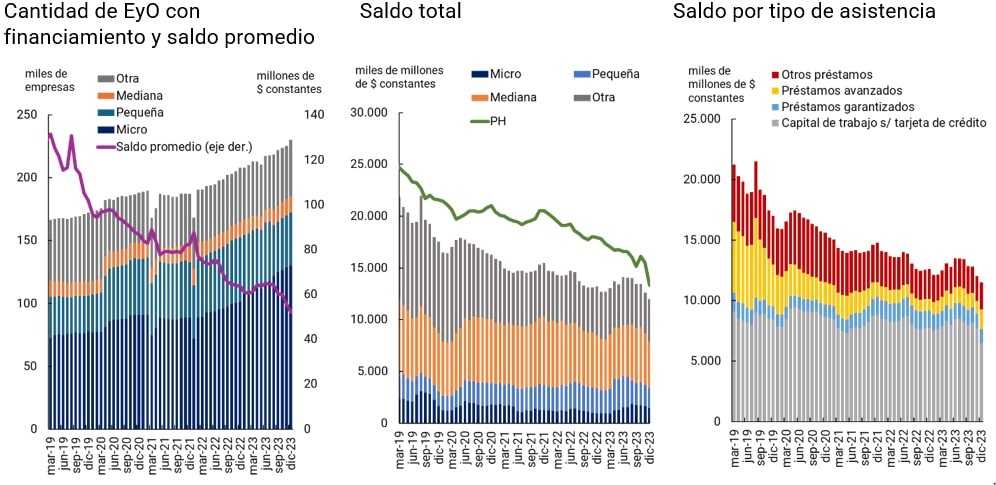
For its part, the financing balance reached 12 trillion pesos, a contraction of 9.3% in constant pesos against December 2022, 14.8% against June 2023 and 45% against March 2019. In this way, the E exhibited the same behavior as the PHs, a greater number of E (or PH) accessing the SFA, but a lower total balance and, as a consequence, a lower average balance per E (or PH). This drop in the total balance, together with the increase in the amount of E assisted, translates into a 60% contraction of the average balance per E, compared to March 2019.
Likewise, the historical evolution shows that the real balances for the set of MSMEs fell less than for the rest (those of large size or that did not have MSME certificates). Two factors could be associated with this phenomenon, on the one hand, the regulation that tended to direct a proportion of deposits, at regulated rates, towards MSMEs and, on the other hand, a macroeconomic context in which the rise in interest rates and the contraction of the level of activity operated to reduce the demand for credit from the M In the year-on-year comparison, credit balances fell in real terms for all E categories except for microenterprises, which saw it grow by 50.7%. In terms of participations, microenterprises only accounted for 12% of the balance (vs. 57% of the amounts), while small enterprises took 16%, medium-sized enterprises 37% and the rest 34% of it.
Regarding the balance by type of assistance, those related to working capital, excluding credit cards, accounted for 54% of the total balance in December 2023 and compared to March 2019, they experienced a 13 p.p. increase in their participation. This indicates that the share of shorter-term and lower-term financings grew, which is associated with the maintenance of the usual commercial line and away from capital goods and expansion financing plans.
From this first approach to the subject, it emerges that the number of E with accounts has increased in recent years, in particular payment accounts that are concentrated in the trade and service provision sectors. On the other hand, the proportion of M who had access to financing in the SFA remained limited. Average balances decreased and were concentrated in financing related to the day-to-day management of the business rather than in long-term expansion projects.
Section 2 / Main Guidelines of the Global Financial Inclusion Community
The topics of debate and work guidelines of international financial inclusion forums present a fundamental vision of the progress and challenges in this area. Over the past few years, the importance of access to finance for micro, small, and medium-sized enterprises (MSMEs), digital public infrastructure (DPI), and people’s financial well-being has been highlighted.
Although there are several global forums on the subject, the guide for exchange and consensus between countries is provided by the Global Partnership for Financial Inclusion (GPFI), the G20 platform that studies and promotes financial inclusion76. Argentina is a member of GPFI and actively participates through collaboration in the preparation of different documents such as guides, policy recommendations and reports. He has also led this forum in 2018 within the framework of the presidency of the G20. This section reviews the issues debated in the last 3 years77 and focuses on the challenges posed and conclusions reached and the state of affairs of Argentina in each of the issues.
During its presidency of the G20 in 2022, Indonesia established as one of its top priorities the improvement of financial inclusion for MSMEs. These companies constitute a fundamental pillar in the economy of any country, as they represent the majority of companies worldwide and play a crucial role in job creation and global economic development. However, restrictions on access to credit, among other limitations, still represent a challenge for the growth of these companies. Advances in digitalization offer opportunities to improve MSMEs’ access to financial services.
Indonesia’s presidency developed guidance for regulators to maximize the benefits of digitalization responsibly and promote the economic potential of MSMEs, among other vulnerable groups78. As a first point, a database of “digital and innovative financial products and services for MSMEs beyond credit” was developed, which compiles and presents good practices that can be useful examples for all countries79 . In addition, the guide highlights several lessons learned that should be prioritized when designing products and services: (a) ease of use, (b) consumer data protection, complemented by (c) financial education, and (d) supportive financial regulation. The guide also comprises a set of regulatory tools that offer solutions to address the limitations of MSMEs in accessing digital financial services. It also highlights the importance of having harmonized information on MSMEs and conducts a survey of available databases or surveys that contain data on access to financing for MSMEs that can be used to build indicators of financial inclusion of these companies.
In Argentina, the Electronic Credit Invoice (FCEM) and the Central Bank of Debtors of the Financial System (CENDEU) are examples of some of the initiatives listed above. The FCEM facilitates the financing of MSMEs based on the negotiation of the invoice in the capital market or the interbank system80 . CENDEU is a database of current and historical debts of each debtor (including MSMEs) that allows the identification of the financing balance and state of the debtsituation 81.
During its presidency of the G20 in 2023, India identified the priority of leveraging digital public infrastructure (DPI) for financial inclusion. Conceptually, IPDs rely on the use of technology to build interoperable, open, and inclusive systems that serve to provide public and private services essential to the common good. IPD, the content of which may vary depending on the country context, generally covers aspects such as digital identification, digital payments and data sharing in the financial sector and plays a critical role in accelerating the digital transformation of financial services.
The policy recommendations developed by the Indian presidency reflect good practices and aim to help policymakers support the development and operation of IPD in accordance with national contexts82: (a) enable and encourage the responsible use of IPD to accelerate financial inclusion, (b) develop well-designed IPD through a set of widely accepted good practices, (c) encourage appropriate risk-based regulatory and supervisory arrangements for the use of IPD in the financial sector, (d) promote sound internal governance arrangements, (e) allow IPD to offer products and services in a manner that leaves no one behind and consumer interests are preserved.
In our country, the digital identityframework83 and the Payment by Transfer (PCT)84 scheme show the potential of IPDs.
During its presidency of the G20 in 2024, Brazil recognizes that while there is still a need to advance policies to improve access to and use of financial services, improving the quality of financial inclusion is also a priority to strengthen the financial well-being of individuals and households, which will help meet the Sustainable Development Goals85 . In this sense, he proposed focusing his work on the topic of people’s financial well-being86 . The objective is to advance in the construction of a harmonized definition and develop tools that allow its measurement, identifying the indicators that are appropriate to the specific needs of each country and for international comparison.
In a previous section of the Financial Inclusion Report, the concept of financial health was addressed and the relevance of having this measurement for policy decisions and initiatives by the private sectorwas mentioned 87. In a later edition, an exercise was carried out to evaluate the financial capacity and health indices of the participants in the financial education programs dictated by the BCRA88 . In this section, certain metrics of well-being or financial health of the Argentine population, and of other groups of comparable countries, are presented to begin to understand this phenomenon, in line with its positioning in the global agenda. Measuring financial health is complex given that the collection of data for its measurement is carried out through surveys (and not supply data, generally provided by regulatory bodies).
In the absence of national surveys, indicators from the Global Findex89 are taken. This global survey revealed specific elements of financial well-being such as the possibility of accessing90 funds in an emergency and the origin of these funds, among others91. In Argentina, 85% of adults said they would be able to access some type of emergency funding source within 30 days, including savings, formal financing, money from family or friends, income related to work or the sale of assets. However, 1 in 3 adults (33%) said they would find it very difficult. Just over half of the adult population (52%) said they could have the funds without major difficulties within a month. In Latin America and the Caribbean, on average, the responses were similar, while with respect to the set of countries with the same income level as Argentina, there are notable differences to the detriment of our country.
Strategies for dealing with an emergency vary in terms of the availability of funds. Increasing working hours in a recessionary context may be unfeasible, while relying on family or friends during a systemic shock that causes widespread economic damage, such as the recent pandemic, can affect those people’s ability to help. In contrast, savings are considered the most reliable source of funds in case of emergency. In Argentina, the most mentioned option to obtain funds in an emergency is to go to family or friends, followed to a lesser extent by working overtime and applying for a loan. The high dependence on family or friends reflects a similar trend in the region, although to a lesser degree. Only 1 in 10 adults in Argentina indicated that they would use their savings in the event of an emergency, reflecting a low level of availability of this source, similar to that observed in the region but lower than that recorded in other jurisdictions with similar incomes.
Figure A.2.1 | Level of access to funds in an emergency: percentage of adults92
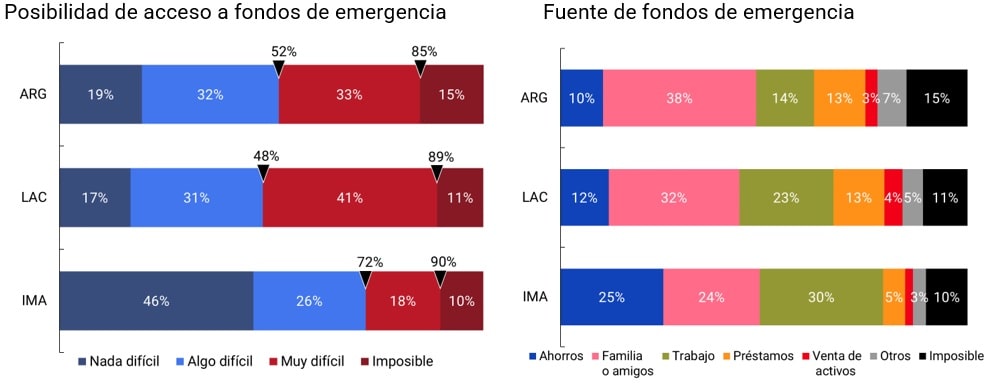
Note | ARG: Argentina. LAC: Latin America and the Caribbean. AMIs: Upper-middle-income countries. In the case of Argentina, the sample, which was conducted by telephone (fixed and mobile telephony), included 1,003 interviews and recorded a design effect equal to 2.51 and a margin of error equivalent to 4.993 .
Source | World Bank (Global Findex).
The X-ray of Argentina’s financial well-being shows that a third of the population would have difficulty accessing emergency funds and 15% would consider it impossible. Most would not resort to savings and would depend on the help of a family member. This fragility highlights the need for transformations where the financial system can play an important role.
Methodological note
Population data
This IIF presents indicators that are disaggregated by different demographic and geographical variables. As of the date of publication of this edition, the final results of the 2022 National Census of Population, Households and Housing (CNPHV) have not been disseminated, so population data based on the 2010 CNPHV were used.
Given that the National Institute of Statistics and Census of the Argentine Republic (INDEC) does not publish a series that simultaneously contains all the disaggregations used throughout this IIF (gender, age group and geographical location at the provincial, departmental and locality levels), it was necessary to take different series according to the definition of each indicator:
– For the indicators at the national and provincial levels, the series entitled “Population by sex and five-year age groups for the country and provinces as a whole. Years 2010-2040”;
– For the departmental indicators, the series “Estimated population on 1 July of each calendar year by sex, by department” was used;
– finally, given that INDEC does not publish a projection of the evolution over time of the number of inhabitants of each locality, it was necessary to construct the series for the indicators at that level, for which the results of the CNPHV of 2010 were used.
Considering that there are differences between the provisional results of the CNPHV 2022 and those of 2010, the indicators developed in this IIF in relation to the adult population should be taken as provisional until updated information from the last census is available.
Finally, for the purposes of this IIF, an “adult” is considered to be a person 15 years of age or older, following the standard used by the World Bank for its financial inclusion indicators.
Regionalization
For the purpose of developing regional indicators, the regionalization criterion proposed by the Ministry of Economy and Public Finance (now the Ministry of Economy) was used, which establishes five regions:
– NOA (Northwest Argentina): Salta, Jujuy, Tucumán, Catamarca and Santiago del Estero.
– NEA (Northeast Argentina): Formosa, Chaco, Misiones and Corrientes.
– Nuevo Cuyo: Mendoza, San Juan, San Luis and La Rioja.
– Patagonia: La Pampa, Neuquén, Río Negro, Chubut, Santa Cruz and Tierra del Fuego.
– Centro and Buenos Aires: Córdoba, Santa Fe, Entre Ríos, Buenos Aires and the Autonomous City of Buenos Aires.
In the text of this IIF, Nuevo Cuyo is mentioned as Cuyo and Center and Buenos Aires as Center.
Payment accounts at payment service providers
Among the Payment Service Providers (PSPs) that operate in COELSA, there are providers that are registered in the BCRA’s Registry of Payment Service Providers (PSPs) and other providers that are not registered94. For the purposes of this report, only payment accounts for vendors that are registered as PSPs that offer payment accounts are counted.
Account activity
The “Activity” series comes from COELSA and indicates whether account holders registered debits or credits in their bank and/or payment accounts throughout a quarter. If a person makes transactions from different accounts, either from the same entity or from different entities, it is posted only once.
The series makes it possible to distinguish whether the movement of funds is the result of a debit and/or credit and includes debits and credits made through immediate transfers, payments with online transfers, transactions with checks, direct debits, DEBIN and batch (deferred) transfers, to the extent that they are settled and cleared by COELSA.
Given that the “Activity” series considers the subset of operations in which COELSA is involved, the activity indicators are underestimated. In particular, the indicator does not capture those account holders who operate with a debit card and do not make transfers to or from payment accounts, cash withdrawals, among others. Another aspect of the indicator is that debit transactions are, in general, initiated by the PH account holder itself, while credit transactions are originated by a third party (PH or PJ). This distinction has different considerations in terms of financial inclusion, given that in the first case it is an active operation of the PH.
MSME Business Credit
The MSME criterion proposed by the Secretariat of Industry and Productive Development of the Ministry of Economy95 was used, in which an MSME is a micro, small or medium-sized enterprise, whose economic activity in the country is grouped in one of these sectors: services, commercial, industrial, agricultural, construction or mining. The size of the MSME is determined based on the economic activity and the amount of total annual sales. When the BCRA regulations so provide, the EEFF report in the Central Bank of Debtors of the Financial System (CENDEU) the field “código_pyme“96 , which is composed of 2 digits, one indicating the size and the other the economic sector. Given that there are cases where the same company has different “código_pyme” assigned for the same period, the “código_pyme” corresponding to the credit assistance with the highest balance in each of the periods studied was used. There is a possibility that the first balance is identical to the second, in this case the highest possible “codigo_pyme” is taken. For the assignment of the province to MSME companies, the tax domicile declared in the AFIP Registry was used.
Balances of savings and investment products of individuals (PH)
The savings and investment balances of the (PH) are classified as follows:
Uninvested balances: include: (i) balances in current accounts and savings accounts denominated in local and foreign currency; and (ii) balances in payment accounts.
Invested balances: include: (i) fixed-term balances in pesos and foreign currency; (ii) product balances in UVA; (iii) value of the net worth (PN) of the Mutual Funds (CDFs) subscribed by PH (estimate); and (iv) value of the NP of other Mutual Funds (Other FCIs) subscribed by PH (estimate). The latter include fixed income funds (bonds), equities (shares), mixed income, structured funds, among others97 .
To estimate the PN of the DCFs subscribed by PH, the sum of (i) the DCFs exclusive to PH was calculated and, (ii) for those DCFs that may be made up of both PH and PJ in EEFF, the PH was estimated on the basis of weights. The weights were obtained through the calculation of the share of the PH FCIs in the Total FCIs (PH+PJ). Exclusivity was consulted through a survey of the websites and management regulations of the DCFs. On the other hand, to estimate the NP of the other CRFs, the difference between the NP value of the FCIs subscribed by PH (using information published by CAFCI and CNV) and the PN value of the DCF subscribed by PH was calculated.
Account and fixed-term balances in foreign currency
To obtain the balances in pesos of the accounts and fixed terms in foreign currency, the Reference Exchange Rate series is used, which is published daily on the BCRA website in accordance with the methodology established in regulation98.
Number of PH holders of fixed terms and percentage of account holders with fixed terms.
The Supervisory Information Regime compiles, on a quarterly basis, the number of fixed-term holders per financial institution (FI), but not at the aggregate level (i.e., they are not sole holders). These holders include individuals and companies. For this reason, the PH holders of fixed terms for each FI were estimated. To this end, the number of fixed-term holders was multiplied by the ratio between the number of fixed-term PH certificates with respect to the total number of certificates, both in pesos and in foreign currency, for each EF99 . Then, the estimated amounts for each FI were added and the estimate for the total financial system was obtained, which, as previously mentioned, may contain duplications to the extent that the PHs have fixed terms in more than one FI.
Real interest rate on fixed terms100
For the calculation of the real monthly interest rate, the following formula was applied:
r = [(1+i) / (1+p)] -1
Where: i is the nominal monthly interest rate; p is the inflation rate obtained through the monthly variation of the CPI and r is the real monthly interest rate.
Glossary
ACSF Complementary Financial Services Agency
AFIP Federal Administration of Public Revenues
ANDE Uruguay’s National Development Agency
ARG Argentina
ATM ATM
BCRA Central Bank of the Argentine Republic
BIS Bank for International Settlements
BP Payment Button
CABA Autonomous City of Buenos Aires
YOU FALL Argentine Chamber of Extrabank Tax and Services Collection Companies
CAFCI Argentine Chamber of Mutual Funds
CBU Uniform Bank Code
CENDEU Central Bank of Debtors of the Financial System
CNBV National Banking and Securities Commission of Mexico
CNE National Economic Census
CNPHV National Census of Population, Households and Housing
NVC National Securities Commission
COELSA Electronic Clearing House
CVU Uniform virtual key
DEBIN Immediate debit
Der Law
EEFF Financial Institutions
EF Financial Institution
ENACOM National Communications Entity
EPH Permanent Household Survey
ETCNB Non-Bank Credit Card Issuers
E Companies and organizations
FAS Financial Access Survey
CDF Direct Pool Fund
FCD-PH Pool of Money of Human Persons
FCEM Electronic Credit Invoices for MSMEs
FCI Mutual Fund
IMF International Monetary Fund
GPFI Global Partnership for Financial Inclusion
HB Home banking
year-on-year i.a
IIF Financial Inclusion Report
IMA Upper-middle-income countries
INDEC National Institute of Statistics and Censuses
INEGI National Institute of Statistics and Geography of Mexico
CPI Consumer Price Index
IPD Digital public infrastructure
LAC Latin America and the Caribbean
LFIP Financing Line for Productive Investment
M Miles
MB Mobile Banking
Billion Millions
MINCIT Ministry of Commerce, Industry and Tourism of Colombia
MSMEs Micro, Small and Medium Enterprises.
MPE Electronic Payment Methods
MPOS Mobile Device at Point of Sale
MTESS Ministry of Labour, Employment and Social Security
NEA Northeast Argentina
NOA Northwest Argentina
OECD Organization for Economic Co-operation and Development
OPNFC Other Non-Financial Credit Providers
PCT Transfer payments
PDA Access Points
FAQ Fixed Term
PH Human Person
GDP Gross Domestic Product
PJ Legal Entity
PN Net Worth
PNFC Non-Financial Credit Providers
POS Point of Sale Device
p.p Percentage points
PSP Payment Service Providers
QR Quick Response code
Shadow Fiend Financial system
SFA Expanded Financial System
CIDER Brazil’s IBGE Automatic Recovery System
YES Chilean Internal Revenue Service
SIPA Argentine Integrated Pension System
NFPS Non-financial private sector
SUC Branch
TAS Self-service terminal
TD Debit Card
TNA Annual Nominal Rate
TVI Year-on-year rate of change
UVA Purchasing Value Units
References
2 The BCRA’s Charter establishes that “the purpose of the bank is to promote, (…) economic development with social equity”. It provides that the BCRA may regulate payment systems and that the Board of Directors has powers to: (i) authorize the opening of branches and other types of dependencies, tending to expand the geographical coverage of the financial system and serve less developed areas, as well as promoting universal access for users of financial services, (ii) to regulate credit policy in order to guide its destiny, (iii) to establish differentiated policies aimed at small and medium-sized enterprises and regional economies, and (iv) to carry out research and promote financial education and activities on topics of interest related to the purpose assigned to it by this Organic Charter. These objectives and competencies are contained within the concept of financial inclusion.
3 The percentage variations correspond to the Activity Level Progress Report. Fourth quarter of 2023 (INDEC).
4 The percentage variations arise from the average of year-on-year variations of the Wage Index deflated by the CPI, both published by INDEC.
6 According to CAECEIS, there are 25,000 service points. As of December 2023, ACSFs belonging to four of the nine members of CAECEIS were identified.
7 See Financial Inclusion Report, first half of 2023 and Financial Inclusion Report, second half of 2022.
8 Point 1.7.2. T.O. Savings, salary and special account deposits.
9 T.O. Expansion of financial institutions.
10 Financial Inclusion Report, Opportunity Banking and Annual Overview of Financial Inclusion, CNBV.
11 The number of POS may be underestimated since there is no data for all suppliers.
12 Financial Inclusion Report, second half of 2020.
13 Given that as of the date of this publication, data by age group from the 2022 National Census of Population, Households and Housing (INDEC) are not available, work continues with the projections of the 2010 Census. The indicators developed in this IIF in relation to the adult population should be taken as provisional until updated information from the last census is available. In this sense, the percentage of the adult population with an account shows a value of 101.7% in December 2023.
14 Opening refers to the net opening (or net increase) in the number of accounts (bank or payment), which arises from the difference between the number of new accounts that were opened and the number of accounts that were closed.
15 In addition, the exclusive possibility of opening savings accounts in foreign currency in financial institutions would contribute to increasing the number of bank accounts per adult. In fact, the share of bank accounts in foreign currency has risen to 20%. In Argentina, a crucial aspect is the existence of bi-monetary savings banks, which allow operations in both pesos and foreign currency. This type of account provides holders with the ability to transact in various currencies and additional options for saving and investing.
16 This metric measures the proportion of account holders who registered at least one transaction in one of their accounts throughout the quarter.
17 To approximate the degree of use of the accounts, new data provided by COELSA were used to indicate whether account holders registered debits or credits in any of their bank and/or payment accounts throughout a quarter. Since this indicator considers the subset of operations in which COELSA is involved, the activity metrics are underestimated. In particular, the indicator does not capture those account holders who operate with a debit card and do not make transfers to or from payment accounts, among others. Another aspect of the indicator is that debit transactions are, in general, initiated by the PH account holder itself, while credit transactions are originated by a third party (PH or PJ). This distinction has different considerations in terms of financial inclusion, given that in the first case it is an active operation of the PH. For more details on the transactions settled and cleared by COELSA, see Methodological Note.
18 The correlation coefficient between joint tenure and the level of activity in the provinces was 0.88.
21 See General Resolution 977/2023. National Securities Commission.
22 UNESCO, Institute for Information Technologies in Education. Digital Natives: How do they learn? How to teach them?.
23 Fee assigned to the issuing bank of the card used for payment.
24 Acceptors are companies that offer businesses the tools to collect with electronic means of payment.
25 See T.O. of Payment Service Providers for its definition.
26 Research shows that cash is used especially for low-value purchases. (CPMI 2024, “Tap, click and pay: how digital payments seize the day”).
27 The values (quantities and amounts) of the transactions are expressed per adult to enable comparison between countries. These types of metrics are used by other countries and international organizations.
28 The ratios arise from dividing the amounts sent through electronic means of payment (MPE) during the fourth quarter of 2023 and 2022 (annualized), respectively, by GDP at current values for the same period.
29 This behaviour is also reflected in the payment methods in supermarkets. The year 2023 saw the largest drop in percentage points in the proportion of amounts paid in cash, standing at 25% of total sales from 29% in 2022. On the other hand, payments with debit cards (from 30% to 32%) and payments by other means (from 4% to 6%), which include QR codes, gained ground.
30 The amounts in this section are expressed at constant December 2023 prices (CPI December 2023 = 100).
31 The greater availability of innovations in the payment system, such as QR codes (dynamic and static), contactless cards and mobile devices with NFC (Near Field Communication) technology, would enhance this trend.
32 IMF “Measurement and Use of Cash by Half the World’s Population”, 2023.
33 MPE per adult grew by 283% between 2017 and 2023 compared to the average remuneration of the registered private sector. Cash withdrawals fell by 34% compared to the same variable in the aforementioned period. Source: BCRA, Ministry of Human Capital, Ministry of Labor, Employment and Social Security (SIPA), networks.
34 It should be clarified that these operations include movements of money that do not necessarily imply a payment. Based on the available data, it is not feasible to discriminate between remittances that do not constitute payments and those that do.
35Interoperable PCTs can be initiated through a QR code, at POS with debit card credentials, with random keys and with a payment button/link.
37 Proxy of debit card holders.
38 Source: Information from Financial Institutions.
40The amounts mentioned in this section are expressed at constant December 2023 prices (CPI Dec-23 = 100). The savings and investment balances of the PHs consider products in local and foreign currency.
41 Also included are mutual funds offered outside the ESFFs and PSPs.
42 Throughout this section, “savings” and “investment” refers to the balance of certain products offered by the BSEs and PSPs.
43 On average, the Latin American region has registered an increase of 3.3 percentage points between 2019 and 2023.
44 Trillion is millions of millions.
45 New framework for monetary and exchange rate policy.
46 Communication A 7862 and Communication A 7922.
47 The Reference Exchange Rate series is published daily on the BCRA website (Communication A 3500).
48 This increase is attributed to the year-on-year variation of the exchange rate, which exceeded that of the price level (356% vs. 211.4%).
49 The number of PHs holding fixed terms is an estimate and the calculation does not yield single holders, since holders may have fixed terms in more than one EF. See the explanation of the estimation method in the Methodological Note.
50 See activity indicators within the Accounts Section of this IIF.
51 The SFA comprises financial institutions (EFSAs) and non-financial credit providers (NFCPs). Throughout the section, the metrics consolidate unique debtors within the vendor group that they base. Duplication caused by multiple funding lines within the same provider and by funding across different providers in the same analysis group is eliminated.
52 The amounts in this section are expressed at constant December 2023 prices (CPI December 2023 = 100).
53 Credit providers are grouped into two large groups with differentiated characteristics: the BSE and the NFCPs. Among other factors, they are differentiated by the types of products offered, the documentation requirements, the cost and amount of financing, the way of managing credit (face-to-face or digitally) and business models. Both sets are under the regulatory orbit of the BCRA.
54 This link is commonly highlighted in the literature on financial inclusion (see, for example, World Bank).
55 On the basis of the data available to date, it is not possible to determine whether the debt covered by the FF originated in the EEFF or in PNFC. For this reason, the information of the debtors who only registered debt in FF as “Remainder” is presented and the debtors who registered debt in FF and EEFF to “EEFF Only”, those who registered debt in FF and PNFC to “PNFC Only” and those who registered debt in FF, EEFF and PNFC to “EEFF and PNFC” are added.
56 See Report on Non-Financial Credit Providers for more details.
57 IIF first semester of 2021 and second semester of 2021.
58 See characteristics of IIF debtors first half of 2023.
59 MSME Finance Gap 2017, SME Finance Forum. The methodology for its calculation can be found on the SME Finance Forum website.
60 MSME Registration. Secretariat of Industry and Productive Development, Ministry of Economy.
61 MSME Registry, Ministry of Productive Development.
62 The theoretical maximum turnover for each size and sector of MSMEs is calculated based on the current turnover ceilings established by the Undersecretariat of Small and Medium-sized Enterprises of the Ministry of Economy.
63 The expiration The LFIP operated on 31.03.24. As of April 2024, the “Minimum MSME Quota” came into force, a new regulatory scheme of incentives for financing MSMEs based on the reduction of reserve requirements.
64 Includes the balance granted to non-MSMEs within the framework of the LFIP.
65 The minimum cash requirements are around 30%, so that for every $100 pesos of deposits, $70 can be loaned, of which $7.5 must be allocated to MSMEs. The effective allocation, then, is around 10.7%.
66 The drop in the number of companies between the end of quota 2 (September 2021) and the beginning of quota 3 (October 2021) was concentrated in micro and small companies, both PH and PJ. In this period, a period of relaxation of social distancing measures began and, therefore, economic activity began to normalize. This factor could have influenced the decision not to renew the financing.
67 The companies included in this section must be considered to have fulfilled the administrative requirements to obtain the MSME certificate, which accounts for a certain level of formality.
68 Employee, in this case, refers to a person who receives his or her assets in a bank account.
69 Companies are understood to be for-profit legal persons and organizations are non-profit legal persons.
70 Nongovernmental Organizations and the World Bank. World Bank, 1991.
71 The group of legal persons whose legal form could not be determined was excluded from the analysis. The share of this group in the total does not exceed 5%.
72 Safety and efficiency are often bigger concerns for E than for PH since they have to operate, on average, with higher balances of money.
73 It should be noted that, unlike PH bank accounts, PJ bank accounts have a cost associated with them. Therefore, keeping them open if they are not used (for example, due to company closure) does not make economic sense.
74 Food and accommodation services (9.6%, mainly concentrated in food services), association and personal services (8.2%) and information and communication services (4.4%).
75 A similar role can be fulfilled by the capital market.
76 Global Partnership for Financial Inclusion.
77 They correspond to the priorities of the G20 presidencies of Indonesia, India and Brazil.
78 G20 Yogyakarta framework. G20 Financial Inclusion Framework in Harnessing Digitalization to Increase Productivity, Sustainable, and Inclusive Economy of Women, Youth and MSMEs.
80 Regulation of Electronic Credit Invoices and National Payment System – Checks and other clearable instruments.
81 Debtors’ Central: frequently asked questions.
82 G20 Policy recommendations for advancing financial inclusion and productivity gains through digital public infrastructure.
83 Digital Identity System (SID).
84 Keys to the new standard: Transfers 3.0 | Questions and Answers.
85 Sustainable Development Goals.
86 Considering it a synonym for financial health.
87 Financial Inclusion Report. Second half of 2020. Section 3 / What is financial health and why should it be taken into account?
88 Financial Inclusion Report. Second half of 2021. Section 3 / Education, a key investment to take care of financial health.
89 Demirgüç-, Asli, Leora Klapper, Dorothe Singer, Saniya Ansar. 2022. The Global Findex Database 2021: Financial Inclusion, Digital Payments, and Resilience in the Age of COVID-19. Washington, DC: World Bank.
90 Amount equivalent to 5% of the gross national income per capita in local currency.
91 Nationally representative surveys conducted by the World Bank during 2021/22 were implemented at the global level with the participation of 123 countries and some 125,000 people.
92 The questionnaire includes among the possible answers: “does not know” and “does not answer”. However, the database does not show the percentages of these responses, which is why they have not been included.
93 Appendix A – Survey Methodology, World Bank.
94 TO Payment Service Providers.
96 Determination of the conditions of MSMEs. Point 1, BCRA.
97 See Glossary, CAFCI.
99 Information Regime for Supervision. Codes 999705, 999706, 889901 and 889902 – Number of forward transactions.
100 Nominal interest rate and real interest rate.
Share on


