Executive summary
• As of June 2025, financial services access points (PDAs) amounted to 51,760, with a growth of 0.5% compared to December 2024. 46.3% of localities and 94.2% of adults had coverage of at least one FLW, with levels remaining practically stable since December 2022.
• The population continued to consolidate the trend towards joint access to bank and payment accounts, which reached 26.9 million people as of June 2025, with a net increase of 1.4 million since December 2024. Likewise, the holding of bank accounts in foreign currency expanded to reach 21 million people, incorporating 2.1 million new holders in the period.
• The use of electronic means of payment contracted in the first half of 2025, compared to the second half of 2024. On the other hand, cash use indicators remained at their lowest levels in recent years. Operations with immediate payments, transfers and Transfer Payments stabilized in the first half of the year but continue to be the main mechanisms of electronic payments. For its part, the number of debit card payments decreased in the semester. Likewise, there was an increase in account holders who made electronic payments. At the end of the semester, 75.5% of account holders made electronic payments, which is equivalent to 28.3 million people, 1 million more than 6 months ago.
• The Mutual Funds (CDFs) have established themselves as the most dynamic savings instrument in pesos among individuals. In June 2025, payment accounts with a balance in DCFs reached €26 million, with a year-on-year growth of close to 40%. In contrast, fixed terms reached only 2.8% of bank account holders, although the average balance per holder showed an improvement in the last 12 months, representing the savings product with the highest average amount per holder.
• The expansion of credit to individuals continued to be marked by the sustained incorporation of new debtors and a growing use of financing. As of June 2025, 19.5 million people registered credit in the extended financial system (SFA), which represented a net increase of 1 million debtors compared to December 2024. In addition, the average balance per debtor grew by 19% in real terms, reaching its highest level in the last five years.
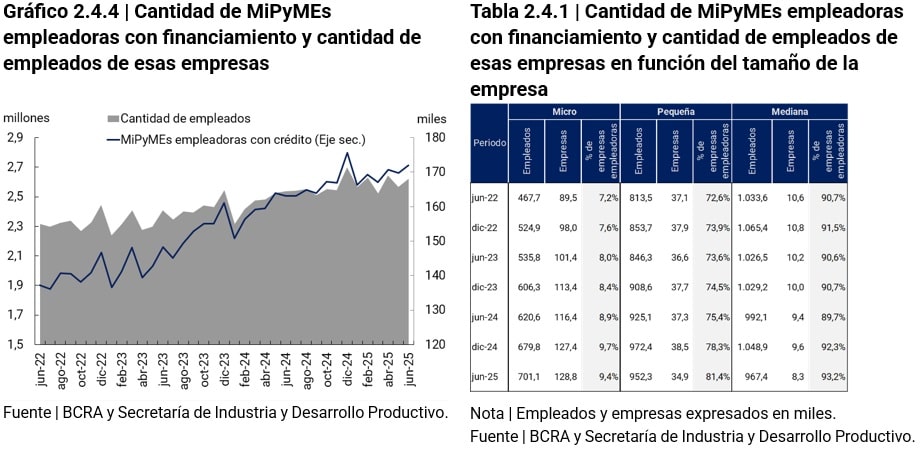
• In the first half of 2025, the proportion of MSMEs with financing registered a slight increase compared to December 2024 levels, reaching 73.4% of MSMEs with a certificate at the end of the semester. In that period, some 161,000 companies joined the credit market, while financing balances grew by 19%, with microenterprises registering the highest expansion rates.
Indicator Table | Financial inclusion in Argentina
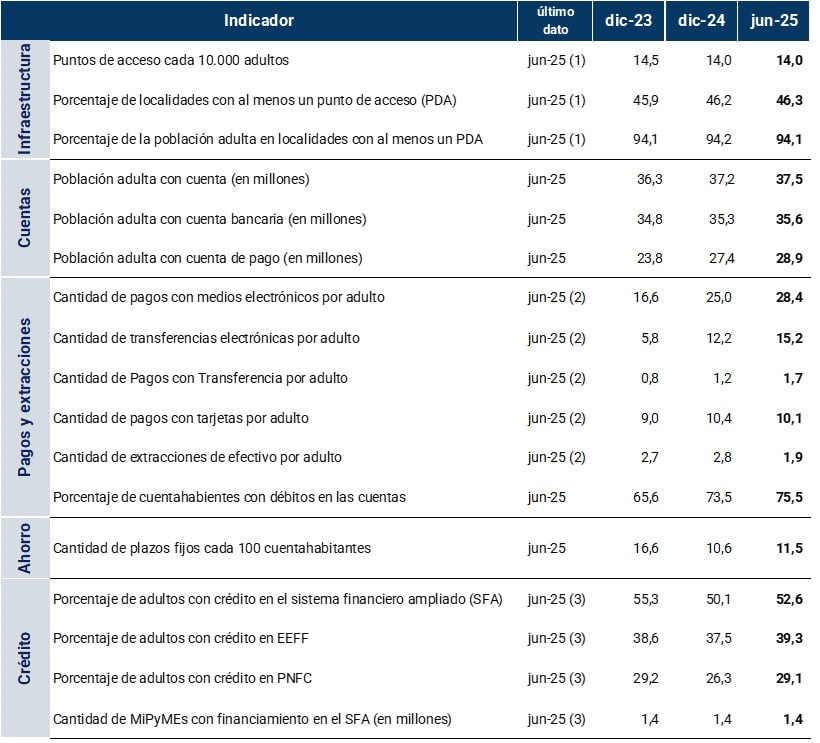
(1) This includes access points for financial institutions (branches, mobile branches, ATMs, self-service terminals and complementary financial services agencies) and ATMs operated by non-financial institutions.
(2) Monthly average for the first half of each year.
(3) As of July 2024, financial institutions and other reporters began to report to the BCRA’s Debtors’ Central Bank people with a debt balance of $25 thousand, instead of $1 thousand as was the case until June 2024 (Communication A 8001). Consequently, a fall is observed in the column corresponding to the year 2024.
Introduction
Financial inclusion refers to the access and use by individuals and businesses of various useful and affordable financial products and services that meet their needs (transactions, payments, savings, credit, and insurance) and that are provided responsibly and sustainably. This report aims to measure financial inclusion in the country, as well as to highlight the different elements that influence this process. Technological changes, the regulatory framework, the emergence of new financial service providers or new segments of users cause changes in the ways of making payments, saving and in the age at which people begin to use financial services, among other aspects.
Argentina continued to make progress in financial inclusion during the first half of 2025. The expansion in account holding, the greater adoption of electronic payments, and the incorporation of new users into savings and investment products reflect sustained progress in the integration of the population into formal financial services.
In a framework of full coverage of the adult population with deposit accounts, there was a deepening of the joint holding of bank and payment accounts and, on the other hand, the growth in the number of people with accounts in foreign currency. In terms of the physical infrastructure for the attention of account holders, the access points (PDAs) to financial services registered a slight increase compared to last December, maintaining practically unchanged the coverage of localities and the number of PDAs per 10,000 adults.
The expansion of electronic payments was supported by the use of electronic wallets, the growing acceptance of payments by merchants and the lower or no fees of some instruments, such as transfer payments (PCT). This reduced the use of cash and consolidated transfers as the dominant instrument in terms of quantity and amount of operations, displacing debit cards.
In terms of savings, the Mutual Funds (CDFs), by virtue of their ease of access through payment accounts, have established themselves as the main savings instrument of the population. On the other hand, the formal credit market continued with the net incorporation of debtors, driven mainly by non-financial credit providers (NFCPs), and with a greater intensity in the use of financing, which is reflected in the increase in the average balance per debtor and in the fact that a significant portion of debtors increased their credit balance in real terms.
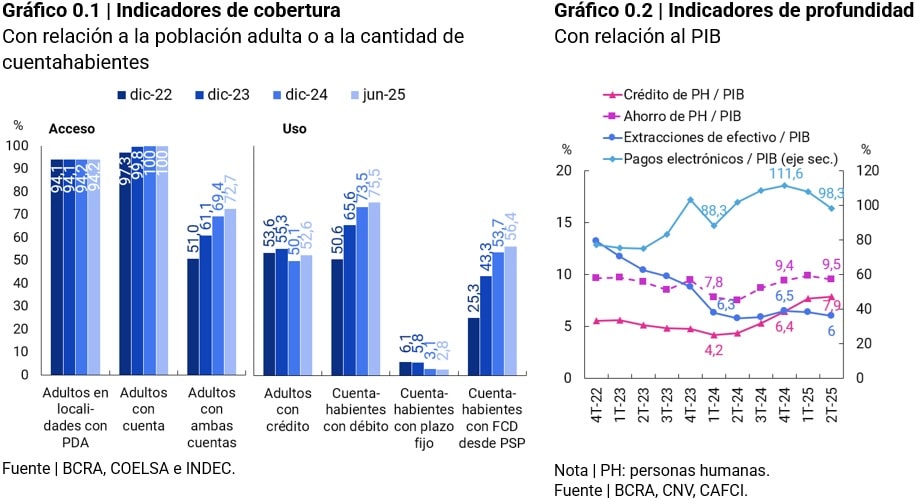
The balance of savings and investment products and credit products for individuals (PH) as a proportion of gross domestic product (GDP) increased both compared to the last quarter of 2024 and compared to the same period of the previous year. However, despite the expansion of coverage in the population in relation to these variables, their depth in relation to the GDP of the economy remained relatively low.
This dynamic occurred in a context where the levels of economic activity and private consumption in the first half of the year remained above the values of the previous year. Labor market indicators showed mixed signs; On the one hand, some weakness was observed in the dynamics of job creation, while, on the other hand, improvements were recorded in real incomes.
The employed population was below the levels of December 2024, a trend recorded by both public and private sector employees. On the other hand, in June 2025, real wages accumulated an increase of 5% compared to December 2024, highlighting the improvement in those in the unregistered sector.
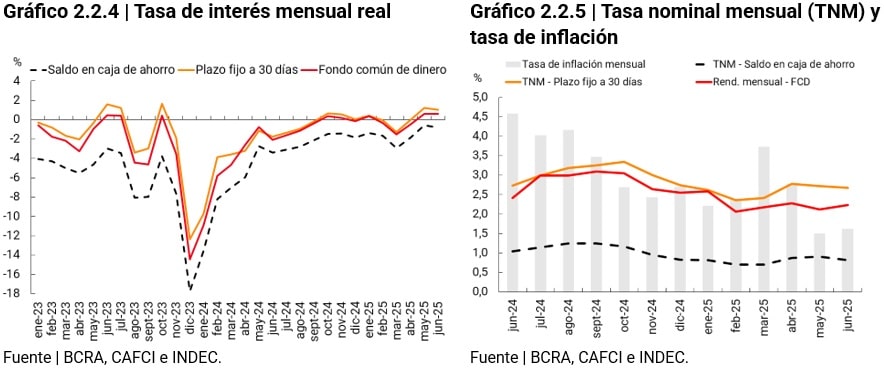
The dynamics of passive and active interest rates showed opposite behaviors during the semester under analysis. While the interest rate on 30-day fixed terms registered a marginal decline, the interest rate on personal loans increased slightly. In a context of slowing inflation, the real interest rate on fixed-term loans remained in slightly positive territory. In turn, the real monthly interest rate on personal loans also remained positive, with values ranging between 2% and 4.4%, reaching the highs recorded in the last two years.
In terms of regulation with an impact on financial inclusion, national authorities adopted various measures to expand access to and use of financial services. Among them, the creation of the Open Finance System (“open finance”) stands out, which seeks to promote greater competition, financial inclusion and the development of credit. Under this scheme, individuals and legal entities that grant their express consent may share the economic-financial information available in public sector organizations and/or in entities registered with the Central Bank of the Argentine Republic (BCRA) with other entities that they consider relevant. As for credit, the BCRA once again enabled the opening of current accounts in US dollars, on which only electronic checks (ECHEQ) may be issued. This measure, in line with the policy of promoting currency competition, seeks to expand the offer of products of financial institutions (EEFF) and a greater use of people’s foreign currency assets.
At the international level, different organizations are making efforts to measure financial inclusion, standardize statistics so that they are comparable between countries, and analyze their results. The G20 Data Gaps Initiative, among other objectives, aims to collect data on different variables linked to digital financial services for which there is no information in many countries around the world. On the other hand, the World Bank publishes the results of the Global Findex survey every three years, which measures different dimensions of financial inclusion in countries.
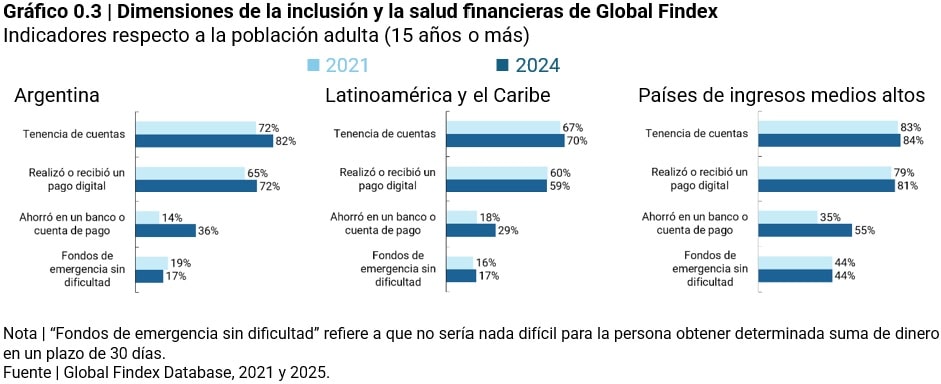
The results of the new edition of Global Findex 2025 revealed an increase in access and use of accounts globally from the high ownership of cell phones and extensive use of the internet that lead to more affordable financial services. This favored the rapid adoption of electronic accounts and payments, as well as greater access to savings products in the formal financial system. In this scenario, countries of different income levels improved their financial inclusion indicators.
As in Argentina, payment and mobile money accounts were the main driver of these trends in several regions. In Latin America and the Caribbean, the majority of adults who reported having saved in the formal financial system did so through payment or bank accounts1. On the other hand, digital payments have established themselves as the most widespread financial service, used by approximately twice as many adults who said they had saved.
While this progress has expanded access to financial tools, significant challenges remain. In terms of savings, the design of products that are more tailored to people’s needs would contribute to raising the low levels of formal savings. In addition, financial health indicators, referring to achieving financial goals, managing economic emergencies and feeling secure about one’s own finances, showed that key components such as the availability of funds to face emergencies have not improved. Financial health has been consolidated as a central objective of financial inclusion policies at the global level, seeking to ensure that initiatives effectively benefit people through access to adequate and quality products, safe and informed use and better financial decision-making.
1. Access to financial services
1.1. Physical access points and digital environment
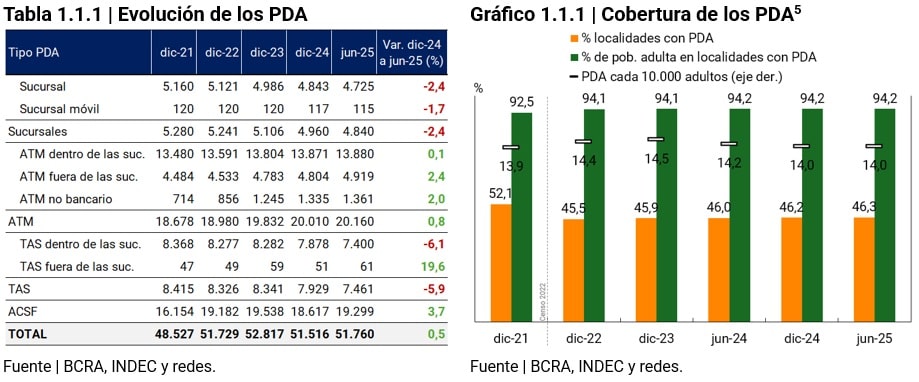
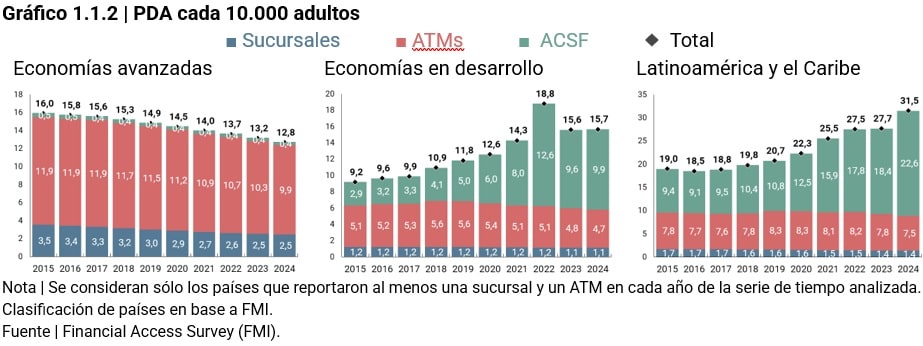
As of June 2025, 46.3% of localities and 94.2% of adults had coverage of at least one financial services access point (PDA)2, maintaining practically stable levels since December 20223. The coverage of the physical infrastructure is mainly explained by the presence of ATMs and complementary financial services agencies (ACSFs)4 .
Globally, there is a reduction in the number of traditional PDAs, such as ATMs and branches, as digital solutions become the most chosen channel for access to financial services6. Advanced economies have recorded the sharpest declines, while developing countries have contracted more moderately. In the latter, the growth of non-traditional access schemes such as ACSFs stands out, with Colombia, Peru, India, and Indonesia being some of the countries that lead this growth7.
The Argentine financial system, in line with the global trend, continued with the contraction of branches, with a decrease of 2.4% during the first half of 2025. Despite the sustained drop in the number of branches, the territorial coverage of these service points remained relatively constant, as closures were mainly concentrated in localities with other branches and/or other types of PDAs.
Electronic devices (ATMs and TAS), on the other hand, registered slight increases during the first half of the year. The growth of ATMs and self-service terminals (TAS) located outside branches stands out, a phenomenon that could be linked to the process of closing physical branches. Financial institutions (EEFF) could have relocated part of the devices previously installed in branches to new locations. At the same time, non-bank ATMs continued to expand, with a growth of 2% compared to December 2024 (see Box 1). The installation of devices outside branches, both banking and non-banking, contributes to deepening the capillarity of the physical infrastructure of the financial system.
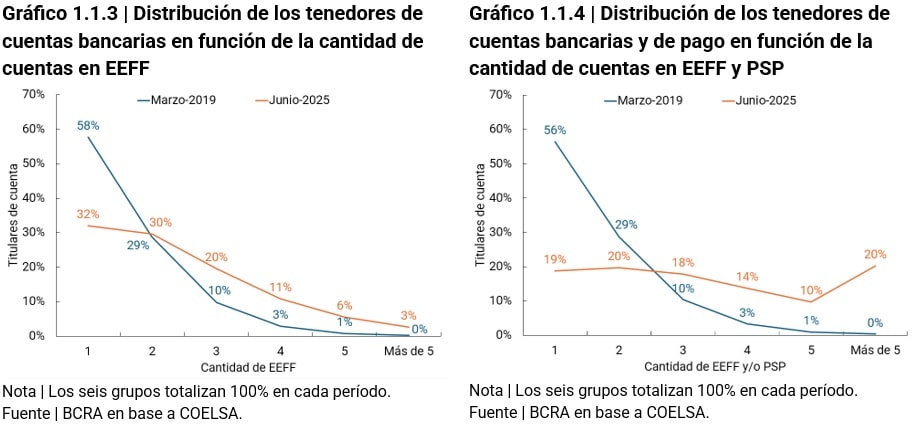
In recent years, there has been a sharp increase in the number of users of financial services. While in March 2019 27.4 million people had a bank account, by June 2025 the total rose to 35.6 million. The growth was not only reflected in the total number of customers, but also in the diversification of EEFF with which people maintain financial ties. In March 2019, 58% of users had an account in a single financial institution, a proportion that fell to 32% in June 2025 (if the holding of payment accounts is also considered, the values reached 56% and 19%, respectively).
The remote opening of accounts, the free of charge of these and a certain differentiation in the services offered (remuneration of account balances, availability of Mutual Funds, purchase/sale of foreign currency, promotions, among others) would be some of the reasons associated with the higher number of accounts per person.
In this context, although the customer base of the EEFF grew significantly, the physical infrastructure did not show an expansion in the same magnitude. The evolution of ADPs may have been influenced by different trends observed in recent years. Financial services dematerialized in many cases (such as checks, fixed terms, and in some cases loans) while digital service channels expanded, making it easier to open accounts (which replaces the need to go to a branch), remittances and payments (which reduce the use of cash) or balance inquiries. among other operations.
On the other hand, the depth of the local financial system is relatively low, while the maturity of deposits and the maturity of loans tend to be short to medium term, thus influencing the need for and use of ADPs. The attention of bank staff is necessary for more complex financial products such as mortgage and pledge loans, even when certain stages of their processing can already be resolved digitally.
The new edition of the Global Findex survey (2025) reveals high levels of cell phone ownership and connectivity in Argentina. 85% of the adult population uses a mobile phone daily and 78% declare daily use of the Internet, values that are among the highest in the region. These indicators are consistent with the improvements shown by the adoption of financial products through electronic channels, such as payment account holding, electronic payments, and some savings products that are perfected digitally.
Box 1 / Non-bank ATMs
Non-bank ATMs are devices operated by non-financial companies that allow users to perform basic transactions such as cash withdrawals and balance inquiries. They are usually located in commercial premises such as supermarkets, gas stations, shopping malls and small shops. Interoperability is a key feature of these access points, as it implies that the devices can be used by any customer in the financial system. In recent years, these devices have shown global growth and have a strong presence in countries such as the United States, Australia and India8.
Non-bank ATMs provide benefits in three dimensions: (i) they facilitate operations such as withdrawals, payments or recharges without the need to go to a banking point, although their use may involve a cost; (ii) for businesses, they reduce cash handling costs by recharging with the collection itself, and, in addition, their presence can increase the flow of customers, which implies a potential benefit to the business; (iii) for the financial system, they expand the network of physical infrastructure, favoring greater capillarity and territorial reach.
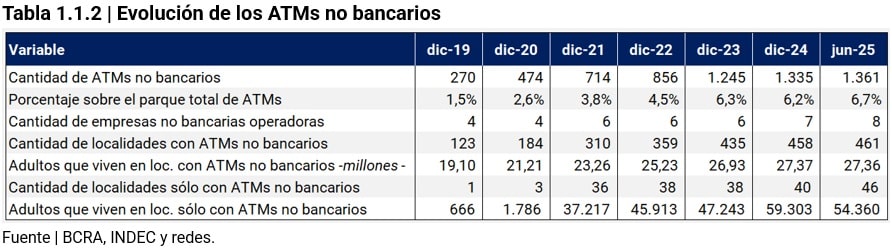
At the local level, since 2016 the BCRA has established that the EEFF must allow their customers to operate through non-bank ATMs9. These devices must inform the customer in advance of the operations supported and the price of their use. Currently, eight non-financial companies operate in the country with a total of 1,361 ATMs as of June 2025, which represents 6.7% of the total number10. They are distributed in 461 localities that concentrate 75% of the adult population, and in 46 localities with less than 10,000 inhabitants they constitute the only access point. In addition, some of this equipment was installed in popular neighborhoods11. As for its location, service stations, non-bank collection premises, supermarkets and shopping centers predominate.
The number of individuals (PH) with accounts stood at 37.5 million as of June 2025, which implied a net increase of 800 thousand compared to the same month of the previous year and 300 thousand compared to December 2024. With coverage close to the entire adult population, access to accounts for the unbanked segments has been significantly facilitated, which keeps the risk of financial exclusion due to lack of an account at low levels.
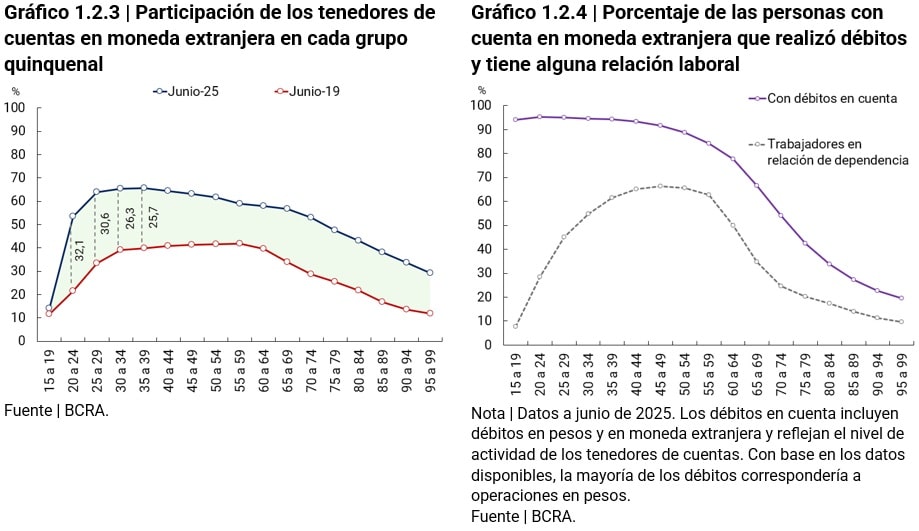
In this context, the population weighs access to different types of accounts with attributes that meet different needs. The two most marked trends are the simultaneous holding of bankaccounts 12 and payment accounts, and the holding of accounts in foreign currency. In the last 6 months, the number of people with bank and payment accounts grew by 1.4 million, reaching 71.7% of account holders, while the holding of accounts in foreign currency increased by 2.1 million, reaching 56% of account holders.
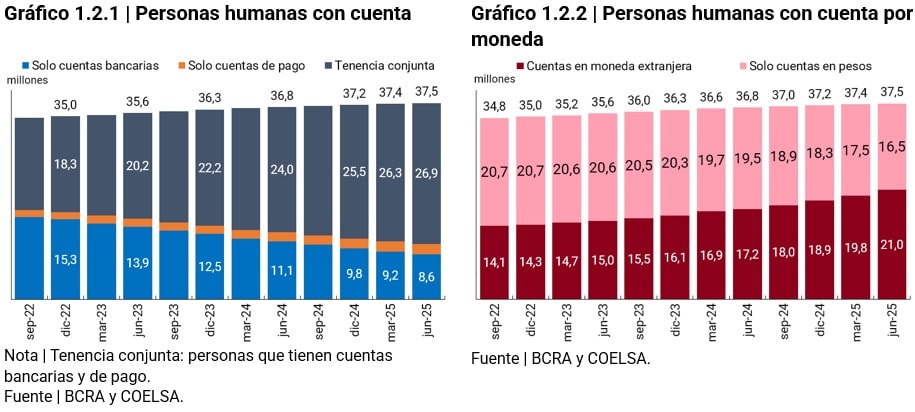
Foreign currency accounts have been boosted through various regulations, reinforcing both their function as a store of value and their more recent role as a means of electronic payment13. In the transactional field, the use of debit cards and QR payments in foreign currency was allowed, along with the display of prices in stores in both pesos and foreign currency. In addition, the opening of accounts in foreign currency was extended to adolescents14. Together, these measures aim to strengthen the development of electronic payment, savings and investment products in foreign currency and thereby attract resources to the financial system, add new participants (both in supply and demand) and promote a higher level of transactions.
As of June 2025, the holding of foreign currency accounts was widely spread among the population. The five-year groups between 20 and 44 years of age registered the highest levels of tenure (between 53.5% and 64.3%) and, compared to six years ago, they were the ones that increased their level of tenure the most. At the other extreme, people aged 65 and over had lower levels of tenure than younger groups, although high if one considers that, for the most part, they no longer participate in the labour market. This segment represented 14% of the holders of foreign currency accounts and reached 50% of the population in that age range with accounts.
People under the age of 65 actively used electronic channels to make payments or transfers, indicating that digital access does not constitute a barrier to a potential use of electronic payments in foreign currency for this segment. As for savings and investment products in foreign currency, five-year groups between 35 and 55 years of age would be the users with the greatest potential for use, since they combine high rates of labor participation and use of electronic payments. In contrast, in people aged 65 and older, low transactional activity and their disengagement from the labor market could limit their participation in both types of products.
Another relevant aspect in account holding is the degree of digitization of account holders. As a first approximation to this phenomenon, the composition of account holders was analyzed with the following perspective: (i) at one extreme, those who only have accounts in financial institutions (EEFF) that do not offer face-to-face operations (digital EFF) or payment service providers (PSPs); this group was called “Digital Users”; (ii) at the other extreme, “More face-to-face users” was the group of people who have accounts only in EEFF with a presence in the territory through branches, ATMs and other PDAs (i.e., they do not have accounts in digital EEFF and/or PSP); and (iii) a third set of people who have accounts in both types of providers, which we call “Mixed Users – Digital and Face-to-Face”.
This exercise of classification of account holders yields three patterns of behavior according to the way in which they access digital financial services. First, the proportion of users who accessed exclusively digitally continued to be low and was mainly concentrated in younger segments. As of June 2025, the so-called digital users reached about 2.7 million, and more than half (52.7%) were under 20 years old. This age group tends to concentrate their activity on transactional operations that do not require going to access points to financial services. However, as these users grow and join the labor market (marked by the opening of a salary account) or demand more complex financial products, they tend to add accounts in EEFF that have a territorial presence.
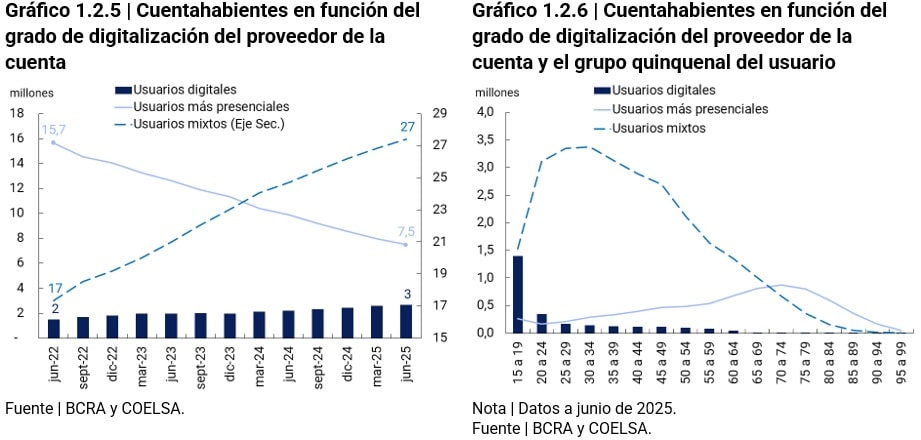
Secondly, the widespread modality in the population is combined access through accounts in digital providers and those that have physical channels. These mixed users take advantage of both types of providers depending on the type of operation. Between June 2022 and June 2025, this group expanded from 17.3 million to 27.4 million people, reflecting a sustained transition from mostly in-person users to blended adoption. Thirdly, users who operate only through EEFF with a territorial presence have been losing relative weight within the total and, in contrast to digital users, it is a marked trend in older adults.
2. Use of financial services
2.1. Electronic means of payment15
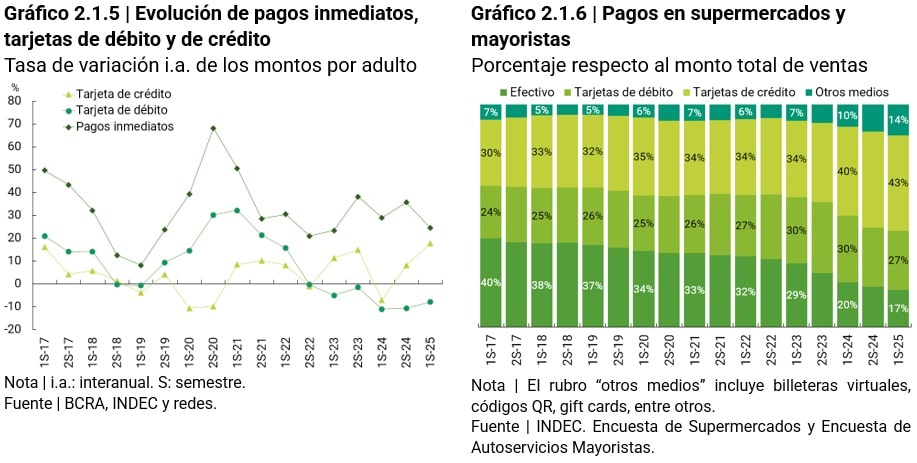
The use of electronic means of payment (EPM) contracted in the first half of 2025 compared to the second half of 2024, after several semesters of growth. The drop was mainly explained by a lower number of debit card transactions. However, the number of operations per adult showed an increase compared to the same period of the previous year. On average, each adult person performed 28.4 operations permonth 16, which represented a year-on-year increase of 13.2%. This lower dynamism was explained, on the one hand, by the slowdown in the pace of expansion of transfers and, on the other, by the fall in the use of debit cards. However, instant payments (transfers and transfer payments -PCT-) continued to be the main driver of the growth of electronic transactions.
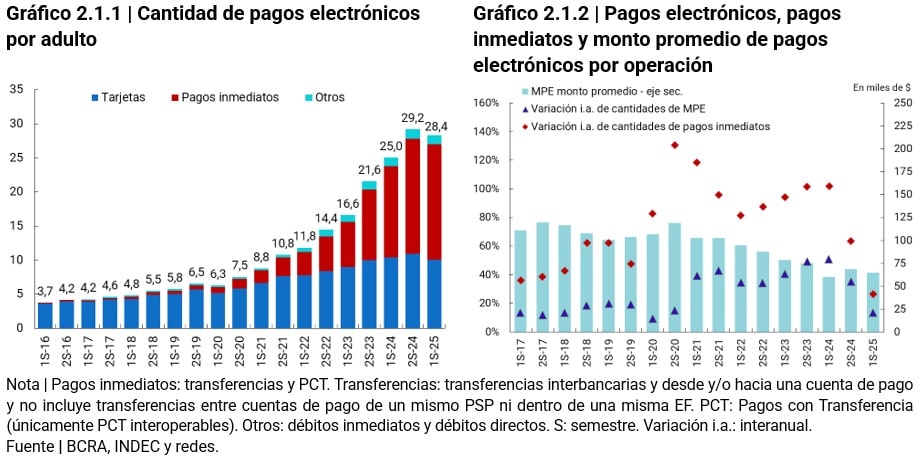
In terms of constantamounts 17, the average monthly amount per adult of electronic payments in the first half of 2025 grew by 21.1% year-on-year, maintaining the pace of previous semesters. For the first time in several periods, this amount expanded more than the number of operations per adult, resulting in a slight increase in the average value per transaction compared to the same half of 2024. Although the reduction in the average amount of electronic payments is usually associated with the substitution of low-value cash transactions, this increase does not seem to be linked to a greater use of cash, but rather to a scenario of stabilization in the dynamics of electronic payments.
In Argentina, there has been a downward trend in the average amount per operation with MPE since 2018. This decline coincided with the expansion of immediate payments and with a lower use of cash, estimated by the reduction in money withdrawn in relation to GDP. In this context, it can be deduced that there was a marked substitution of cash for immediate payments (transfers and transfer payments), which share with cash the immediate credit and the zero (or relatively low) cost18. In addition, immediate payments can also contribute to the challenges and costs of cash management19.
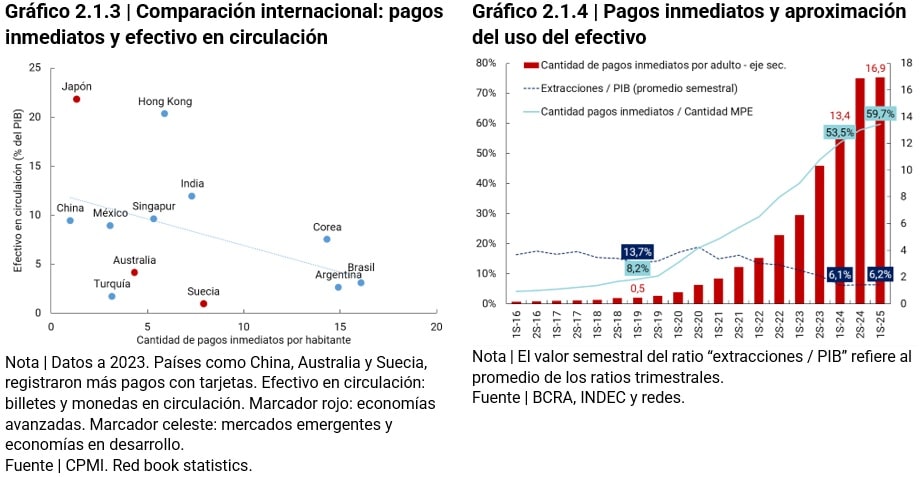
As a result, the use of cash in Argentina remained at historic lows (6.2% of GDP) during the first half of 2025, a level that has been repeated for three semesters. This stagnation, coupled with the lower growth in the number of electronic transactions, suggests some stabilization in the digitization of payments. At the same time, in economies with similar incomes there is also a trend towards the increased use of instant payments within electronic payments20.
The historical lows in the use of cash in relation to GDP were also reflected in its lower share of sales of shops (supermarkets and wholesale self-services) and sales of household appliances and household items21. In the first half of 2025, the share of cash in retail sales fell in a context of increased total sales (2.2% in real terms). At the same time, the share of debit card sales fell by 3 p.p., while those made with credit cards and the “other” category (which includes payments via QR) grew by 3 p.p. and 4 p.p., respectively. This performance could explain, at least in part, the reduction in debit card payments in the retail payments ecosystem that was observed in the first half of 2025 and that would have been replaced by higher credit card payments and immediate payments.
In addition, the increasing use of Money Pools (DCFs) to manage liquidity could be displacing the use of debit cards. This is because users can make transfers and payments by transfer (PCT) directly with the funds invested in an FCD, without the need to make a prior operation (redemption of the funds). On the other hand, if the payment is made by debit card, it is necessary to previously fund the account (via redemption of the FCD) or maintain a balance in the savings bank, which in most cases does not offer remuneration.
The replacement of debit cards with immediate payments is part of a global trend. While card payments prevail in developed countries, in developing countries immediate payments are gaining prominence22. In the first half of 2025, these payments in Argentina accounted for 60% of operations with MPE and 73% of the amounts.
For its part, total credit card transactions increased in quantity and amount per adult during the first half of 2025, mainly driven by transactions in a single payment compared to the same period in 2024. However, the installment payment modality (financing) showed greater dynamism, with growth rates between 5 and 7 p.p. higher than those of operations in a single payment, both in quantities and amounts.
Finally, in terms of financial inclusion, it is key to determine whether the increase in the amount and amount transacted through MPE is also due to the incorporation of new users into the electronic payment market. In the second quarter of 2025, it is estimated that 75.5% of bank and/or payment account holders made electronic payments from their accounts, which implied an increase of 2.7% year-on-year (2 p.p.)23. In total, there were 28.3 million people, that is, 1 million more than at the end of 2024.
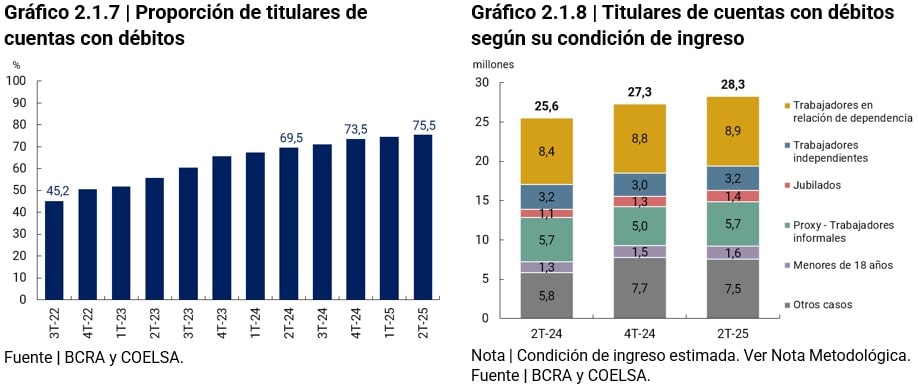
By characterizing these people according to their income status, encouraging results emerge from the perspective of financial inclusion. Of the total number of electronic payment users in the second quarter of 2025, 17.7 million people (or 63% of the total number of those who registered a debit) had some type of employment (registered, independent or informal24), 1.4 million (or 5%) were retired and 7.5 million (or 27%) corresponded to inactive and/or unemployed people. which shows a widespread adoption among different sectors of the population. This confirms that part of the growth is due to the arrival of new users, a positive aspect for financial inclusion, given that payments are usually the first step towards other financial services such as savings and credit.
2.2. Savings and investment modalities 25
Individuals (PH) have the possibility of allocating their money among various savings and investment products, depending on their liquidity objectives, term and risk-return ratio. The stock of people’s savings channeled through the financial system and in certain capital market products represented 9.3% of GDP in the second quarter of 2025, a value lower than the average for countries with similar incomes26.
On the other hand, the results of the new edition of the Global Findex survey (2025) show that 23% of the Argentine population reported having saved in financial institution accounts (EEFF) compared to 32% who saved through payment accounts27. This trend of higher use of payment accounts compared to EEFF accounts is also observed in countries with similar incomes. As a novelty, it is observed that 26% of the people who saved did so exclusively in payment accounts, without using EEFF accounts.
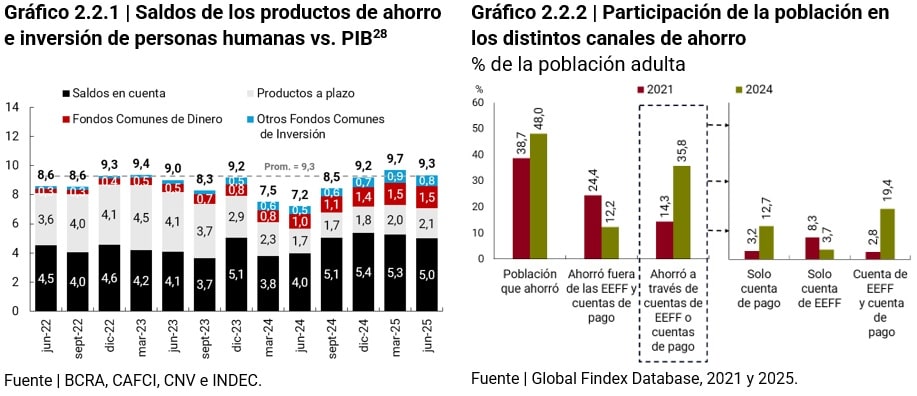
The growing use of payment accounts for savings purposes is reflected in the expansion of Mutual Funds (CDFs), which have established themselves as the most dynamic domestic currency savings product among PHs. Initially, the increase in the inflation rate prompted savers to protect the purchasing power of their balances, and then the accessibility and ease of use of this tool strengthened its adoption29.
Thanks to the advantages, payment account holders and EEFF account holders often reallocate their liquid balances, which in most cases do not generate remuneration, to FCDs within the same PSP or EEFF. As a reference, the number of payment accounts with a balance in DCF increased from 18.6 million in June 2024 to 26 million in June 2025. In June 2025, at least 56.3% of PHs with payment accounts had balances in CDF30, which implied a year-on-year increase of 4.7 p.p. In this way, DCFs gained relevance compared to other savings and investment modalities, increasing their share of the total balance from 14.3% to 16.6% between June 2024 and June 2025.
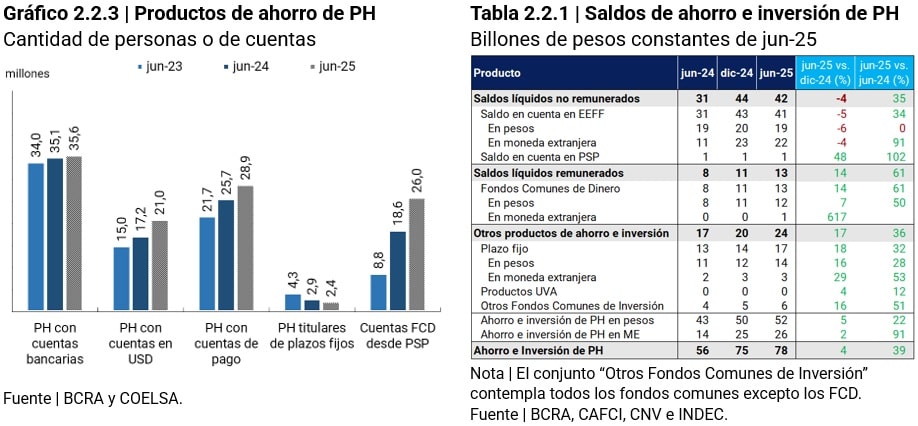
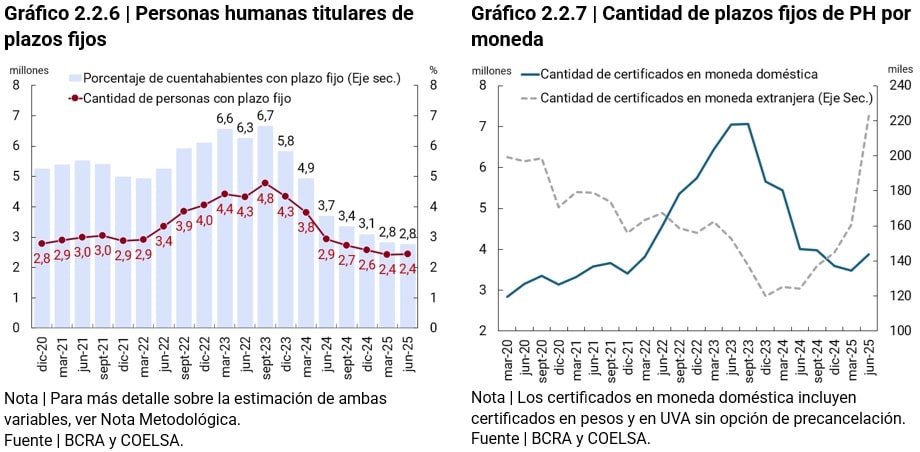
As of August 2024, a rate differential was observed in favor of fixed-term loans in pesos versus CDFs in pesos. During the second quarter of 2025, fixed-term loans offered positive real rates, which drove a slight recovery in this instrument. The number of fixed terms in national currency reached 3.8 million in June 2025, with a half-yearly growth of 8%, while their balances increased 16.2% in the first half of the year.
The regulatory measures and advances adopted to promote currency competition together with the elimination of restrictions on the purchase of foreign currency have boosted the supply of savings and investment products in foreign currency. As of June 2025, the amount of DCF in US dollars rose to more than 50. In addition, fixed terms in foreign currency stood out for presenting a growth of 53.8% in the first half of the year, standing at 223 thousand fixed terms as of June 2025.
The average balance per holder of fixed terms31 experienced a drop in real terms of 40% between June 2023 and June 2024, with a recovery of 59% in the last 12 months, consolidating itself again as the product with the highest average balance per holder ($7 million as of June 2025). However, fixed-term loans continued to show signs of weakness in terms of financial inclusion. It is estimated that the number of PH holders of fixed terms went from 2.9 million in June 2024 to 2.4 million in June 202532. In this way, the percentage of account holders with a fixed term would have stood at 2.8%, with a year-on-year fall of 0.9 p.p. This dynamic shows the low use of fixed-term deposits as a savings instrument for PHs, in contrast to what was mentioned in the previous paragraphs about DCFs.
Box 2 | Box 2 / Saving pockets
A savings pocket is a virtual division within a bank or payment account that allows you to set aside money for specific purposes, such as a vacation, buying a home, or paying for utilities. In addition to simplifying financial organization, these products generate returns, which reinforces the incentive to save.
The usefulness of this tool is based on four aspects. Firstly, they allow savings to be directed towards specific goals, reinforcing user commitment. Second, by accruing interest, they not only help preserve purchasing power in the face of inflation, but also provide an incentive to set aside funds for future consumption. They also facilitate liquidity management, as they make it possible to distribute resources between immediate needs and short-term objectives. Finally, they contribute to the development of sustainable savings habits, favoring better personal financial planning.
There are different mechanisms to nourish these pockets and that contribute to the development of savings habits. The most common is the scheduling of periodic automatic contributions from an account. “savings by consumption” schemes can also be used, where every time the user makes an expense or receives a transfer, a part is automatically transferred to the pocket. Another alternative is to transfer funds at the time the person wishes.
This type of product has gained relevance worldwide, particularly in contexts where digital banks and mobile accounts have high penetration. In Argentina, different providers offer solutions with similar characteristics, which share the logic of separating funds for specific objectives, but incorporate differential attributes in terms of terms, contribution mechanisms and profitability schemes:
*Model 1: they generate daily returns through Mutual Funds, both in pesos and dollars, and the funds can be withdrawn at any time at no cost. Its funding can be configured automatically, either through periodic schedules that schedule money deposits, or through mechanisms associated with consumption, where each QR payment or transfer received automatically derives an amount to the pocket.
*Model 2: allows you to reserve money with a name and category for predetermined periods (7, 14 or 28 days). The rate of return increases the longer the chosen term. Although funds are available at all times, early withdrawal has a penalty in the annual nominal rate.
*Model 3: they operate as virtual piggy banks, in which people transfer funds from their savings account and assign them to specific objectives with a certain amount and name. These funds remain immobilized for a maximum period of 45 days and, although they can be redeemed early, early withdrawal implies the loss of the returns generated.
2.3. Credit to individuals33
As of June 2025, 19.5 million individuals registered financing in the expanded financial system (SFA)34, representing 52.6% of the adult population. In the first half of the year, 2.2 million debtor registrations and 1.2 million cancellations were recorded, resulting in a net increase of 1 million debtors compared to December 2024. The average balance per debtor continued to rise, with an increase of 19% during the first half of the year, thus reaching its highest in real terms in the last five years35.
In line with what was observed in the previous semester, these results consolidate two central trends in credit to individuals (PH): (i) the sustained incorporation of new debtors and (ii) a growing use of credit. This is reflected in the increase in the average balance per debtor and in the fact that a significant portion of debtors increased their financing in real terms. Both trends are verified for both financial institutions (EEFF) and non-financial credit providers (PNFC). During the first half of the year, the number of people with financing grew by 5% for EEFF and 11% for PNFC, while the average balances per debtor increased by 37% and 28%, respectively.
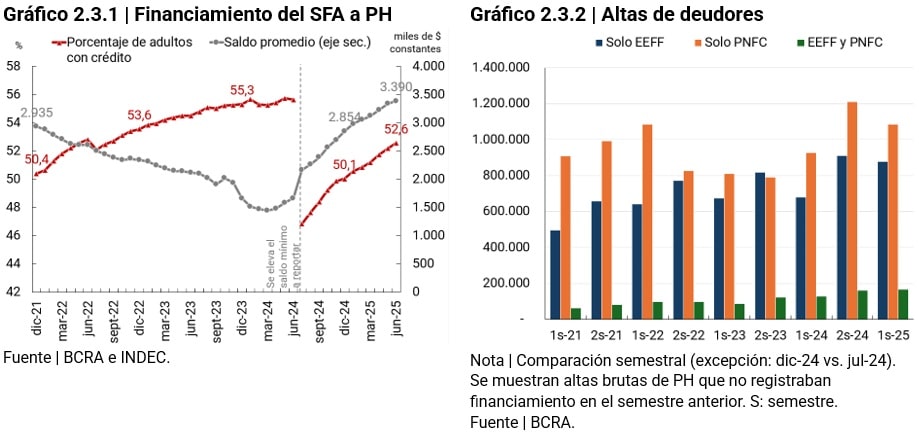
(i) Entry into the credit market. In the first half of 2025, 2.2 million new debtors entered the credit market. More than half (51%) accessed PNFC financing alone, 41% did so only through EEFF and 8% combined both types of providers. The analysis of previous periods shows that the entry of new individuals into formal credit was channeled more through the PNFCs than through the traditional financial system.
The PNFCs are characterized by offering loans of smaller amounts and with higher interest rates than those of the EEFF36, although with more flexible requirements for granting. In addition, many of these providers operate exclusively virtually, which facilitates both the application and the management and granting of credit, while reducing barriers to entry for applicants (such as geographical location)37. This makes the PNFCs a gateway to formal credit, despite the less favorable financial conditions.
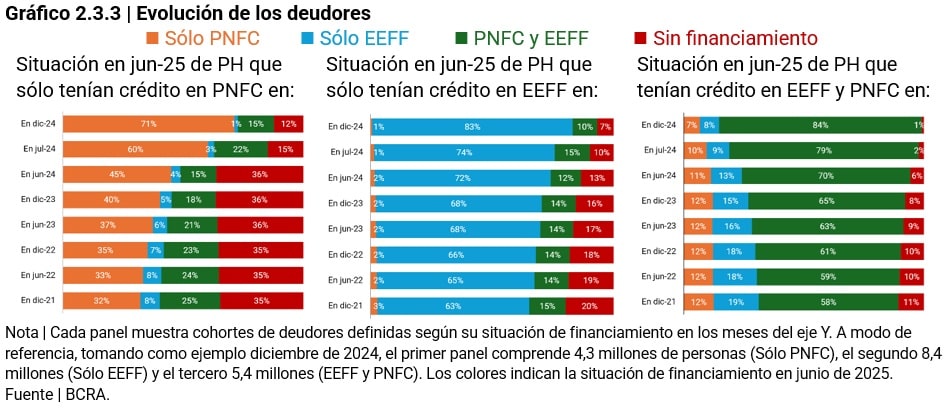
In turn, access to credit through the PNFCs allows you to build a credit history, which makes it easier to obtain future financing under better conditions. One way to assess this effect is to look at the credit holdings, in June 2025, of those who in the past only had PNFC financing. Among those who in December 2024 were financed exclusively with PNFC, 71% maintained that condition six months later, 15% added financing from EEFF – thus expanding their access to credit – and 12% stopped registering a credit balance. The farther away the point of comparison, the lower the proportion of borrowers who maintain their financing with PNFC alone. Over time, many incorporate EEFF credit or go directly to financing with them alone, which usually implies more favorable credit terms. In comparative terms, debtors with credit only in EEFF behave differently, as they tend to remain in that situation over time.
(ii) Increasing use of credit. Among the debtors with SFA credit in December 2024, 51% increased their balance in real terms, concentrating 66% of the total balance as of June 2025. Among EEFF debtors, 51% increased their balance, while for PNFC the increase was recorded in 49% of debtors. Likewise, about 20% of the debtors of each group more than doubled their level of financing in real terms.
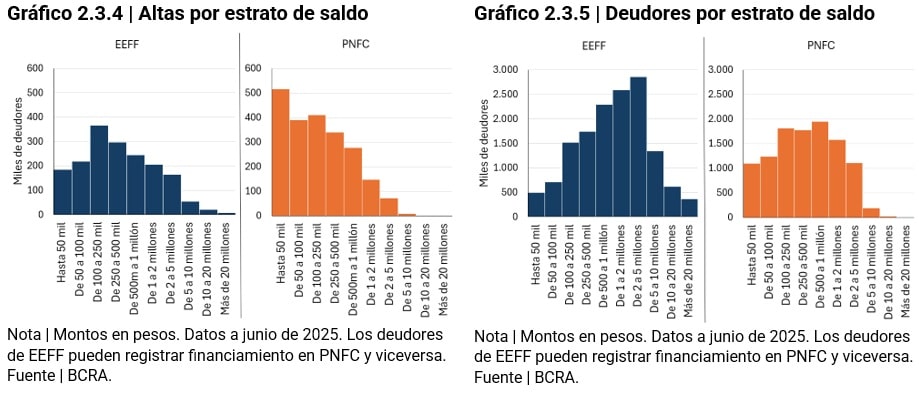
On the other hand, the entry of new debtors does not have a significant effect on the increase in the total balance, since new debtors enter the credit market for balances much lower than those of existing debtors, both in PNFC and EEFF. In addition, a significant portion of new borrowers enter through PNFCs, whose average credit balances are lower than those of the EEFFs. In this sense, it is observed that, for the PNFCs, 24% of the new debtors in the first half of the year registered a balance of less than 50 thousand pesos, while in EEFF that stratum concentrated 11% of the registrations. In the upper brackets there are also gaps between suppliers: for PNFC, only 4% of new debtors exceeded 2 million pesos, compared to 14% for the EEFF.
In this scheme, NFPPs are characterized by granting smaller loans, higher costs and more flexible credit risk assessments and/or with a greater tolerance for risk, while the NFEs operate with a more conservative profile, concentrating higher amounts, lower funding costs, while being subject to more demanding regulation in terms of risk management. These divergences, caused to a certain extent by the applicable regulatory framework and the available sources of funding, are reflected in the types of loans offered and in the sociodemographic composition of the debtors of each group, which have a direct impact on the configuration and general dynamics of the credit market.
According to data from the Credit Conditions Survey for the second quarter of 202538, the EEFF registered an increase in the demand for credit perceived in almost all lines to households, mainly explained by the increase in consumption. This dynamism occurs in a context of relative stability in real monthly interest rates on personal loans and credit cards, which throughout the quarter remained positive between 4% and 5.5% per month, close to their highs of the last two years.
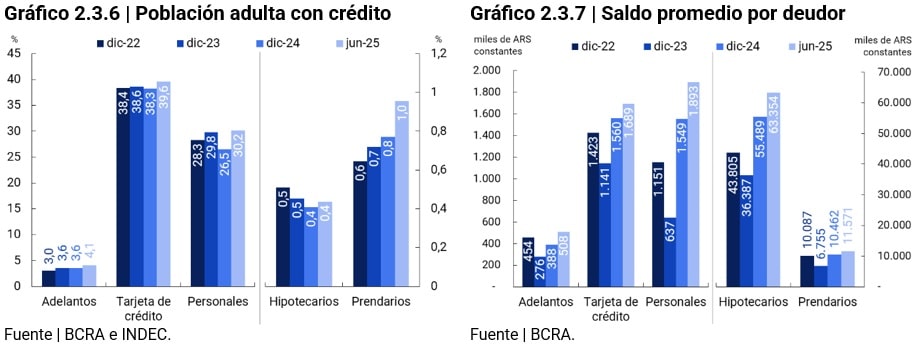
The increase in perceived demand for credit is reflected in the growing use of both credit cards and personal loans. The credit card continued to be the main credit instrument, with 14.6 million debtors at the SFA level, and registered an increase of 4% in the first half of 2025, while personal loans, on the other hand, reached 11.2 million people by June 2025, accumulating an increase of 14.5% compared to December 2024. For this type of loan, the scope of EEFF and PNFC is similar, with 7 and 6.8 million debtors respectively.
In terms of balance, during the first half of 2025 the averages per debtor showed an increase at the SFA level of 8% for credit cards and 22% for personal loans. In the case of credit cards, the behavior of the balance of EEFF and PNFC debtors was similar, with increases of 8.1% and 8.0%, respectively. In contrast, for personal loans, the growth of the average balance in EEFF was considerably higher than that recorded in PNFC (23.7% vs. 13.6%).
However, significant differences persist in funding levels depending on the type of provider. As of June 2025, the average balance per debtor on credit cards issued by PNFC represented 56% of the EEFF equivalent, while for personal loans the gap is even greater: the average balance per PNFC borrower was around one-fifth of that observed in EEFF. These relationships remain relatively stable over time, demonstrating that the magnitudes of loans from one group and the other are considerably different.
On the other hand, within the longer-term and collateralized credit segment (in which the EEFFs mostly participate), mortgage and pledge loans continued to incorporate new debtors, although in much lower volumes than those of consumer loans. During the first half of 2025, about 20 thousand people accessed a mortgage loan, with an average balance of $101 million, which doubled the registrations observed in the second half of 2024. This performance translated into a net increase of 8% in the number of mortgage debtors, in contrast to the 7% contraction recorded in the same period of the previous year.
The monthly dynamics also show an acceleration in new registrations towards the end of the semester, despite the rise in interest rates for these loans. Regarding the profile of the new debtors, 62% of the new debtors were between 35 and 49 years old and 63% had a registered address in CABA or Buenos Aires. In terms of employment status, most had a dependent job, while a small portion were self-employed.
As for collateral loans, the sustained trend of incorporation of new debtors was maintained, which resulted in a net increase of 24.2% in the number of people with this type of financing compared to December 2024. 49% of new operations corresponded to39 vehicle title loans, in line with the rebound of the Patenting Index, which accumulated in 2025 an increase of 61.8% compared to the same period of the previous year. In real terms, the average balance per debtor showed a moderate positive variation, in the order of 11%, and reached $11.6 million pesos.
In this context marked by the incorporation of new debtors and a growing use of credit, the repayment capacity of PHs shows a deterioration in the first half of the year. In June 2025, the percentage of debtors that adequately meet their commitments stood at 86.5% and the balance in a regular situation at 93.4%, which implies falls of 2.5 p.p. and 3 p.p., respectively, compared to December 2024. The decrease in the percentage of people in a regular situation was more marked in PNFC (-4 p.p.) than in EEFF (-2 p.p.).
At this point, it should be recalled that the indicator of regularity of debtors registered an improvement after the increase in the minimum balance to be reported in CENDEU, with an increase of 8.7 p.p. in PNFC and 0.4 p.p. in EEFF. However, as the months went by and the incorporation of new debtors, the regularity in PNFC began to show a downward trend, although it still remains above the levels prior to the regulatory change. In contrast, in the EEFF the percentage of people in a regular situation fell to its lowest in the last five years (91.9%), which could reflect a deterioration in the repayment capacity with respect to the historical behavior of their debtors.
2.4. Credit to productive units
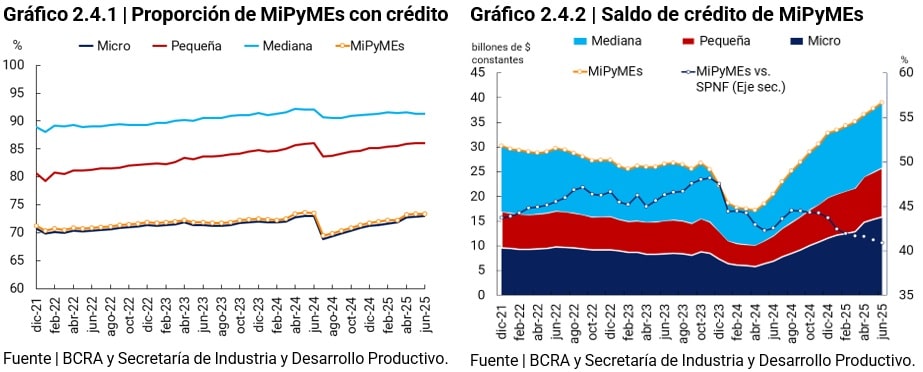
In June 2025, the indicator on the proportion of MSMEs with credit registered a slight increase compared to December 202440. According to statistics from the Ministry of Industry and Productive Development, this type of company reached an amount of approximately 1.9 million, of which 84% were constituted as a human person (PH) and the remaining 16% as a legal person (PJ). When segmented by size, about 1.85 million microenterprises, 50 thousand small and 10 thousand medium-sized enterprises were registered. Individuals represented a high proportion among micro-enterprises (86%), but low among small (12%) and medium-sized (2%) enterprises.
Of the total number of MSMEs, 73.4% had financing in June 2025, although with differences depending on the size of the company, since the values rose to 91.3% for medium-sized enterprises, 86% for small enterprises and 73% for microenterprises. The financing balances of MSME companies grew by 19% in the first half of 2025, among which microenterprises registered the highest rates (37%).
In addition, the growth of the MSME credit balance in the first half of 2025 was lower than that of NFPS credit. This occurred in a context of reduced incentives applied to certain lines of credit for MSMEs, which operated through deductions in reserve requirements. These regulations aimed to align financing conditions for MSMEs with those of the credit market in general.
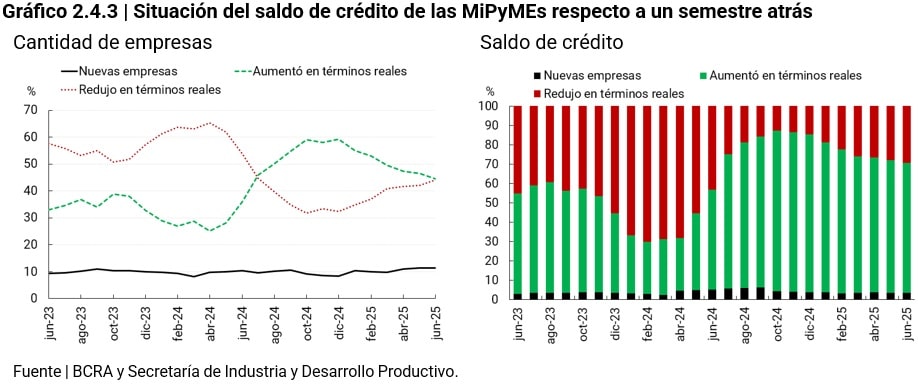
Likewise, half of the MSMEs with financing in June 2025 increased their credit balance in real terms throughout the first half of 2025, contributing $26.3 billion. On the other hand, the entry of new MSMEs into the credit market registered a slight increase. Between December 2024 and June 2025, some 161 thousand MSME companies joined the credit market, contributing about $1.3 trillion constant pesos.
In relation to employment, as of June 2025, 12.2% of MSMEs with credit (172 thousand companies) had at least one worker in an employment relationship, employing 2.6 million workers41. This low percentage is explained by the high participation of PH in the micro size, which does not usually have salaried personnel. Employment in MSMEs grew 6.2% in 2024, but began to fall in the first half of 2025 (-3%), although it remained slightly above the average of the last three years. Likewise, the number of employing companies with credit showed a similar pattern to that of workers.
The recent increase in credit balances did not translate into a growth in the net incorporation of workers in a dependent relationship by these companies. Since May 2024, when credit began to expand in real terms, financing for these companies more than doubled, while the number of employees only increased by 3.7%42. Although the literature indicates that the increase in financing in MSME companies can generate expansion of employment (even lagging behind), the main destinations are usually working capital, the purchase of inputs and the hiring of suppliers, which would ultimately boost the increase in production and the hiring of personnel.
However, taking the last 3 years into perspective, salaried employment grew in the micro and small segments, but fell slightly in the medium-sized segments. In particular, the dynamism of micro-enterprises stands out, which increased in number of employees and employing companies, although a low proportion of them still hire workers in a relationship of dependency.
Section 1 / Recent developments in the acquiring market, aggregators and acceptors of means of payment
The electronic means of payment (EPM) market is a two-sided or bilateral market43. These markets are characterised by the existence of two groups of users (consumers and merchants in this case), intermediated by one or more payment service providers (PSPs) in different functions. One of the features of these markets is the existence of network externalities between both groups of users: the usefulness of the use of MPE for consumers (merchants) increases if there are a greater number of merchants (consumers) that accept (use) electronic payments (and vice versa). Another aspect of these markets is that PSPs could set different prices (commissions or fees for the services provided, for example, the use of the platform) for the two types of users, seeking to maximize the use of MPEs.
In this framework, the section aims to describe how the market is shaped and the regulatory framework that affects the trade that accepts PEM. In particular, the purpose is to show how it is operating in terms of commissions, which businesses pay for each operation charged through an MPE, and the deadlines for crediting the funds.
There are three PSP figures that offer merchants the possibility of charging electronically through different initiation methods:
– Transfer Payment Acceptor (PCT): Adds merchants to PCT schemes. It facilitates the mechanisms for initiating payments, transmits payment order information, and confirms transactions.
– Acquirer: adheres merchants to card payment schemes. It facilitates the mechanisms for initiating payments, transmits information and confirms transactions.
– Aggregator (or sub-acquirer): provides merchants with access to payment schemes that the aggregator has contracted with one or more acquirers and acts as a receiving customer of the funds from the settlement of the different payment schemes.
These companies offer businesses different devices or solutions to receive payments. Among these are point-of-sale (POS) terminals, which can be fixed or mobile, payment buttons to collect payments for sales made on e-commerce platforms or printed QR codes.
On the other hand, financial (EEFF) and non-financial institutions issue instruments and/or open accounts that allow users to make payments. Among these are the EEFF (they give people or issue debit cards, credit cards, prepaid cards or allow payment to be made through money on account – PCT, transfers and cards), PSPCP (they issue prepaid cards and allow payment with money on account – PCT and transfers) and non-financial companies that issue credit or purchase cards (they issue credit or non-bank purchase cards).
Within this framework, there are commissions, as well as different deadlines for crediting the funds, which affect the remuneration received by the different actors. Among these are the remunerations to the card issuer (where the paying customer has the account), to the acquirer and to the aggregator that provides the service to the merchant. Users, on the other hand, do not pay commissions for each transaction; an aspect that encourages its adoption and use. Both issuers and acquirers remunerate card brands.
Of the commission paid by the merchant to the acquirer or aggregator (a percentage of the amount of the sale), a part is used to remunerate the card issuer and is known as the interchange fee. The difference that arises between the commission and the interchange fee corresponds to the income of the acquirer or the aggregator (depending on who the merchant has contracted the service with). In case an aggregator has adhered to a trade, a part of its commission also remunerates the acquirer.
On the regulatory side, the following are worth mentioning:
– Law 25.06544 regulates different aspects related to the Credit, Purchase and Debit Card system.
– National Payment System – Payment Services (ordered text)45 of the BCRA.
– National System of Payments – Transfers – Complementary Standards (ordered text)46 of the BCRA.
Payments by transfer (PCT)
When a person makes a payment through a PCT scheme, the funds are debited from a bank or payment account and immediately credited to the merchant’s account. The fee paid by merchants to PCT acceptors is between 0.6% and 0.8% of the transaction value. The interchange fee is between 0.15% and 0.6% depending on the established commission and the size of the business, and remunerates acceptors in the case of small businesses to generate incentives and expand reach to this segment. Again, the difference between the commission and the interchange fee remunerates the PCT acceptor.
Credit, debit and prepaid card payments
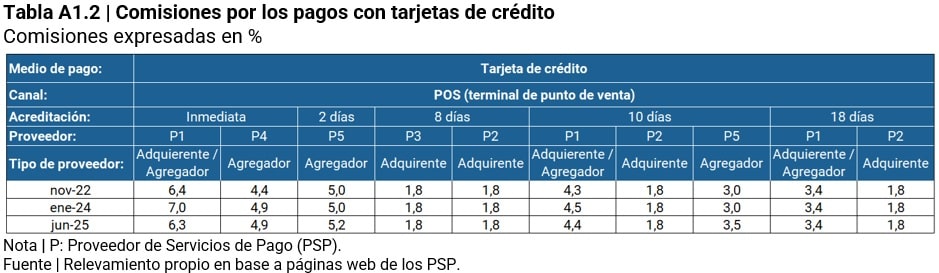
Between the end of 2023 and the beginning of 2024, the National Government established certain provisions aimed at deregulating the credit and debit card payment system. One of the most relevant aspects was the elimination of maximum fees (previously, fees could not exceed 3% in the case of credit cards and 1.5% in the case of debit cards)47. Likewise, the maximum period of 3 business days for the crediting of funds to merchant accounts for purchases made using debit cards was eliminated.
In the case of credit cards issued by EEFF, the deadlines for crediting funds to merchant accounts vary between 5, 8, 10 or 18 business days depending on the activity and/or the size of the business48. Unlike these, credit cards issued by non-financial entities do not have maximum deadlines for the accreditation of business collections.
In the case of an aggregator or sub-acquirer, the period for crediting the funds from payments made with cards (debit, credit or prepaid) to the merchant’s account may be extended by 1 more business day from the moment the aggregator receives the funds, with the exception of sales made in e-commerce49.
For payments made with prepaid cards, EEFFs, PSPCPs and other prepaid card issuers must credit the funds to the merchant’s account within a period of no more than 2 business days50.
To summarize, commissions for payments with debit, credit or prepaid cards are not regulated, as well as the credit periods for sales charged through debit cards (in this case, only from the moment the aggregator receives the funds).
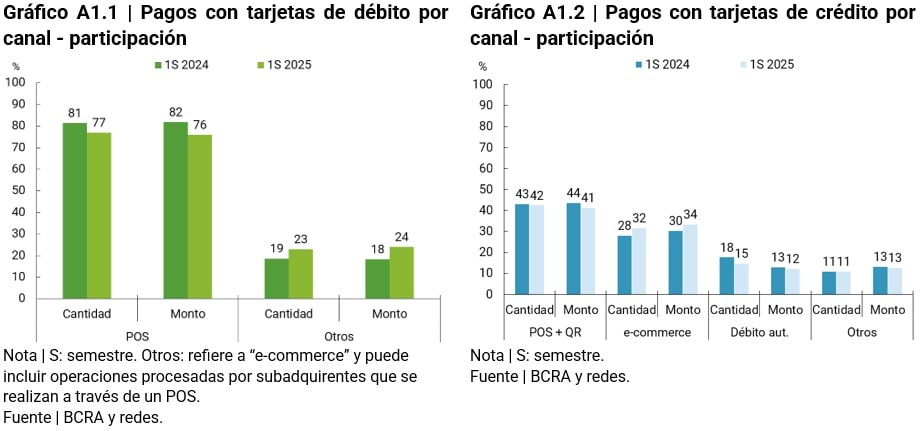
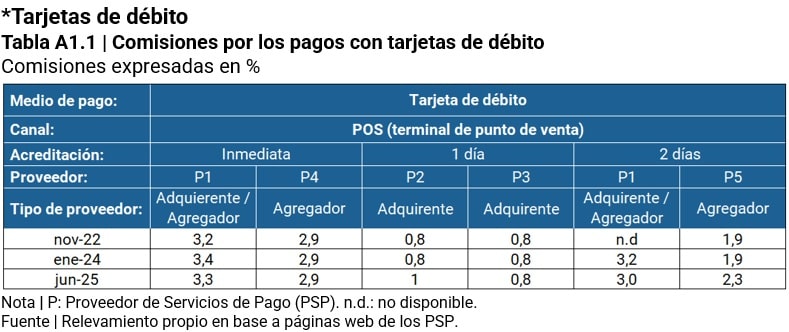
For merchants, the most used channel to charge with debit cards is point-of-sale (POS) terminals; lagging far behind its use in other channels such as e-commerce, QR code, etc. In the case of credit cards, the POS channel continues to be important, but e-commerce (payment button) becomes more relevant.
The following tables summarize for some acquirers and/or aggregators the evolution of commissions and crediting periods. Given the participation of the POS channel, it was taken as a reference for comparing commissions and accreditation deadlines. The monitoring of these fees is based on the information published by acquirers and/or aggregators on their websites.
A priori, the market is characterised by lower commissions from acquirers compared to those of aggregators. In part, the difference could be explained by the fact that when an aggregator acts, it has to remunerate the purchaser for the contracted service and because the aggregators’ commissions include the provision of additional services that the acquirers charge separately51.
Second, the deregulation of commissions in December 202352 (Decree DNU 70/2023 that amended Article 15 of Law 25,065) does not show a significant impact as no significant increases were observed in the tariffs charged to businesses. Even in the case that an increase is observed (from 0.8% to 1%), the percentage is below the maximum ceiling in force previously. This fact could be associated with debit card payments facing competition from transfer payments. Given that the commissions for immediate payments are around 0.8% and have immediate credit, the charges applied to debit cards should experience a sharp decrease in order to make these instruments more competitive for merchants compared to transfer payments.
Thirdly, there is a market structure where an aggregator tends to have higher commissions than the other aggregators, with the same terms of crediting the funds to the merchants.
*Credit cards
In the case of commissions for credit card payments, it is observed that acquirers generally maintained their commissions at 1.8% after the elimination of the maximum ceilings established in the Credit Card Law. In the case of aggregators, there is no defined trend, with decreases, increases or no change in agreement with the supplier.
Despite the absence of a direct competitor, given that the “consumption quota” system – which could be considered a competitor – has not yet reached the massiveness of the credit card (as of June 2025, some 25.9 million credit card holders were registered), only the increase in the commissions of one aggregator for two credit periods was observed.
As with debit cards, in the same term, the aggregators’ fees are higher than those of the acquirers. It is understood that part of the difference is explained by the aggregator being one more intermediary in the payment chain, a part of its commission being applied to remunerate the acquirer and because the aggregators’ commissions include the provision of additional services that the acquirers charge separately, as mentioned in the case of debit cards.
In addition, the pattern of higher charges applied by the same aggregator/acquirer with respect to other aggregators and acquirers, for the same term, is repeated.
Methodological note
Population data
This report presents indicators that are disaggregated by different demographic and geographical variables. The population projections were calculated based on the results of the 2010 National Census of Population, Households and Housing (CNPHV) for the months up to June 2022 and the 2022 CNPHV from July 2022. The following series are used as a starting point according to the level of geographical disaggregation:
– Indicators at the national and provincial levels: “Population by sex and five-year age groups for the country and provinces as a whole. Years 2010-2040”
– Departmental level indicators: “Estimated population on 1 July of each calendar year by sex, by department”;
– Indicators at the locality level: own construction based on the results of the CNPHV.
As of the 2022 CNPHV, there were modifications in the number of departments and localities in the country, which modifies the denominators used for the coverage indicators.
Finally, an “adult” is considered to be a person 15 years of age or older, following the standard used by the World Bank for its financial inclusion indicators.
Regionalization
The regionalization criterion proposed by the Ministry of Economy and Public Finance (currently the Ministry of Economy) is followed, which establishes five regions:
– NOA (Northwest Argentina): Salta, Jujuy, Tucumán, Catamarca and Santiago del Estero.
– NEA (Northeast Argentina): Formosa, Chaco, Misiones and Corrientes.
– Cuyo: Mendoza, San Juan, San Luis and La Rioja.
– Patagonia: La Pampa, Neuquén, Río Negro, Chubut, Santa Cruz and Tierra del Fuego.
– Downtown: Córdoba, Santa Fe, Entre Ríos, Buenos Aires and CABA.
Payment accounts at payment service providers
Among the Payment Service Providers (PSPs) that operate in COELSA, there are providers that are registered in the BCRA’s Registry of Payment Service Providers (PSP) and other providers that are not registered53. For the purposes of this report, only payment accounts for vendors that are registered as PSPs that offer payment accounts are counted.
Account activity (debits and/or credits)
The “Activity” series comes from COELSA and identifies whether account holders registered debits or credits in their bank and/or payment accounts within a quarter in each supplier where they have an account. The activity indicator presented in the report accounts for each person only once, regardless of how many accounts or vendors they operate on.
The series makes it possible to distinguish whether the movement of funds is the result of a debit and/or credit and includes debits and credits made through immediate transfers, payments with online transfers, transactions with checks, direct debits, DEBIN and batch (deferred) transfers, to the extent that they are settled and cleared by COELSA.
Given that the “Activity” series considers the subset of operations in which COELSA is involved, the activity indicators are underestimated. In particular, the indicator does not capture those account holders who operate with a debit card and do not carry out any of the operations settled and cleared by COELSA. Another aspect of the indicator is that debit transactions are, in general, initiated by the PH account holder itself, while credit transactions are originated by a third party (PH or PJ). This distinction has different considerations in terms of financial inclusion, given that in the first case it is an active operation of the PH.
Balances of savings and investment products of individuals (PH)
The savings and investment balances of PHs are classified as follows:
1. Non-interest-bearing liquid balances: include: (i) balances in current accounts and savings accounts denominated in local and foreign currency; and (ii) balances in payment accounts.
2. Interest-bearing liquid balances: include the value of the net worth (PN) of the Mutual Funds (DCFs) subscribed by PH (estimate) denominated in local and foreign currency.
3. Other savings and investment products: include: (i) value of the NP of other Mutual Funds (Other FCIs) subscribed by PH (estimate), which include fixed income funds (bonds), variable income (shares), mixed income, structured, among others54, (ii) fixed-term balances in pesos and in foreign currency and (iii) product balances in UVA.
To estimate the PN of the DCFs subscribed by PH, the sum of (i) the DCFs exclusive to PH was calculated and, (ii) for those DCFs that may be made up of both PH and PJ in EEFF, the PH was estimated on the basis of weights. The weights were obtained through the calculation of the share of the PH FCIs in the Total FCIs (PH+PJ). Exclusivity was consulted through a survey of the websites and management regulations of the DCFs. On the other hand, to estimate the NP of the other CRFs, the difference between the NP value of the FCIs subscribed by PH (using information published by CAFCI and CNV) and the PN value of the DCF subscribed by PH was calculated.
Individuals with fixed terms and percentage of account holders with fixed terms
The Information Regime for Supervision compiles, on a quarterly basis, the number of holders of fixed terms at the level of financial institution (FI), which include individuals (PH) and companies. To estimate the PH holders of fixed terms for each FI, the number of fixed-term holders was multiplied by the quotient between the number of PH fixed-term certificates with respect to the total certificates, both in pesos and in foreign currency, for each FI55. Then, the estimated amounts for each FI were added and the estimate for the total financial system was obtained, which may contain duplications to the extent that the PHs have fixed terms in more than one FI.
Proportion of payment account holders with balance in Mutual Funds (DCF)
Section “A” of the Information Regime for Payment Service Providers Offering Payment Accounts compiles, on a quarterly basis, the number of payment accounts that have a balance in Mutual Funds (CDF) for each payment service provider (PSP). This series was used to estimate the number of CDF holders for each PSP, since these DCFs only include PH and each account has a single DCFassociated with it. Also, it is assumed that each person has only one payment account in each PSP. Then, the quantities corresponding to each PSP are added, whose total may contain duplications to the extent that the PHs have CDFs in more than one PSP. The denominator of this quotient is the number of people who have payment accounts in the PSPs that offer CDFs, which arises from adding the number of account holders in each PSP. In this way, the denominator can have duplications like the numerator.
Real Interest Rate57
For the calculation of the real monthly interest rate, the following formula was applied:
r= [(1+i) / (1+p )] -1
Where: i is the nominal monthly interest rate; p is the inflation rate obtained through the monthly variation of the CPI and r is the real monthly interest rate.
Estimation of working conditions
The estimation of the working conditions of human persons (PH) aims to identify whether they receive any type of income and, as far as possible, approximate the nature of their employment relationship (for example, dependency relationship). To this end, databases available at the BCRA with information at the individual level were used, from which the following categories were defined:
- Employee relationship: PH 18 years of age or older who have a salary account.
- Self-employed worker: PH 18 years of age or older who do not have a salary account, but register a current registration in the monotax or self-employed regimes.
- Retirees: PH over 65 years of age who do not have a salary account or independent work record, who are assumed to receive some type of pension benefit.
- Informal worker proxy: PH between 18 and 65 years of age without a salary account or self-employment registration, but with a credit balance in the Central Debtors of the Financial System (CENDEU), which suggests the existence of some income outside of work in a relationship of dependency and registered independent work.
Glossary of abbreviations and acronyms
ACSF Complementary Financial Services Agency
ARG Argentina
ATM ATM
BCRA Central Bank of the Argentine Republic
BIS Bank for International Settlements
BP Payment Button
CABA Autonomous City of Buenos Aires
CAFCI Argentine Chamber of Mutual Funds
CBU Uniform Bank Code
CENDEU Central Bank of Debtors of the Financial System
CGAP Consultative Group to Assist the Poor
CNPHV National Census of Population, Households and Housing
CNE National Economic Census
NVC National Securities Commission
COELSA Electronic Clearing House
CVU Uniform virtual key
DEBIN Immediate debit
Der Law
EEFF Financial Institutions
EF Financial Institution
ENACOM National Communications Entity
EPH Permanent Household Survey
ETCNB Non-Bank Credit Card Issuers
FAS Financial Access Survey
CDF Direct Pool Fund
FCI Mutual Fund
FF Financial Trust
IMF International Monetary Fund
FOGAR Argentine Guarantee Fund
GPFI Global Partnership for Financial Inclusion
HB Home banking or internet banking
year-on-year i.a
IIF Financial Inclusion Report
CPI Consumer Price Index
Loc. Locations
LFIP Financing Line for Productive Investment
M Miles
MB Mobile banking o banca móvil
ME Foreign currency
Billion Millions
MSMEs Micro, Small and Medium Enterprises.
MPE Electronic Payment Methods
MPOS Mobile Device at Point of Sale
NEA Northeast Argentina
NOA Northwest Argentina
OECD Organization for Economic Co-operation and Development
ON Negotiable Obligation
OPNFC Other Non-Financial Credit Providers
PCT Transfer payments
PDA Access Points
FAQ Fixed Term
PH Human Person
PI Immediate Payments
GDP Gross Domestic Product
PJ Legal Entity
PN Net Worth
POS Point of Sale Device
p.p Percentage points
PSP Payment Service Providers
PSPCP Payment Service Providers Offering Payment Accounts
QR Quick Response code
S Semester
Sec. Secuendary
Shadow Fiend Financial System
SFA Expanded Financial System
NFPS Non-financial private sector
SGR Mutual Guarantee Companies
SUC Branch
T Trimester
TAS Self-service terminal
TNM Nominal Monthly Rate
TO Ordered text
TVI Year-on-year rate of change
UVA Purchasing Value Units
References
1 In Latin America and the Caribbean, and even more so in Argentina, the percentage of people who reported that they saved in the formal financial system was close to the percentage of people who reported having saved.
2 Financial service access points include branches, mobile branches, automated teller machines (ATMs), self-service kiosks (TAS), and complementary financial services agencies (ACSFs).
3 During the 2022 National Census of Population, Households and Housing (CNPHV), changes were identified in the universe of localities in our country. Throughout this report, population projections based on the results of the CNPHV 2010 are used for the periods prior to July 2022, while for the lower periods projections are used that are based on the results of the CNPHV 2022 (see Methodological Note for more detail).
4 ACSF’s data are provisional, while one EEFF has not submitted updates since March 2025.
5 The last CNPHV showed a net increase of 457 localities, which generates a change in the denominator of the indicator of localities covered. The newly incorporated localities concentrate a small part of the population, while the population of localities with FLW grew, which raises the indicator of the percentage of the adult population in localities with FLW.
6 Financial Access Survey. 2024 Highlights.
7 Financial Access Survey, IMF.
8 Globally, in 2022, non-bank ATMs accounted for 18% of all ATMs. RBR data services, Global ATM Intelligence Service.
9 Communication “A” 5928 and amendments. Section 1.
10 ATMs from the following operating companies are included: Cajero Express, Credimás, Gire, Hasar, Octagon, Orus Prosegur, Pago24 and Tico. The data is provided directly by the companies or by Red Link and NewPay.
11 One of the reporting companies reports that part of its devices are located in neighborhoods identified within the National Registry of Popular Neighborhoods.
12 Bank accounts include any type of account in a financial institution (banks and financial companies).
14 Communication A 8180. Points 1, 2 and 3; Resolution 4/2025. Ministry of Economy, Ministry of Industry and Commerce; Communication A 8226 and Communication A 8181.
15 The figures presented in this section are subject to revision and possible corrections that could affect some analyses.
16 Electronic payments are made up of: (1) Instant payments: (i) Transfers: includes interbank transfers and transfers to and/or from a payment account and does not include transfers between payment accounts of the same payment service provider (PSP) or within the same financial institution; (ii) PCT: includes payments with interoperable transfers and does not include payments with transfer between the same PSP; (2) Cards: debit, credit and prepaid; and (3) Immediate Debits and Direct Debits.
17 The amounts in this section are expressed at constant June 2025 prices (CPI June 2025 = 100).
18 A 2023 survey revealed that 25% of people answered that cash was their favorite payment method. Mckinsey & Company (2024). “The rapid evolution of payment methods in Latin America”.
19 The association between the growth of instant payments and the decline in cash payments could reflect further digitalization of the economy. The transition from in-person payments to e-commerce payments could be reducing cash payments, while the growing use of QR codes in merchants could be inducing immediate payments. In any case, instant payments are an indication of the increasing digitalization of payments. CPMI. 2025. “And so we pay: more digital and faster, with cash still in play”.
20 CPMI. 2025. “And so we pay: more digital and faster, with cash still in play”.
22 CPMI. 2025. “And so we pay: more digital and faster, with cash still in play”
23 The calculation includes people with bank and payment accounts and uses as a proxy the making of at least one debit in the quarter. Within debits, most of the operations correspond to payments or transfers made through electronic channels.
24 Approximate calculation based on an estimate. For more detail, see Methodological Note.
25 The amounts in this section are expressed at constant prices in June 2025 (CPI June-25 = 100). The savings and investment balances of the PHs include products in local and foreign currency. Balances in foreign currency are expressed in pesos and valued at the BCRA reference exchange rate (Communication A 3500) on the last business day of each month.
26 World Development Indicators, World Bank (2024). Argentina is among the group of upper-middle-income countries, according to the World Bank classification.
27 According to information from the BCRA and the CNV, some 19 PSPs and 21 EEFF offer Mutual Funds (CDFs) as of June 2025.
28 (i) Account balances: includes balances in bank and payment accounts; (ii) Term products: include fixed terms and UVA products; iii) Cash Pools: funds only under this modality (DCF); (iv) Mutual Funds: investment funds that are not money funds. They include fixed, variable, mixed income, among others (Other FCI).
29 There is a growing number of EEFF and PSPs that allow payments to be made immediately, using directly balances invested in DCFs.
30 This figure would rise to 74% if account holders of the main payment service provider are considered.
31 Includes fixed terms in local currency and foreign currency.
32 The number of PH holders of fixed terms is an estimate and the calculation does not yield single holders, since holders may have fixed terms in more than one EF. For more detail, see Methodological Note.
33 Throughout this document, the metrics consolidate unique debtors within the group of suppliers that they take as a reference. Duplication caused by multiple funding lines within the same provider and by funding across different providers in the same analysis group is eliminated.
34 Extended financial system (SFA) includes the financing of EEFF and/or PNFC. The latter lend with their own capital and must meet minimum requirements (such as registration, sending information and user protection).
35 The amounts in this section are expressed at constant prices in June 2025 (CPI June 2025 = 100).
36 See Financial Inclusion Report, first half of 2023, chart 18, for a comparison of the total financial cost of EEFF and PNFC personal loans.
37 Of the 367 PNFCs that reported debtors in June 2025, 48 are classified as fintech – that is, they offer at least one line of credit 100% through electronic channels. These companies accounted for 40% of the debtors and 24% of the credit balance of the PNFCs as a whole.
38 Credit Conditions Survey, point 2.4. BCRA.
39 42% of debtors who obtained title loans during the first half of 2025 did so through financial companies associated with automotive companies.
40 “MSMEs” are those individuals or legal entities that have a MSME certificate. The amounts in this section are expressed at constant prices in June 2025 (CPI June-25 = 100).
41 As of June 2025, certified MSMEs employed 2.8 million workers. According to the latest information available from the Observatory of Employment and Business Dynamics, MSMEs as a whole had 2.67 million employees as of June 2024. If we consider the universe of MSMEs with a certificate on that same date, the total amounts to 2.80 million workers.
42 The work of Supporting SMEs for more productive countries, of CAF (Development Bank of Latin America and the Caribbean) argues that there is evidence that the increase in credit lines for MSMEs contributes to increasing employment between 4% and 24%, even long after the loan has been received (lag effect). Auguste, Bebczuk, and Sanchez Firm’s paper Size and Credit in Argentina shows that access to financing for MSMEs drives growth in their size, leading to higher employment and sales.
43 OECD (2009), Two Sided Markets.
48 Ordered text “National Payment System – Payment Services”.
51 In addition to the commission, purchasers usually charge the monthly rent of the point-of-sale terminal (POS).
52 Decree DNU 70/2023 that modified art. 15 of Law 25.065.
53 TO Payment Service Providers.
54 See Glossary, CAFCI.
55 Information Regime for Supervision. Codes 999705, 999706, 889901 and 889902 – Number of forward transactions.
56 Information Regime payment service providers that offer payment accounts. Code 30000
Share on


