Executive summary
• The physical infrastructure of the financial system continued to expand during the first half of 2022 / The financial system registered 15.3 access points (ADPs) per 10,000 adults, 6.7% more than in December 2021, and 92.5% of the adult population lived in localities with ADPs. Likewise, four out of five people lived in localities with the widest range of face-to-face financial services according to the variety of types of PDAs installed. The physical and digital infrastructure reached a significant coverage of the population where, in most provinces, more than 80% of the population lived in localities with PDAs and Internet connection.
• Account ownership approached the total coverage of the adult population / In the first half of 2022, 1.3 million individuals were added to account ownership, which is accessed by 98.5% of the adult population. The most populated localities had a predominance of people holding both accounts (bank and payment), while in the less populated ones the possession of only bank accounts prevailed.
• Electronic means of payment (EMP) continued to record in the first half of 2022 Each adult made, on average, 10.8 monthly payments by electronic means, almost double the transactions made in the same period of 2020, as a result of the dynamics of electronic transfers (mainly those initiated on mobile devices) and debit cards. The latter MPE registered 4.7 payments per adult, being again the most used payment alternative.
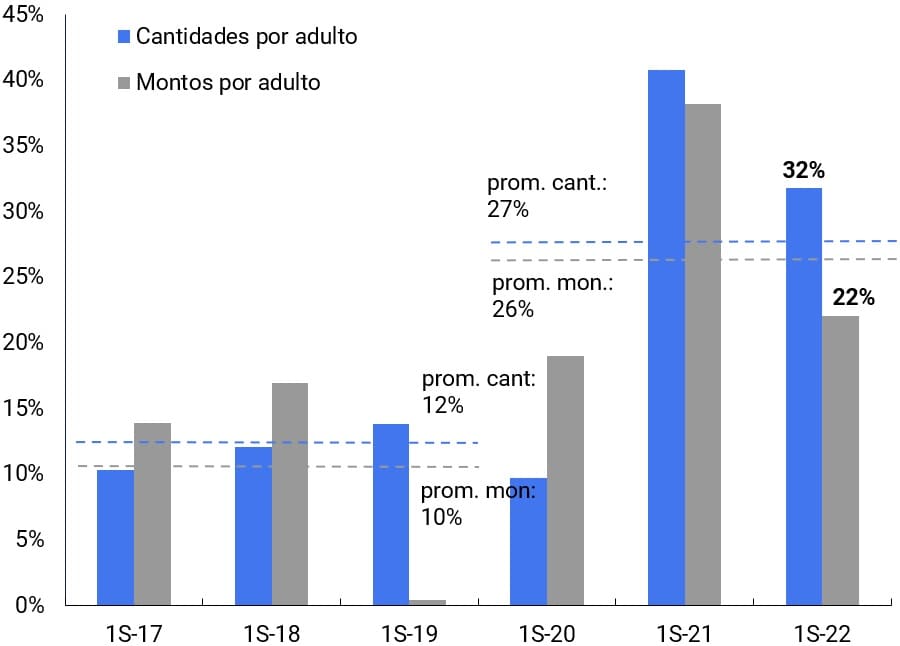
• Savers shifted from highly liquid products to alternatives that offer a higher return / In the second quarter of 2022, the number of fixed terms of individuals in local currency was 1,300 fixed terms per 10,000 adults, which represented a six-month increase of 32%. Within the immediate liquidity products, there was an increase in the share of the balances of the Mutual Funds from 3.2%, corresponding to the quarterly average of 2020, to 5.2% in March 2022. When considering short- and medium-term savings instruments, UVA products registered an increase in their participation, from 4.9% to 9.1% under the same period of analysis.
• During the first half of 2022, the percentage of adults with financing from the expanded financial system (SFA) increased by 2.4 p.p. / Public banks and non-financial credit providers (NFCPs) added new people to credit products. In particular, the PNFCs registered a significant increase in the number of people assisted, although with considerably lower average balances than those of financial institutions (EEFF). In this last group, young women, who would not have a job in a dependent relationship and did not have EEFF financing, prevailed.
• The gender composition and their respective gaps in the composition of the authorities of the LFES have statistically significant impacts in terms of gender gaps in access to credit / Between 2004 and 2021, women gained participation both in their representation in management positions of the EFFs and in the amount of credit assistance received. However, gaps still persist in achieving gender parity. A greater participation of women in management positions has a favorable impact, in particular, among those LFES that do not have a payroll of clients who accredit their salary in the FI and significant impacts are observed linked to the age and seniority composition of those who occupy leadership positions. It also describes how the results observed depend on the characteristics of the users in terms of accreditation of remuneration and irregularity ratios, the type of financial institution involved, the state of the economic cycle, the evolution of the COVID19 pandemic and the relevance that is socially assigned to move towards a situation of greater parity between the genders in terms of assuming responsibilities and enjoying rights.
• Credit to MSME companies exhibited an increasing trend both in number of companies and financing balance / Between December 2019 and the same month in 2021, MSME companies with financing in the SFA grew by 222,000 units, mostly micro and small. The share of credit to MSMEs in the total portfolio of financing of the non-financial private sector amounted to about 16 p.p., exceeding 50%.
Indicator Table | Financial inclusion in Argentina

Notes: (1) This includes access points for financial institutions (branches, mobile branches, ATMs, self-service terminals, and complementary financial services agencies) and ATMs operated by non-financial institutions.
(2) Monthly average for each year.
Local context
Developments in economic activity, employment, and incomes continued to create and sustain favorable economic conditions for financial inclusion during the first half of 2022. However, differentiated behaviors prevailed for different relevant variables. While the Gross Domestic Product (GDP), employment, and private consumption continued to expand during this period1, the real income of salaried persons exhibited a relatively stable behavior2. For their part, the economy’s benchmark interest rates generally showed an upward trend in the first half of the year, while incentives that contribute to the process of financial inclusion prevailed.
The increase in the level of economic activity tends to favor indicators of use of retail electronic means of payment (MPE), access to financing and savings. On the other hand, the behavior of real wages in the first half of the year establishes, in principle, upper limits both to the average financing balances and to the average amount of transactions with MPE that could be observed. Prudential regulation, as well as customary practices, set limits on the quota-to-income ratio of loans. Thus, given the term and interest rate of the loan, the stability of income in the first half of 2022 implies that no increases in the installment and, therefore, in the financing balance should be expected. Finally, an increase in the interest rate, insofar as it contributes to strengthening savings in domestic currency, may adversely affect the demand for credit if the regulatory incentives to sustain consumer and investment financing are discontinued.
In this regard, in the period in question, the BCRA raised the monetary policy interest rate with the aim of safeguarding the value of investments made in domestic currency3. At the same time, but acting as a counterweight and specifically aimed at financing MSMEs and household consumption, the BCRA used its financial regulation tools to stimulate production and access to financing for these segments. On the one hand, the validity of the Financing Line for Productive Investment (LFIP), assistance aimed at granting credit for commercial activity, was extended until September of this year under preferential financial conditions for MSMEs4. In turn, it reduced on successive occasions the minimum cash requirements for those financial institutions (EEFF) that grant financing to MSMEs through LFIP5. On the other hand, in terms of financing to individuals (PH), the BCRA continued to establish ceilings on the compensatory interest rate for financing with bank credit cards6. It also maintained the incentive to finance consumption in installments through the reduction of minimum cash requirements within the framework of the Ahora 12 7 Program. The BCRA also continued with its policy of encouraging the inclusion of new people in the financing of financial institutions through the reduction of minimum cash requirements8.
By means of these differentiated policies aimed at certain productive units and PHs, the BCRA seeks to decouple its conditions of access to credit from the general conditions. These segments are characterized by having fewer financing options and their ability to access financing depends significantly on the interest rate. On the other hand, the indicators of credit demand perceived by the LFS revealed that households maintained or tended to moderately increase their demand for personal loans and other consumer financing. The increase in household demand for credit would be explained to a greater extent by the growth in consumption9.
Regarding the number of users of communications infrastructure, in the first half of 2022 the growing trend in household internet access (both fixed and mobile) continued10. The population’s access to this service makes it possible for new people to enter the use of home banking, mobile banking and electronic wallets, three channels that, in turn, stimulate digital financial inclusion. In recent years, the BCRA has been working on the expansion of the Payment by Transfer (PCT) scheme, a new means of electronic payment that, supported by the infrastructure of immediate transfers, allows its use for payments in stores (both face-to-face and remote). Recently, to facilitate operations through digital wallets, the BCRA provided that people can enroll their bank or payment accounts from other EEFF or Payment Service Providers (PSPs) in them. Thus, people can make PCT or immediate transfers from a digital wallet through funds deposited in linked accounts without the need to load funds into the wallet previously11. This expansion of the PCT scheme also includes security and fraud prevention measures for financial users. In this way, the ESFFs and PSPs must enable the necessary mechanisms to prevent suspicious and fraudulent transactions12. Finally, it was established that all EEFF and PSPs that offer digital wallets to make transfer payments initiated by QR codes must be registered in the “Interoperable Wallets Registry”13.
1. Financial infrastructure
The physical and digital infrastructures of the financial system play a complementary role so that all people can access financial services even if they have different digital profiles14. While the COVID-19 pandemic accelerated the pace of digitization of financial services, the trend toward digital financial products and services had already begun. In any case, social distancing measures led human persons (PH) and productive units to quickly adopt these services in their daily habits15.
Digital channels demonstrated their strengths over face-to-face channels by saving users time in regular transactions and by offering full-time (24 hrs) availability of services. As a result, the number of ATM transactions and the number of branches showed a decline in recent years, even before 202016.
However, access to face-to-face financial services, for example through branches, continues to be essential for certain operations and user groups, particularly for people with less digital skills. As rapid digitalisation can create or exacerbate the risk of financial exclusion for certain vulnerable populations, physical infrastructure plays a crucial role in providing channels of care and assistance to people who have difficulties in carrying out digital transactions for different reasons17.
Physical infrastructure. Financial services access points (PDAs) are made up of those with human attention (branches and complementary financial services agencies – ACSF-), and self-managed electronic devices (ATMs and self-service terminals -TAS-). Points offer users different types of services and transactions, so both the quantity and variety of available PDAs affect the quality of coverage.
As of June 2022, the financial system recorded 15.3 PDA per 10,000 adults, a 6.7% increase from December 2021. The increase in the number of PDAs is mainly explained by the points with human attention, which registered a 15.6% increase compared to 0.5% of self-managed electronic devices. Within the set of PDAs with human attention, the branches – which offer the widest range of products and services – did not show significant changes in their number or in the coverage of localities18. For their part, the ACSFs – which mostly provide services for payment of services and cash withdrawal and deposit – sustained a growth in the number of19 points. However, these new locations have not generated an improvement in the coverage indicator of localities with PDA, which has remained practically constant since December 2021.
Graph 1 | Financial Services Access Points
Quantity of PDAs

Locality and adult coverage

Note | Graph on the right: shows the percentage of localities with at least one PDA and the percentage of the adult population living in localities with PDA.
Source | BCRA, networks and INDEC.
In relation to self-managed electronic devices, the slight increase recorded during the first half of 2022 was driven by the incorporation of new ATMs while the number of TAS did not register significant changes. In relation to ATMs, the increase in devices with biometric readers that allow users to identify themselves by their fingerprints20 was highlighted. However, compared to the same period of the previous year, there was a slowdown in the growth of self-managed electronic devices, which went from 1.0% in 2021 to 0.5% in 2022. On the other hand, the increase in the number of transactions by electronic means of payment (See Section 3.1) implies that certain transactions that were carried out in person will move to the digital world, reducing the relative importance of the physical infrastructure for face-to-face service.
The Argentine Northeast (NEA) and Patagonia registered the highest percentage of localities with at least one FLW with 68% and 60%, respectively. But, at the same time, the provinces that make them up showed a dissimilar density of FLW – measured as the number of ADP per 10,000 adults – dissimilar. Thus, although population coverage is widespread throughout the territory (in 22 of the 24 first-order jurisdictions, more than 80% of adults live in localities with FLW), the different levels of ADP density show differences in quality between provinces when accessing the physical infrastructure of financial services.
Table 1 | PDA and connectivity by province

Note | Average fixed Internet download speed (Dec-21), number of Internet accesses by province (Mar-22), localities with connectivity (Aug-22) and PDAs (Jun-22) / “Number of Internet accesses” groups the jurisdictions of CABA and Buenos Aires / Connectivity data includes fixed and mobile connection / The difference between the percentage of adults living in localities with PDAs and with connectivity and the total number of adults includes both people living in localities without PDAs or without connectivity as a dispersed rural population.
Source | BCRA, networks and INDEC.
In previous editions of the Financial Inclusion Report21 , it was mentioned that localities with more population tend to have a greater variety of PDAs, which directly impacts the quality of coverage given that each type of PDA offers differentiated services and transactions. The possibility of receiving assistance from bank staff in a branch reduces barriers to access financial products and services, especially for vulnerable populations, such as the elderly or people with limited digital capabilities. In this regard, public banks and entities that act as financial agents of provincial governments play an important role in reaching smaller localities and assisting their populations with more frequent situations of vulnerability22.
As of June 2022, 17.1% of the country’s localities registered the PDA combination that implies the largest offer of face-to-face financial services, with at least one branch, one ACSF, one ATM, and one TAS. These localities concentrated 83.3% of the adult population, which implies that four out of five people lived in a locality with the widest range of face-to-face financial services. While the configuration that includes the four main types of PDAs is the most complete, all combinations containing at least one branch do not diminish the service offering. In this way, 28.5% of the total number of localities in the country had a full offer of face-to-face financial services and covered 88.4% of the adult population.
On the other side of the spectrum, 15.1% of the country’s localities had only one type of PDA, either an ACSF or an ATM. Critical financial services such as cash withdrawals and deposits, and financial services linked to social security, are offered in these localities. These localities registered smaller populations, concentrating only 1.6% of adults.
Table 2 | PDA combination. Percentage of localities and adults by region
Data as of June 2022 and expressed in %

Note | The percentage of adults without FLW includes those living in localities that do not have FLW coverage and the dispersed rural population.
Source | BCRA, networks and INDEC.
In regional terms, the ACSF + Branch + ATM + TAS configuration is the most frequent in the localities of the Central region, while for the other four regions there are other less varied combinations of PDAs that are repeated in more localities. However, the most complete configuration is the one that covers the largest population in each of the regions. Cuyo, NEA, NOA and Patagonia registered a higher percentage of their localities covered by only one type of PDA (ACSF or ATM) than the Central region, so their inhabitants had a more limited offer of face-to-face financial services.
Digital infrastructure. The demand for digital financial services, which accelerated even more in a context of restrictions on movement caused by the COVID-19 pandemic, led financial institutions (EEFFs) to focus their efforts on developing electronic channels that meet the needs of users, with greater functionalities and a better user experience. The main EEFFs, both public and private, have made available to their customers adaptations to their home banking and new versions of their mobile applications – mobile banking and electronic wallets – that allow electronic transfers, payments for products and services, channeling savings and making investments, among other operations. The possibility of carrying out these transactions digitally reduces the need to go to a PDA.
However, it should be considered that in order to carry out transactions in the digital environment, certain initial conditions are required, including the possession of electronic devices, internet connectivity and digital knowledge. All these factors can present barriers to access and use of digital financial services23.
As of August 2022, 82.8% of the localities (which concentrated 93.5% of the adult population) reported at least one fixed or mobile connection to the Internet, although this does not imply that all people in those localities had access to a connection. 55% of the total localities reported both types of connections, so 90% of the total population registered both fixed and mobile connectivity in their locality24. On the other hand, as of December 2021, 64.2% of urban households had access to a computer and 90.4% to the internet, while 88 out of every 100 people used a cell phone and 87 out of every 100 used the internet25. These values indicate that device ownership and internet access are widespread.
Although at the national level the availability of connectivity seems to be high, disparities were recorded between the provinces. As can be seen with the physical infrastructure, the Central and Patagonia regions presented better indicators of the percentage of localities that reported Internet connection (fixed, mobile or both), adults residing in localities with connection and number of accesses in relation to the adult population. NOA, NEA and Cuyo presented less favorable connectivity indicators, which conditions access to digital financial services that could complement and compensate for the lower relative physical infrastructure.
On the other hand, in addition to the availability of connection, other factors must be considered that impact on access to and use of digital environments and in turn limit the use of digital financial services. If the quality of internet service is limited, the connection may not be sufficient for people to operate through home banking or mobile banking26. The case of connectivity in Tierra del Fuego is illustrative, in which although 99% of adults lived in localities with fixed and mobile Internet connections and 1.27 accesses per adult were registered (above the national average), the download speed was almost 3 times lower than the national average27.
On the other hand, there are differences in terms of the investment and costs necessary to make available and make use of the physical and digital infrastructure of financial services. In the first case, the investment and maintenance expenses are mainly made by the EEFFs, while in the second case there are costs for both parties. For the user, access to digital financial services depends on an initial investment in equipment and facing a monthly maintenance cost. In this case, there could be barriers to the adoption of these channels depending on the prices of communications services.
Finally, there are provinces such as Santiago del Estero and Chubut in which connectivity and physical infrastructure indicators were recorded below the national average. Geographical (such as the size of the territory), demographic (such as population dispersion) or economic issues can influence the coverage of both physical and digital infrastructure, as well as access to and use of it. However, there is still a long way to go in terms of improving the levels of access to face-to-face and digital financial services throughout the territory and, particularly, in the least favored provinces.
2. Account Holding
In the second quarter of 2022, the number of individuals (PH) who owned at least one account stood at 34.6 million. This implies that 98.5% of the adult population had access to an account to make payments and transfers and to build savings and/or investments. In this way, the total number of account holders registered an increase of 1.3 million compared to December 2021 and 1.9 million people compared to June of the previous year, which translated into a six-month increase of 4% and a year-on-year increase of 5.8%.
Graph 2 | Holding bank and payment accounts
In millions of people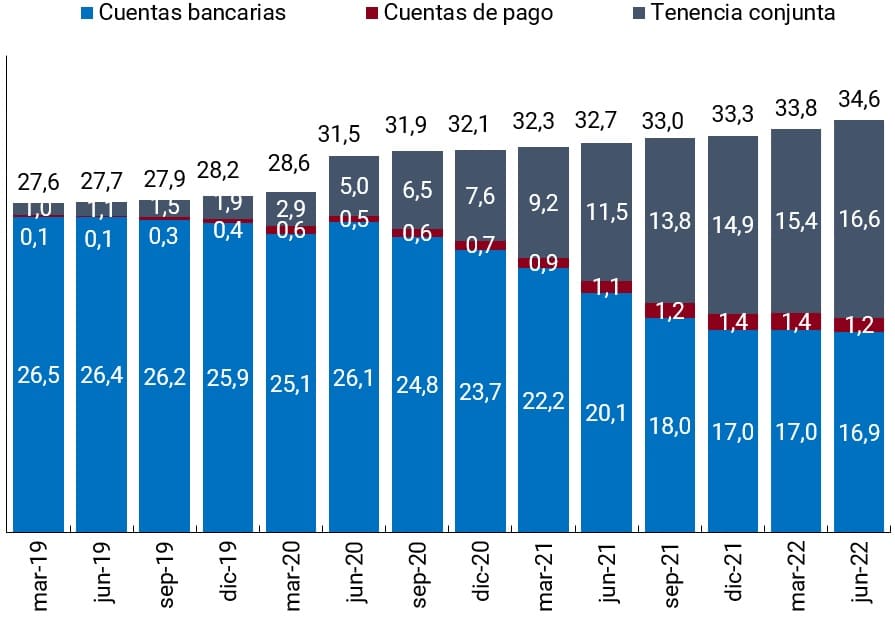
Percentage of adult population

Note | Bank accounts: people who only have this type of account and do not have payment accounts; Payment accounts: people who only have payment accounts; Joint tenancy: people who have bank and payment accounts; At least one account: people who have at least one bank and/or payment account.
Source | BCRA based on COELSA and INDEC.
At the international level, countries still have challenges in reliably identifying the number of people with at least one deposit account. This difficulty was even greater more than fifteen years ago when financial inclusion began to be promoted. In the absence of information on the demand side, the World Bank, through the Global Findex survey, began to collect information around 2011 that, with the limitations of case28, would allow for a first approximation of account holding and other indicators of financial inclusion.
This survey, having a significant number of countries, allows us to compare, assuming that the rest of the context is similar, variables of financial inclusion at the international level and, given the scarcity of data on the subject, it is taken as a point of reference. However, with respect to the holding of bank and payment accounts, Argentina has an advantage because the statistics available at the BCRA allow the population with accounts to be accurately identified.
With these differences pointed out, the results of the Global Findex 2021survey 29 indicate that account ownership by the adult population in Argentina amounted to 72% in 2021. This value is more than 20 p.p. below those of the BCRA (see graph 2, right30), although the gap was reduced with respect to the survey carried out in 2017, where the reported value was 51%, while BCRA data indicated 80.4%31. Although it remains at a high level, the gap between effective account ownership and receipt of accounts has narrowed by 7 p.p. in recent years.
Graph 3 | Account holding: BCRA vs. Global Findex data comparison
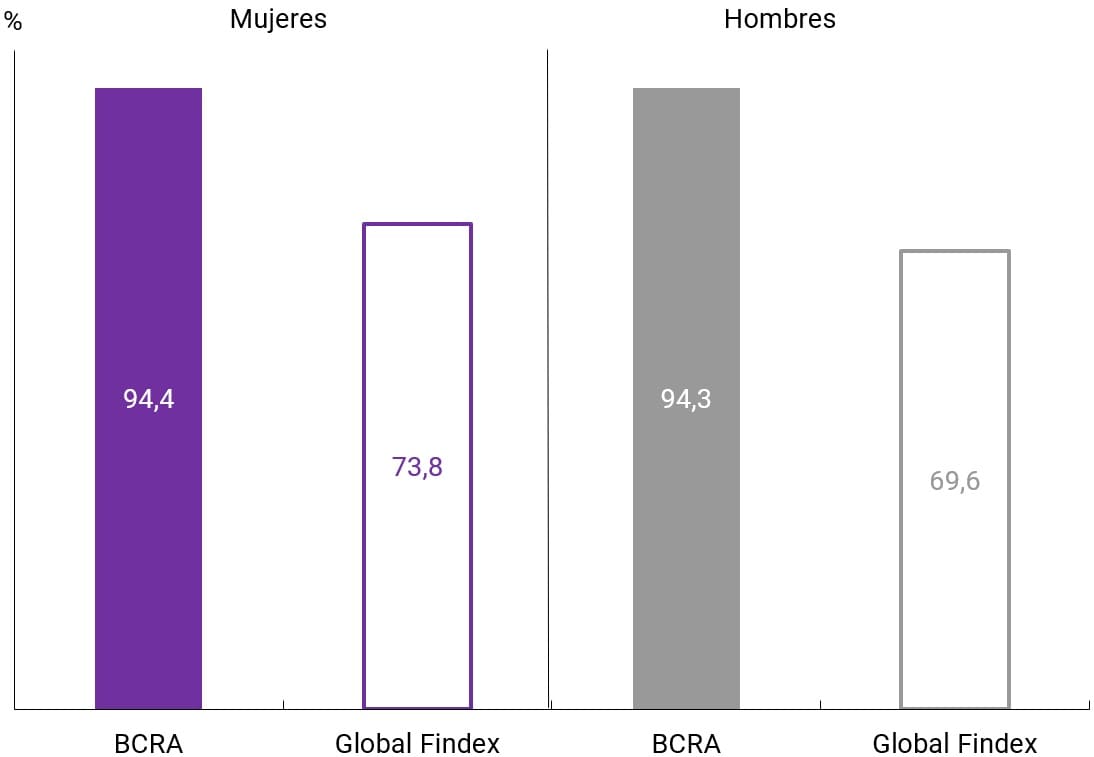
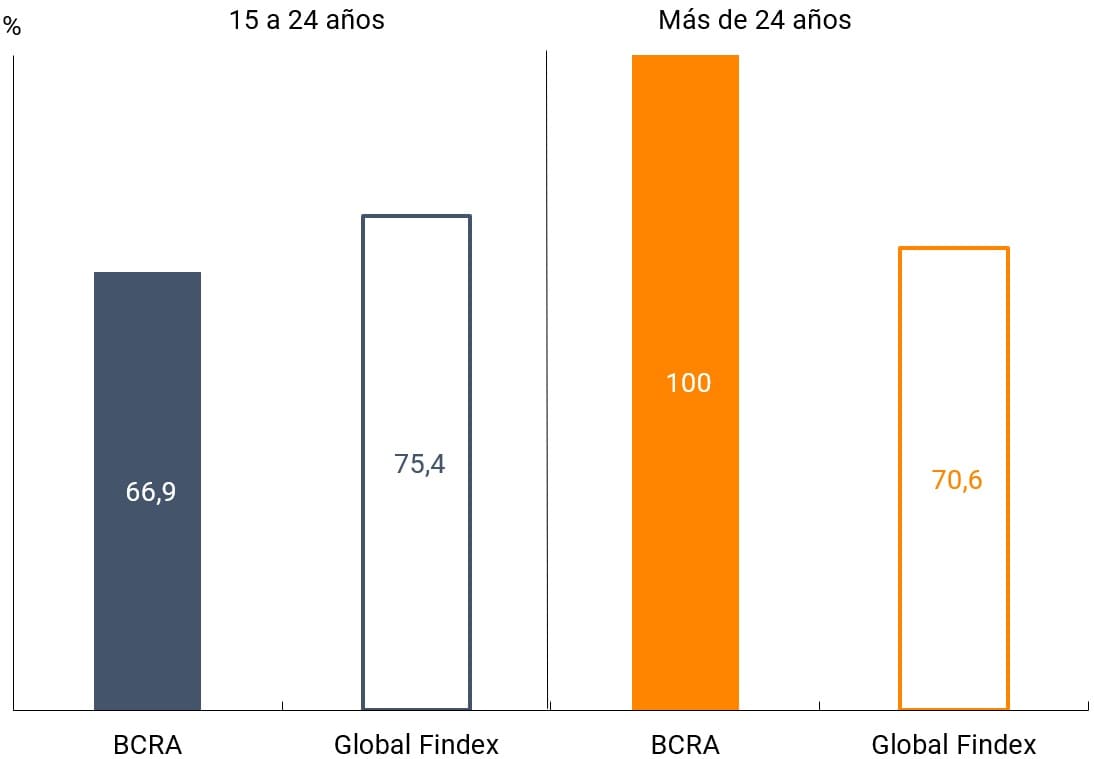
Note | BCRA data as of December 2021 and Global Findex 2021.
Source | BCRA based on COELSA and the World Bank.
When segmenting the survey responses by gender and age group, population groups with differences greater than 23 p.p. recorded in the global indicator are observed. This happens in the holding of registered accounts for men with gaps of 24.8 p.p. and for people over 24 years of age with gaps of 29.4 p.p. In this sense, and attentive to the different sources of information in the data, the existing gap could reflect people’s lack of knowledge of having an account, confusion with another financial product (debit card) and even a preference for not providing information about it. Likewise, the case of people between 15 and 24 years of age registers a peculiarity because the perception of having an account is greater than the effective possession of it. This reversal in the gap could be explained by the holding of accounts in environments other than those consulted in the survey or by extensions of debit cards of other holders (for example, from parents to children).
Analysis by localities. As of June 2022, 55% of the country’s localities had full account coverage, that is, all adults in these localities had at least one account (19 million people). At the other extreme, only 8% of the localities had less than 30% coverage and 7% of the localities registered zero coverage (both groups add up to a total of 330 thousand people)33.
NEA was the region with the highest proportion of localities with full account coverage, presenting a difference in its favor of between 12 p.p. and 17 p.p. with respect to the other regions. The adult population of these localities accounted for 93% of the total NEA. The exclusive holding of bank accounts (57%) is the most influential factor in the coverage of these localities, followed by the joint ownership of bank and payment accounts (41%).
The Central region, although its indicator of localities with full tenure is relatively low, is one of the areas with localities where 70% or more of its population had an account and, simultaneously, the percentage of localities whose adult inhabitants did not have an account is also low.
Figure 4 | Distribution of localities according to the degree of coverage of their population with accounts
Data as of June 2022

Note | Tenure expresses the percentage of adults who have at least one account, considering both bank and payment accounts.
Source | BCRA, COELSA and INDEC.
When segmenting the localities according to their adult inhabitants, it is observed that in the most populated localities, the joint possession of bank and payment accounts predominated. This configuration is repeated in all regions except in the NEA region where the exclusive possession of bank accounts prevailed. The most populated localities show higher development indices, which could be linked to higher levels of income and education34, while in the less populated localities the impact of social programs and plans on the banking penetration of their population has an impact.
In fact, as the adult inhabitants of the localities are reduced, the participation of people with only bank accounts increases. Although this phenomenon occurs in all regions, the predominance of exclusive bank account ownership begins in different strata of the adult population. In the Central, Northwestern and NEA regions, the change begins in localities with a significant number of adult inhabitants (more than 50 thousand), while in Cuyo and Patagonia the predominance begins in localities with less than 5 thousand adult inhabitants. This configuration shows the growing penetration of payment accounts in localities with different levels of adult population, although with different intensity depending on the region.
Graph 5 | Participation of the adult population with accounts based on the combination of accounts and adult inhabitants in the localities
Data as of June 2022 and expressed in %


Source: BCRA, COELSA and INDEC
3. Electronic means of payment and savings and investment modalities
3.1. Electronic means of payment
The use of electronic means of payment (EPM) continued its expansion in the first half of 2022. The number of transactions and the amounts operated per adult35 continued to grow above the pace recorded prior to the COVID-19 pandemic. Each individual made an average of 10.8 monthly payments by electronic means, which constitutes a new record value that doubled the operations recorded in the same period of 2019 and is mainly explained by the boost of electronic transfers and debit cards.
Graph 6 | Transactions with electronic means of payment (MPE)
Amount per adult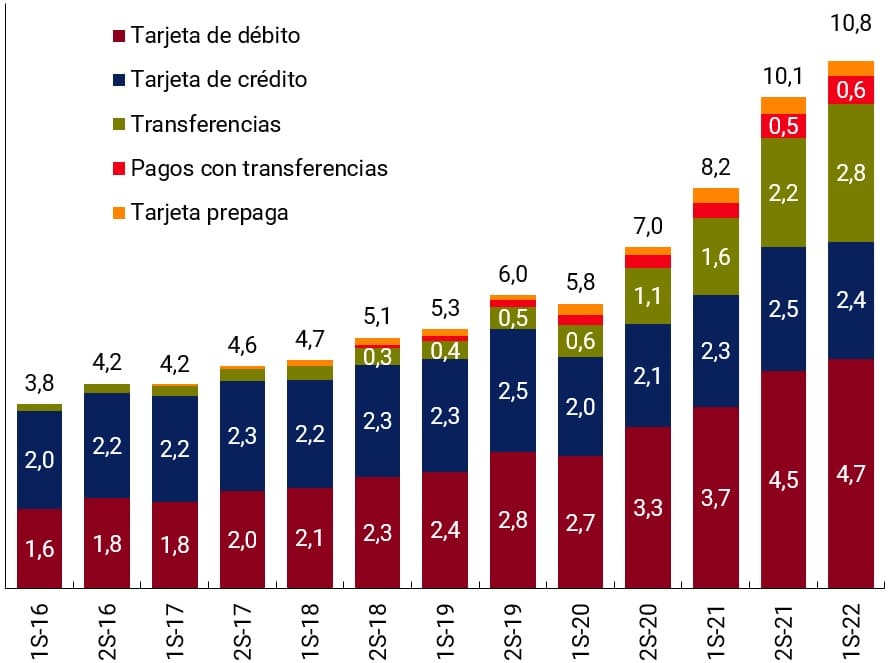
Year-on-year rates of change (y.a.)
Note | Monthly average of operations within each period. S: semester. Graph on the right: The lines show the average for the first half of the years 2017 to 2022.
Source | BCRA, INDEC and networks.
This dynamic reaffirms the greater adoption of digital alternatives for everyday payments, a behavior that was also reflected in the increase in the adult population in Argentina that responded to having made a digital payment36 in 2021 (59%) compared to what was answered in 2017 (32%) according to the Global Findex 2021 survey37. The high use of cell phones and the internet (88 and 87 out of every 100 people, respectively)38 and the high coverage of the population with accounts have been favorable initial conditions for the expansion of MSEs on the consumer side.
On the merchant side, the combination of new collection channels, the application of technology in this process, and better conditions in terms of the time frame for crediting funds and the cost of operations facilitated the greater adoption of MPEs39. In this way, businesses that already offered MPE have the possibility of adding new alternatives and improving the conditions of existing ones, while those that did not offer MPE can provide electronic payment options at a low cost and in accordance with their infrastructure level40.
Wire Transfers41. Both those originating in bank accounts and payment accounts continued to set all-time highs. During the first half of 2022, each adult made an average of almost 3 transfers per month, a number that practically doubles those made in the first half of 2021 (1.6). This growth was explained to a greater extent by the performance of transfers initiated on mobile devices, considering those made from bank accounts through mobile banking and those originating from payment accounts42. The contribution of the latter group to the variation in total transfers was 45.5 p.p. of the total variation of 79.5%, while that of those not originating in mobile devices was 34 p.p. For its part, the amount transacted per adult also grew compared to the first half of 2021, but at a slower rate than the number of operations. This phenomenon of greater growth in the number of operations than in the amounts transacted has occurred since 2018.
Figure 7 | Average transfers and participation according to the source and destination account
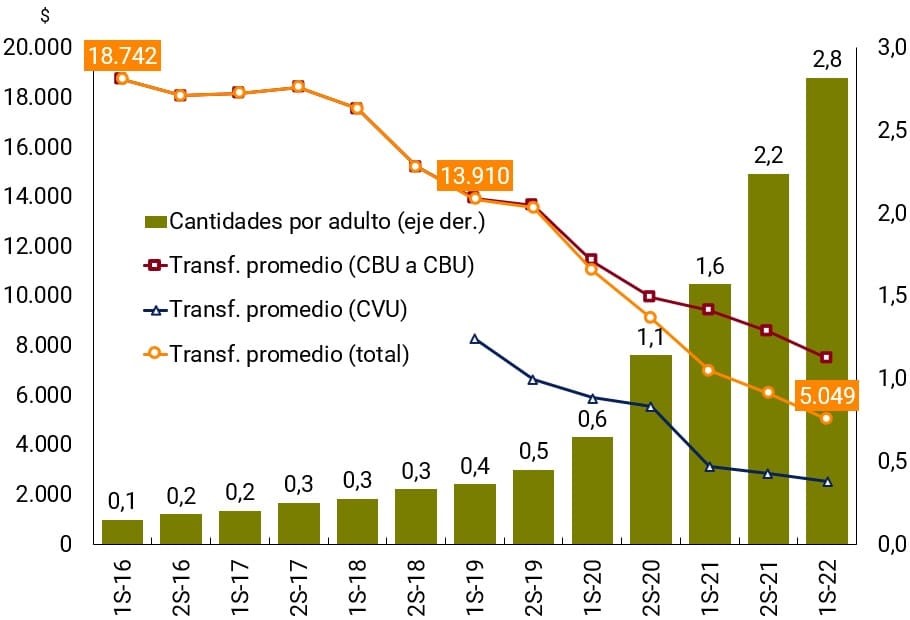
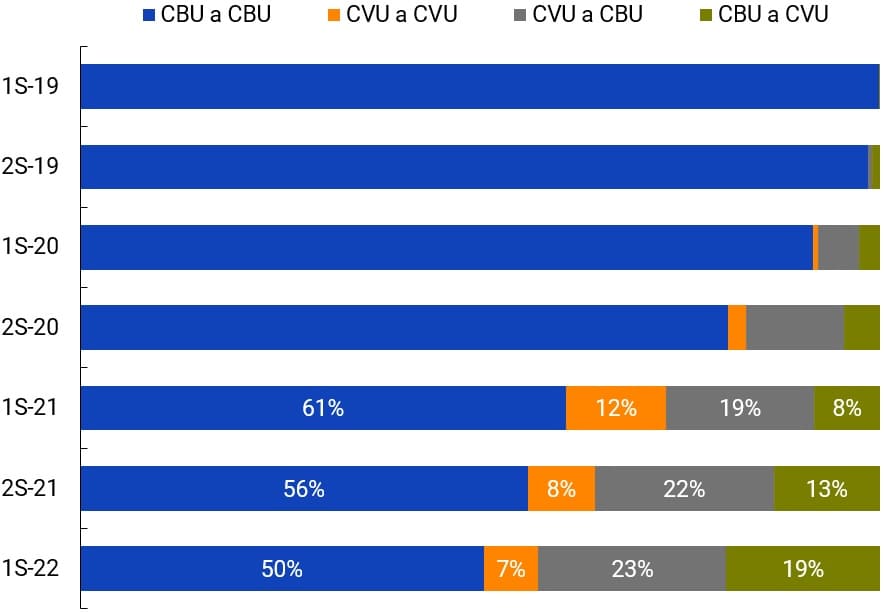
Note | Graph on the left: average transfers per operation at constant prices in January 2019 (CPI January 2019 = 100). “Amounts per adult” includes all wire transfers. Graph on the right: number of trades. CBU to CBU: Interbank transfers. CVU: transfers involving payment accounts as the source and/or destination account. S: semester.
Source | BCRA and INDEC.
This behavior was reflected in the fall in real terms in the average value of total transfers, as well as in the case of interbank transfers (CBU to CBU) and those that mobilize funds with and between payment accounts. This shows that the incorporation of these latter transfers was not solely responsible for causing a decrease in the total average value. This fact could be explained by the existence of more cases of use of transfers together with their greater adoption in people’s regular payments, which usually involve relatively lower values to meet their daily expenses. As mentioned above, the high use of cell phones and the internet were key factors in the trend of more operations for smaller amounts. In addition, immediate transfers are, in terms of commissions, accreditation deadlines and security of the operation, the most convenient means of electronic payment.
During the first half of 2022, transfers between bank accounts and payment accounts continued to gain traction and reaffirmed the importance of interoperability between different providers. Thus, the number of “cross-transfers” tripled (1.2 monthly operations per adult) compared to the same period a year earlier, reaching an all-time high participation of 42% in the total of these operations.
Table 3 | Wire transfers based on source and destination account
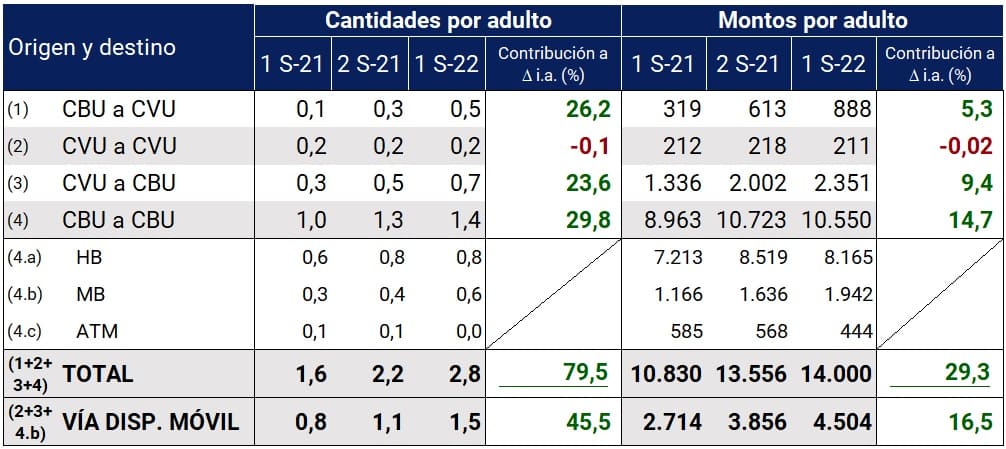
Note | S: semester. The values represent the monthly averages of each semester and the amounts are expressed in constant pesos of January 2019 (CPI January 2019 = 100). The contribution rate to the total change is calculated as the contribution of each type of transfers (1 to 4) to the change in total transfers.
Source | BCRA and INDEC.
Interbank transfers (CBU to CBU) also reached the highest value in their series (1.4 transactions per adult per month), almost 50% more than in the same period a year ago. The mobile banking channel continued to demonstrate its prominence with three-digit YoY rates recorded in the last 5 semesters. In the first half of 2022, 3 out of 7 interbank transfers were initiated in this way, while a year earlier, the metric was 2 out of 7. Although the movements of funds through this channel have also gained space in the total (18% in 1 H-22 vs. 13% in 1 H-21), their increase is more moderate than the amounts traded. This would reflect a less progressive change when choosing to trade more significant sums through mobile devices together with a greater confidence and/or preference for carrying out these transactions via home banking.
Overall, interbank transfers via mobile banking together with those originating from a payment account reached 52% of the total amount of electronic transfers during the first half of 2022. This implied an increase of 4 p.p. compared to the value recorded in the first half of 2021. As mentioned in the last Financial Inclusion Report43, the improvement in the offer of mobile applications by the EFFs and PSPs would explain the greater dynamism in this channel.
Payments by Transfer (PCT)44. During the first half of 2022, each person made an average of 0.6 payments via PCT, equivalent to 83% more than what was operated in the same period of 2021, while in terms of amount per adult, 24% more was channeled than during the first half of 2021.
Figure 8 | PCT Operations
Quantity per adult
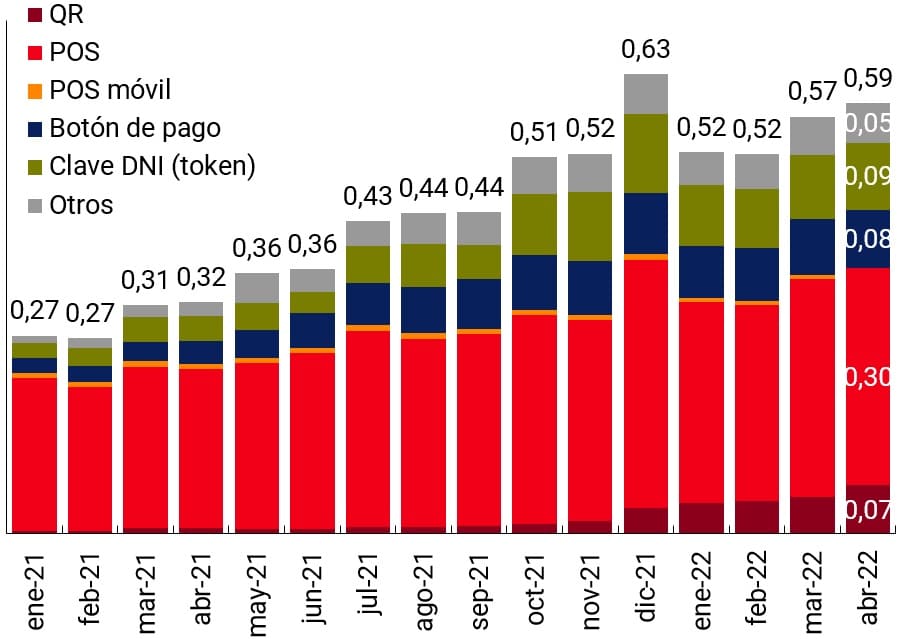
PCT and debit card by channel – Amount per adult
Note | Latest available data on PCTs disaggregated by initiation modality: April 2022. “Other channels”: Includes all operations that originate from channels other than POS devices.
Source | BCRA and INDEC.
As during 2021, a significant proportion of operations (52%) were conducted via point-of-sale (POS) terminals during the first 4 months of 202245. However, and despite registering an increase equivalent to 35% compared to the first quarter of 2021, PCTs initiated via POS have lost ground compared to those originating in more innovative methodologies such as the reading of interoperable QR codes. PCTs through QR codes multiplied by 9 compared to the first quarter of 2021, although they represent only 9% of the total operations in the first four months.
During the month of April, customers who made PCT through QR mostly did so from bank accounts (88%) while merchants credited that money mainly to payment accounts (65%).
In debit card or PCT payments, the movement of funds for the user is similar as it involves an immediate debit to a bank or payment account, depending on the instrument used. From the point of view of commerce, PCTs have benefits over traditional debit card payment schemes given by the immediate crediting of funds and by a commission that does not exceed 8 per thousand, while outside this scheme the commission can be higher than 6%.
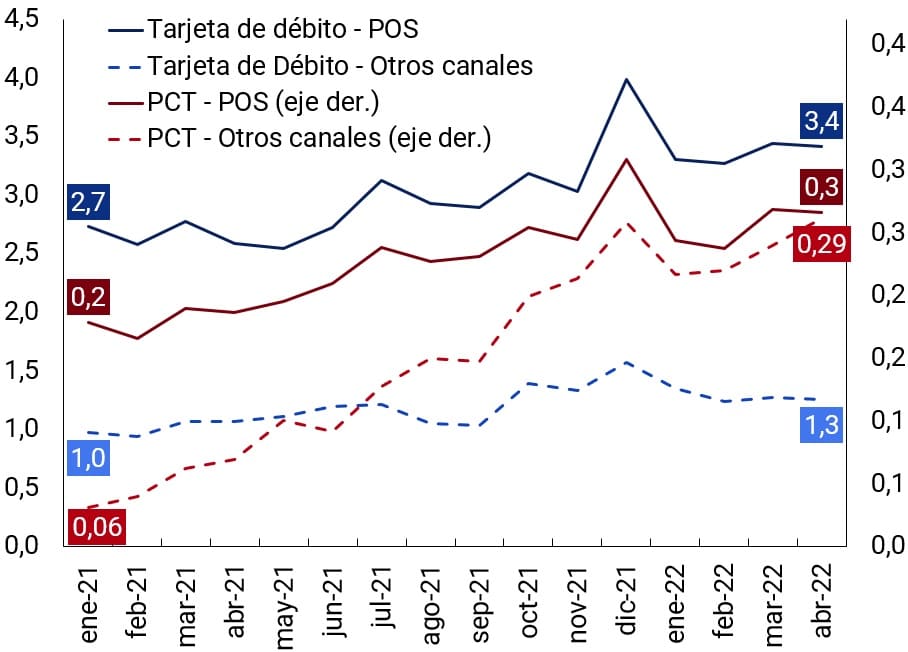
On the other hand, most PCTs are initiated through a POS 46 device. In this sense, it is relevant to compare the evolution of debit card payments corresponding to traditional payment schemes with respect to PCT, differentiating them by initiation modality (POS or other channels), in order to investigate whether there is a substitution effect or there is room for growth for both products. In the case of PCTs originated through POS, and with levels that differ significantly given the validity of each instrument, the dynamics during the last 15 months have been quite similar to that experienced by traditional debit card payments in this channel with a similar trend and rates of change. This could illustrate that, a priori, these are complementary payment tools.
On the other hand, if it comes to payments that originate in more innovative modalities, a better performance of PCTs (Other channels) is observed in relation to those made with debit cards through schemes other than POS (remotely, via mPOS and QR). Given that both types of payments include the reading of QR codes, this incipient trend could show that PCTs could be more chosen by merchants, given the associated benefits in costs and crediting of funds, when it comes to using more cutting-edge technologies. Globally, payments based on the instant transfer scheme such as PCT, had a boost from the COVID-19 pandemic, although their transactions are at low levels compared to credit and debit card systems47.
Cards. During the first half of 2022, the debit card continued to be the most widely used electronic payment alternative by the adult population. Out of a total of 10.8 payments per month, 4.7 were made with debit cards, considering both POS (fixed or mobile) and QR code reading and remotely. This is equivalent to an increase of 27% compared to the same semester of the previous year. The variations in the amounts per adult have been more modest, as in most PEMs.
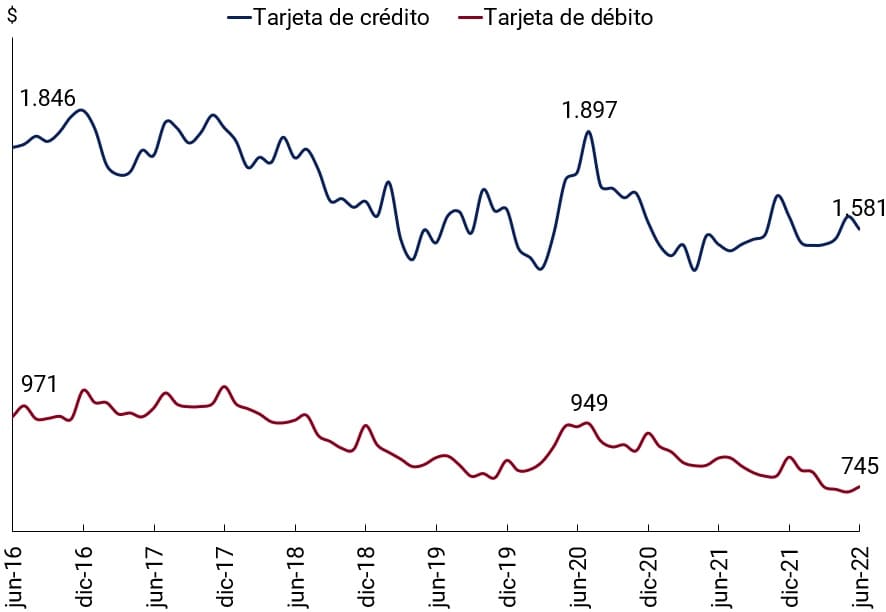
In this way, the average value of each operation in the first half of the year registered a new decrease after the increases that were reflected in 2020 explained by the effects of the COVID-19 pandemic. The downward trend in the average value of transactions in the last 6 years, with increases in amounts higher than those in amounts, illustrates the progressive penetration of the debit card in the usual payments of people that involve relatively lower amounts to cover their daily expenses. This phenomenon is reflected in the higher percentage of the population that responded to the Global Findex survey having used their debit card during 2021 compared to the previous survey in 2017 (37% vs 22%)48. A similar trend is also evident in the payment of sales in supermarkets, where the amount paid with debit cards grew 9% compared to the same period of the previous year and reached a share of 28.7%49 compared to 27.1% in the same half of 2021.
In the first half of 2022, for the first time since the COVID-19 pandemic, the monthly average of debit card payments through POS grew above operations that were channeled through other channels (remotely, mPOS and QR codes), both in number of transactions per adult (29% vs 22%) and, more pronouncedly, in amounts per adult (20% vs 1%). This change in trend could respond to a regularization of daily activities where a recovery of face-to-face payments is observed, although without reaching pre-pandemic values. In this way, the face-to-face component (POS) seems to stabilize at around 7 out of 10 debit card payments per adult from 90% prior to the health crisis. This behavior was accompanied by a slight increase in the stock of active POS in the last 12 months (6%), totaling 501,985 units that registered at least one operation in June 2022.
Figure 9 | Debit and credit card operations and stock of active POS
Average Operation
TD operations by channel and active POS
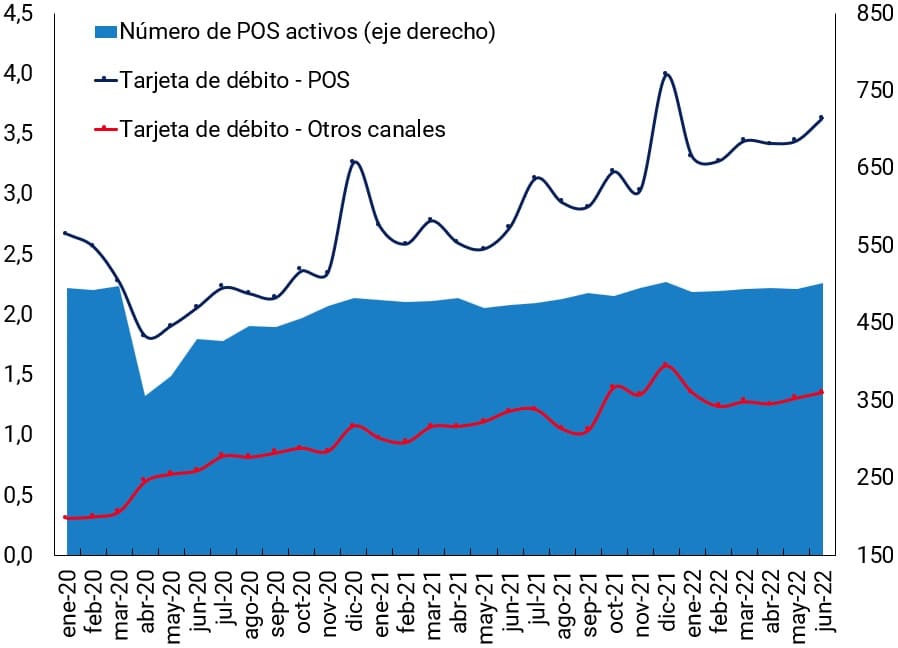
Note | Graph on the left: average value at constant prices in January 2019 (Indec CPI, January 2019 = 100). Graph on the right: debit card transactions (POS – other channels) by adult. “Active POS” include those that register at least one transaction in the month and are expressed in thousands. TD: debit card.
Source | BCRA and INDEC.
For their part, credit card payments had a modest behavior compared to the main MPEs during the first half of 2022. Each individual carried out an average of 2.4 transactions per month, making it the third most chosen MPE by people, behind debit cards and transfers. The improvement achieved in the last year after the fall recorded in 2020, as a result of the pandemic context, managed to be sustained and show a slight year-on-year growth during the first half of 2022 (4%). A similar situation is replicated in the amounts per adult.
Like the trend observed in the average value of debit card payments, over the last few years there has been a drop in the amount of each credit card payment. In this case, the phenomenon that explains this evolution could differ from what happens with debit cards. In addition to being a means of payment, the credit card is a financing instrument so its dynamics may be more associated with the economic cycle (See section on Credit to individuals).
As a payment and financing instrument, the associated costs for users and merchants are higher for credit cards than for debit cards. This makes it profitable to use and face the costs associated with the credit card in the case of purchases for higher amounts that satisfy the needs of consumption and are adapted to the financing possibilities of individuals. On the other hand, debit cards would be used for everyday purchases for relatively smaller amounts, which shows a complementary role between both products. This would explain the gap maintained over time between both average tickets. Likewise, given the almost universal possession of bank accounts, practically the entire adult population has a debit card available to operate, on the other hand, the credit card reaches a significantly smaller number of people.
The greater number of payments that each adult makes with debit cards compared to credit card payments, which began to be observed in Argentina as of 2019, is a behavior that is also evident in other economies around the world and could account for the greater digitalization of the payment system50 . Debit cards generally channel retail transactions that are usually more frequent than those that might require some type of financing, such as those made via credit cards.
3.2. Savings and investment modalities
In the previous Financial Inclusion Report51 , different forms of savings and investment of individuals (PH) were analyzed through different instruments offered by financial institutions (EEFF) and Payment Service Providers (PSPs). PHs have the possibility of allocating their money among various savings and investment products, depending on their liquidity objectives, term and risk-return ratio52.
Within immediate liquidity products, account balances account for almost the entire category, while within short- and medium-term products, most of the balance is in fixed terms whose average term is between 30 and 45 calendar days. In other words, PHs concentrate their savings and investment in short-term products, prioritizing liquidity over other objectives.
Figure 10 | Participation of different products in PH savings and investment balances
Data expressed in %
Immediate liquidity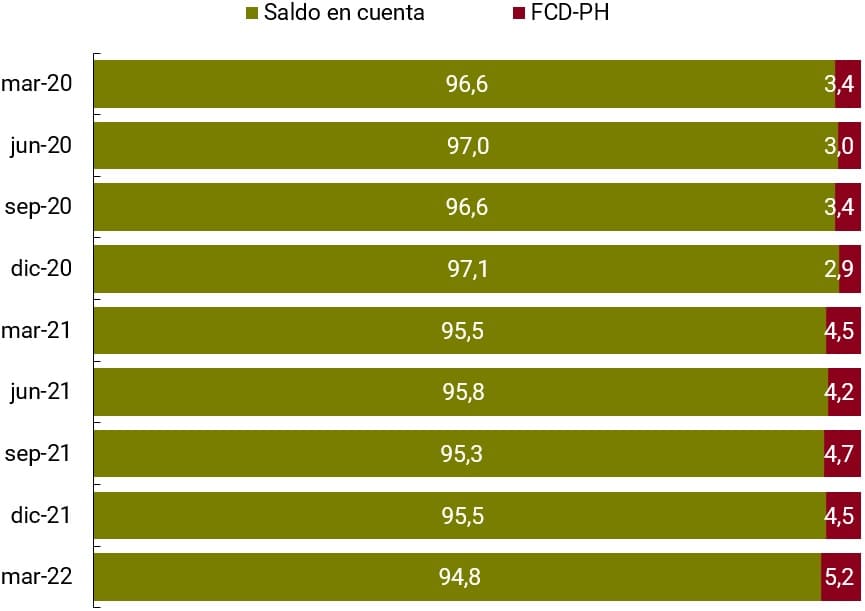
Short and medium term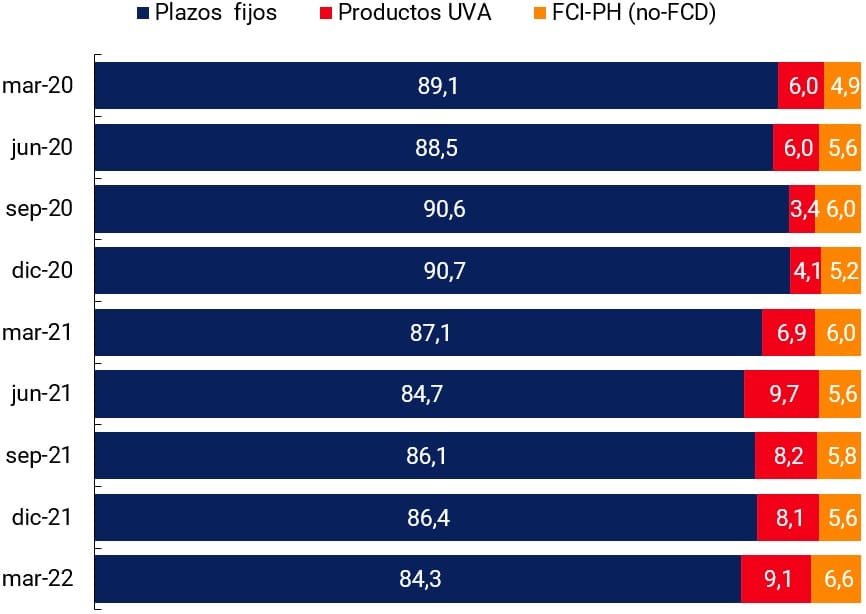
Note | Account balance and fixed terms considers placements denominated in domestic currency and foreign currency / FCD-PH (Mutual Funds of Money subscribed by individuals): value of the PN (net worth) of the estimate of FCDs subscribed by PH / FCI-PH (non-DCF) (Mutual Funds subscribed by individuals other than DCFs): value of the NP of the estimate of DCFs that are not DCFs subscribed by PH / Fixed terms: includes those who are not nominated in UVA.
Source | BCRA and CAFCI (Argentine Chamber of Mutual Funds).
However, in recent quarters, there has been a growth in alternatives that simultaneously share the liquidity and term parameters of these products and, additionally, offer a higher nominal return. In this sense, Mutual Funds (DCFs) are presented as an alternative to manage liquidity on account and savings products in Purchasing Value Units (UVA) as an alternative to fixed terms whose yield is associated with a nominal interest rate. While DCFs accounted for around 3.2% of balances in immediate liquidity products in the quarterly average of 2020 (Chart 10, left), in 2021 they rose to an average share of 4.5% and in March 2022 they reached a maximum of 5.2%. A similar trend is observed in UVA products, which went from an average quarterly share of 4.9% of short- and medium-term products in 2020 to 9.1% in March 2022.
These savings products have the Purchasing Value Unit (UVA) as the unit of account and pursue the objective of maintaining the purchasing power of the capital saved53. This set is made up of the following products: (i) fixed term without pre-cancellation option (PF-SOP); (ii) fixed term with pre-cancellation option (PF-COP); and (iii) savings account (CAH). The minimum savings term is 90 calendar days, except in the case of the product mentioned in point (ii) which can be pre-canceled as of the 31st day, while in all cases the minimum amount required is extremely low. These two characteristics, added to the maintenance of the purchasing power of the capital saved, are very relevant aspects in the savings-investment decisions of PHs.
Table 4 | Main characteristics of UVA savings products
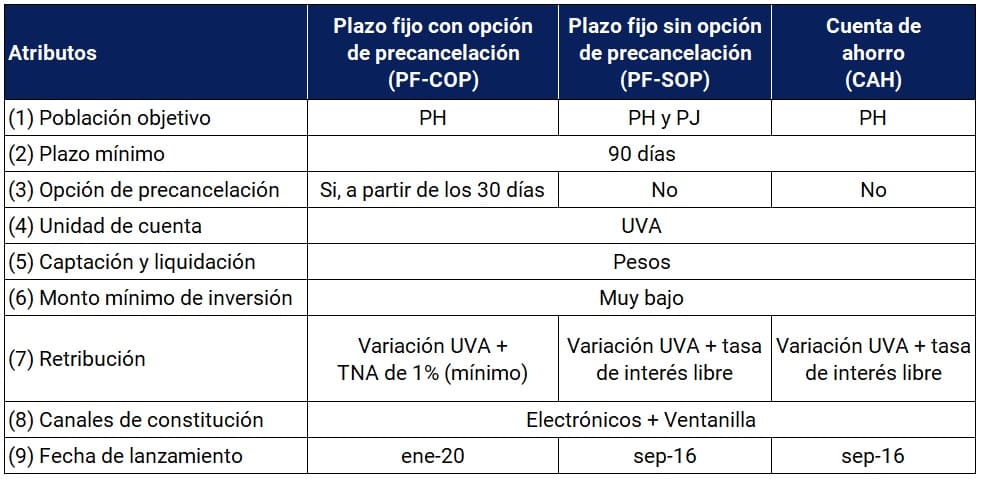
Note | Regulations that gave rise to the products: PF-SOP: Com. A 6069; PF-COP: Com. A 6871; CAH: Com. A 6494.
Source | BCRA
a. Pools of money. The DCFs subscribed by PH grew both in the balance of Net Equity (NP) under management, in the number of EEFF and PSPs offered and in the amount of funds available in the market. The EEFF that offer CDFs to PH account holders accounted for 83.7% of the deposit accounts in pesos in the financial system, while in the case of PSPs, this figure rises to 84.2% of the payment accounts54. This reflects that most PHs with accounts in the financial system or PSPs have access to CDFs. However, the former occupied a small space in the liquidity management of PHs, representing 5.2% of the balances of immediate liquidity products.
DCFs are investment products with low risk and immediate liquidity, appropriate for people who want to place their money in the short term, even if these conditions imply a lower return55. These attributes encourage the use of DCFs to obtain a nominal return on short-term liquidity, which is used to pay for households’ current expenses. During 2021, DCFs accumulated an average return of 35.8%, while in the first half of 2022 this figure rises to 18.4%56.
Between March 2020 and March 2022, the NP value of PH DCFs registered a growth of 35% in real terms57. Although the DCFs operated through the EEFF occupied a relevant participation in the period of analysis (~70%)58, the dynamics of the PH DCFs operated through PSPs stands out, as they doubled the value of the NP in that period. However, it should be remembered that PSPs do not offer other savings and investment alternatives such as traditional fixed terms and UVA, as the EEFFs are obliged to do. If we look at some distinctive features of those who have PSP accounts, we can infer that they attend a younger segment of the population, which resides mostly in more populated locations, with higher rates of development, in general, and infrastructure, transactionality, and digital skills, in particular. Thus, as can be seen in the low average balances that characterize this type of investment, it is to be expected that the aforementioned dynamics are partly due to the actions of that segment of the population for which the use of this investment tool is a useful complement to the financial services provided by the EFSs59.
Figure 11 | Managing liquidity and savings through DCF
PH DCF PN Value
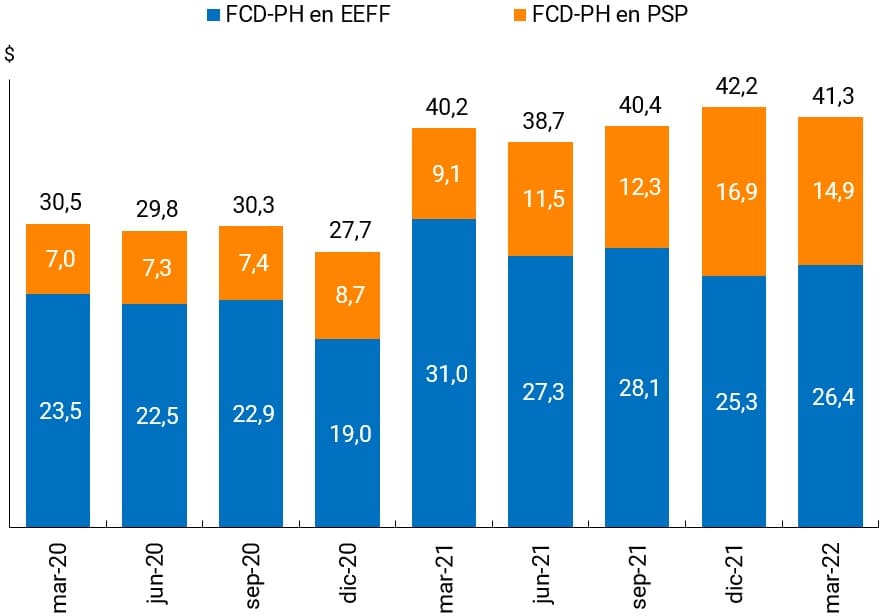
Relationship between the value of the PH DCF NP and the PH account balance by institutional group
Note | Graph on the left: data expressed in billions of pesos, FCD-PH in EEFF and PSP: value of the PN of the estimate of FCDs subscribed by PH in EEFF or PSP. The balances are expressed in constant pesos of January 2019 (CPI January 2019 = 100).
Source | BCRA and CAFCI.
Likewise, DCFs are gaining ground in maintaining the balance on account as a liquidity management alternative, although with different levels depending on the environment in which the DCF is subscribed. In the case of FFSEs, this phenomenon is happening in both public and private banks, although with significant differences in levels. This can be explained by various factors such as the profile of the account holder, the life span of the product in each EEFF and the possibility of subscribing to the FCDs in electronic channels, among others.
Regarding the last point, it should be noted that the advance of digital financial services during the COVID-19 pandemic favored both the incorporation of new products into electronic channels and the adoption of those that were already available, a situation that applies to the case of DCFs. In the case of PSPs, the availability for PHs to subscribe CDFs in digital environments, added to features that facilitate the subscription and redemption process, had a significant impact on liquidity management since the balance in PH payment accounts, on average, is similar to the balance allocated by PH in DCF.
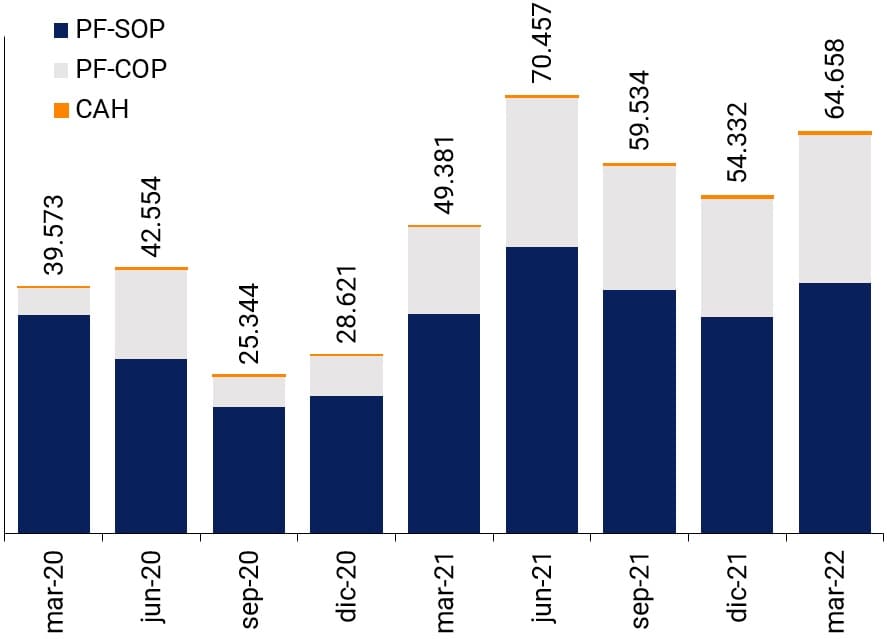
b. UVA savings products. As of March 2022, the total balance of these products represented 9.8% of the total balance of PH fixed terms and 8.6% of the PH60 account balances. Encouraged to protect the purchasing power of savings, the dynamics of the last two years show a greater adherence of PHs to these products as a short- and medium-term alternative:
- The total balance of UVA products grew by more than 60% in real terms between March 2020 and March 2022. The PF-COP, from a very low level, experienced a very significant growth and contributed 36% of the new balance to the set of UVA products. Products without a pre-cancellation option registered a growth rate of 16%.
- The ratio between the balance of UVA products and PH’s accountbalance 61 doubled, from 4.5% in March 2020 to 8.6% in March 2022, while the ratio between the balance of UVA products and PH’s fixed-term balance grew by more than 50%. It should be noted that PH’s account balances and fixed-term balances increased significantly in the period in question.
- The PF-COP began to gain ground on other short-term savings products: (i) for every $100 of balance registered in the PF-SOP, $55 is recorded in the PF-COP, a ratio that marked its minimum of $25 in September 2020; and (ii) for every $100 of balance registered in non-UVA fixed terms, $4 is recorded in the PF-COP, a ratio that a year earlier was $2.25.
Figure 12 | UVA savings products for individuals
Balance in millions of pesos in January 2019
Ratio between UVA product balance and PF balance
Note | The disaggregation of the savings statistics does not allow us to know the PH balances in the PF-SOP product. Based on the characteristics of the product, we assume that PH’s participation is significant62.
Source | BCRA and CAFCI.
Likewise, slowly and from low levels, UVA products are beginning to gain ground over traditional fixed terms. This phenomenon, which is observed in both public and private banks, is associated with the incorporation of the pre-cancellation option, the possibility of incorporation through electronic channels and the objective of preserving the purchasing power of the capital saved.
However, the adoption of savings and investment products has a positive relationship with income and education levels63. Likewise, people with lower levels of income and education tend to have deficiencies in their digital skills.
Along with the work aimed at improving the conditions of social inclusion, reducing informality and improving real incomes – key aspects to encourage household savings decisions – the growing digitalization of financial services that is expanding, although without having a universality destination, offers a favorable context to promote the use of savings and investment products. In particular through the cell phone, since it is used by all age groups. In this environment, savings and investment decisions begin to have characteristics that facilitate their management, such as low amounts of savings or investment, pre-cancellation options (with or without cost) and the possibility of scheduling the deposited funds to be reinvested. In this way, savings and investment products could increase their reach in the population and include people who traditionally found the savings process difficult.
4. Credit to individuals
In a context in which the economic recovery continues and in which electronic means of payment (EMP) and Payment Service Providers (PSPs) have gained participation in everyday payments, credit to individuals (PH) shows a clear positive trend. In this sense, the emergence of new actors that take advantage of the advantages of technology to offer financial services is also leading to greater financial inclusion on the financing side 64 65.
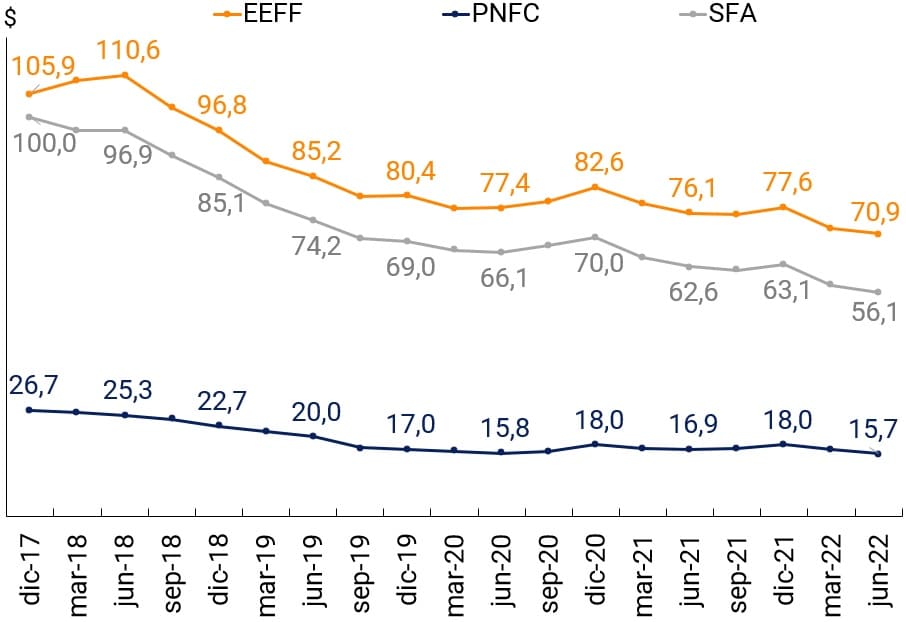
During the first half of 2022, the percentage of the adult population with financing in the expanded financial system (SFA) registered an increase of 2.4 p.p. This is mainly explained by the incorporation of new people with financing from non-financial credit providers (PNFCs). In this way, 53.5% of adults in the country registered at least one credit product, reaching not only a value well above the pre-pandemic but also the maximum in the series.
Figure 13 | Percentage of individuals with financing over the adult population
Source | BCRA.
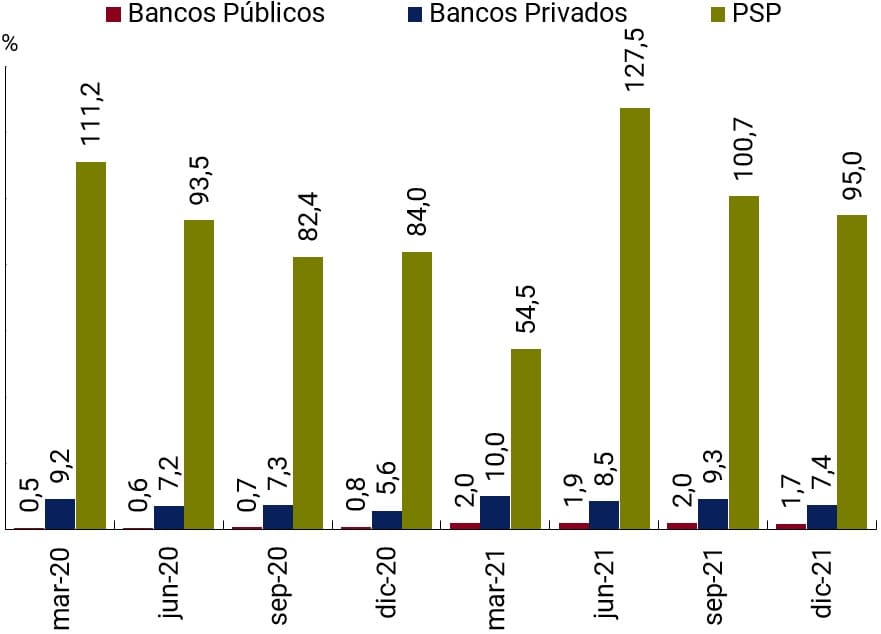
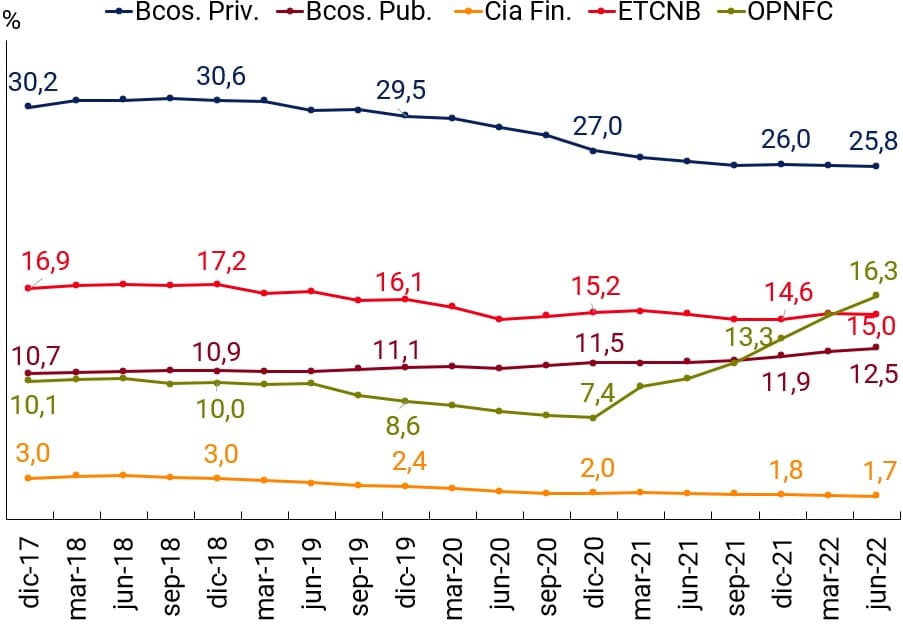
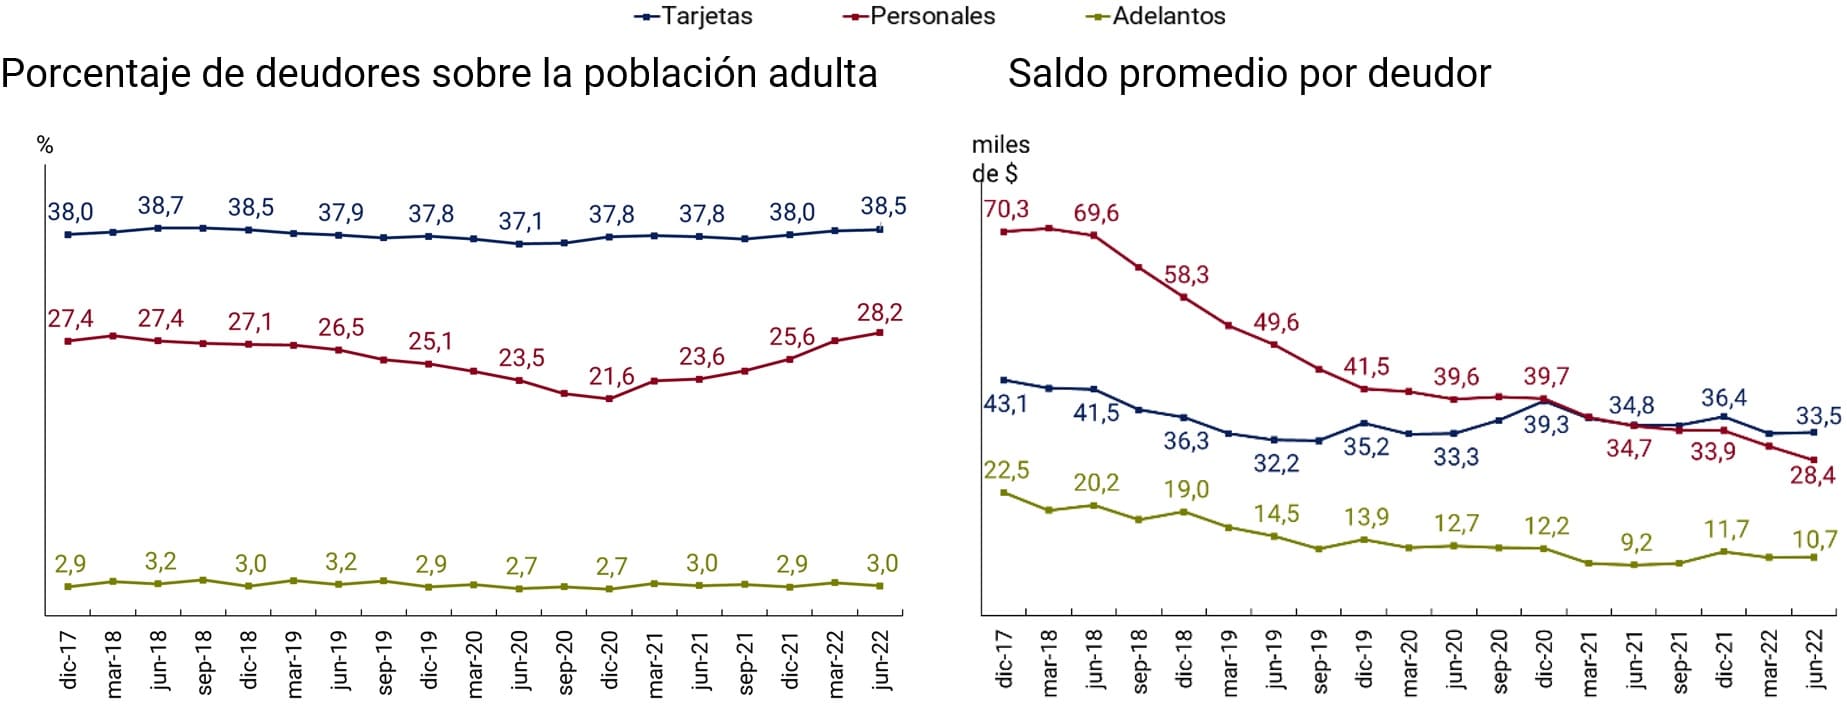
Credit providers. Both financial institutions (EEFFs) and NFPPs experienced growth in the proportion of adults to whom they provide credit assistance. Within the first group, public banks drove the increase, consolidating a slight but sustained trend over the last 4 years. Private banks, for their part, continued to reduce the percentage of adults with financing, although at a slower pace than in previous quarters.
On the other hand, the other non-financial credit providers (NPPOs) showed a strong trend towards the incorporation of new people with financing. As clarified in the previous Financial Inclusion Report66 , a regulatory change by the BCRA implied that new PNFCs reported the financing granted in the Central Bank of Debtors of the Financial System (CENDEU) as of December 2020, which generated an initial jump in the number of debtors67. Then, the number of people with financing continued to show a gradual increase month by month, which would indicate that the inclusion of new people with financing would not be related to the regulatory change that provided for the obligation to report. This led to a clear increase in the percentage of borrowers over the adult population for the SFA, indicating that at least some of these new borrowers did not register EEFF financing. Under this dynamic, the OPNFCs were positioned as the second institutional group with the highest percentage of debtors after private banks.
Figure 14 | Average balance per customer
Note | Balances in thousands of constant pesos (base CPI Jan-19=100).
Source | BCRA.
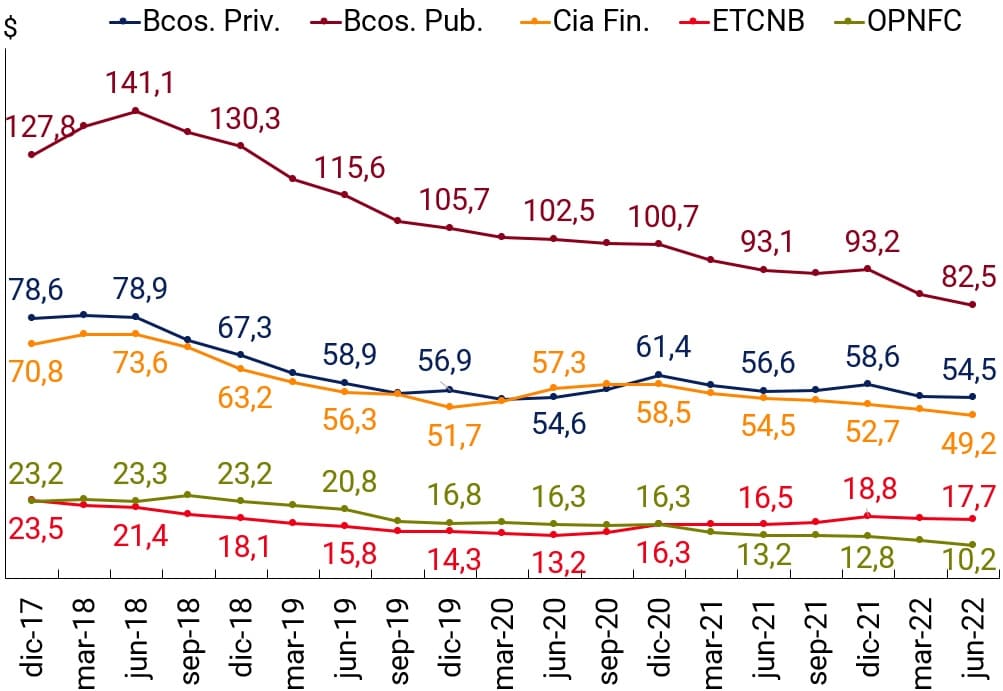
In relation to balances, the SFA reduced the total amount financed in real terms by 6% during the first half of the year and 9% if June 2022 is compared to December 202068. Thus, although there is an increase in the number of people with credit assistance, the balance financed is smaller. In terms of average amounts per debtor, all institutional groups presented a reduction in balances during the first half of the year.
In particular, the average balance per debtor of OPNFCs experienced a drop in real terms of 21% between December 2021 and June 2022 and 38% compared to December 2020. This group has incorporated a significant number of people with financing with increasingly lower average balances. In the EEFFs as a whole, public banks recorded the largest reduction in average balance in the first six months of 2022 (-11%). The decrease in the average balance per debtor for OPNFCs and public banks limits to some extent the positive effects of the inclusion of new debtors registered by these institutional groups that tend to serve segments with higher levels of poverty and informality as these institutions have lower barriers to entry to access financing. Lower financing balances could indicate a shorter debt term in line with the evolution of personal loans69.
Support from the BCRA. In March 2021, the BCRA launched a stimulus policy on various aspects of financial inclusion70. One of the objectives of this policy was the extension of credit from financial institutions (EEFF) to individuals (PHs) and MSMEs that did not have financing from these providers as of December 202071.
The incentives proposed in this policy consist of: (i) for this set of PHs and MSMEs: an interest rate lower than that offered on average by credit providers; and (ii) for the EEFFs: a reduction in the minimum cash requirements for the balance of the financing granted under the aforementioned conditions72. With these guidelines, the profile of potential borrowers can be segmented as follows:
i. PH and MSMEs that did not have financing from any type of credit provider, whether it was a financial or non-financial one.
ii. PHs that exclusively had financing from Non-Financial Credit Providers (PNFC).
The number of adult individuals without EEFF funding as of December 2020 amounted to 22.2 million, which represented 64.5% of the adult population. As there are certain limitations in the availability of information that do not allow differentiating the people who have taken financing within the framework of the aforementioned policy from those who have obtained financing outside of it, we consider in the analysis that follows the total of new PHs with financing from EEFF regardless of the interest rate agreed on the credit (“new PH debtors” 73) and we will try to identify some impacts of this policy.
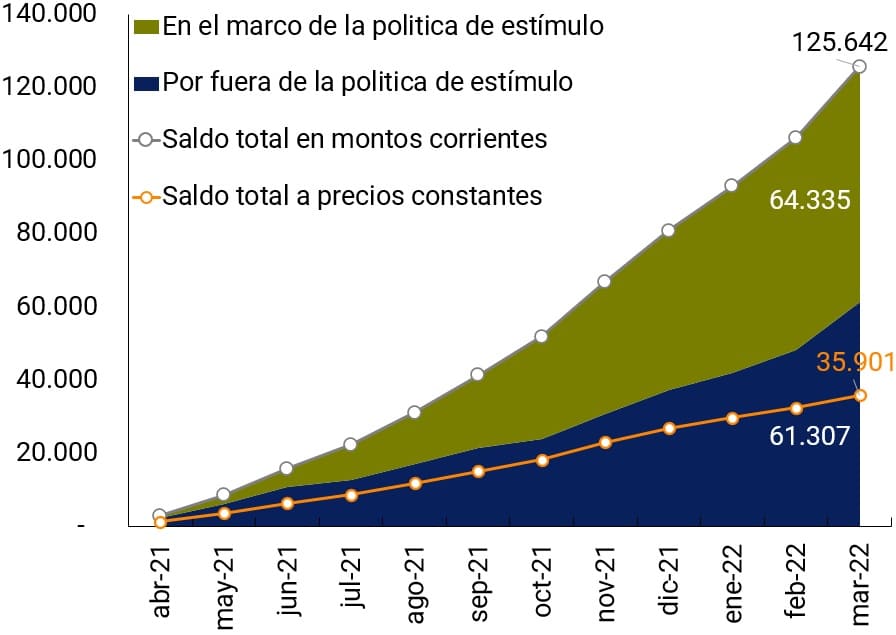
a. Financing balance and participating LFF. As of March 2022, the balance of financing granted by EEFF within the framework of this policy amounted to $64,335 million74. EEFF’s participation in this policy grew during the period in question, with a number of 23 EEFFs in March 2022, which concentrated a relevant amount of the financial system’s national currency deposit accounts (90%).
As of October 2021, the share of the financing granted by EEFF within the framework of the stimulus policy was around 50% of the total financing granted by the EEFF participating in the same to new PH debtors. In other words, half of the financing provided by these EEFF to PHs without financing from EEFF in December 2020 was granted under the conditions of the aforementioned stimulus policy. When segmenting the sample of participating LFFs by group, private banks were participating in the framework of this policy in a greater proportion than public banks, which have historically maintained portfolios of credit service concentrated in low-income sectors.
Figure 15 | Financing for new PH debtors
Financing balance
PH Amount

Note | Graph on the left: balances in millions of pesos. “Total balance at constant prices” considers the prices of January 2019 (CPI January 2019 = 100). Graph on the right: in thousands. “Under the stimulus policy” means balances granted by EEFF to customers who did not have EEFF financing as of December 2020 in compliance with the conditions set forth by the regulation.
Source | BCRA.
b. New PHs with EEFF financing. Of the universe of PHs without financing from EEFF in December 2020, the participating EEFF granted financing to almost 1.2 million PHs as of March 202275, of which 81% did not have financing from any credit provider and the remaining 19% had financing from PNFC. A comparison of the set of new PHs with credit by age group and gender with respect to all PHs with financing in the financial system allows us to identify effects potentially generated by this policy.
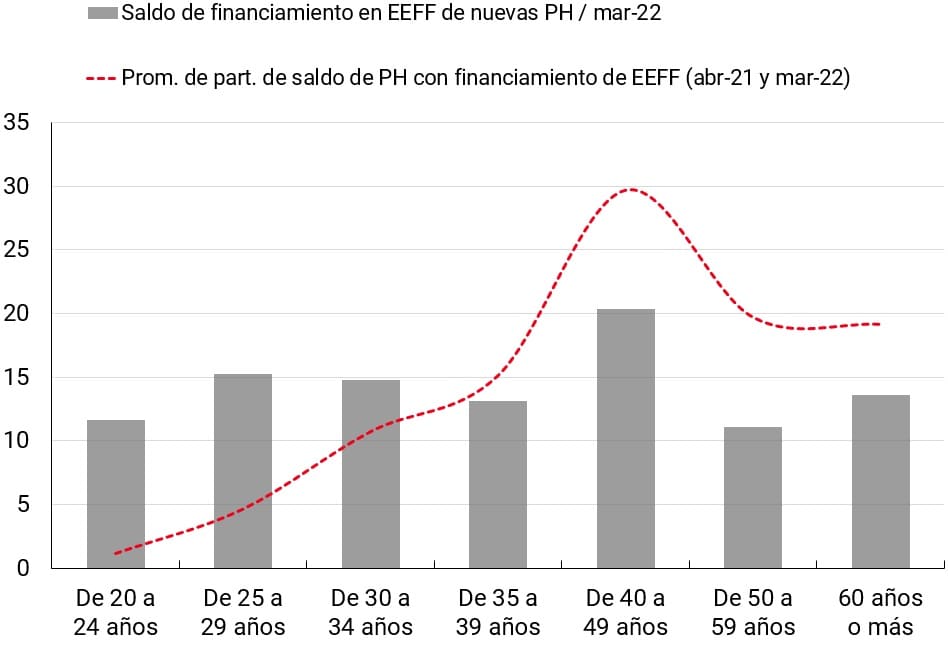
b.1. Age group. A little more than 55% of the new PH debtors were concentrated in the age group between 20 and 39 years old. This proportion is far from the 32.5% represented, on average, by PHs in that age range with respect to all PHs that had financing with EEFF in March 2022. In terms of financing balance, a similar situation is presented. On the other hand, a very high proportion of new PH debtors in this age group (86%) did not have financing from any credit provider.
As the incentive progressed over time, the age distribution of PHs with financing moved away from the distribution of all PHs with EEFF financing, leaning towards younger age groups. However, the proportion of the 20-39 age group with EEFF funding improved by 0.9 p.p. from April 2021 to March 2022, which was not enough to reach the levels of the older age groups.
Figure 16 | New individuals with EEFF funding. Distribution by age group
Amount of PH (in %)
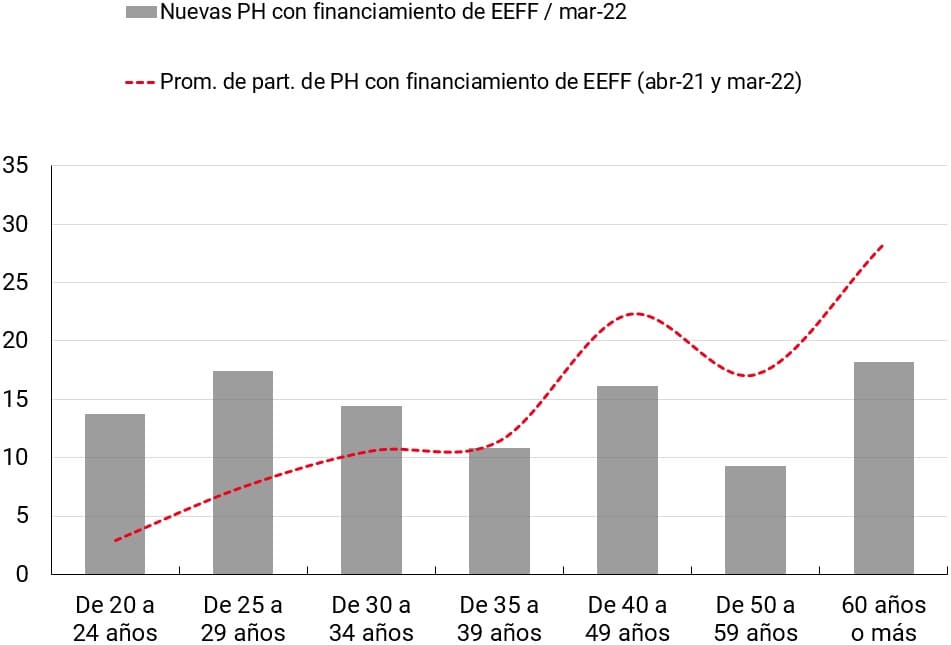
Financing balance (in %)
Note | The bars and dotted line add up to 100%.
Source | BCRA.
b.2. Gender. The new PH debtors with financing were distributed equally between women and men as of March 2022, which is, in the case of women, slightly above the gender distribution of all PHs that have financing with EEFF. In terms of the balance of financing, women’s participation in new financing was also above women’s participation in the financing balance of the financial system76.
Figure 17 | New individuals with EEFF funding. Distribution by gender.
Amount of PH (in %)
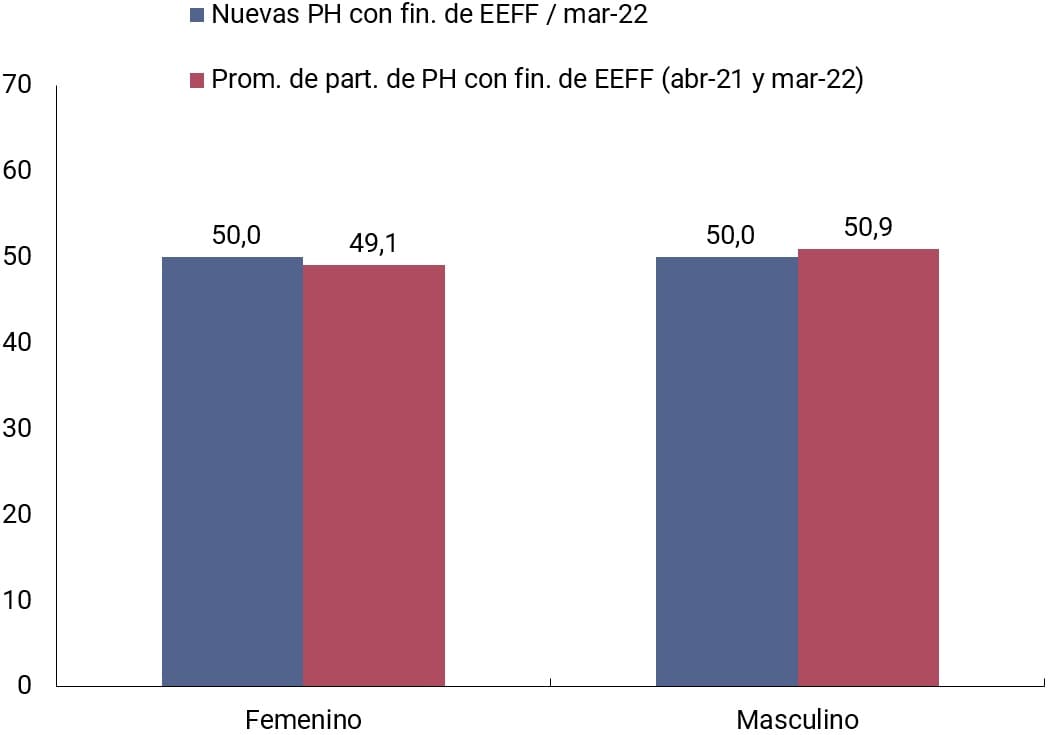
Financing balance (in %)
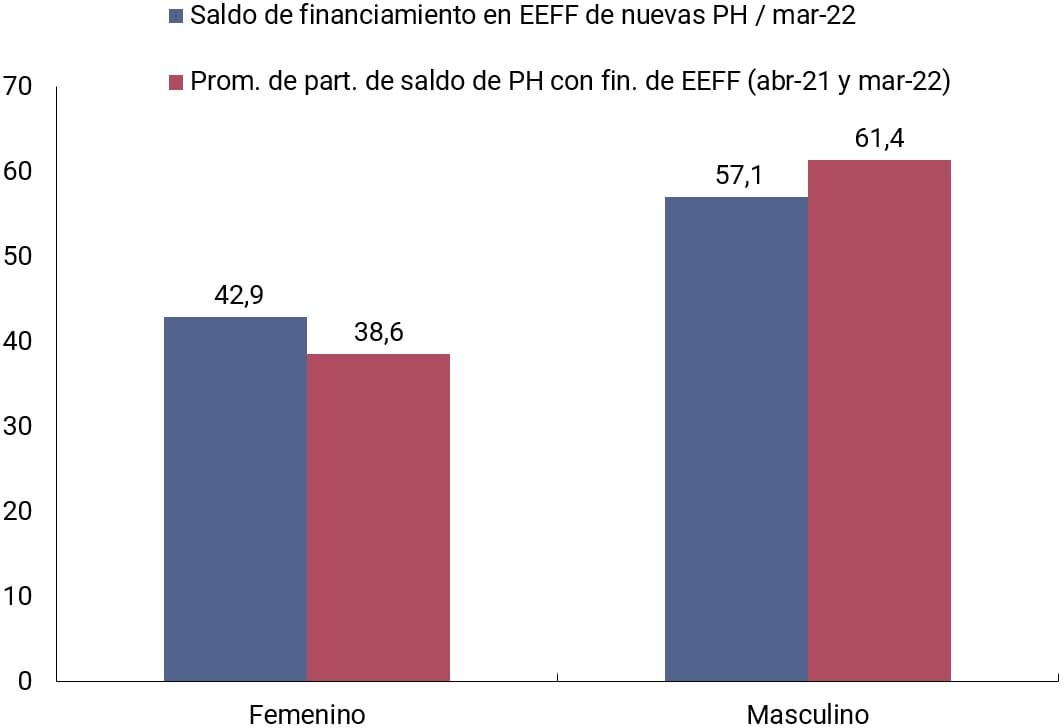
Note | The sum of bars of similar color is equal to 100%.
Source | BCRA.
Similar to younger people, a very high proportion of new women debtors (82%) did not have financing from any credit provider. Between April 2021 and March 2022, the proportion of women with EEFF funding over the adult population improved by 0.5 p.p.
In conclusion, the incentive policy registered a significant participation of EEFF, where the proportion of financing under these conditions reached 50% of the total financing provided to all PHs eligible for this regulation. It could also be argued that this incentive policy influenced, among other factors, that the EFSs granted more financing to younger PHs and women, with a greater impact on the first group.
Type of assistance. After a period of some stability in the percentage of adults with credit card financing, there was an increase that reached 0.5 p.p. during the first half of 2022. This behavior is in line with the recovery in the use of credit cards as a means of payment (See Section 3.1). With this increase, the indicator approached the maximum value of the series reached in June 2018. However, the average balance per debtor in real terms registered a fall of 8%.
Figure 18 | SFA funding by type of assistance
Note | Balances in thousands of constant pesos (base CPI Jan-19=100).
Source | BCRA.
On the other hand, driven by the incorporation of new people with financing by the OPNFCs, the percentage of adults with at least one personal loan showed an increase of 2.6 p.p. during the first six months of 2022, reaching the record of the series. Within the group of OPNFCs, suppliers that make intensive use of technology for the granting of personal loans have gained participation.
These digital OPNFCs, as well as offering their users different financial services that complement each other, explore new ways of offering financing (for example, consumption quotas or the possibility of combining different means of payment for the purchase of goods77), positively impacting the number of people assisted. Despite the increase in the number of people with personal loans, the average balance showed a clear reduction and is at its minimum value, with a drop of 16% during the first half of the year (higher than the 15% reduction observed between December 2020 and December 2021).
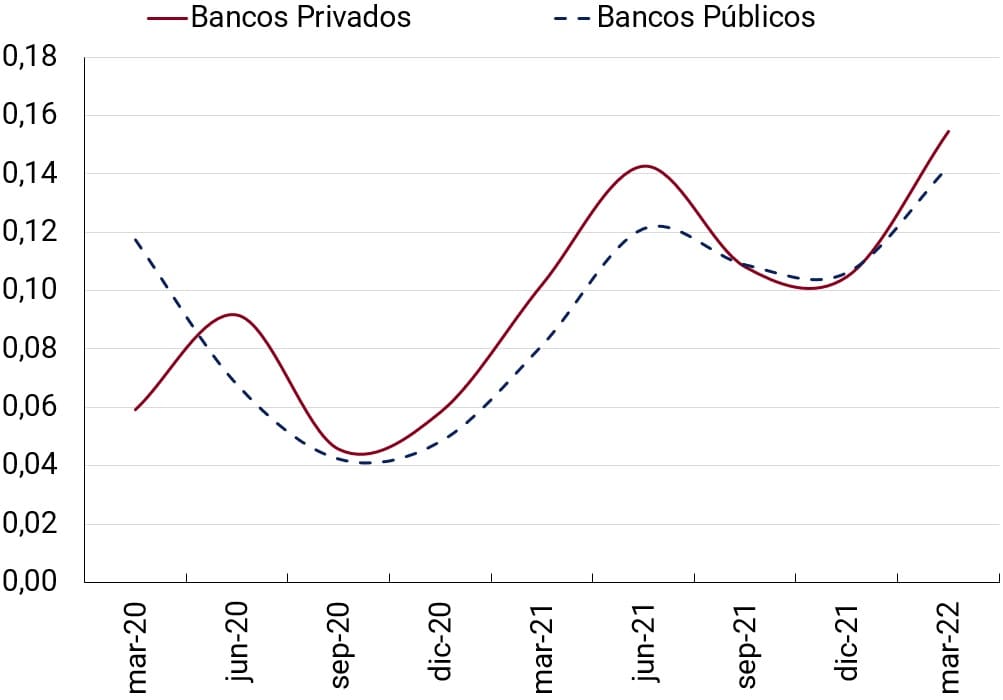
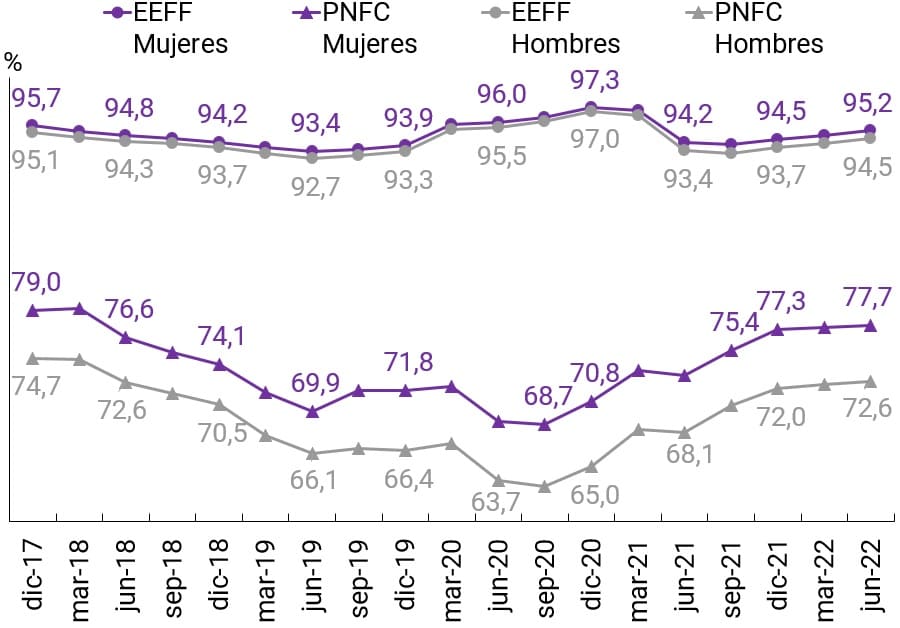
Situation of debtors. In June 2021, the measure ordered during the COVID-19 pandemic, which had made the applicable criteria for the classification of debtors78, came to an end. From that moment on, the percentage of EEFF debtors in a regular situation was slightly higher than before the pandemic (93.6% in Dec-19 vs. 94.8% in Jun-22). At the level of institutional groups, an improvement was observed in the regularity indicator of private banks and a slight worsening of public banks, which led to a reversal of the relationship between the percentages of debtors of both groups that adequately meet their financial commitments.
Figure 19 | Percentage of debtors in a regular situation

Source | BCRA.
For the PNFCs, in December 2020 a clear improvement in the percentage of debtors in a regular situation began, mainly driven by the incorporation of new debtors with better repayment capacity by the OPNFCs. However, the NPFC debtor default indicator remained at a considerably higher level than for the EFS.
On the other hand, women continued to demonstrate better repayment behavior than men. This difference was observed for both the BSE and the NFCPs, but is particularly important in the second group. The better payment behavior of Argentine women is part of a global trend that has persisted over time. A report by the Financial Alliance for Women that covered 26 banks and 24 countries indicates that women have a lower percentage of non-performing loans than men79. In particular for consumer loans, men recorded 5.7% of non-performing loans compared to 4.2% of women. On the other hand, the report on gender in Chile’s financial system reveals that women consistently maintain lower delinquency indicators than men and stronger financial integrity variables80.
Debtor profile. Between December 2020 and June 2022, 2.3 million people joined the SFA with financing that, for the most part, was due to the performance of the OPNFC81 group. To identify whether the inclusion of debtors focused on a particular population group, certain characteristics of debtors were compared taking two points in time: December 2020 (first month of mandatory reporting of information in CENDEU) and June 2022 (latest available data).
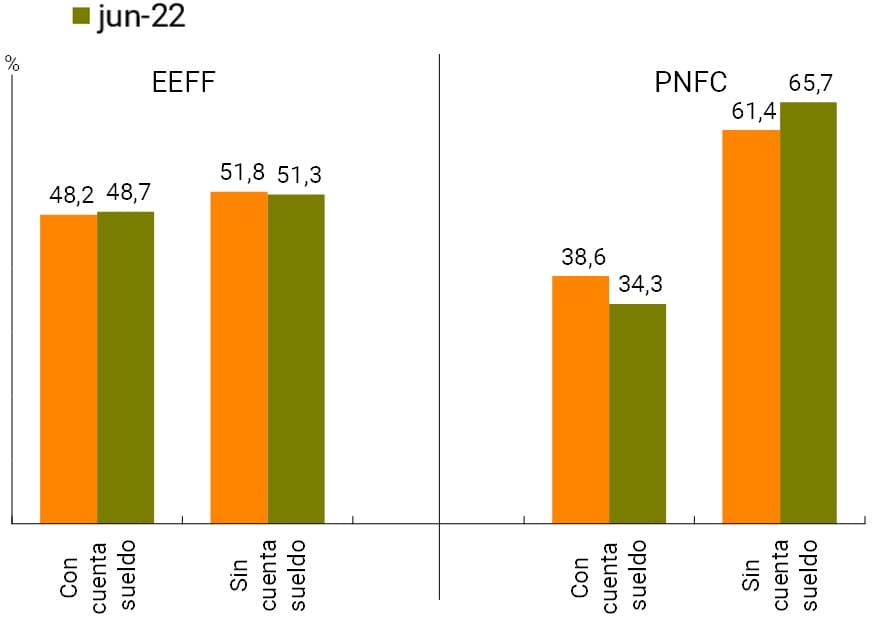
For the EEFFs as a whole, it was verified that the profile of the debtors in terms of age, gender and salary account tenure did not experience significant variations. In the case of the PNFCs, the comparison yielded interesting results. The proportion of debtors between 20 and 24 years of age almost tripled (0.9% in Dec-20 vs. 2.6% in Jun-22), while that of those between 25 and 29 years of age grew from 2.7% to 3.8% (40% variation). On the other side of the spectrum, the proportion of debtors in age groups over 50 years of age decreased by an average of 20%, which would indicate that the inclusion of new people with financing was eminently young adults.
Figure 20 | Debtors by age range and salary account holdings
By age ranges

By possession of a salary account
Note | The percentages indicate the participation of each category (age ranges and salary account holding) for the total of EEFF and PNFC debtors at each moment in time.
Source | BCRA.
On the other hand, there are also differences in relation to the gender of the people with financing. In December 2020, 49% of PNFC debtors were men and 51% women. As of June 2022, 47% of debtors were men and 53% women, so it can be inferred that PNFCs incorporated more women than men into their client portfolio.
With regard to the holding of a salary account (which can be considered an indicator of registered work), the proportion of PNFC debtors who are holders of a salary account was reduced by 11%, indicating that the new debtors would be, to a greater extent, people who do not have formal employment in a relationship of dependency. This change deepened the trend mentioned in previous editions of the Financial Inclusion Report82, which shows that PNFC debtors have a lower level of registered employment than EEFF debtors and that their source of income is likely to come from their self-employment.
Based on these data, the PNFCs included new people with financing focused mainly on young people, females, who would not have registered work, and who did not have financing with EEFF. These new debtors demonstrated a good capacity to repay their financial commitments in relation to the historical behavior of PNFC debtors, although with average debt balances clearly lower than those recorded prior to December 2020.
The addition by the PNFCs of new debtors who did not previously register financing in the financial system provides CENDEU with new credit information. This has a positive impact on new people with financing, as they begin to build a credit history that would facilitate access to new financing with better conditions. In turn, the greater availability of credit information contributes to the stability of the financial system and to the better functioning of the credit market83.
Section 1 / Hierarchical positions and access to financing for financial institutions: analysing the role of gender gaps
In order to deepen the analysis initiated in previous Financial InclusionReports84, this section will explore whether there is any link between women’s participation in hierarchical positions in financial institutions (EEFF)85 and the allocation of credit that banks and financial companies make according to the gender of their customers. Greater participation of women in the decision-making bodies of financial institutions could be reflected in an increase in their participation in access to credit. Thus, we will formally test this hypothesis by controlling for other variables that may also affect the gender financing gap.
By studying the incentives to achieve gender parity and the conditions that influence it, we have chosen to work with women/men gaps. Proceeding in this way allows us to be consistent with the recommendations issued to the LESs in the sense of tending towards gender parity/management86.
Gender parity is understood as the situation in which the participation of women and men in the different spaces of relevance is equal, such as the workplaces of decision-making or access to credit, and the right to equal opportunities and non-discrimination on the basis of gender is guaranteed.
To capture the evolution of gender parity, we use a scale to measure how close women are to achieving gender equality with men. The (relative) gaps are calculated by dividing for each variable the value corresponding to women by the value corresponding to men. Thus, if the dominance of the male gender is absolute, the value is equal to 0 (zero). Any value less than 1 (one) indicates an unfavourable relative situation for the female gender. If there is equality of conditions or gender parity, the value is equal to 1. Since it is greater than 1, it indicates that the value of the variable for women is higher than that for men.
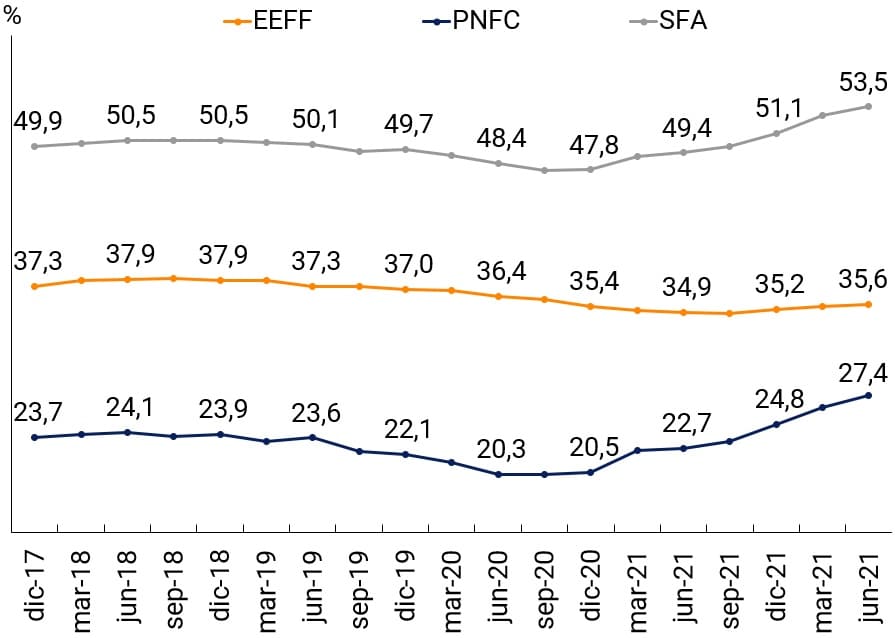
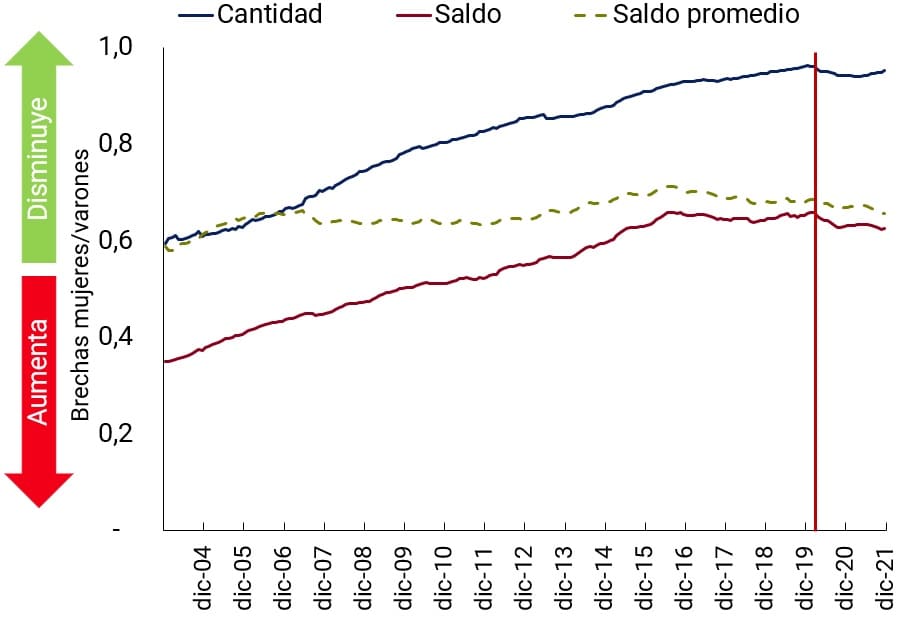
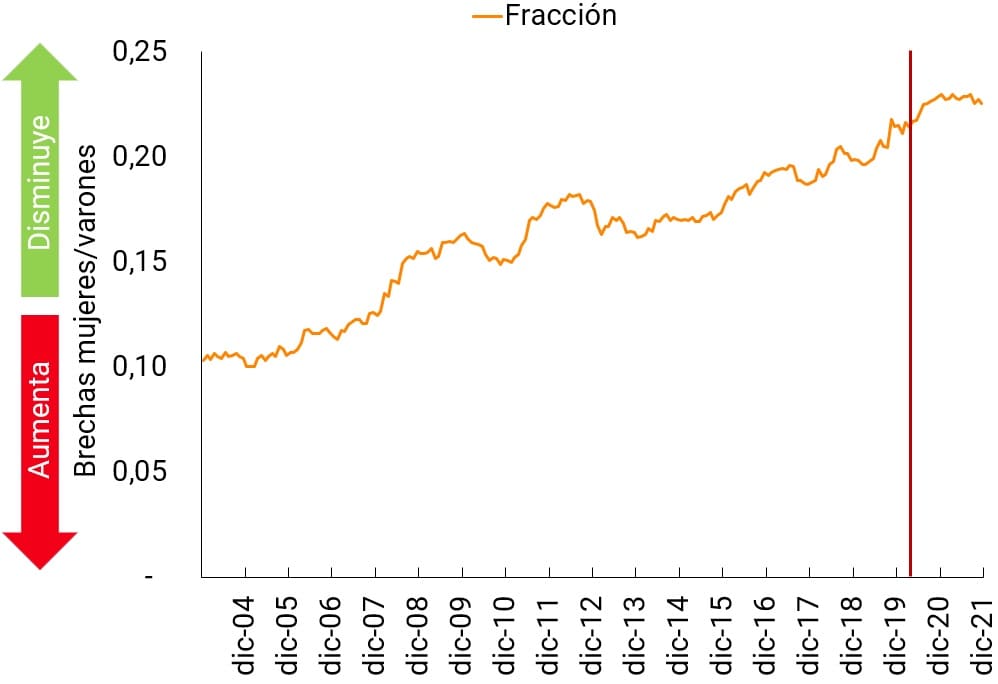
We can see in Figure A.1.1 that the relative situation of women in terms of access to credit is worse than that of men because, during the period 2004-2021, the values corresponding to the gaps are less than 1. The situation is less unequal when analyzing the relative number of women and men who have EEFF financing87; it is considerably aggravated when considering the total balances financed and consequently an intermediate situation is observed in the average balances per person.
Figure A.1.1 | Gender gaps: Funding88
Source | BCRA.
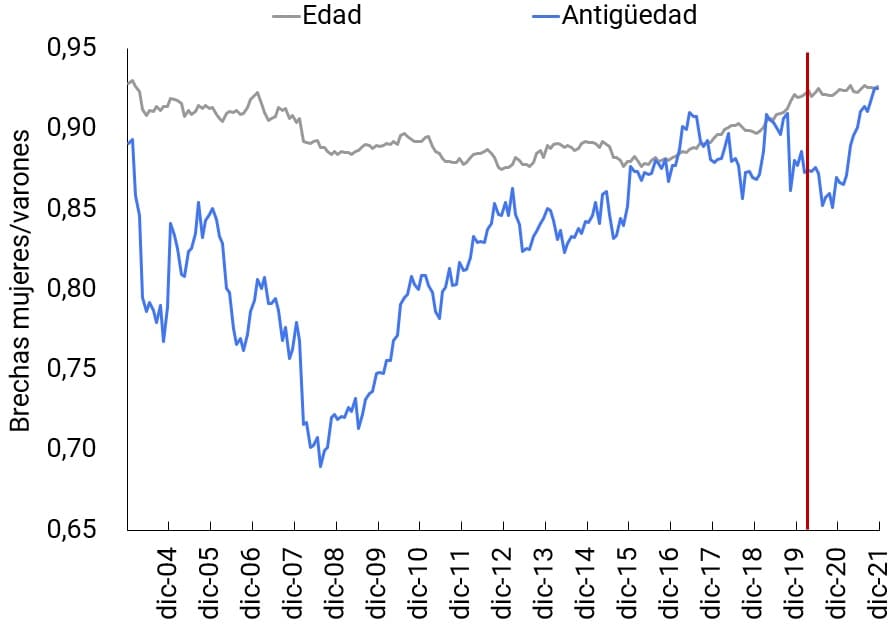
Although we can observe, in Graph A.1.2, a historical trend in favor of reducing the existing gaps in terms of the relative participation of women and men in leadership positions in EEFF, these are significant in the period under study. In all cases the gaps are less than 1. To a greater extent in terms of the fraction of available positions they occupy and somewhat smaller in terms of age and seniority gaps in the financial institution (FI). Thus, women occupy a smaller fraction of the hierarchical positions in EFS, and those who hold them are younger and have less seniority in EF than their male peers.
Figure A.1.2 | Gender gaps:Authorities 88
Source | BCRA.
To extend the analysis, we used panel data econometrics by EF and month, employing “in-between” random-effects models89 to be able to appropriately answer two types of potentially related, but distinct, questions:
(1) What happens to the gender gap referring to the90number of women receiving EEFF funding for FI “A” if the gender gap reflecting theratio of 91 female authorities to men from one period to another within that PE changes? (effect “inside”)
(2) What happens to the gender gap referring to the92 number of women who receive EEFF funding for FI “A” and for PE “B” given that both EFSAs differ, for the same date, in relation to the gender gap reflected in the93 ratio of female authorities to men? (“between” effect)
We have chosen to work only with those EEFF that in the average of their information presentations have indicated having at least 500 female debtors and 500 male debtors and of these we have discarded the months in which the number of female or male debtors was less than 100. We did this to avoid working with observations/ESFFs that were at the beginning or end of their operations or that were too small to avoid biasing the results due to observations with extreme values.
Since gender gaps in access to credit are also the result of structural and circumstantial factors, we included in our analysis as explanatory variables some that refer to the prevailing social context – such as the increase in the social relevance assigned socially to moving towards a situation of greater gender parity in terms of assuming responsibilities and enjoying rights94 and the development of the COVID-19 pandemic95, the current economic context -considering the possible impact of the economic cycle96-, the specific characteristics of the EFS -such as the type of EF, its Assets, Profit and Loss and the existence or not of salary accounts-, and differences observed for the different EEFF and population groups -such as the gaps observed in the irregularity of portfolios.
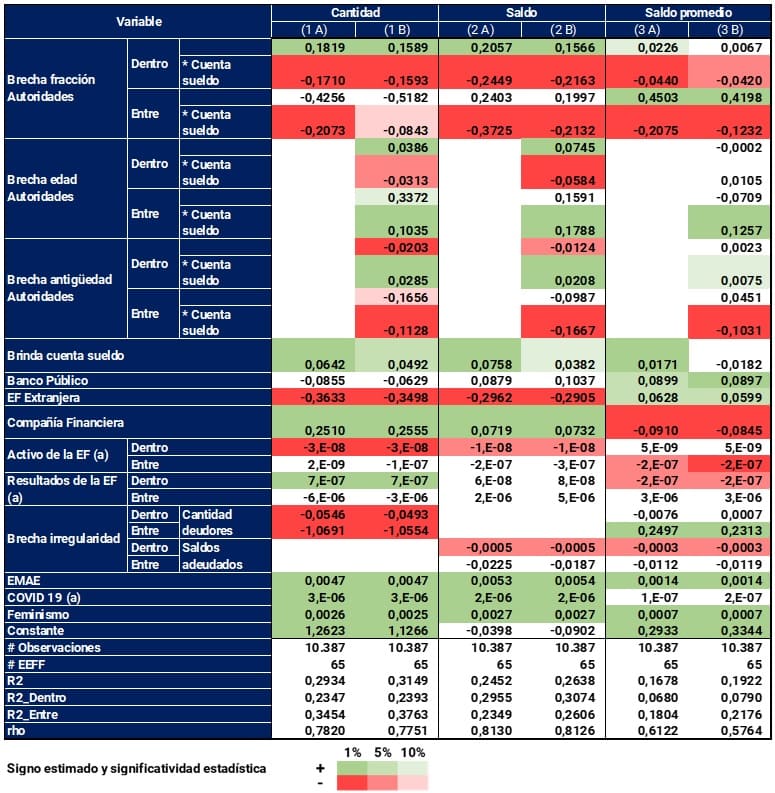
Econometric analysis. In Table A.1.1, three different types of gaps are considered as dependent variables, referring to: 1) number of people financed97, 2) balances financed, and 3) average balances financed. For each dependent variable, two different models are shown that share most of the explanatory variables, except for those that refer to gaps in Authorities. The models individualized with the letter “A” only take into account the gap referring to the fraction of participation of women vis-à-vis that of men and those indicated with the letter “B” add the gaps referring to age and relative seniority. By applying “in-between” models, we discriminate in the table the estimated coefficients for each of the two effects in order to provide an econometric response to the two questions we posed previously.
In addition, we separate, indicating with “* Salary account”, the interaction between the variables referring to gaps in Authorities and the fact that the FI has salary accounts for its users. In this way, the rows without “* Salary account” refer to the estimated values for the LFSE that do not have them; and the values corresponding to the individualized rows with “* Salary account” must be added to quantify the effects of the EEFF that do have them.
A simple alternative to quantify the impacts is to carry out the following exercise that we apply to a particular explanatory variable but that we can use, with some modifications, for the others. First, let’s assume that at the initial moment all the authorities of an PE are men. Thus, the gender gap referring to the fraction of authorities is equal to 0. Second, let’s assume that for this PE the number of female people who access the credit is equal to the number of people of the male gender, so that the gender gap referring to the number of people who access the credit for that PE will be equal to 1. What would happen if for some reason it is decided to achieve gender parity in the composition of the staff of authorities, that is, to appoint an equal proportion of women and men? Ceteris paribus, the first thing that would happen is that in this act the gender gap indicator referring to the fraction of authorities would go from being 0 to now being 1. This increase in one unit must then be weighted by the estimated value for the parameter corresponding to the variable fraction of authorities gap in its “inside” dimension, which is equal to 0.1819 for FIs without a salaryaccount 98, in order to see what will happen to the gender gap in access to credit that we remember was initially equal to 1. Thus, the new value would be 1 + (0.1819 * 1) = 1.1819. In other words, the gender gap in access to credit would now be tilted in favor of women in this PE, with an approximate participation of women of 54.17% and a participation of men of 45.83%. 99. The impact of the change in the composition of authorities drops to 1 + (0.1819 – 0.1710) * 1 = 1.0109 in the case of a PE with a salary account. Thus, the participation of women in the bank’s portfolio rises to 50.27% and that of men falls to 49.73%100, 101.
As shown by the estimated coefficients for the variable “Provides salary account”, which result in 5 out of 6 possible cases statistically different from zero and positive, the fact that the FI offers salary accounts reduces the different gaps in access to credit. On the other hand, and in relation to the variables referred to “Authorities”102, the differential impacts between EEFF that do not offer them and those that do are observed as modifications no longer in the order to the origin103, but as changes in the slopes of the corresponding explanatory variables. Article 104.
Table A.1.1 | Determinants of Credit Access Gaps: Random “Within-Between” Effects
Source | BCRA.
Main results. An inspection of the results obtained allows us to conclude that:
- The gender composition and their respective gaps in the composition of the staff of authorities have statistically significant impacts in terms of gender gaps in access to credit.
- By expanding the set of explanatory variables to include characteristics referring to age and relative seniority, and once we control for the different variables of the institutional, economic and cultural context, we can infer that it is not only an issue of proportions of female representation in leadership positions, but that it is also important to take into account, additionally, the characteristics of those who occupy those positions.
- It is important both to induce/monitor the evolution of the structure of the hierarchical positions within each EF, and to compare the average structures observed between the different EFS.
- Having accounts enabled for, and access to, information related to, the accreditation of remuneration is essential when making decisions on the allocation of credit by gender105. But, for some EFFs that do not have access to it, the gender composition of the authority staff is even more important than for the EFFs that do.
- The type of FI, with regard to its character of Public or Private, National or Foreign and Bank or Financial Company is a determining characteristic. With favorable impacts for Financial Companies in terms of amounts and balances and unfavorable for average balances. Foreign bank LFFs, on the other hand, have negative impacts on amounts and balances as they show positive results in relation to average balances. For their part, public banks exhibit positive results in terms of average balances.
- The dimension of the evolution of Assets of each FI is negative for amounts and balances; and the comparative dimension between different LFS is for the average balance. In the case of the variable Results of the FI, the estimate referring to the evolution of each FI that concerns quantities is positive and negative in relation to the average balances.
- The evolution of the economic cycle is transcendental as it shows a positive impact, that is, directly proportional, to the phase of the cycle in which the Argentine economy finds itself. The same happened with the variable that captures the temporal evolution of the COVID-19 pandemic.
- In relation to the gender gap referred to irregularity, the estimated coefficients show the expected signs in terms of quantities and balances; with some somewhat strange result when observing the dependent variable average balances for the dimension that compares between different EFSs in terms of the irregularity gap in terms of the number of debtors, but which is offset106 by one of a negative sign, which is the one expected, in the results obtained for the dimension of each EF over time in terms of the irregularity in balances for the debtors.
- It is advisable to pay particular attention to the fact that the “cultural” dimension of the phenomenon, operationalized through the variable “GT: feminism Arg.” has a statistically significant and positive impact in all cases.
A more detailed and in-depth analysis carried out by members of the BCRA’s Main Management of Financial Inclusion, which was reflected in a document of the same name as this section, and which, given its length, is not presented here, also allows us to conclude that:
- Gaps in women’s relative participation in leadership positions were particularly severe in two main types of positions, those of managers and those of credit and finance managers.
- Although the respective seniority gaps of women vis-à-vis men were in favor of the latter, this occurs to a lesser extent for managerial positions, in general, and for support managements107 in particular; it may even be observed periods where these gaps show values greater than 1.
- The expected impacts are heterogeneous when differentiating between the different types of authorities. They are usually diverse both in terms of statistical significance and expected impact or magnitude, and that this characteristic is not limited to a particular dependent variable, special set of explanatory variables, or group of analysis.
- After studying the set of people who are debtors of EFS, and in order to explore possible differential impacts aimed at the inclusion of populations with lower resources in the financial system, we limit the analysis to the exclusive debtors of a single FI. Although in terms of goodness of fit, the models referring to this subgroup of people were lower, showing that it is more difficult to explain the volatility observed in terms of the gender gap in access to credit for this second group, the estimates mostly led to comparable qualitative results.
Section 2 / Financing of micro, small and medium-sized production units
Micro, small and medium-sized enterprises (MSMEs) are a fundamental asset of the global productive scheme, as they represent key actors for the growth of economies. These productive units play a preponderant role in the generation of private employment and are usually the gateway to the labor market for vulnerable segments of the population108.
The lack of access to financing is a relevant barrier in the expansion process for the MSME sector. This barrier is explained by the interaction of factors linked to the supply and demand of financing, such as the lack of guarantees, documentation requirements,109 the absence of data to assess the solvency of companies, high levels of informality, and uncertainty about the macroeconomic context110, among other factors. In this sense, this section analyzes the effective access to financing by this group of companies in the expanded financial system (SFA)111 in order to present their status according to the type of person, size, economic sector, and geography112.
As of December 2021, companies with MSME certification amounted to 1.6 million113. This group is made up of legal persons (PJ) and human persons (PH) with different corporate structures and independent work, with and without personnel in charge114. Within this group, some 520,000 companies had workers, that is, 32.5% of the registered MSME companies are job generators115.
Structure of MSMEs with financing. Of that universe, a number of 829,000 MSMEs (52% of the total) had active financing in the SFA as of December 2021, of which 76% are PH and 24% PJ116. On the one hand, the preponderance of PHs as a format for organizing economic activity explains why 96% of the number of MSMEs with SFA financing is concentrated in micro and small companies. On the other hand, assuming that all PJs have at least one employee, the proportion of PJ with SFA financing amounts to 38% of MSME-employing MSMEs.
Figure A.2.1. | Share of the number of companies with SFA financing by size and type of person
Data as of December 2021 and expressed in thousands
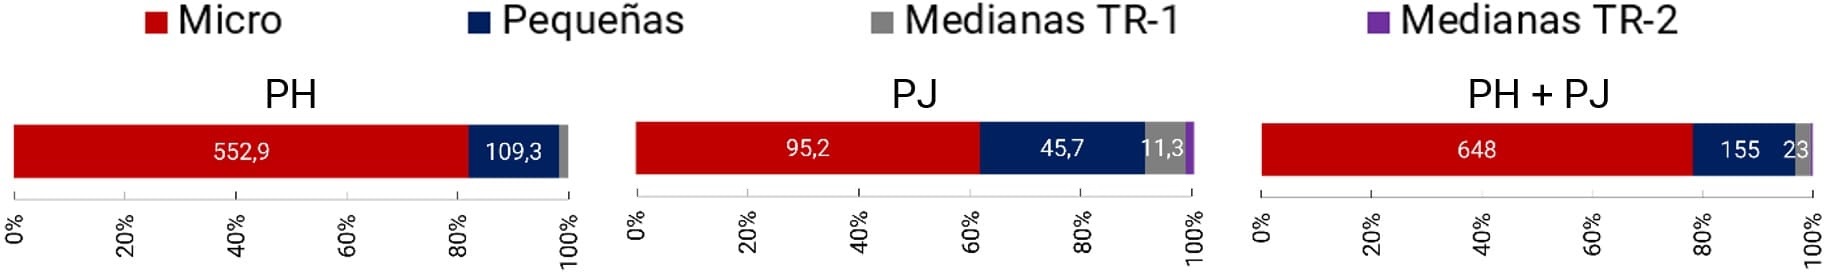
Note | “TR” means span.
Source | BCRA.
Access to financing shows a positive dynamic in the number of companies with financing in the SFA. Between December 2019 and 2021, MSME companies with financing in the SFA grew by 222,000 units, mostly micro (116,415) and small (94,130). Although in absolute terms micro companies had the largest contribution, small and medium-sized TR-1 companies (mainly PH) registered very significant growth rates, quadrupling and doubling, respectively, the number of companies with financing prior to the COVID-19 pandemic. It should be noted that the billing ranges involved to qualify as a small or medium-sized TR-1 company would imply that they are companies that are employers.
Figure A.2.2. | Evolution of the number of companies with SFA financing by size and type of person
Data expressed in thousands
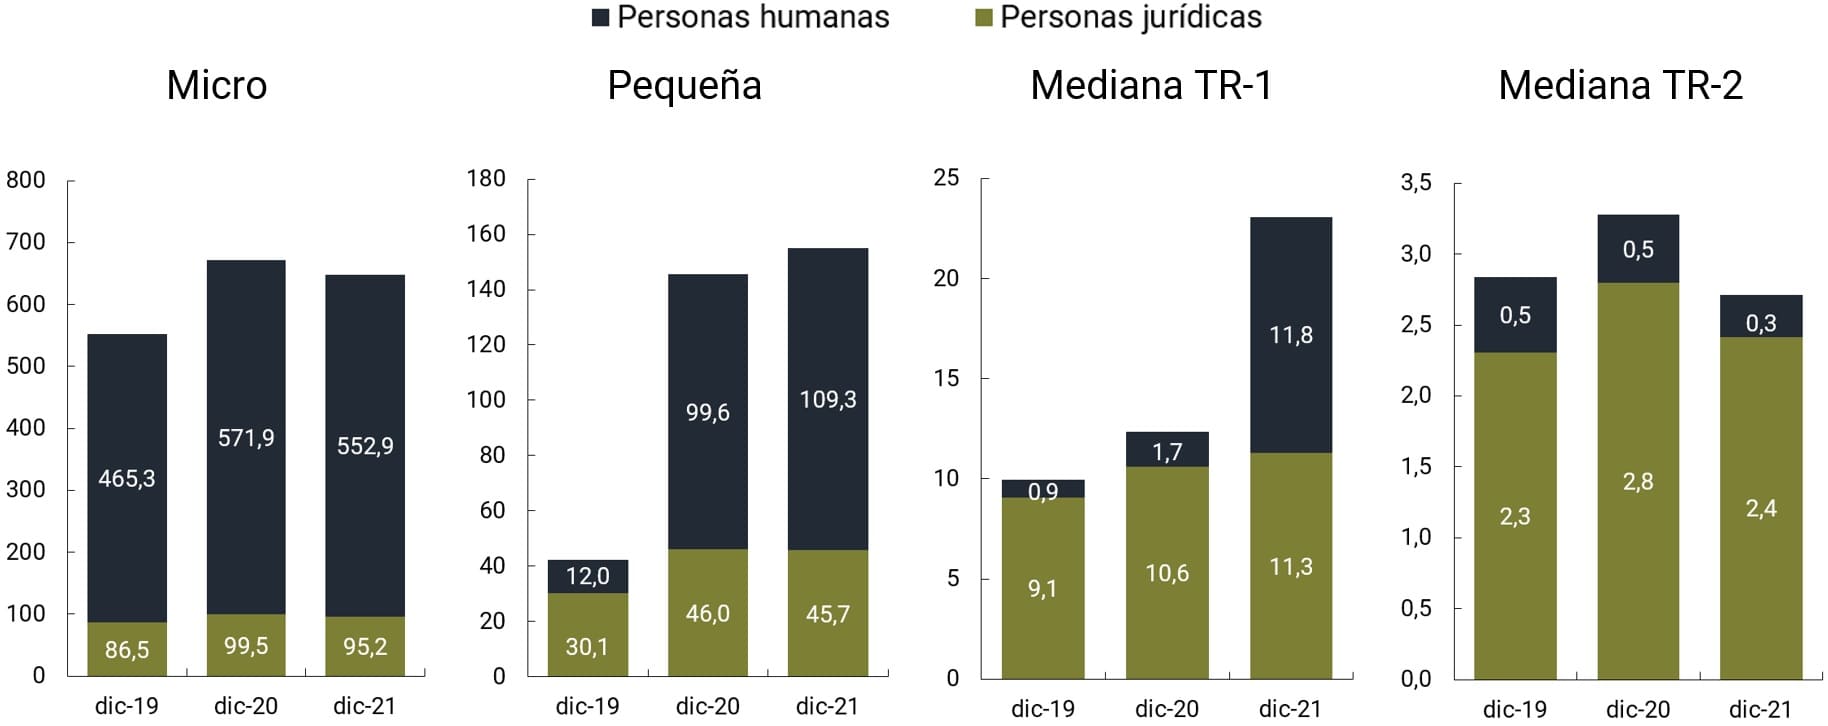
Note | In the set of small PH companies, the services and commerce sectors account for 95% of the increase. These productive units could have taken financing as a result of the negative impact caused by the COVID-19 pandemic to face-to-face activities or, having financing, regularize the MSME certificate to enter one of the programs to promote economic activity (Pre-Trip). On the other hand, in the TR1-PH medium-sized companies as a whole, the services sector explains almost all of the increase. Although this increase may be motivated by the COVID-19 pandemic, it is far from the beginning of it, which would indicate that other factors would be influencing the growth of these productive units.
Source | BCRA.
This situation was influenced by the lines of credit aimed at MSMEs in the framework of the COVID-19 pandemic with the aim of mitigating their impact. Although the conditions of such financing were exceptional, both due to the terms of the financing and the situation of economic activity, it was an opportunity for these productive units to build a relationship with financial institutions (EEFF) as credit providers.
Level of financing of MSMEs. As of December 2021, MSMEs had a financing balance with the SFA of $2.4 trillion in current values, which represented 53.2% of the balance of financing to the non-financial private sector (NFPS) and 4.4% of GDP117. While the share of financing to MSMEs in the total NFPS financing portfolio showed an increasing trend as of December 2019, its relationship with respect to GDP did not have a defined trend. Likewise, with respect to the format of organization of economic activity, most of the financing balance of MSMEs is concentrated in PJ, whose participation was around 78% in the last 3 years.
In the absence of information on the turnover of the companies, and in order to understand the relevance of the financing balance with respect to their income, the theoretical exercise of comparing the financing balance of MSME companies, of each size and economic sector, with the annual turnover amount provided in the SEPyME regulations for the classification of such companies was proposed. Given that the regulation proposes minimum and maximum amounts for each size and economic sector, the average value of each stratum was taken as the reference amount of their income.
Figure A.2.3. | Financing of MSMEs with the SFA discriminated by company size
Balance in billions of pesos
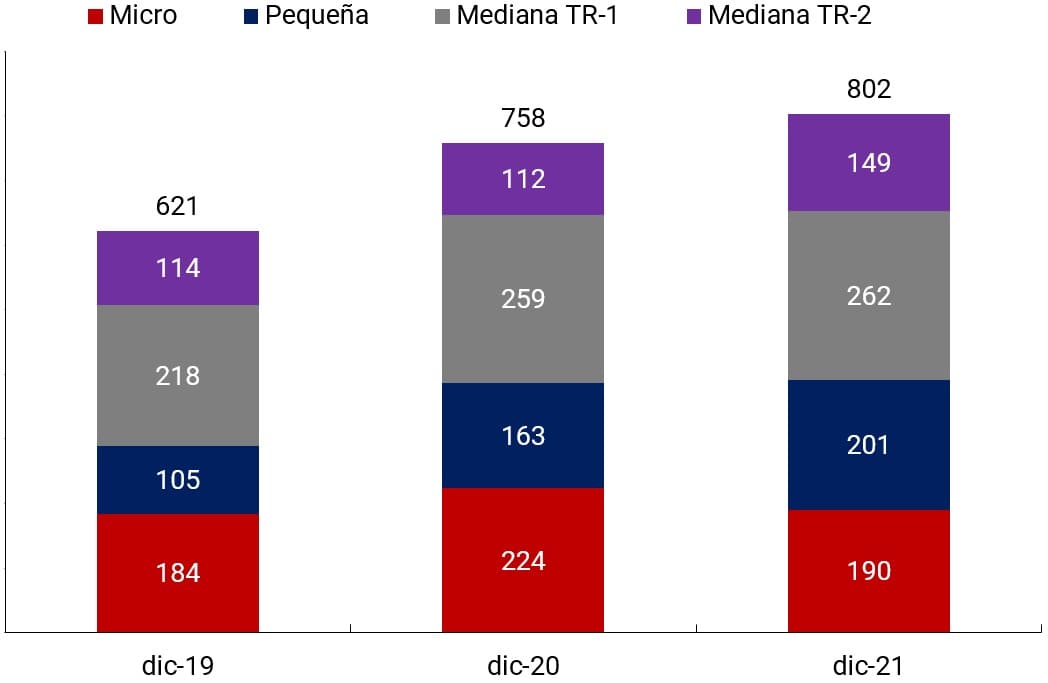
MSME Credit on GDP and NFPS Credit

Note | “MSME Credit” and “NFPS Credit” include financing in domestic and foreign currency.
Source | BCRA.
As a first point, the financing balance represented a low portion of the income of companies in all sizes of MSMEs. This situation contrasts with the high number of MSMEs with SFA financing, which represents 52% of MSMEs with certificates. In other words, the SFA grants financing to a significant number of MSMEs but for amounts that would be significantly lower in relation to their income generation.
Table A.2.1. | Financing balance in relation to theoretical annual turnover
Expressed in %
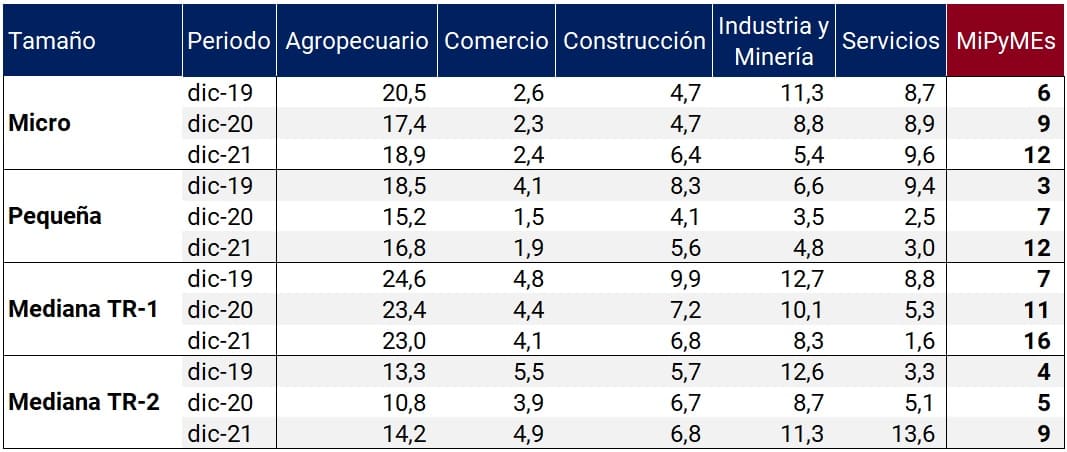
Source | BCRA.
However, when the economic sector is added to the analysis, differences were observed between the balance of financing and the theoretical generation of income of the companies, which are reproduced in all sizes of companies. The agricultural sector, followed by the industry and mining sectors, registered the highest ratios, which would be linked to the need for high sums of capital to face the business cycle such as the purchase of machinery and inputs. These sectors accounted for more than 50% of the financing balance throughout the observation period and recorded the highest average balances. At the other extreme, the construction sector obtained a significantly lower share than the other sectors. Finally, in the services sector, the participation of microenterprises in the sector’s financing balance was highlighted, unlike what happens in the other economic sectors where medium-sized enterprises have a greater participation-TR1118.
Figure A.2.4. | Distribution of MSME enterprises by economic sector and size with financing
Data as of December 2021

Source | BCRA.
This situation could represent a limitation in the growth of this group of companies, particularly the smallest, whose dependence on credit is essential for their business cycle and the execution of investment projects that increase productive capacity. Likewise, this situation marks the relevance of other sources of financing such as own resources and suppliers119.
Regional distribution. The geographical distribution of MSMEs with financing and their corresponding balance reflects the distribution of population and economic activity120. The province of Buenos Aires and CABA concentrated 54% of the number of MSME companies and 51.8% of the total financing balance as of December 2021. This is reflected in the predominance of the Central region over the rest of the regions, since it agglomerated 8 out of 10 MSMEs with financing and $8 out of $10 of the financing balance.
Figure A.2.5. | Geographical distribution of MSMEs and their financing balance
Data as of December 2021
Number of companies in thousands
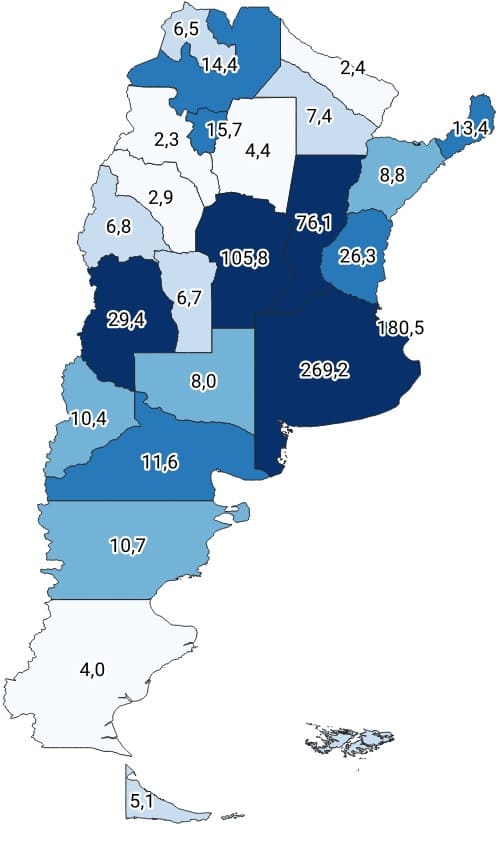
Regional distribution
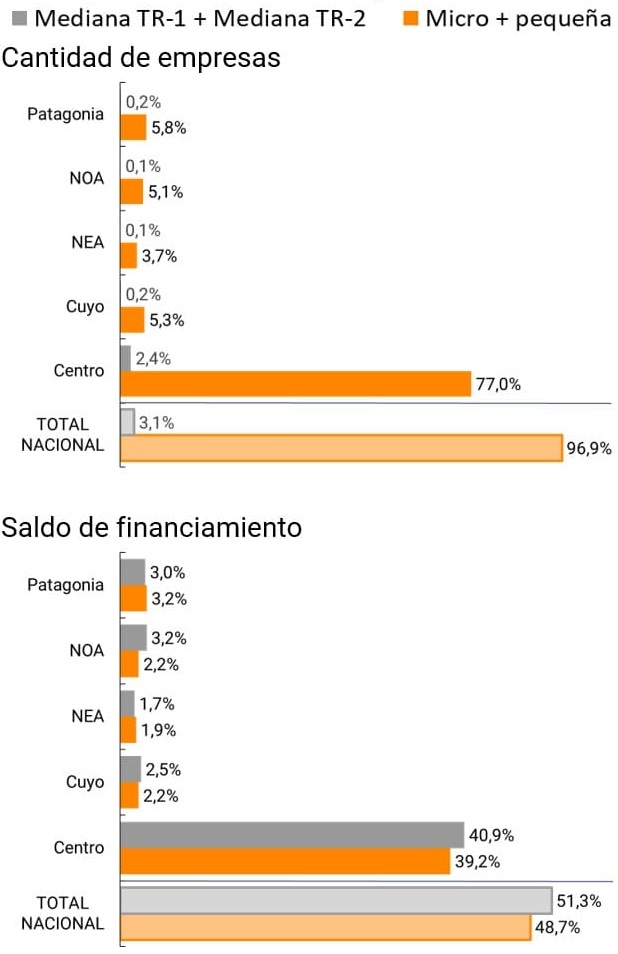
Source | BCRA.
Likewise, the consideration of the size of the productive unit, smaller companies (micro and small) and the largest (medium-sized), maintains the predominance of the Central region, both in number of companies and in financing balance. In each of the regions, the number of smaller firms far exceeds the number of medium-sized firms. In the balance of financing, a mixed behavior is observed, as medium-sized companies exceed smaller companies in the Central, Cuyo and NOA regions, being the opposite in NEA and Patagonia.
Methodological note
Population data
This IIF presents indicators that are disaggregated by different demographic and geographical variables. For the elaboration of these indicators, population data were used based on the projection made by the National Institute of Statistics and Census of the Argentine Republic (INDEC). Considering that this agency does not publish a series that simultaneously contains all the disaggregations used throughout this IIF (gender, age group and geographical location at the provincial, departmental and locality levels), it was necessary to take different series according to the definition of each indicator.
For the indicators at the national and provincial levels, the series called “Population by sex and five-year age groups for the country and provinces as a whole” was used. Years 2010-2040″, while for the indicators at the departmental level, the series “Estimated population on July 1 of each calendar year by sex, by department” was taken as a basis. Finally, since INDEC does not publish a projection of the evolution over time of the number of inhabitants of each locality, it was necessary to construct the series for the indicators at that level, for which the results of the 2010 National Census were taken as a basis.
For the purposes of this IIF, an “adult” is considered to be a person 15 years of age or older, following the standard used by the World Bank for its financial inclusion indicators.
Regionalization
For the purpose of developing regional indicators, the regionalization criterion proposed by the Ministry of Economy and Public Finance (currently the Ministry of Economy) was used, which establishes five regions, namely:
– NOA (Northwest Argentina): Salta, Jujuy, Tucumán, Catamarca and Santiago del Estero.
– NEA (Northeast Argentina): Formosa, Chaco, Misiones and Corrientes.
– Nuevo Cuyo: Mendoza, San Juan, San Luis and La Rioja.
– Patagonia: La Pampa, Neuquén, Río Negro, Chubut, Santa Cruz and Tierra del Fuego.
– Centro and Buenos Aires: Córdoba, Santa Fe, Entre Ríos, Buenos Aires and the Autonomous City of Buenos Aires.
In the text of this IIF, Nuevo Cuyo is mentioned as Cuyo and Center and Buenos Aires as Center.
Analysis of accounts by locality
In order to analyze the distribution of account tenure of adults throughout the Argentine territory, each person was assigned a locality code according to the name of the locality, postal code and province reported in the AFIP Register. This assignment coded localities with eight digits, while a ten-digit code is used for the population database. This generates differences in the results between the accounts section and the other analyses at the locality level of the Financial Inclusion Report.
The 15 communes of CABA make up a single agglomerate, while 6 localities are agglomerated in two. In this way, in this exercise a total of 3,520 localities are obtained, instead of the 3,538 that are used for the rest of the analyses.
To estimate the number of adults in each locality, a projection of the adult population by locality was used, as indicated in the Population Data section of this Methodological Note. This may generate a deviation in the estimation of account tenure levels because the population projection by locality was made on the results of the 2010 National Census and the estimated growth rates may show differences with the actual rates.
Payment accounts at payment service providers
Among the Payment Service Providers (PSPs) that operate in COELSA, there are providers that are registered in the BCRA’s Registry of Payment Service Providers (PSP) and other providers that are not registered. For the purposes of this report, only payment accounts for vendors that are registered as PSPs are posted.
Support from the BCRA
In order to study the scope of the minimum cash exemption mentioned in point 1.1 of Communication “A” 7254 in natural persons, the following procedure was carried out:
– The monthly sets of debtors are determined by the number of PHs without financing from financial institutions (EEFF) in December 2020 and with financing from EEFF in the months analyzed (from April 2021 to March 2022).
– CUITs/CUILs of people aged 100 years or older were excluded, those records without a date of birth reported in the AFIP Register, and additionally for calculations by age group, individuals under 15 years of age.
– In addition, those PHs with Zero Rate financing and Financing Line for Productive Investment (LFIP) were eliminated.
Regularity of debtors
Financial institutions (FFEs) and non-financial credit providers classify their debtors according to the ability to repay their debt. The BCRA regulations establish levels of grouping (“situations”) of debtors in decreasing order of quality. Situation 1 is one in which debtors are able to adequately meet all their financial commitments (even if they are late in payment), while Situations 5 and 6 are those in which the debt is considered uncollectible.
To calculate the percentage of debtors in a regular situation, the number of CUITs/CUILs classified in Situations 1 and 2 is grouped, i.e., those that can meet all their financial commitments. All other debtors are considered to be under the category of irregular situation. The indicator counts each person as many times as entities in which they have active debts, both EEFF and non-financial. In accordance with BCRA regulations, each debtor registers one situation per creditor.
MSME Business Credit
The MSME criterion proposed by the Ministry of Industry and Productive Development was used, in which an MSME is a micro, small or medium-sized enterprise, whose economic activity in the country is grouped in one of these sectors: services, commercial, industrial, agricultural, construction or mining. The size of the MSME is determined based on the economic activity and the amount of total annual sales. When the BCRA regulations so provide, financial institutions report the “código_pyme” field in the Central Bank of Debtors of the Financial System (CENDEU), which is made up of 2 digits, one indicating the size and the other the economic sector. Given that there are cases where the same company has different “código_pyme” assigned for the same period, the “código_pyme” corresponding to the credit assistance with the highest balance in each of the periods studied was used. For the assignment of the province to MSME companies, the tax domicile declared in the AFIP Registry was used.
Glossary
ACSF Complementary Financial Services Agency
AFIP Federal Administration of Public Revenues
ATM ATM
BCRA Central Bank of the Argentine Republic
CABA Autonomous City of Buenos Aires
CAH Savings account
CBU Uniform Bank Code
CENDEU Central Bank of Debtors of the Financial System
COELSA Electronic Clearing House
COP With pre-cancellation option
CUIT Unique Tax Identification Code
CVU Uniform Virtual Key
EEFF Financial Institutions
EF Financial Institution
EPH Permanent Household Survey
ETCNB Non-Bank Credit Card Issuers
FAS Financial Access Survey
CDF Direct Pool Fund
FCI Mutual Fund
IMF International Monetary Fund
HB Home banking
Hrs. Hours
A.I. Year-over-year
IFE Emergency Family Income
IIF Financial Inclusion Report
INDEC National Institute of Statistics and Censuses
CPI Consumer Price Index
LFIP Financing Line for Productive Investment
Loc Locations
M Mil
MB Mobile Banking
MSMEs Micro, Small and Medium Enterprises.
MPE Electronic Payment Methods
MPOS Mobile Device at Point of Sale
NEA Northeast Argentina
NOA Northwest Argentina
OPNFC Other Non-Financial Credit Providers
PCT Transfer payments
PDA Access Points
FAQ Fixed Term
PH Human Person
GDP Gross Domestic Product
PJ Legal Entity
PN Net Worth
PNFC Non-Financial Credit Providers
POS Point of Sale Device
p.p Percentage points
PSP Payment Service Providers
S Semester
SEPyME Secretariat for Small and Medium Enterprises and Entrepreneurs
SFA Expanded Financial System
SMVM Minimum Living and Moving Wage
SOP No pre-cancilation option
NFPS Non-Financial Private Sector
TAS Self-service terminal
TD Debit Card
TNA Annual Nominal Rate
TO Ordered text
TR Section
UVA Purchasing Value Units
VAR Variation
References
1 The EMAE, in its seasonally adjusted measurement, recorded during the first half of 2022 an average value (148.5) similar to that of the comparable periods in the years of expansion of the level of activity (2013, 2015, 2017) prior to the COVID-19 pandemic (National Accounts. Monthly Estimator of Economic Activity, INDEC). For its part, GDP in the first half of 2022 grew at an average quarterly rate of 6.5% y.o.y. (National Accounts, Progress Report on the Level of Activity, INDEC). The employed population in the 31 main urban agglomerations reached 13 million people in the second quarter of 2022, constituting the highest level historically (Labour Market. Socioeconomic rates and indicators (EPH), INDEC). Private consumption grew in the first two quarters of the year and, at constant prices, its share of GDP exceeded those recorded in comparable periods in the quarters where the COVID-19 pandemic had the strongest impact.
2 This behavior is observed from the construction of a real wage indicator based on the wage index (INDEC) and the Consumer Price Index (INDEC). The indicator shows certain oscillations during the last 18 months prior to June 2022, without a marked trend in that period.
3At the end of June 2022, the interest rate of the 28-day LELIQ amounted to 52% nominal per annum, with a total increase of 14 p.p. since the beginning of the year (see Monetary Policy Report, June 2022).
4 Communication A 7475. As of March 2022, this line had reached 219,000 companies (BCRA). In September it was again extended until March 2023 through Communication A 7612.
5 Communication A 7459 and Communication A 7491 .
6 It applies as long as the financing balance, per card account, is less than $200,000.
7 Communication A 7448 set at 40% the percentage of the financing of the Ahora 12 Program that is deductible from the minimum cash requirement in pesos as of 02.01.2022. The limit on the compensatory interest rate went from 53% in December 2021 to 60.25% in June 2022.
9 Credit Conditions Survey (first and second quarters of 2022, BCRA). Among the options available in the survey to explain the reasons for the rise in credit demand are: (1) higher income and/or job possibilities, (2) greater influx of customers to their bank, (3) more attractive interest rates, (4) increase in household consumption, (5) increase in investment in housing.
10 In the first half of 2022, the average number of residential accesses to fixed internet grew by 1.9% YoY, while the average number of residential accesses to mobile internet increased by 9.8% YoY (Services, Internet Access, INDEC).
14A digital profile refers to the abilities and skills that an individual has to use technology, as well as the possibilities of access to technological devices (computer, cell phone, etc.) and the internet.
15 The spread of the COVID-19 virus and mobility restrictions increased the download of financial apps globally by approximately 30%, i.e. more than 270 million downloads at the peak of the pandemic, Report on Lessons Learnt and Effective Approaches to Protect Consumers and Support Financial Inclusion in the Context of COVID-19, G20/OECD (2021). The sample is made up of 71 countries for Android and 56 countries for iOS and covers all regions of the world (Fintech in the Time of COVID-19: Technological Adoption During Crises).
16 Ibid.
17 Payment aspects of financial inclusion in the fintech era, BIS, 2020.
18 Globally, there is a trend towards a progressive reduction in the number of branches as a result, among other factors, of the growth of digital financial services and a strategy by financial institutions to reduce costs. 2020 FAS Trends and Developments, IMF and 2021 FAS Trends and Developments, FMI.
19 Communication A 7566 limited the operations that financial institutions may delegate to ACSFs to cash deposits and withdrawals; payments and collections; and the payment of social security benefits. This change in delegated operations is effective as of November 2022.
20 Communication A 7208 established an implementation schedule that contemplates that the percentage of ATMs with biometric readers must reach 60% by June 2022 and 100% by December 2022.
21 Financial Inclusion Report, second half of 2020.
22 Financial Inclusion Report, first half of 2020.
23 For example, Gershenson et. al (2021) found that the percentage of the population that uses the internet has positive effects on different measures of financial inclusion (see Fintech and Financial Inclusion in Latin America and the Caribbean).
24 The remaining 10% live in localities without connection, which report only one type of connection or as a dispersed rural population.
25 Access to and use of information and communication technologies. EPH, fourth quarter of 2021.
26 Factors such as the type of connection (ADSL, cable modem, dial up, fiber optics, satellite, fixed telephony, 3G, 4G, etc.), the download speed, its stability and the mode of contracting (prepaid, postpaid or mixed), condition the quality of the service.
27 The U.S. Federal Communications Commission recommends 1 mbps as the minimum download speed for general Internet browsing and email usage.
28 Among the limitations associated with a survey are the number of cases (around 1,000 people per country), the collection method used (telephone interviews in the case of Argentina) or the possibility that the person does not respond according to his or her real situation in the possession of financial products.
29 Demirgüç-, Asli, Leora Klapper, Dorothe Singer, Saniya Ansar. 2022. The Global Findex Database 2021: Financial Inclusion, Digital Payments, and Resilience in the Age of COVID-19. Washington, DC: World Bank. The variable “account.t.d” was considered, which includes both accounts in financial institutions and in payment service providers (See definition in Country-level data).
30 Average of 2021 = 95.2%, COELSA.
31 Data as of March 2018, COELSA.
32 The sum of the holdings in the “over 24 years” range is greater than 100 because the population projections were based on the 2010 National Census.
33 See Methodological Note.
34 See Section 1. Financial Infrastructure, Financial Inclusion Report, Second Half of 2021.
35 The amounts mentioned throughout the section are expressed at constant prices of January 2019 (Indec CPI January 2019 = 100).
36 “Digital Payment” includes the use of mobile money, a debit or credit card, or a mobile phone to make a payment from an account; or the use of the Internet to pay bills or purchases online or in a store in the last year. It involves payments from an account at a financial institution or payment service provider.
37 The Global Findex Database 2021: Financial Inclusion, Digital Payments, and Resilience in the Age of COVID-19, 2022, DemirgüçKunt, Asli, Leora Klapper, Dorothe Singer, Saniya Ansar, World Bank
38 Access to and use of information and communication technologies. EPH, fourth quarter of 2021.
39 Fees for credit card payments fell from 2.5% in 2017 to 1.8% as of 2021. In the case of debit cards, these fell from 1.2% to 0.8% in the same period of time. In mid-2021, the crediting period for debit card payments was shortened to one business day. Source: FECOBA.
40 The electronic means of payment (EPM) market is usually classified as a two-sided or bilateral market (OECD, 2009, TwoSided Markets). These markets are characterised by the existence of two types of user groups (consumers and businesses in our case) intermediated by a platform (for example, a payment scheme). One of its features is the existence of indirect externalities between both groups of users. They arise because the usefulness of the use of MPE for consumers (merchants) increases if there are a greater number of merchants (consumers) that accept (use) electronic payments (and vice versa). In Argentina, in recent years, both the number of people with accounts (bank and payment) and the number of businesses that accept electronic means of payment in their new modalities (mPOS, QR) have grown, two of the fundamentals that help to understand the more than proportional expansion of the number of operations with MPE than that of users (number of accounts and point-of-sale terminals).
41 In this report, wire transfers are equivalent to the so-called “push” transfers in the Retail Payments Report (2nd Half 2021). Therefore, they do not cover the PCTs, which are discussed in the following subsection.
42 They are supposed to be initiated through a cell phone. Based on the information published in the BCRA’s Retail Payments Report and the Standardized Tables of Statistical Series (debser file), it is estimated that 92% of transfers originating in a payment account (from a CVU) were initiated on a mobile device (second half of 2021).
43 Financial Inclusion Report, second half of 2021.
44 PCTs are instant transfers used to make a payment for the acquisition of a good and/or service with the participation of an acceptor. The acceptor offers merchants the tools to charge with this means of payment. PCTs have different commercial rules from the rest of the immediate transfers (Retail Payments Report, BCRA).
45 Last available data for the series disaggregated by PCT initiation modality: April 2022.
46 PCTs can use as a credential a card associated with an account (in practice, debit cards are used) or the Standardized Payment Interface (which includes payments by QR code reading). The Payment by Transfer instrument and its different forms of initiation can be consulted in section 3.2. of the T.O. National Payment System – Transfers – Complementary Rules (in particular points 3.2.2. and 3.2.7.).
47 Developments in retail fast payments and implications for RTGS systems. Committee on Payments and Market Infrastructures.December 2021.
48 56% of the population said they had a debit card in 2021 versus 47% in 2017, Global Findex, 2017 and 2021, World Bank.
49 Survey of supermarkets and wholesale self-services. Total sales at current and constant prices, by item group and jurisdiction.
50 To compare transactions with electronic means of payment per capita at the country level, the following database can be consulted: Payments and financial market infrastructures, BIS.
51 Financial Inclusion Report, second half of 2021.
52 The amounts mentioned throughout the section are expressed at constant prices of January 2019 (Indec CPI January 2019 = 100).
53 It is updated through the Reference Stabilization Coefficient (CER), which follows the evolution of the Consumer Price Index (CPI).
54 Information collected from the websites of the EEFF in July 2022. There were 23 EFFs offering money pools (DCFs), of which 19 are private banks and 4 are public banks.
55 Argentine Chamber of Investment Funds – Glossary.
56 Monthly Summary on the Mutual Fund Industry, CAFCI. Dec-2021 and Jun-2022.
57 The balances mentioned throughout the section are expressed at constant prices of January 2019 (Indec CPI, January 2019 CPI = 100).
58 These balances are estimates, since many of the funds are not linked exclusively to the agent entities.
59 See Graph 2 in Section 2 of this report where it is observed that only 3.3% of the adult population exclusively owns an account in a PSP.
60The total balance of fixed terms made by individuals includes fixed terms in pesos and UVA without the option of pre-cancellation.
61 Includes bank and payment accounts.
62 Based on a survey of the websites of the 10 financial institutions with the highest deposit balance, 70% offer the UVA fixed term without the option of pre-cancellation to companies.
63 Figure 64. Survey to measure financial capabilities in Argentina.
64 For example, Fintech companies exploit information from their trading platforms, such as the volume and amounts of transactions, the reputation of their users, and specific characteristics of the industry in which they operate, to assess their customers’ credit and offer them financing (see, for example, Frost, J. et. al. BigTech and the changing structure of financial intermediation. BIS Working Papers No 779).
65 The amounts mentioned throughout the section are expressed at constant prices of January 2019 (Indec CPI January 2019 = 100).
66 Financial Inclusion Report, second half of 2021.
67 Communication A 7146 (of 22.10.2020) provided that companies must register as long as they have granted financing for an amount greater than $10 million. In the case of mutual associations and cooperatives, they must register as long as they have financing granted for at least $20 million, to the extent that they are subject to credit from financial institutions.
68 The amounts mentioned throughout the section are expressed at constant prices of January 2019 (CPI Indec, CPI January 2019 = 100).
69 See Type of assistance.
70 For more detail, see “Section 1 / Regulatory incentives to improve financial inclusion in Argentina”.
71 Point 1.1. of Communication “A” 7254.
72 The maximum annual interest rate applicable to the financing depends on the EEFF providing the credit. For the financing of the month of October 2022, these TNAs range from 77%, maximum rate for EEFF group A, B and subsidiaries G-SIBs, and 93.5% for the rest of the EEFFs.
73 “New PHs with financing” refers to PHs that did not have financing from EEFF as of December 2020 and, in some of the months of study, have financing from a EEFF that participated in the incentive policy in question
74 Minimum Cash Information Regime (RI-EM).
75 This number includes the new individuals with EEFF financing, with respect to December 2020, in each of the months of analysis. Therefore, it differs from the values mentioned at the beginning of the section where the metrics represent net variations, that is, both new PHs with financing and those that no longer have it.
76 See Graph Table 2, Financial Inclusion Report, second half of 2021.
77 In the first of these cases, the supplier or financial institution, after the purchase of a good has been made, offers the user to take a credit for the amount equivalent to the purchase made. In the second case, the purchase of a good through an account in a PSPCP can be partially made by paying with a balance on account and the remaining difference by another means of payment, such as debit or credit card.
78 Communication A 7245 re-established the classification of debtors in accordance with the general criteria for default prior to the COVID-19 pandemic.
79 The Economics of Banking on Women: 2019 Edition, Financial Alliance for Women, 2019.
80 Financial integrity variables include financial burden (percentage of monthly income that is allocated to the payment of financial obligations) and leverage (number of monthly revenues that a debtor would have to allocate to pay off its financial obligations in full). Report on Gender in the Financial System, Financial Market Commission, 2022.
81 At this point, it is worth recalling the regulatory change that provided for the mandatory registration of PNFCs with the BCRA as of December 2020 and the consequent obligation to report the financing granted in the Central Bank of Debtors of the Financial System (CENDEU), which generated an increase in the number of reporting OPNFCs from 207 in November 2020 to 232 in June 2022.
82 Financial Inclusion Report, first half of 2020 and Financial Inclusion Report, first half of 2021.
83 Credit providers use CENDEU credit information to analyze people who request financing from them and monitor the risk of their existing credit portfolio. On the other hand, credit reporting allows regulators to identify the risks faced by BSE and large creditors, as well as to carry out their supervisory functions. World Bank.
84 Financial Inclusion Report, Section 2 / Gender gaps. Management positions in financial institutions and access to credit, first half of 2021.
85 We consider the authorities occupying hierarchical positions in the EFSs as regular Directors and Managers.
86 See Communication A 7100 of September 3, 2020, which introduces a series of good practices aimed at improving equity and gender parity in the “Guidelines for corporate governance in financial institutions”.
87 Since the same woman/man may have funding from more than one FFEE, this woman/man will count as many times as the number of different FFEs assisting him/her. Therefore, the number of unique women/men with funding is not indicated, but the number of times that the combination of a woman/man with a EEFF that finances it is observed. We present the information in this way for consistency with the econometric analysis that is then performed at the EEFF level. Similar treatment is given in the calculation of average balances.
88 A red line indicates the month of the beginning of the COVID-19 pandemic in Argentina.
89 See Bartels, Brandon L. (2008). Beyond “Fixed Versus Random Effects”: A Framework for Improving Substantive and Statistical Analysis of Panel, Time-Series Cross-Sectional, and Multilevel Data, George Washington University; Bell, Andrew and Jones, Kelvyn. (2012). Explaining Fixed Effects: Random Effects modeling of Time-Series Cross-Sectional and Panel Data, University of Bristol y Mundlak, Yair. (1978). Pooling of time-series and cross-section data, Econometrica, 46(1): 69-85.
90 Balance and average balance.
91 Age or seniority.
92 Balance and average balance.
93 Age or seniority.
94 Data from Google trends, in particular, the results obtained for the search for the term “feminism” reported for Argentina in the period under analysis.
95 Data from the Ministry of Health of the Argentine Republic, in particular, information on hospitalizations for COVID-19 downloaded from the site.
96 Data from INDEC, in particular, from the seasonally adjusted series 2004=100 of the EMAE.
97 See note 86.
98 See first row of column (1 A) of Table A.1.1.
99 54.17% / 45.83% ̃ 1.1819.
100 50.27% / 49.73% ̃ 1.0109.
101 It is important to remember that we indicate the ceteris paribus condition, so we limit ourselves to exploring the impact of this single variable in the example. However, it should be noted that the EFFS that do have a salary account have, over those that do not have them, a favorable impact in terms of gap reduction of 0.0642, which corresponds to the estimated coefficient for the variable “Provides salary account” in the model corresponding to column (1 A).
102 Fraction, age and seniority gaps.
103 Constant + coefficient corresponding to “Provides salary account”.
104 For example, if we look at the first two coefficients in column (1 A) that correspond to the variable “Gap in the fraction of authorities” in its “effect within” for the dimension “Quantity”, which are 0.1819 and -0.1710, the impact for the LFSE that do not offer salary accounts is 0.1819; the “differential” impact of the LFSE that do offer it is -0.1710 and the “total” impact for the latter is (0.1819 – 0.1710) = 0.0109.
105 They are doubly important because they refer to people who have a “formal” job and also provide relevant information regarding income and expenditure profiles.
106 In terms of sign.
107 Includes the other managements reported through the IR Institutional Information of Financial and Exchange Entities, including those of Administration, Treasury, Auditing, Systems, Security, Human Resources, Legal, and excluding the General Management. For reasons of temporal consistency, we have also excluded from the analysis the Branch Managers and the “Other” Managers.
108 The amounts mentioned throughout the section are expressed at constant prices of January 2019 (Indec CPI January 2019 = 100).
109 Promoting Digital and Innovative SME Financing, GPFI, G20, 2020.
110 Financial inclusion of small and medium-sized enterprises in Argentina, Sergio Woyecheszen, ECLAC, 2018, GPFI, G20, 2020.
111 See Methodological Note to know the process of assigning the size and sector to each productive unit. The analyses include both the financing of companies incorporated as legal entities and those individuals that carry out a productive and/or commercial activity without being incorporated as companies or legal entities.
112 The province assigned to each productive unit is determined by the address declared in the AFIP Register.
113 Secretariat of Small and Medium Enterprises and Entrepreneurs (SEPYME), Argentina.gob.ar.
114 MSME Certificate. Micro, small or medium-sized enterprises that control or are controlled and/or linked to other national or foreign companies or economic groups that do not meet the required requirements may not be registered.
115 Corresponds to companies with fewer than 500 employees. Social Security Bulletin, AFIP, Dec-21.
116 Data obtained from CENDEU of the BCRA. In this document, MSMEs are considered to be microenterprises, small enterprises, medium-sized companies section 1 and medium-sized companies section 2, following the guidelines provided by the Ministry of Productive Development. The analyses of PH companies may be influenced by the fact that it is not possible to distinguish precisely financing for productive purposes from lines of credit for consumption.
117 BCRA – NFPS loans and deposits. Consider NFPS financing with EEFF.
118 Overview of companies in Argentina, Graph 4, 2019.
Share on


