I. Recent measures2
The BCRA adapted the prudential rules related to MSMEs in order to take into account the current macro context and align them with the recommendations of the Basel Committee on Banking Supervision. The maximum exposure limit for an MSME to be framed as a retail portfolio was increased to the equivalent in pesos of €1 million. 3 In addition, the amount determined as a limit to be able to include deposits or other source of funding of MSMEs as “unsecured wholesale funding provided by MSMEs” was increased by the same amount.
In October, the amount from which second-degree public banks can take time deposits was raised to $10 million, eliminating the minimum term of their arrangement.4 In addition, they were allowed to finance working capital.
In order to bring the liquidity requirement on foreign financial line obligations into line with that of other bank liabilities with similar characteristics, the BCRA applied minimum cash requirement rates of up to 23% (depending on the residual term) for these instruments (both in pesos and in foreign currency). 5
II. Activity
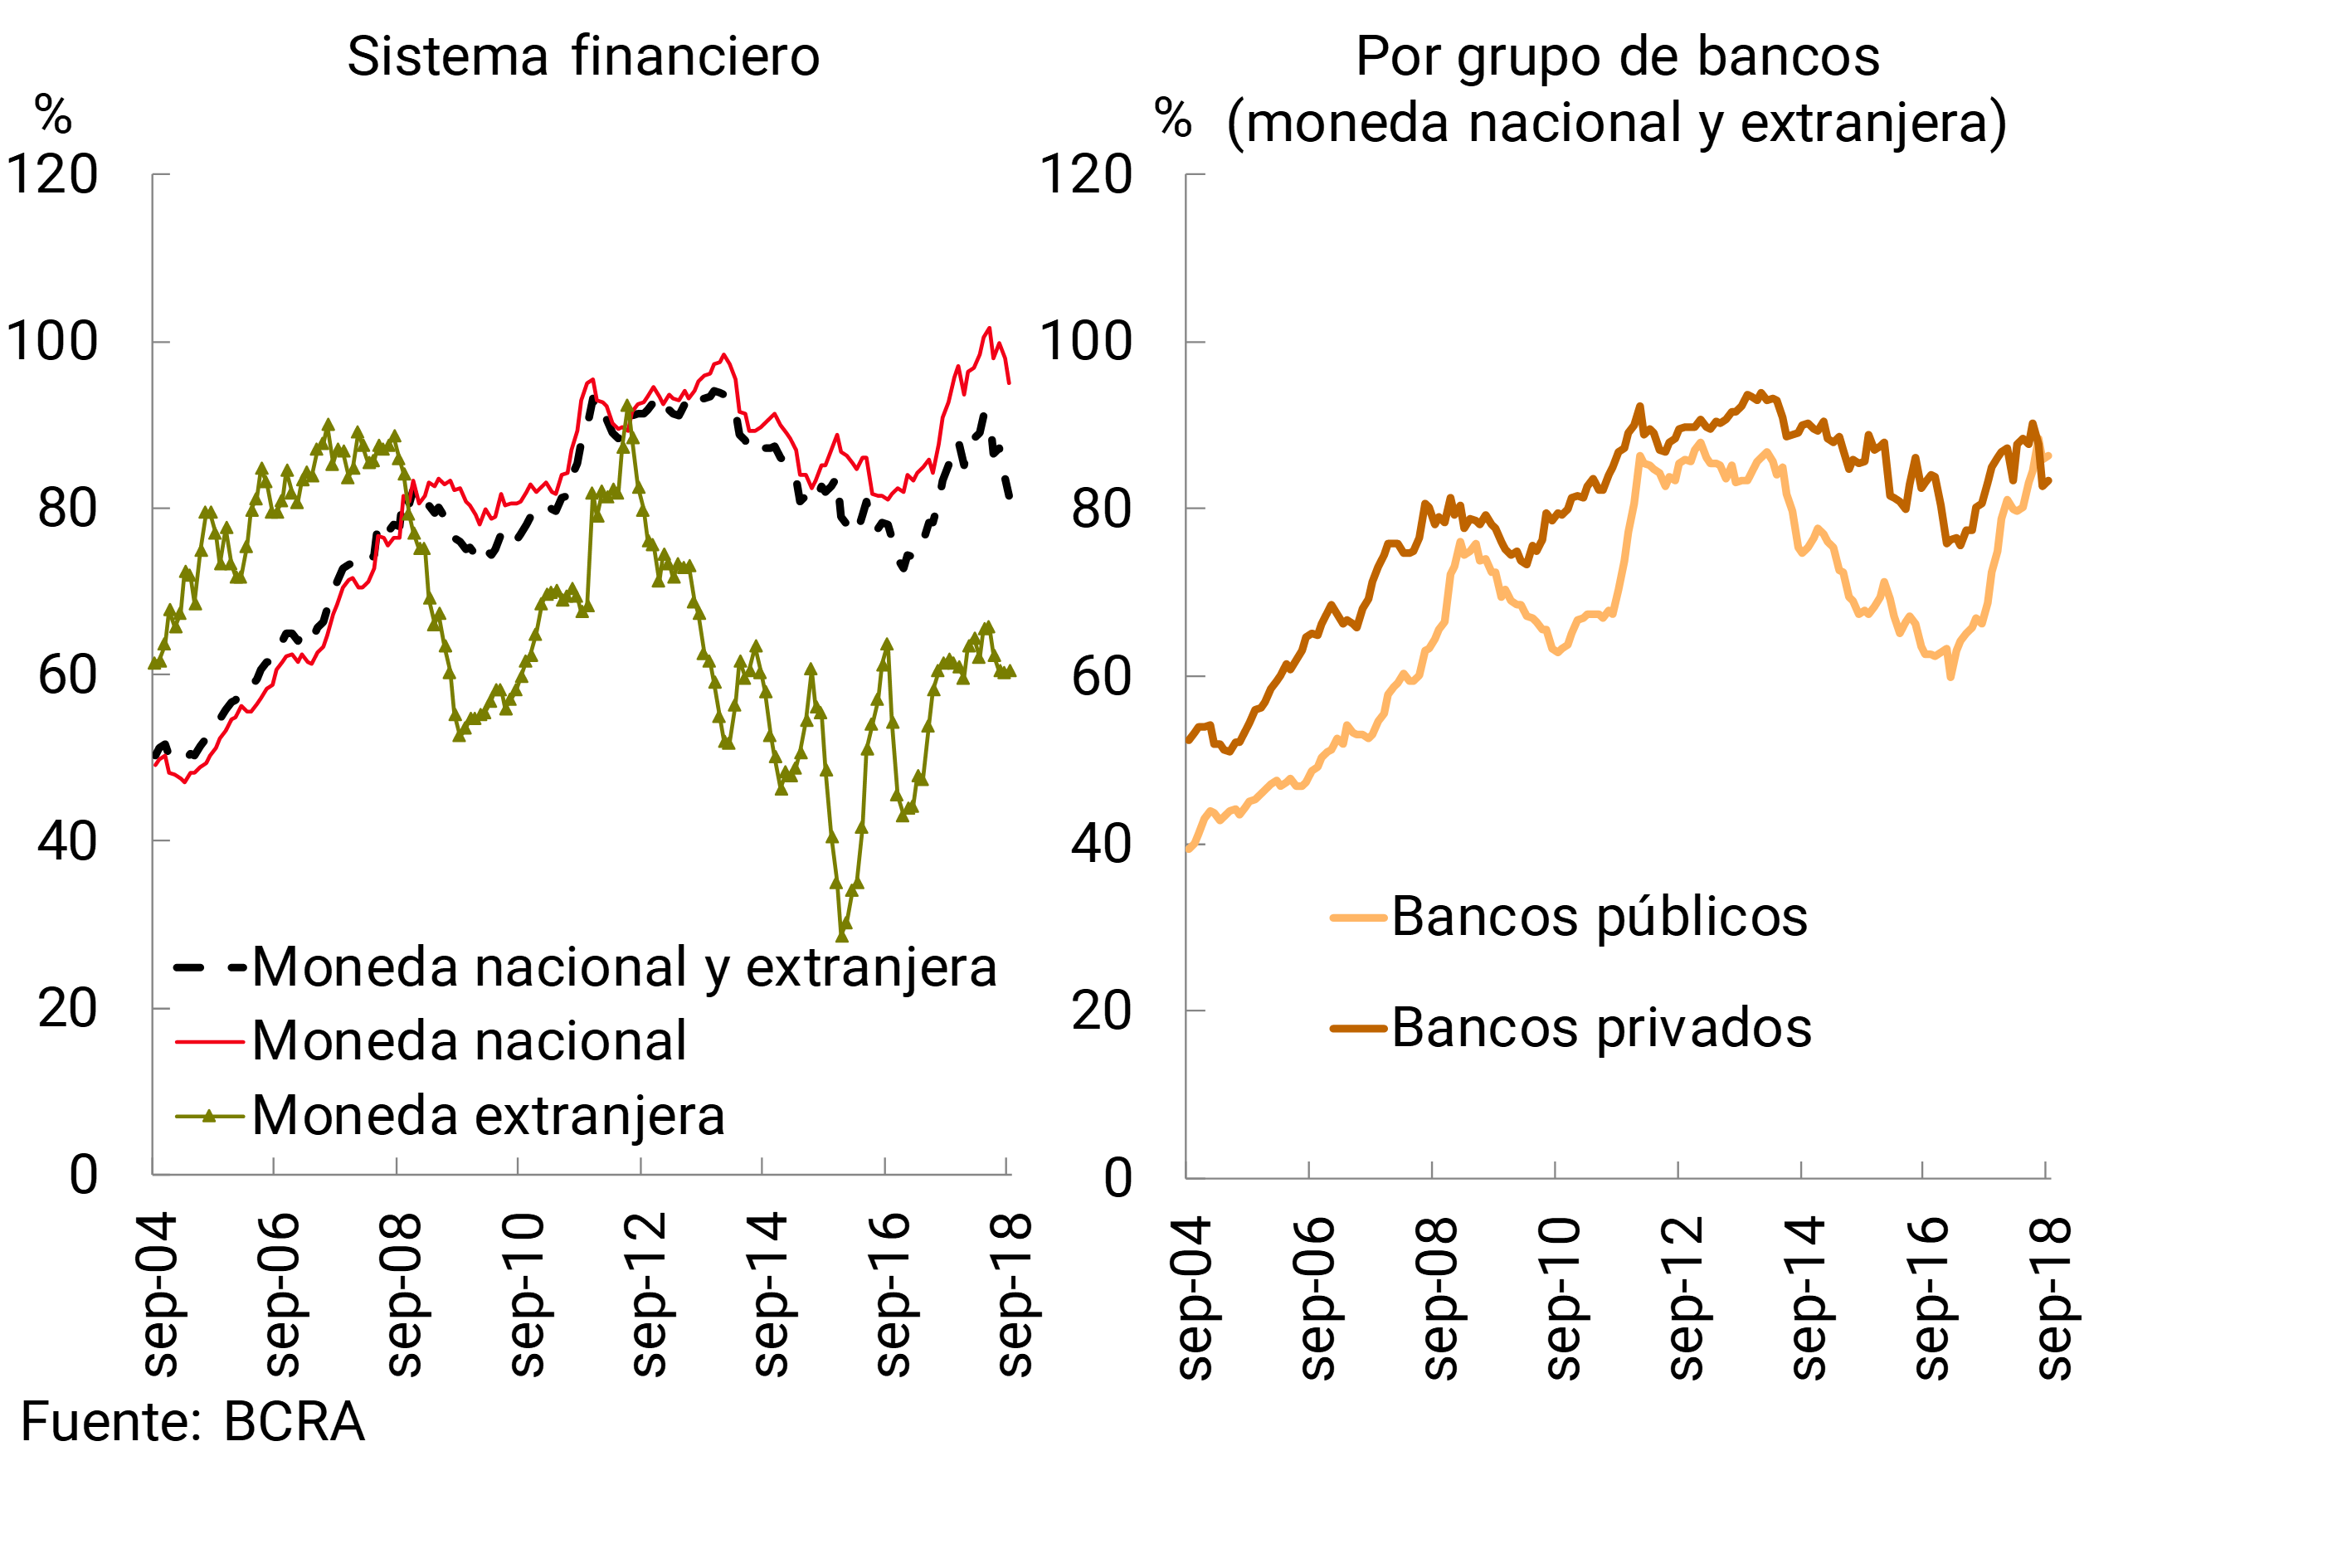
As in recent months, the financial intermediation of banks as a whole with the private sector continued to moderate in September. In this context, the total assets of the financial system fell by 2.7% in real terms in the period. 6 With a balance of deposits that showed a higher nominal growth than that recorded by credit, the ratio between the two continued to fall in the month, to 82% at the aggregate level (see Graph 1). This was correlated in terms of lower credit exposure and higher levels of liquidity for the sector. 7
Graph 1 | Loans in Deposit Terms – Balance Sheet Balances – Private Sector
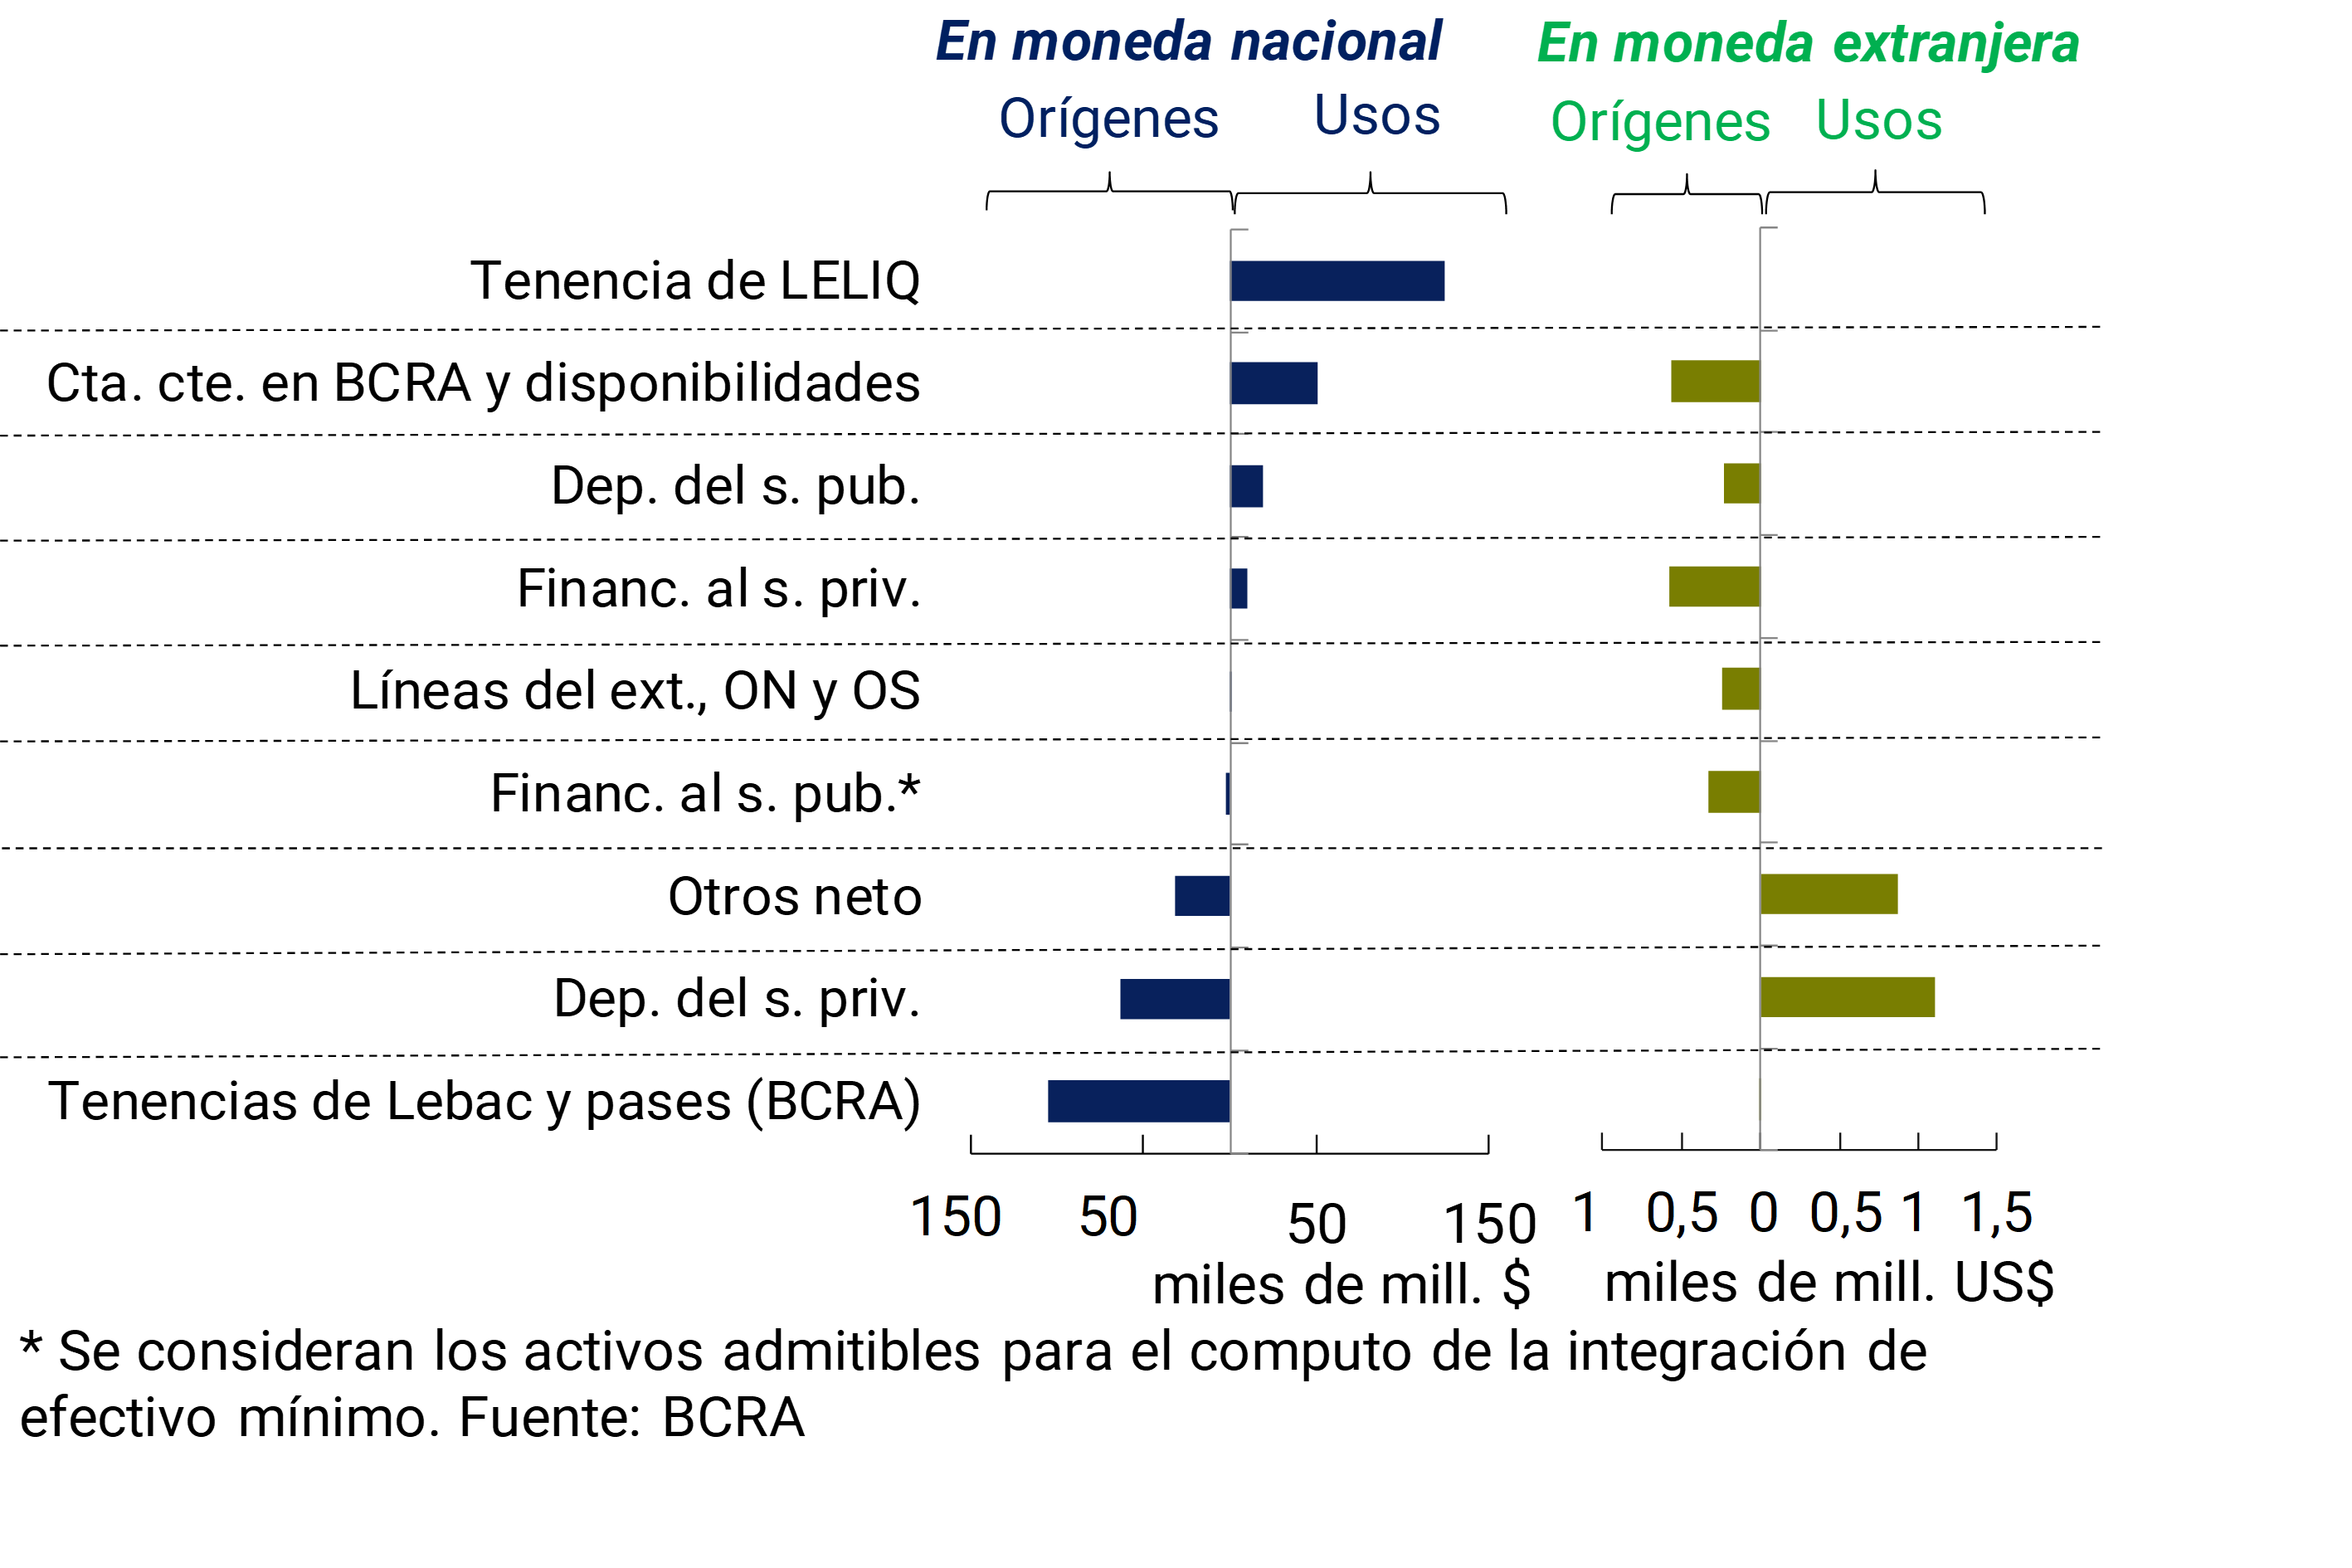
To analyze the main characteristics of the monthly operations of the financial system, an estimate of the flow of funds for the items in national currency of the sector is presented.8 In September, the main sources of resources came from the decrease in LEBAC holdings ($106,000 million) and the increase in private sector deposits ($64,000 million) (see Graph 2). These funds were mainly used to increase the balance of LELIQ ($124,000 million) and current accounts at the BCRA ($51,000 million). For its part, banks’ foreign-currency balance sheet declined slightly in the month. The decline in credit to the private sector and liquidity in this denomination were the most relevant sources of funds in September. While the main application of these resources was the reduction of private sector deposits.
Graph 2 | Sep-18 Cash Flow Estimate – Financial System – By Source Currency
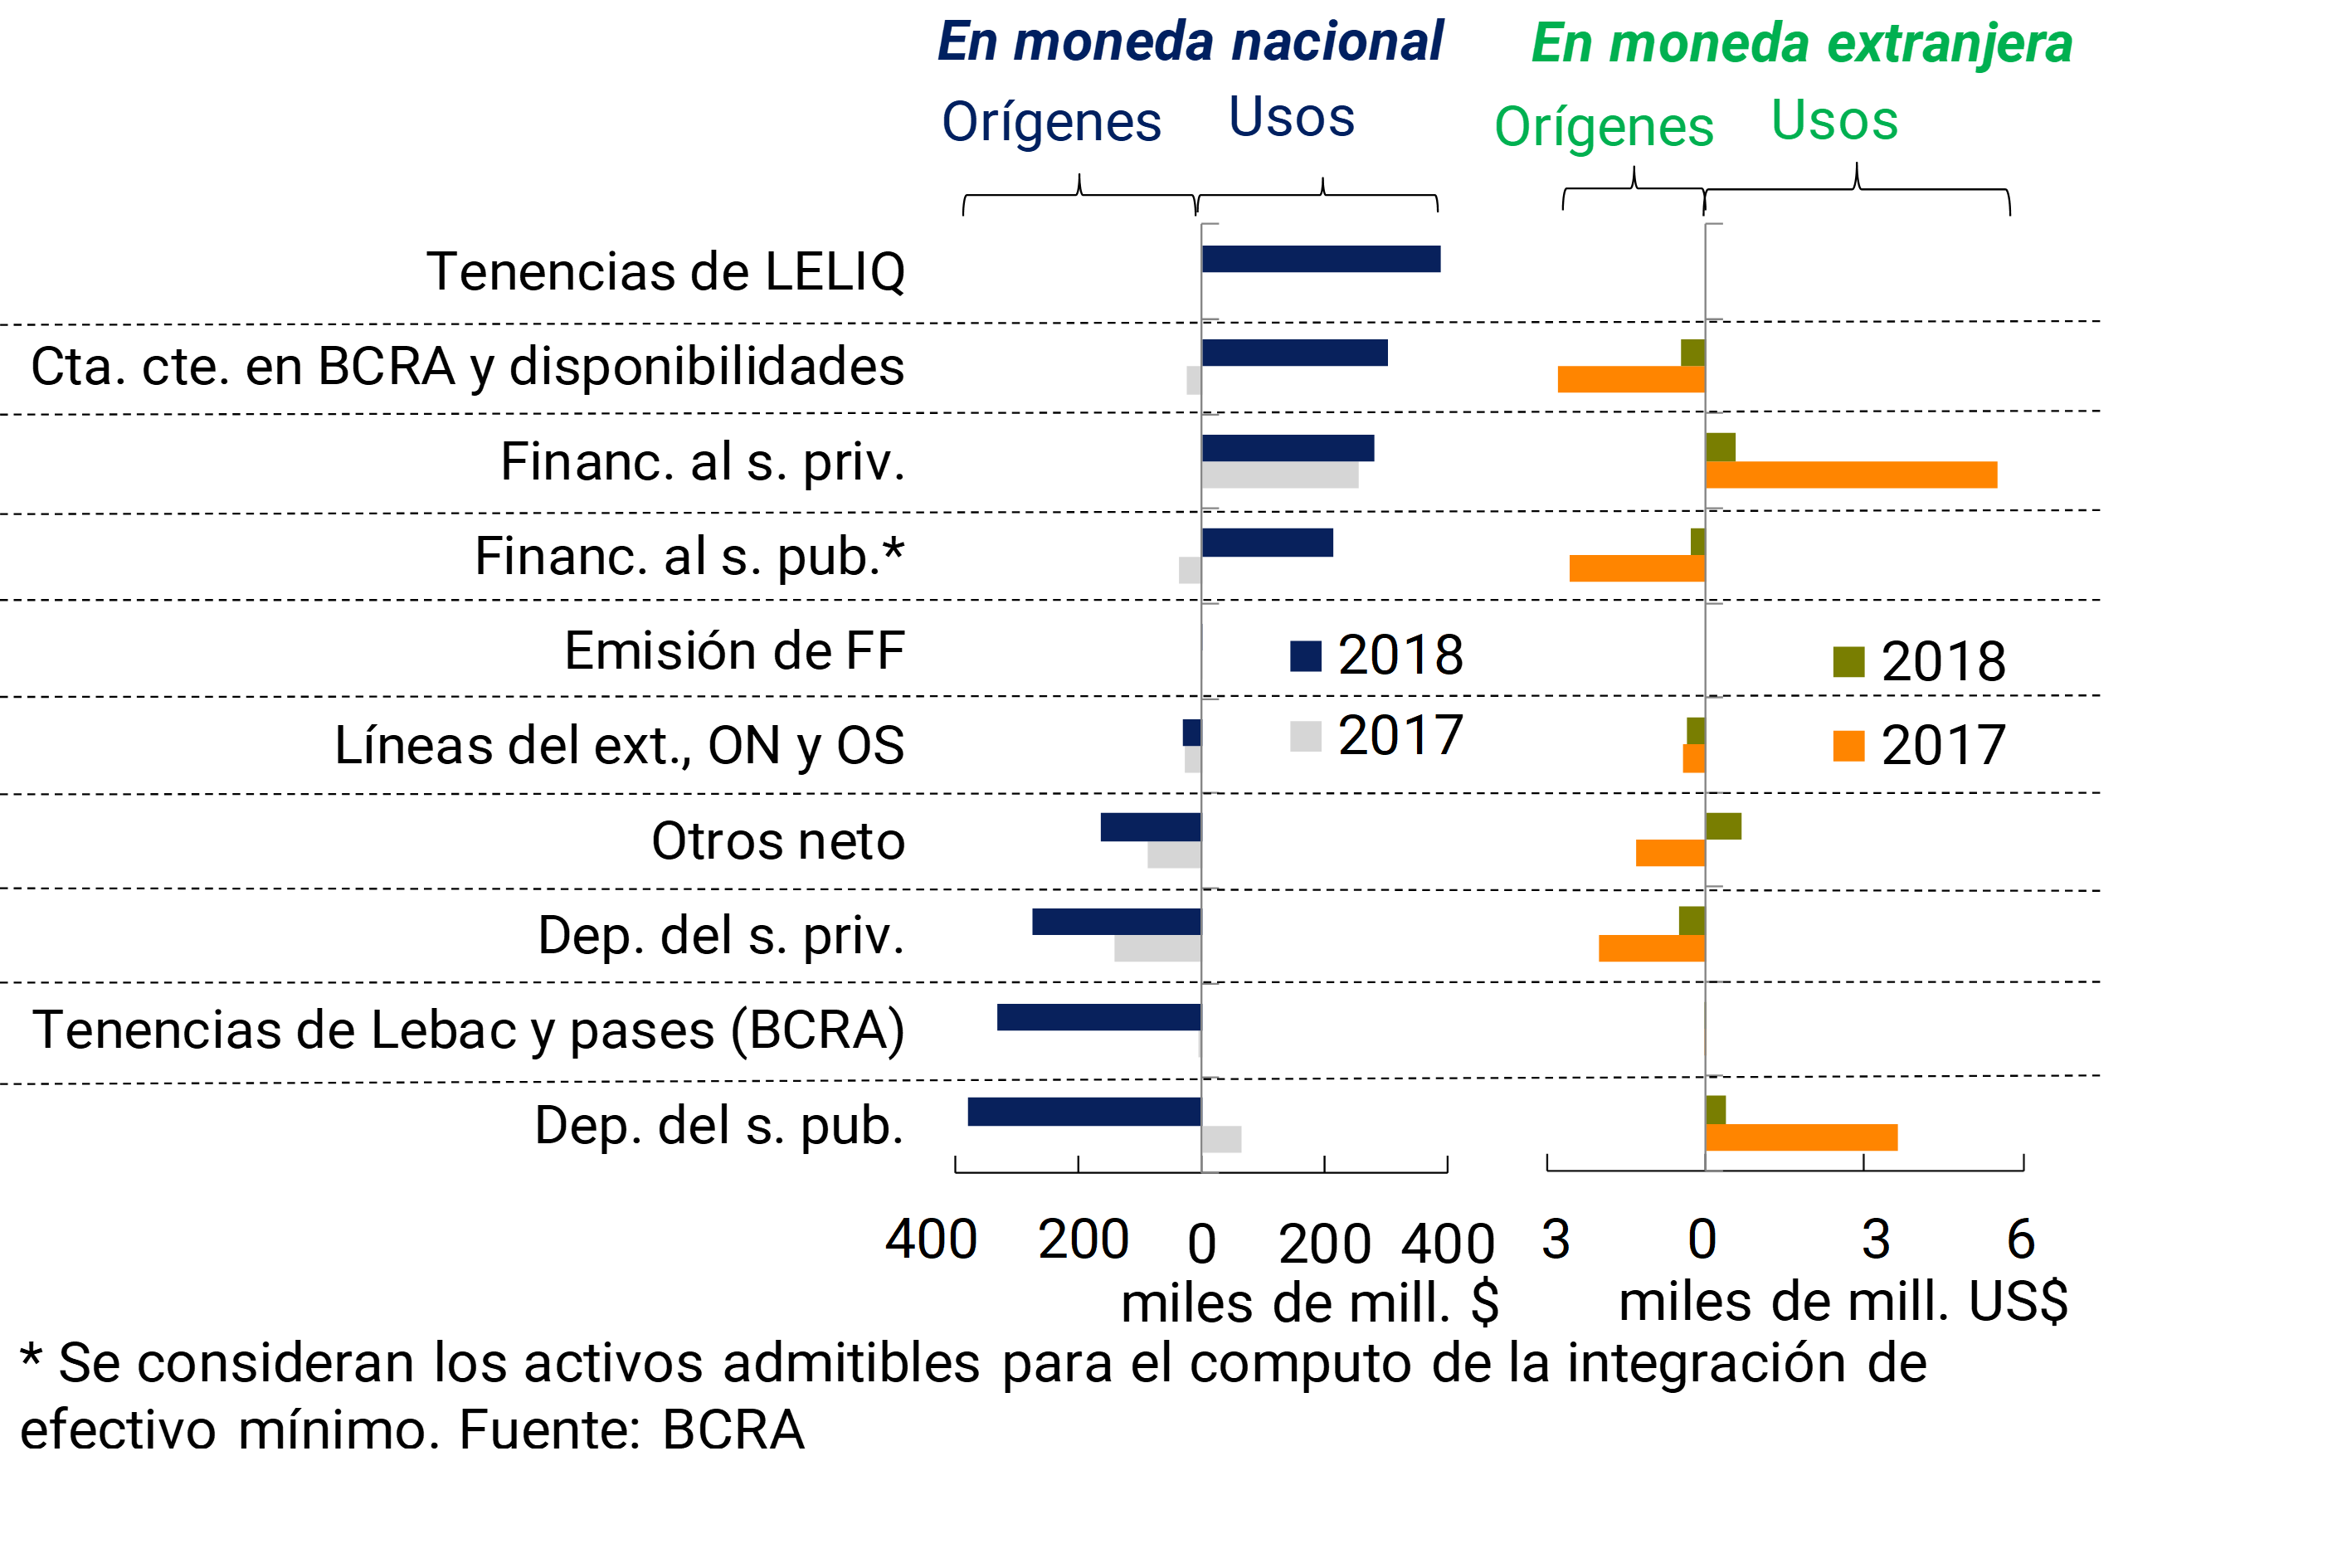
In the first 9 months of the year, considering the items in national currency, the aggregate financial system was mainly funded by the increase in public sector deposits ($379,000 million), the reduction in holdings of LEBACs and passes with the BCRA ($331,000 million) and the increase in private sector deposits ($276,000 million) (see Graph 3). 9 These resources were mainly channeled to increase the holdings of LELIQ ($389,000 million), the current accounts that the entities have in the BCRA ($302,000 million) and financing to the private sector ($280,000 million). Considering the movements of the main items of the balance sheet in foreign currency, so far in 2018, there was evidence of a lower volume of operations compared to the same period of the previous year. Rising private sector deposits coupled with reduced liquidity were the most relevant foreign currency funding sources for banks. Meanwhile, the increase in financing to the private sector and the decrease in public sector deposits were the main applications of resources in the period for the items in this segment.
Graph 3 | Estimated 9-Month Cumulative Cash Flow – Financial System – By Source Currency
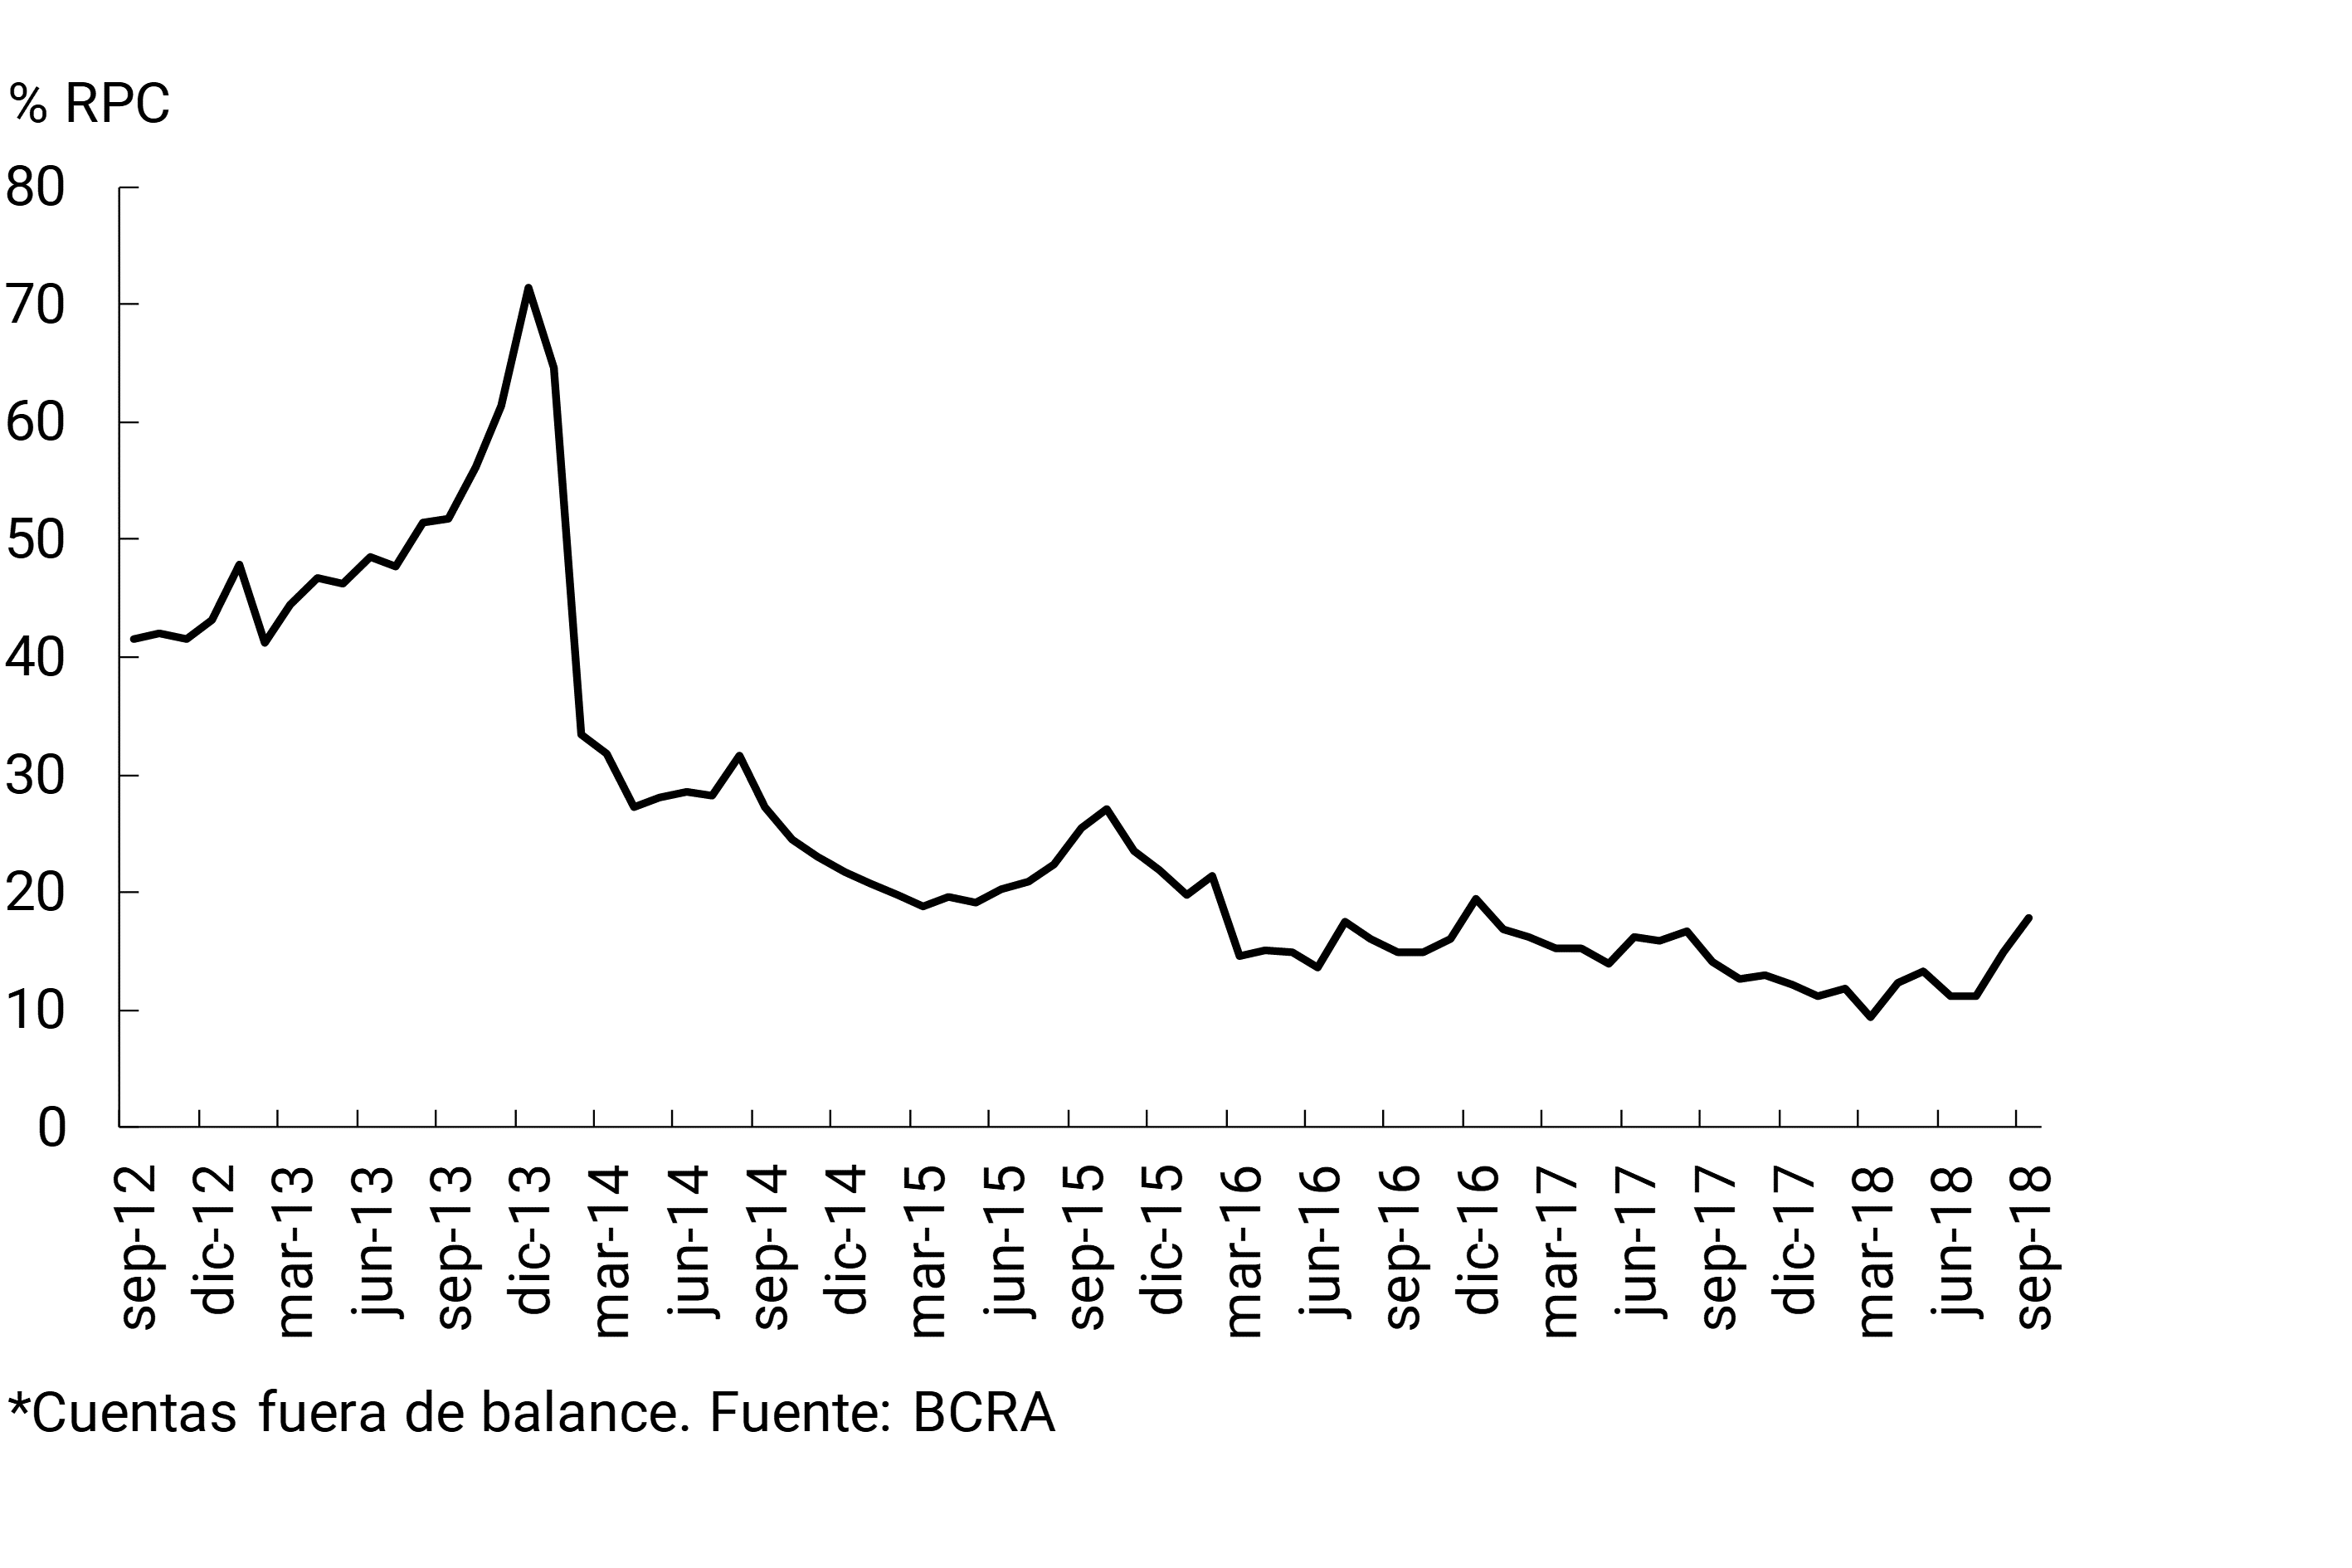
In September, the mismatch of foreign currency assets – measured in pesos – grew 2.9 p.p. of the PRC – Computable Patrimonial Liability – to total 17.8%.10 The monthly increase was mainly explained by the higher net purchases of foreign currency at the future. It should be considered that this mismatch is at relatively low levels compared to the peaks evidenced in previous years (see Graph 4), mainly as a result of the BCRA’s macroprudential regulations. On the other hand, the active mismatch of items adjustable by CER fell slightly in the month – deposits in UVA grew 27.5% and credit in this denomination had a moderate performance – thus standing at around 48.7% of regulatory capital. In the last 6 months, this mismatch increased mainly due to the reexpression of capital in the context of the increase in inflation evidenced in the period. 11
Figure 4 | Foreign Currency (EM) Mismatch – ME Asset – ME Liability + Net Forward Purchases of EM without delivery of underlying* – As % of PRC
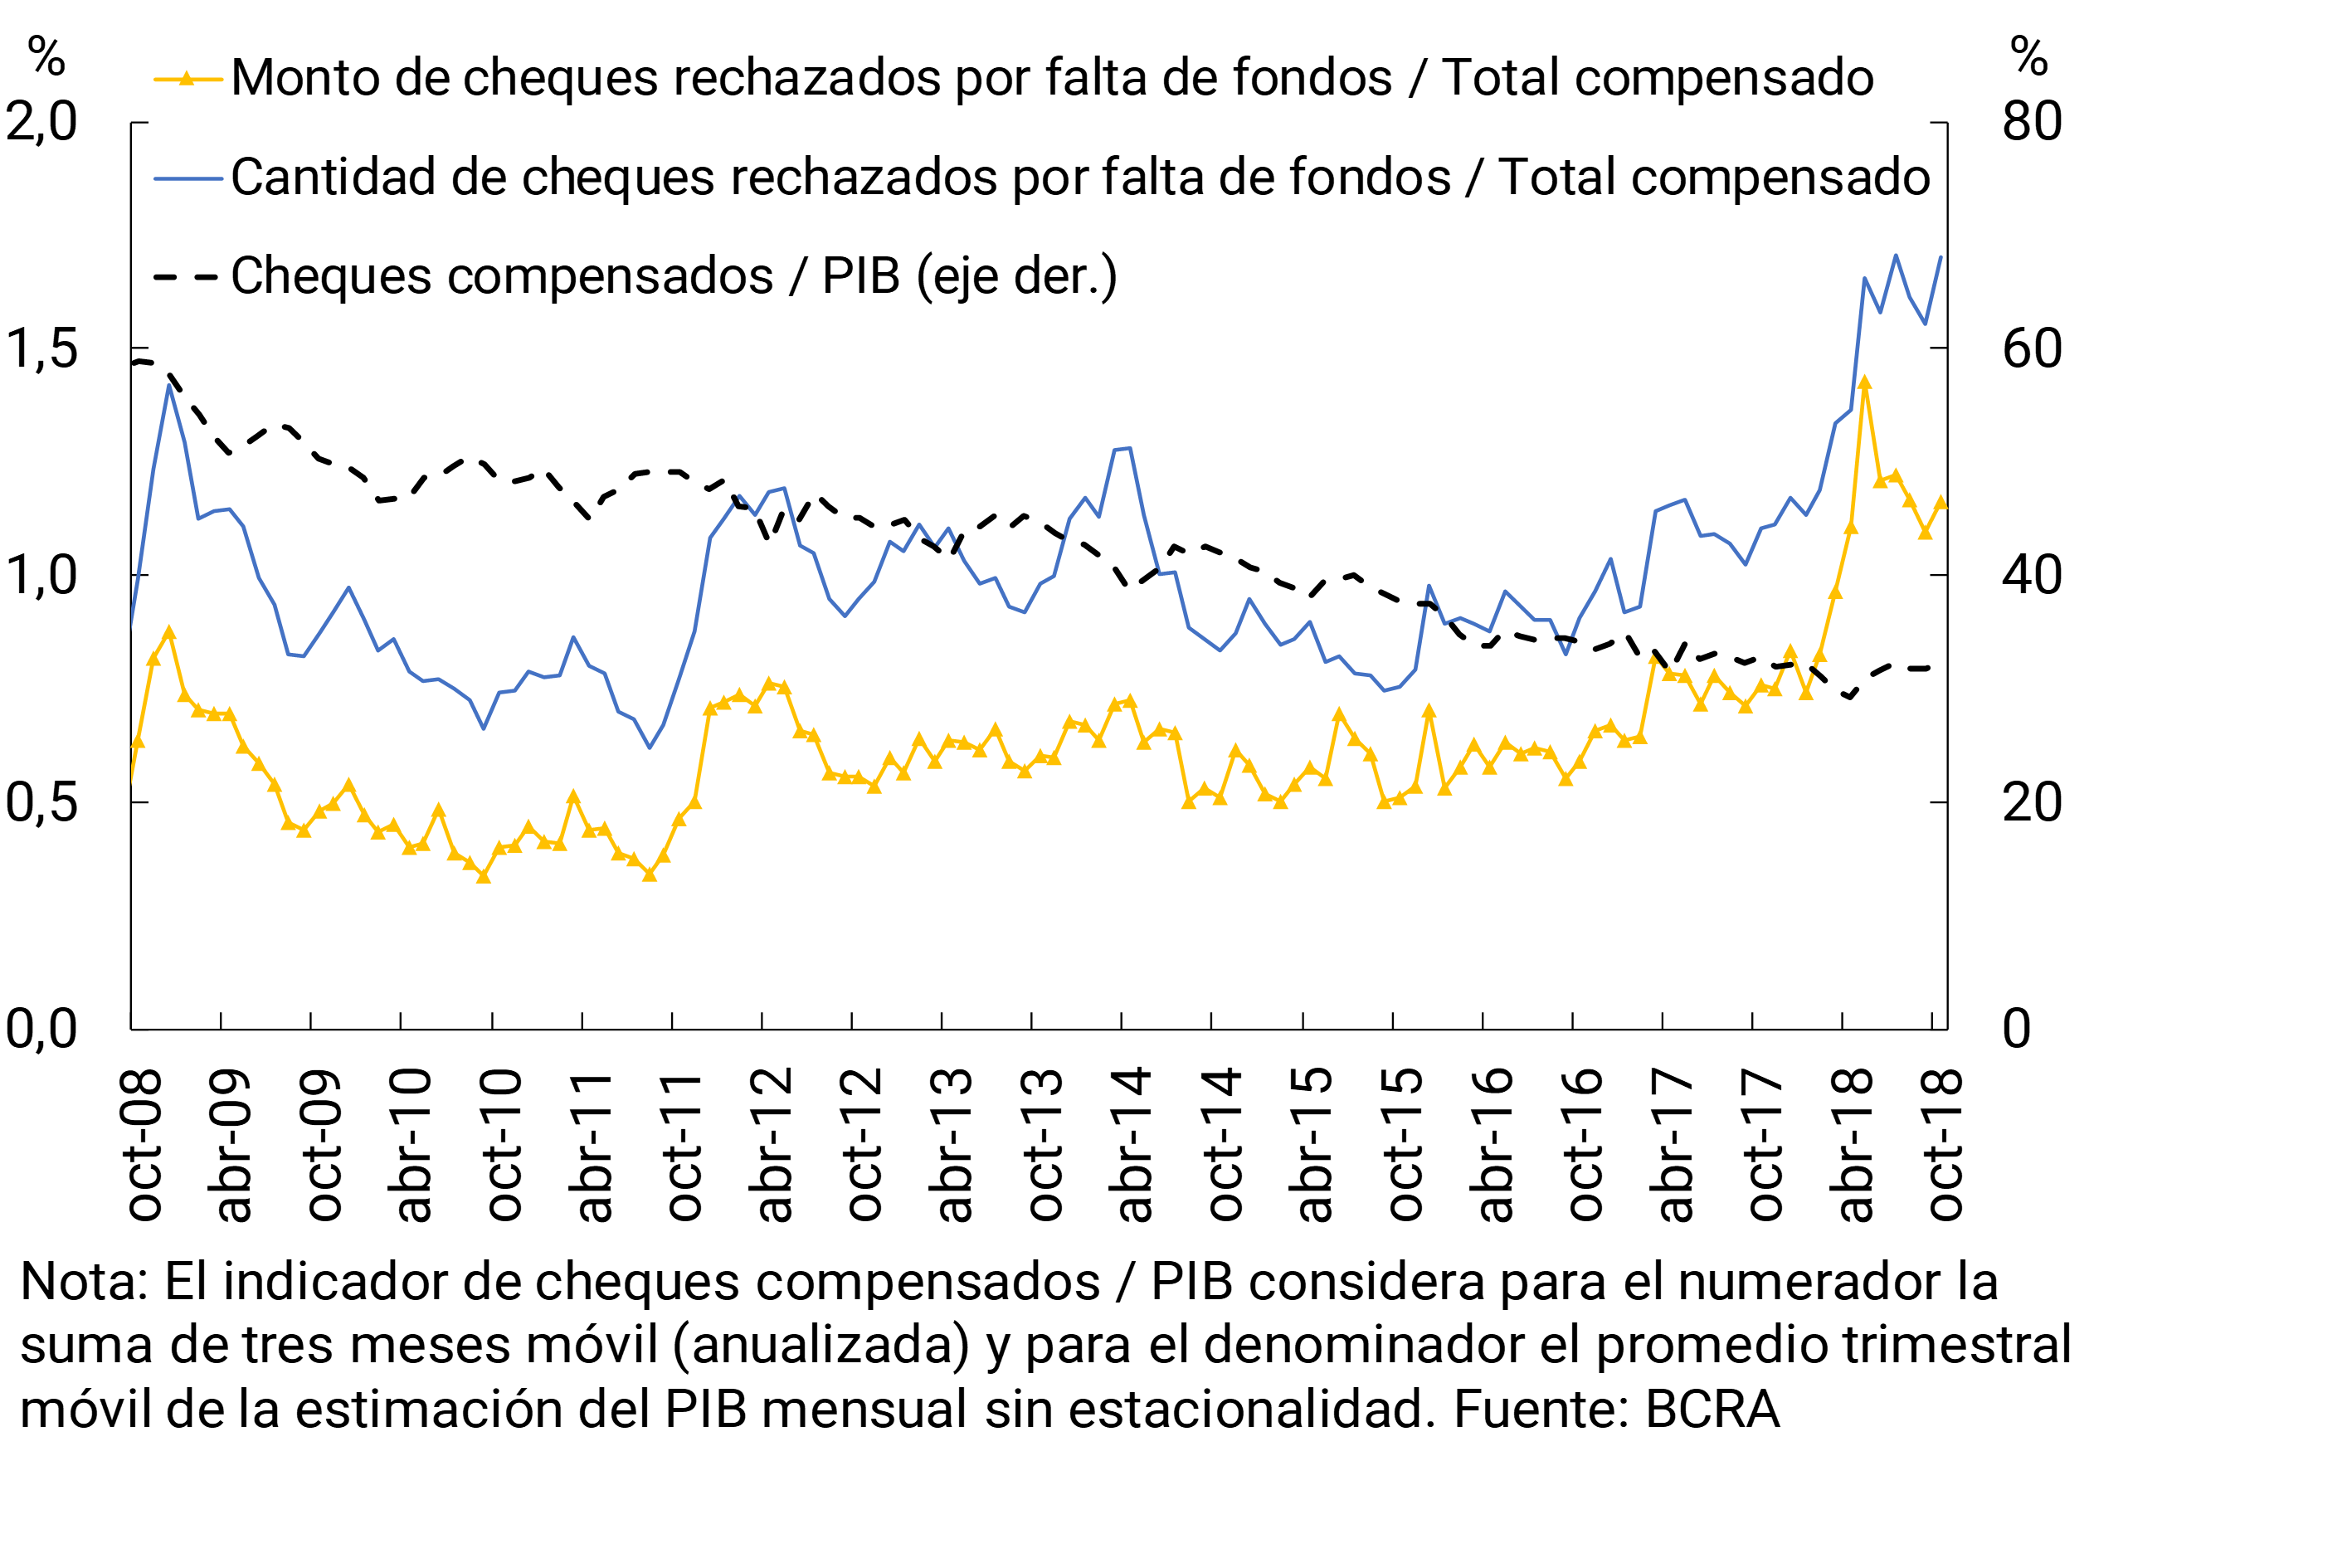
In relation to the operations carried out by the National Payment System, the clearing of checks continued to register a year-on-year decrease, while the trend towards greater use of electronic means of payment by the population is maintained (see Graph 5). 12 On the other hand, the rejection of checks due to lack of funds in terms of the total compensated increased slightly in the month, reaching 1.7% and 1.2% with respect to amounts and values, respectively.
Graph 5 | Cleared and Bounced Checks
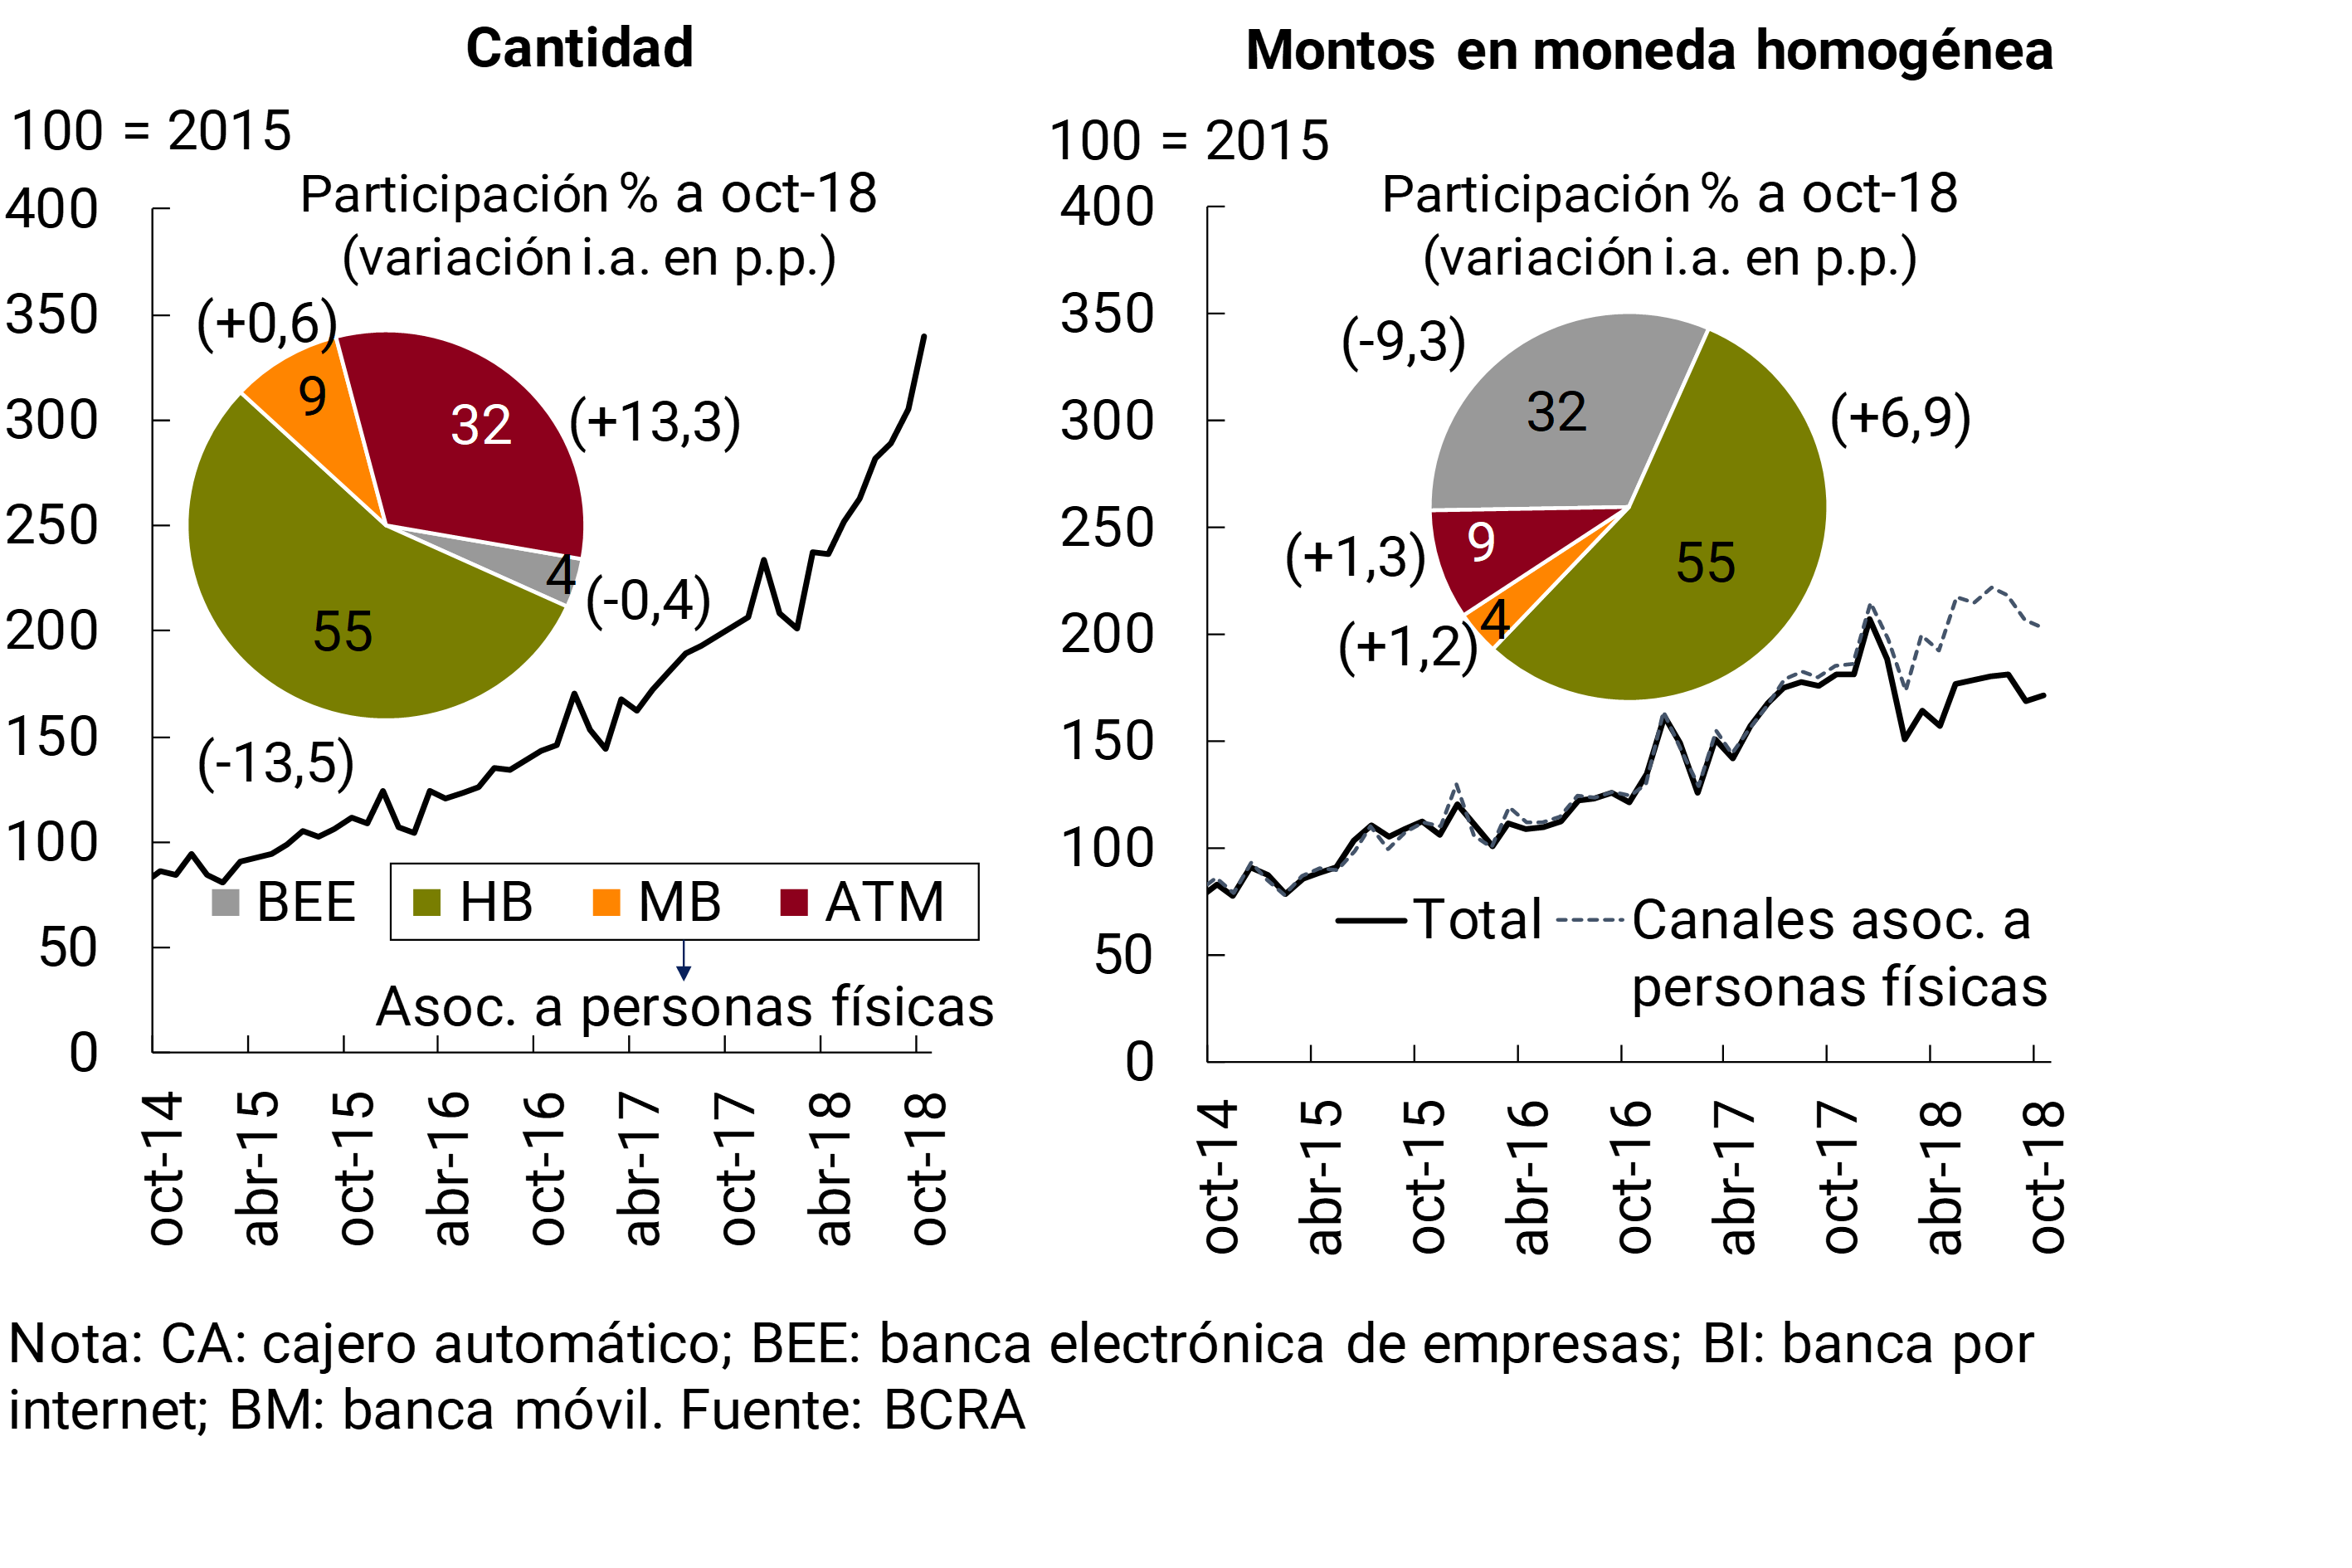
In October, immediate transfers registered an increase considering the number of operations and the amounts in homogeneous currency. In a year-on-year comparison, transfers with instant credit accumulated an increase of 68% for the amount and a slight reduction in real terms. As for the channels through which this type of transfer is made, those associated with individuals (ATMs, home banking and mobile banking) have been showing a better relative performance in recent months (see Graph 6).
Graph 6 | Immediate Channel Transfers of Funds
III. Deposits and liquidity
Taking into account the performance of the different sources and applications of resources in September, the relative importance of private sector deposits stood at 55.4% of the total funding – liabilities and net worth – of the financial system, slightly higher than in the previous month.
In the context of the inflation peak in September, the balance of total deposits in pesos fell by 4.3% in real terms (+2% nominal), a performance verified by public and private sector placements. The latter segment registered a monthly fall of 2.6% when adjusted for inflation (+3.8% nominal), with reductions in both term deposits and demand accounts. Meanwhile, total deposits in foreign currency decreased 4.1% in the month – in source currency – with decreases in public sector and private sector placements. Notwithstanding the performance of September, it should be noted that as of October, private sector deposits regained momentum.13
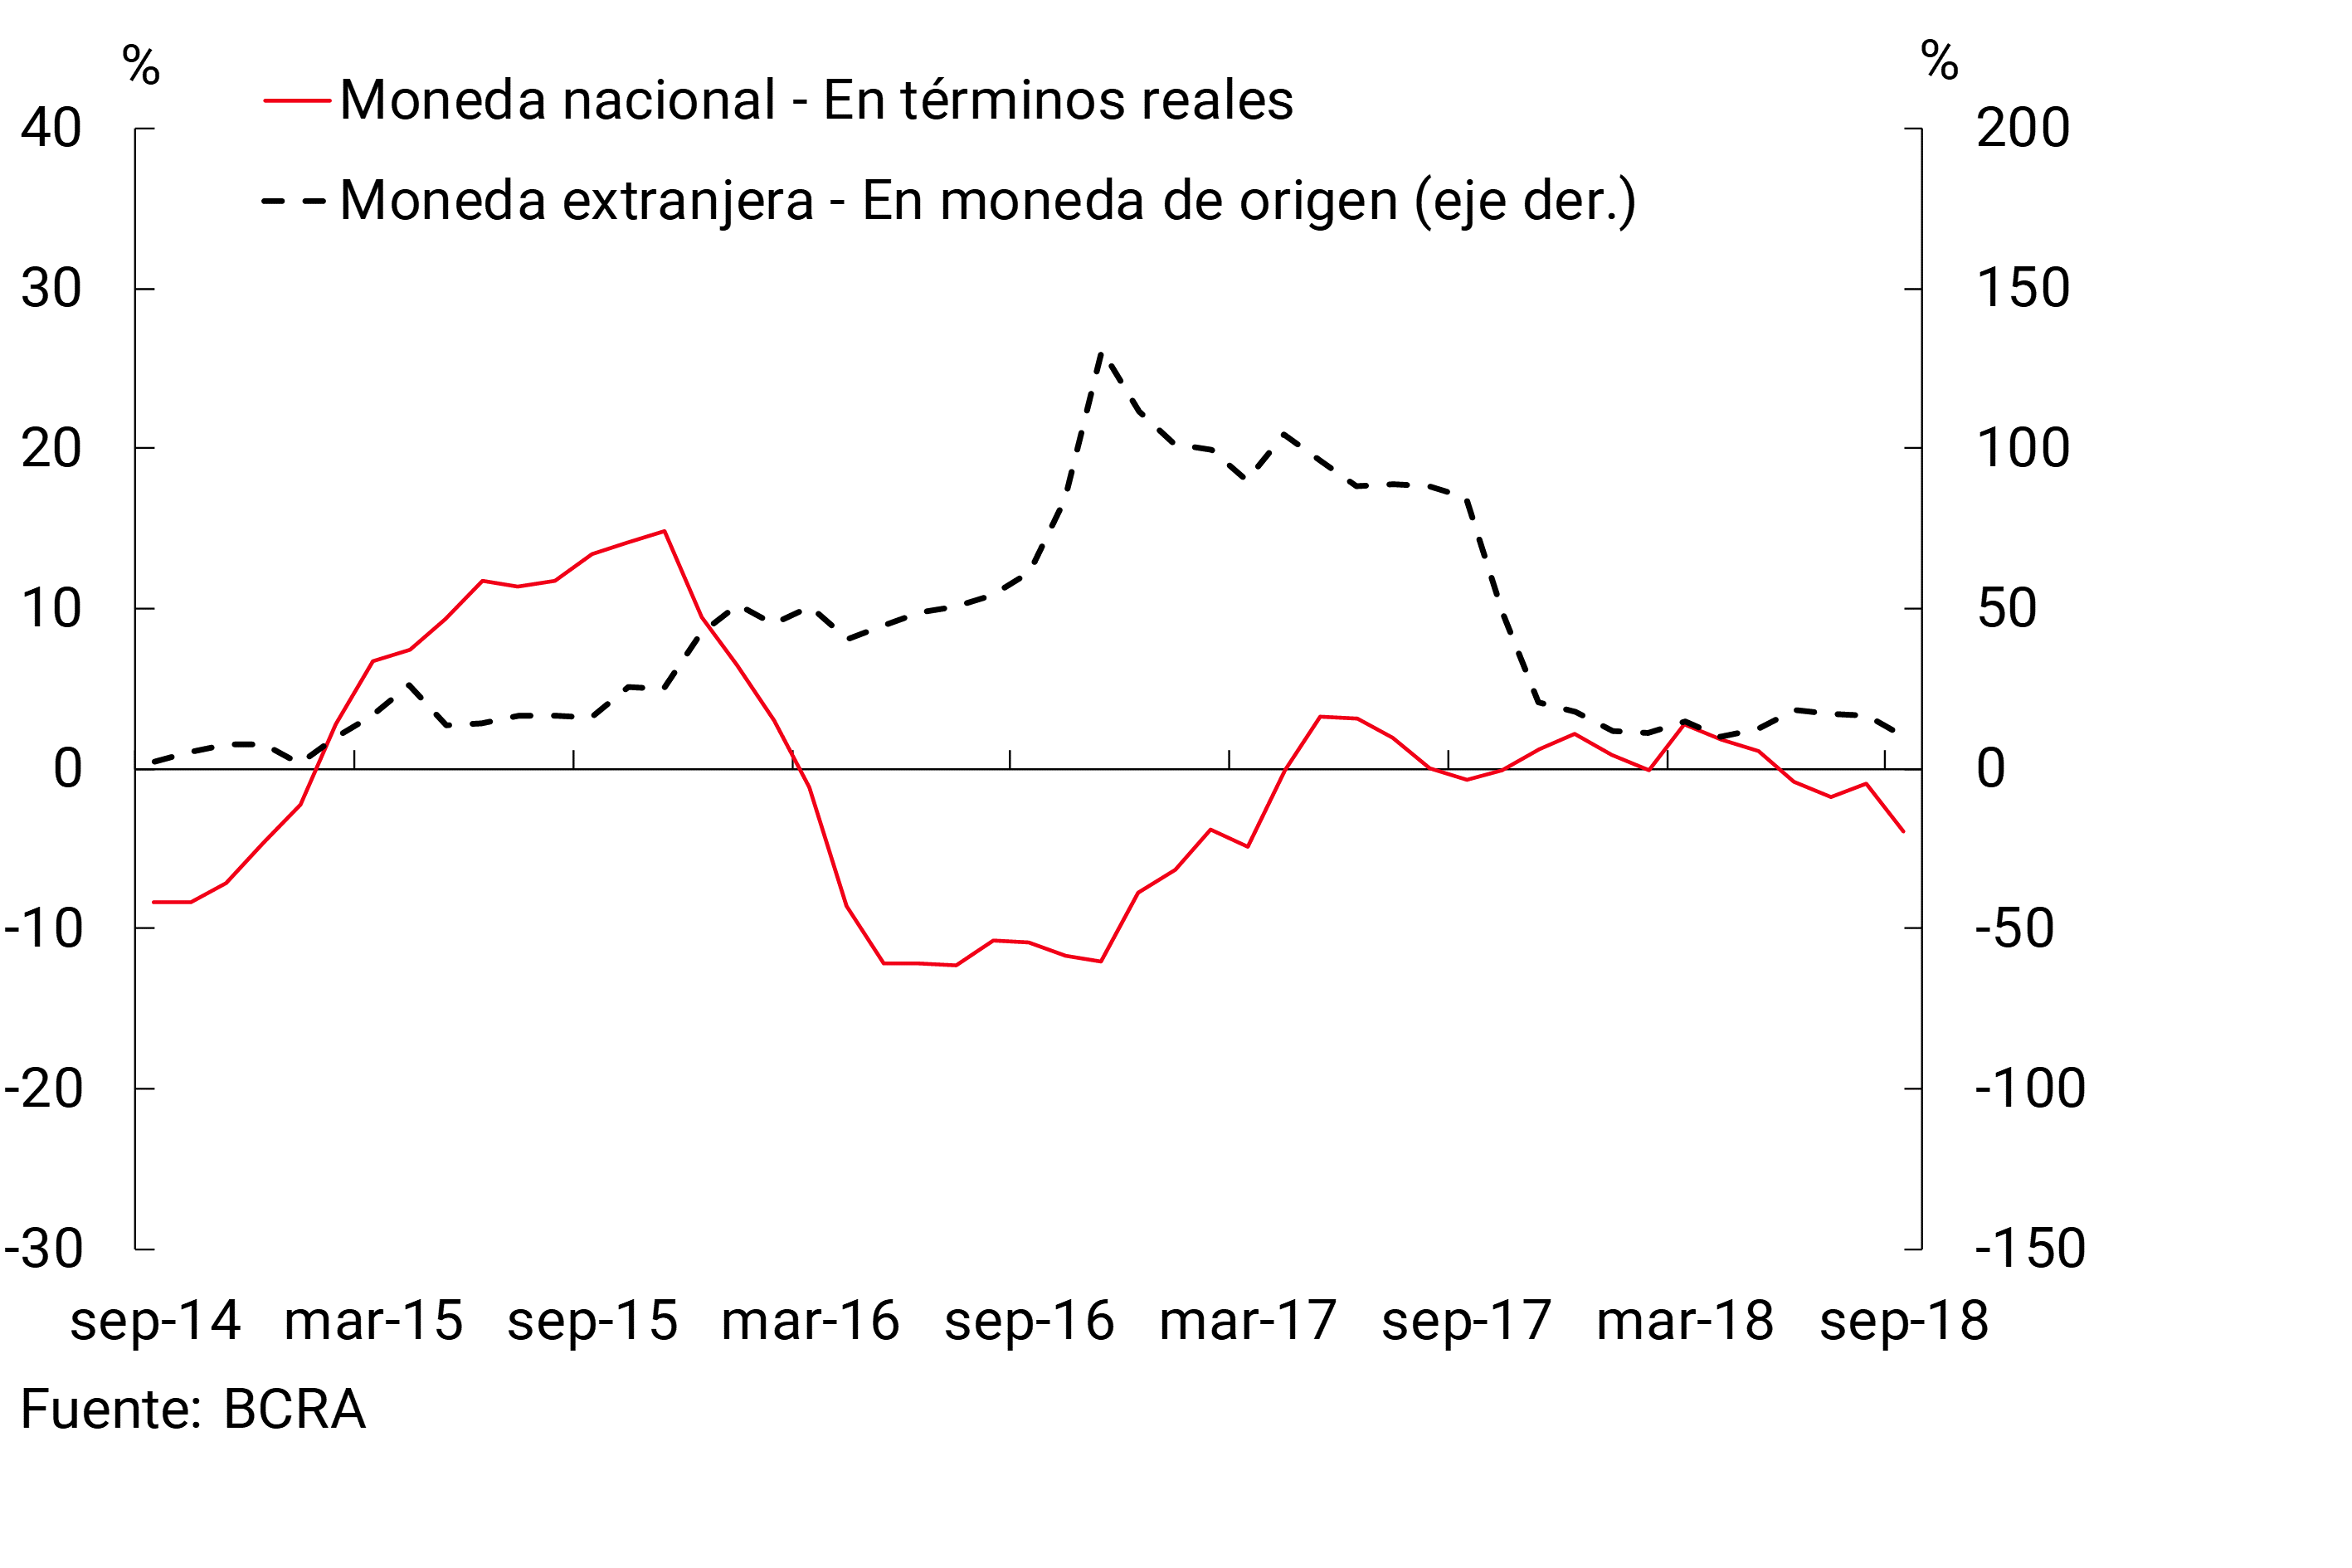
In the last 12 months to September, total deposits in pesos accumulated an increase of 9.9% in real terms, driven by public sector placements. The balance of private sector deposits in national currency fell 3.9% compared to the same month of the previous year when adjusted for inflation (see Chart 7). For their part, total foreign currency deposits increased slightly in a year-on-year comparison (+0.8% in source currency), with a greater relative increase in private sector accounts (+9.9% in source currency).
Figure 7 | Private Sector Deposits – Var. A.I. of the balance
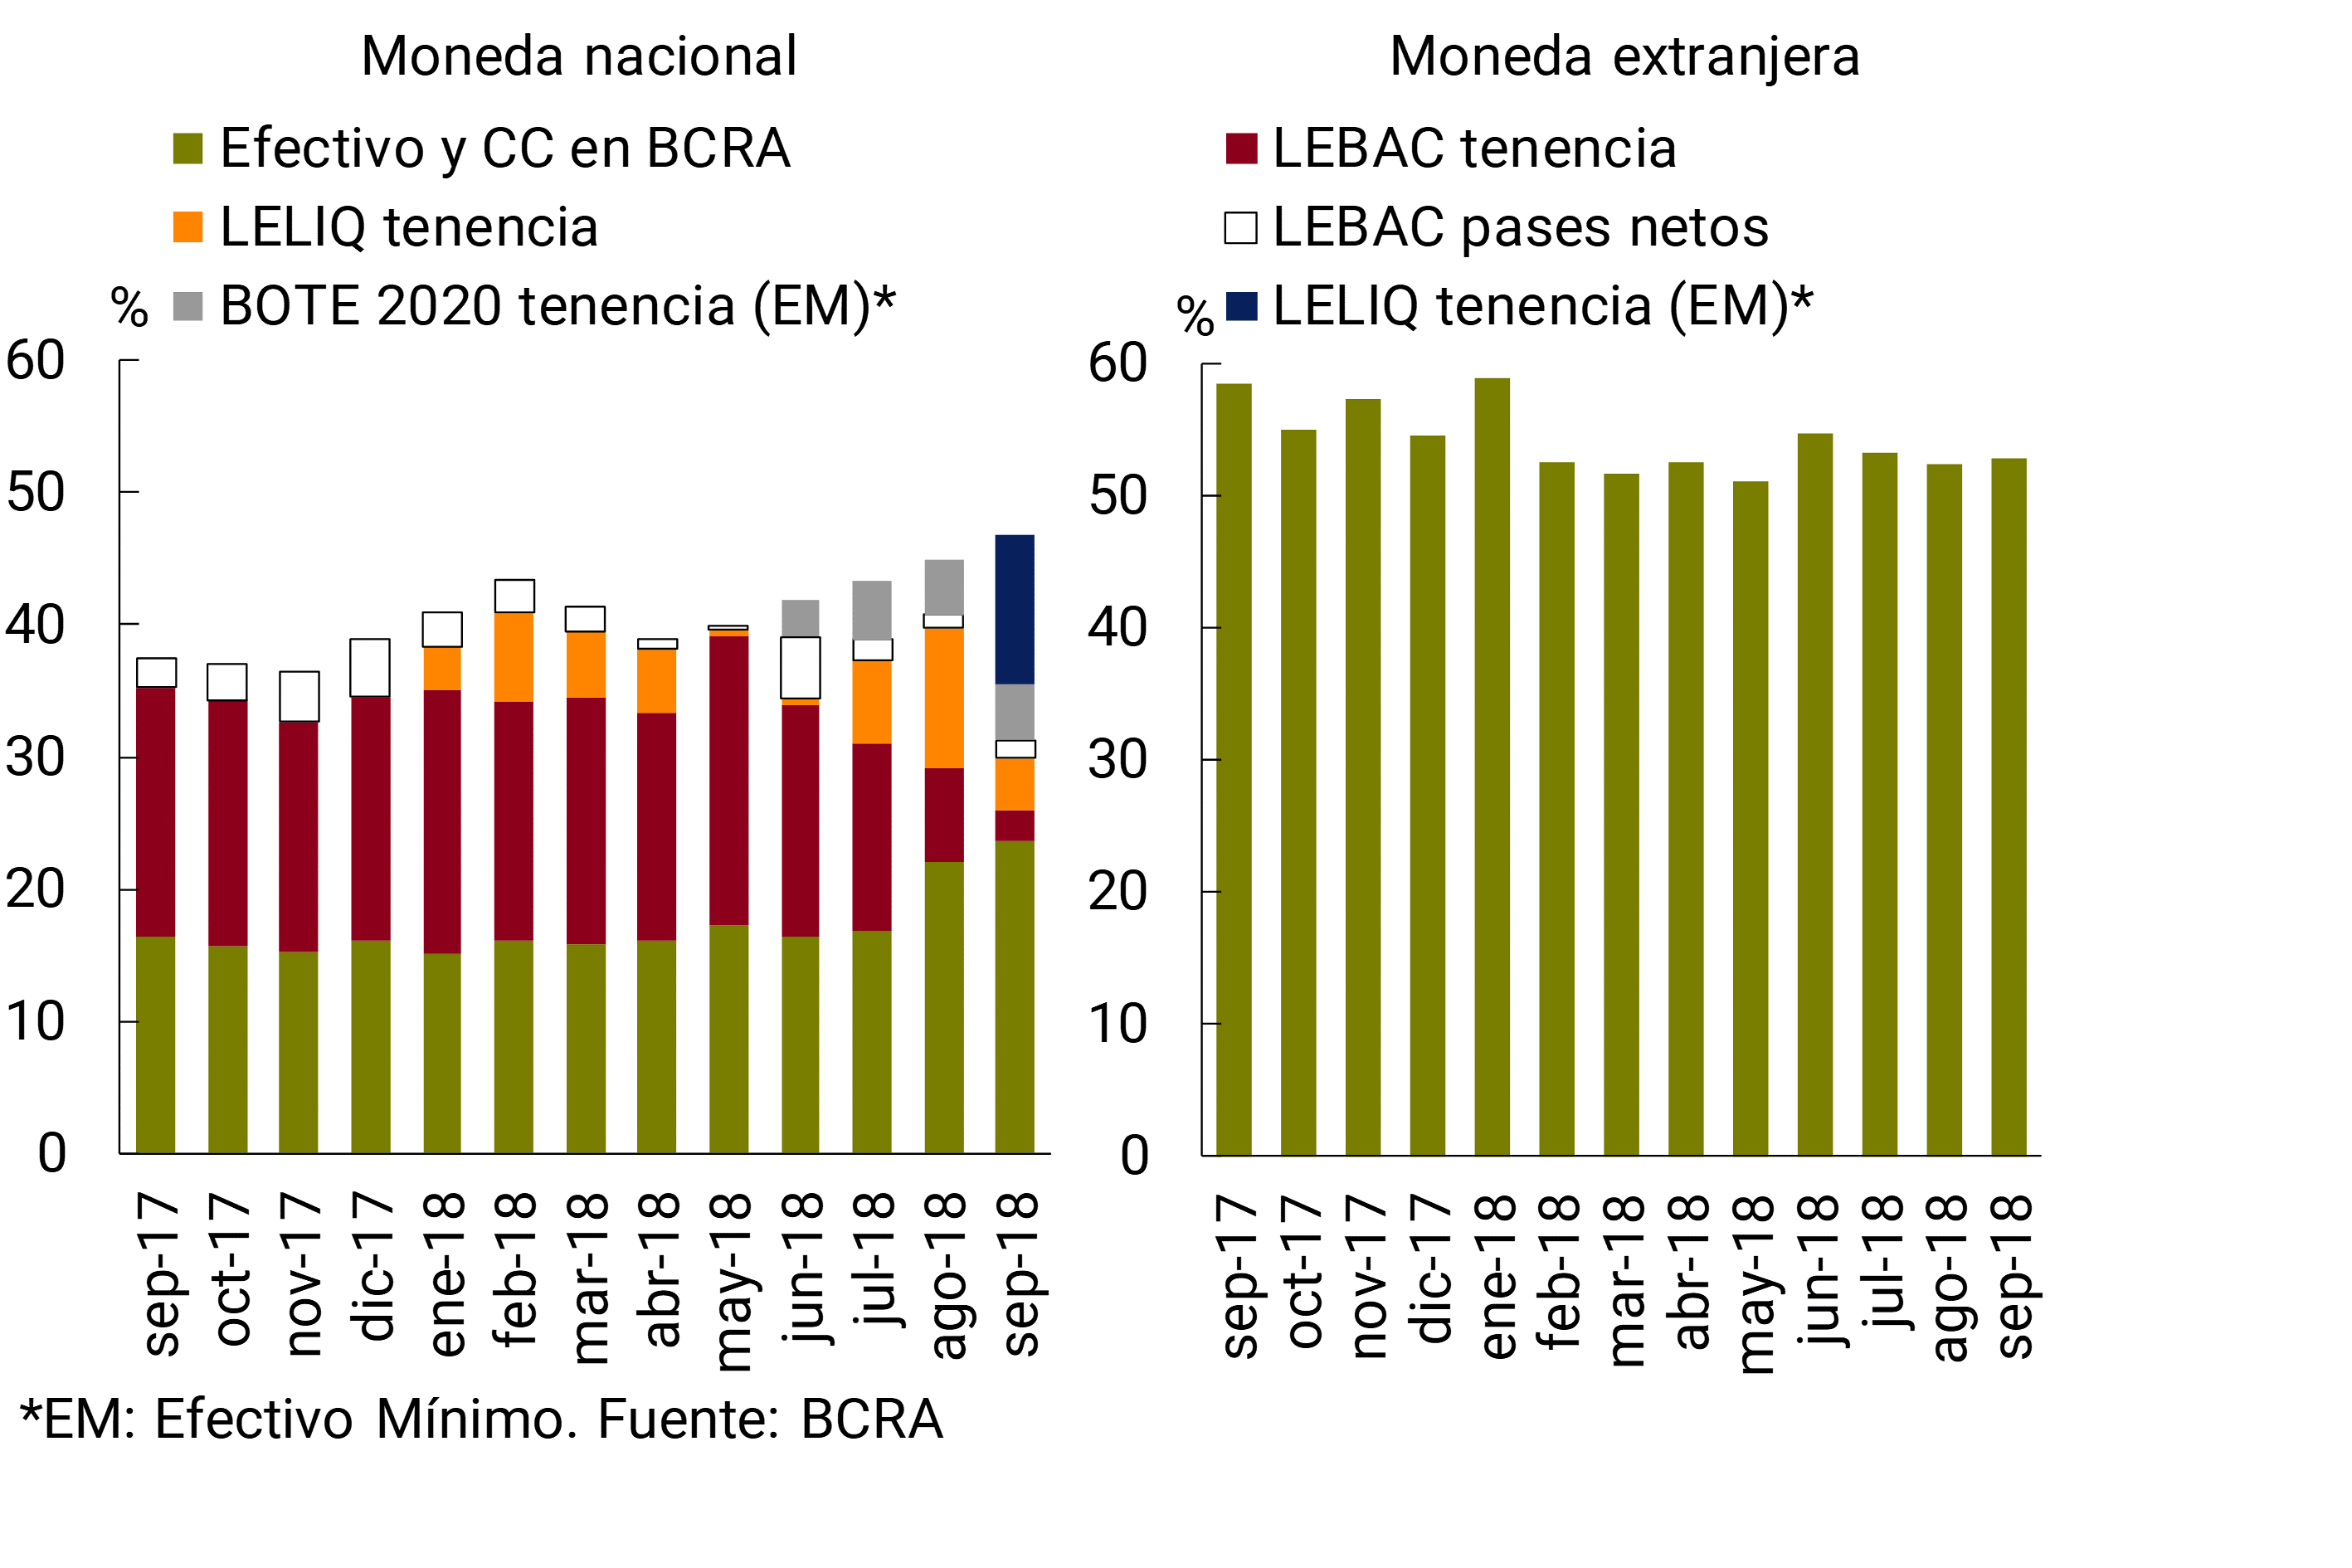
In a month in which two modifications in the reserve requirement regime came into force, the ample liquidity of the financial system – integration of minimum cash, BCRA instruments and availabilities, in national and foreign currency – increased again.14 The broad liquidity ratio represented 48.8% of total deposits in September (46.8% considering only items in national currency), increasing 1.5 p.p. (1.9 p.p.) compared to the previous month. In view of the regulatory changes observed in recent months in recent months, coupled with the process of dismantling the outstanding balance of LEBACs, financial institutions increased their liquidity held in current accounts at the BCRA and LELIQ and reduced their holdings of LEBACs (see Chart 8). In a year-on-year comparison, ample liquidity increased by 6.2 p.p. of deposits.
Figure 8 | Composition of Bank Liquidity by Currency – As % of Deposits
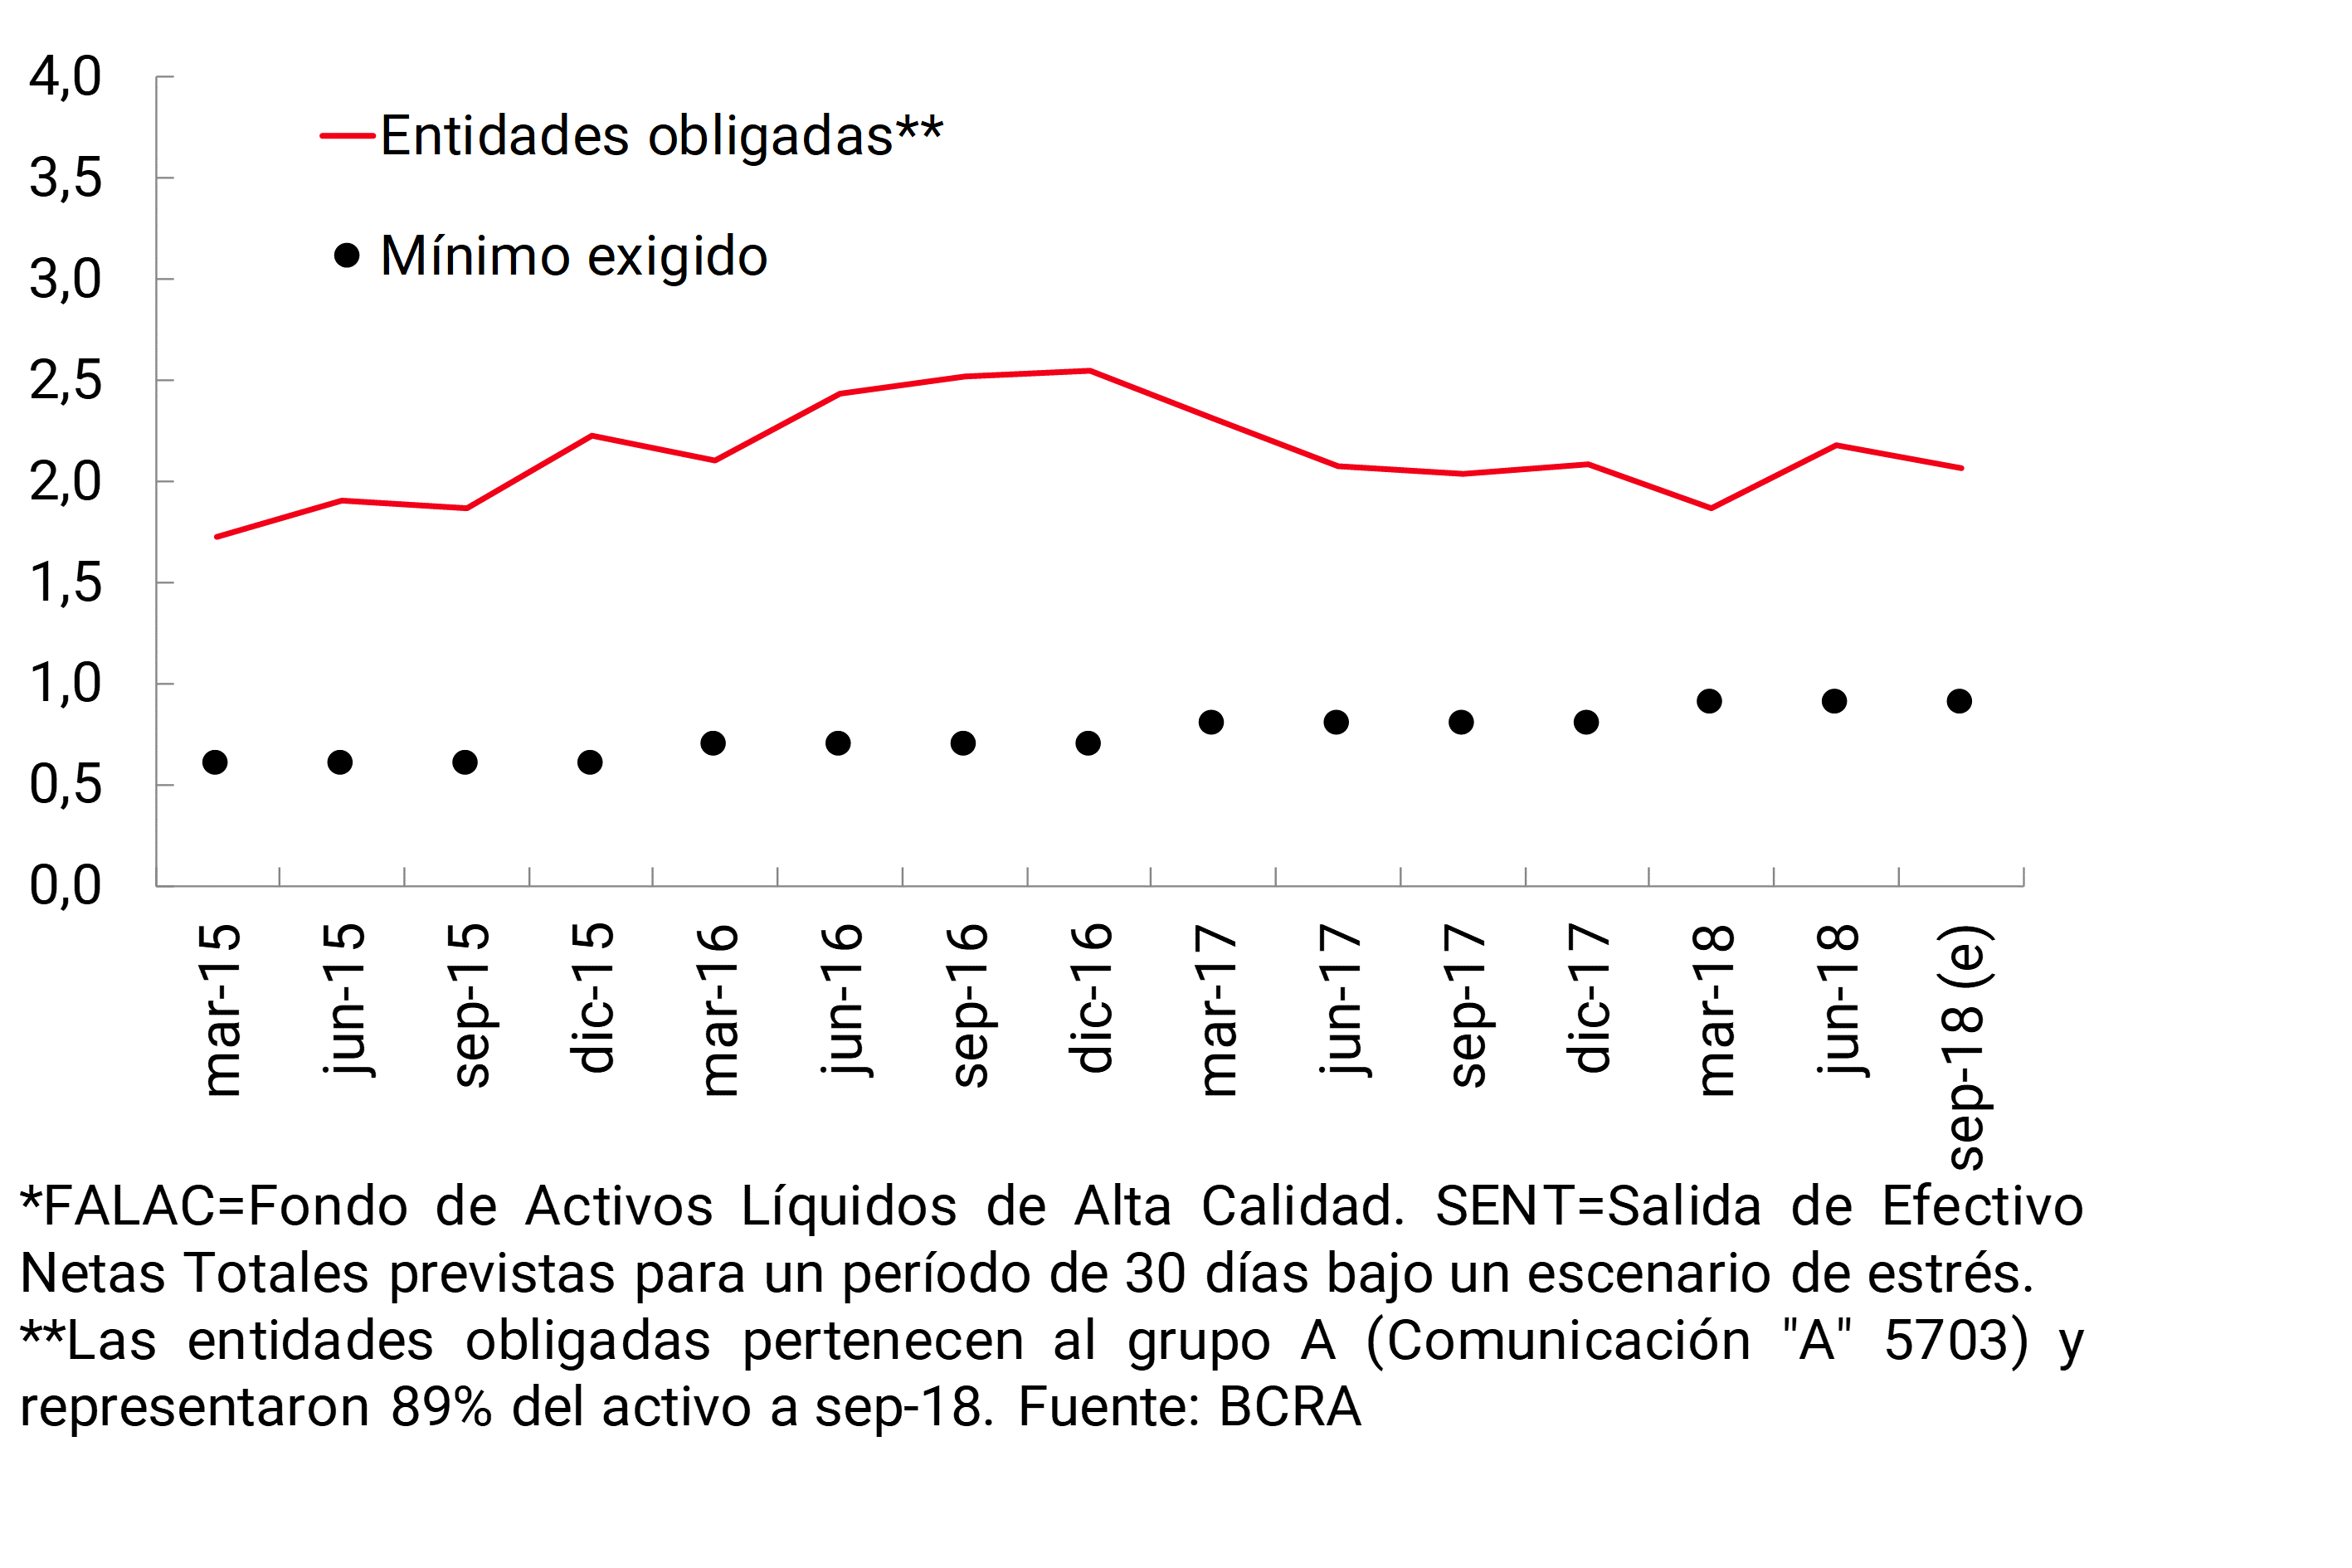
The Liquidity Coverage Ratio (LCR) of the local financial system remained at high levels.15 It is estimated that at the end of the third quarter of 2018 the LCR, which measures the availability of quality funds in a hypothetical stress scenario, continued to far exceed the local minimum required (see Chart 9). 16 In addition, the Stable Net Funding Ratio (NFSR), which measures the availability of sufficiently stable banks’ resources with which to fund longer-term assets, stood at around 1.5 in the middle of the year, thus exceeding the local minimum required (in line with internationally recommended standards) by almost 50%.
Figure 9 | Liquidity Coverage Ratio (LCR) – FALAC / SENT*
In line with the rise in the benchmark interest rate towards the end of August, the rates that banks operated with the private sector for fixed-term deposits in pesos increased in September, to an average of 38.8% nominal per annum. In this context, and in the context of the increase in reserve requirements, the estimated funding cost for private sector deposits in national currency increased in the month. It should be considered that the fixed-term interest rate reinforced its increase in October within the framework of the rise in the reference rate and the regulatory change by which the reserve requirements of new time deposits are remunerated. 17
IV. Exposures and Credit Quality
In a context of falling economic activity, rising inflation, and higher lending rates, the financial system’s exposure to credit to the private sector fell in September. The balance of financing to the private sector represented 45.2% of assets in the month, a level similar to the average of the last 10 years, and lower than the median value for the countries of the region as a whole.
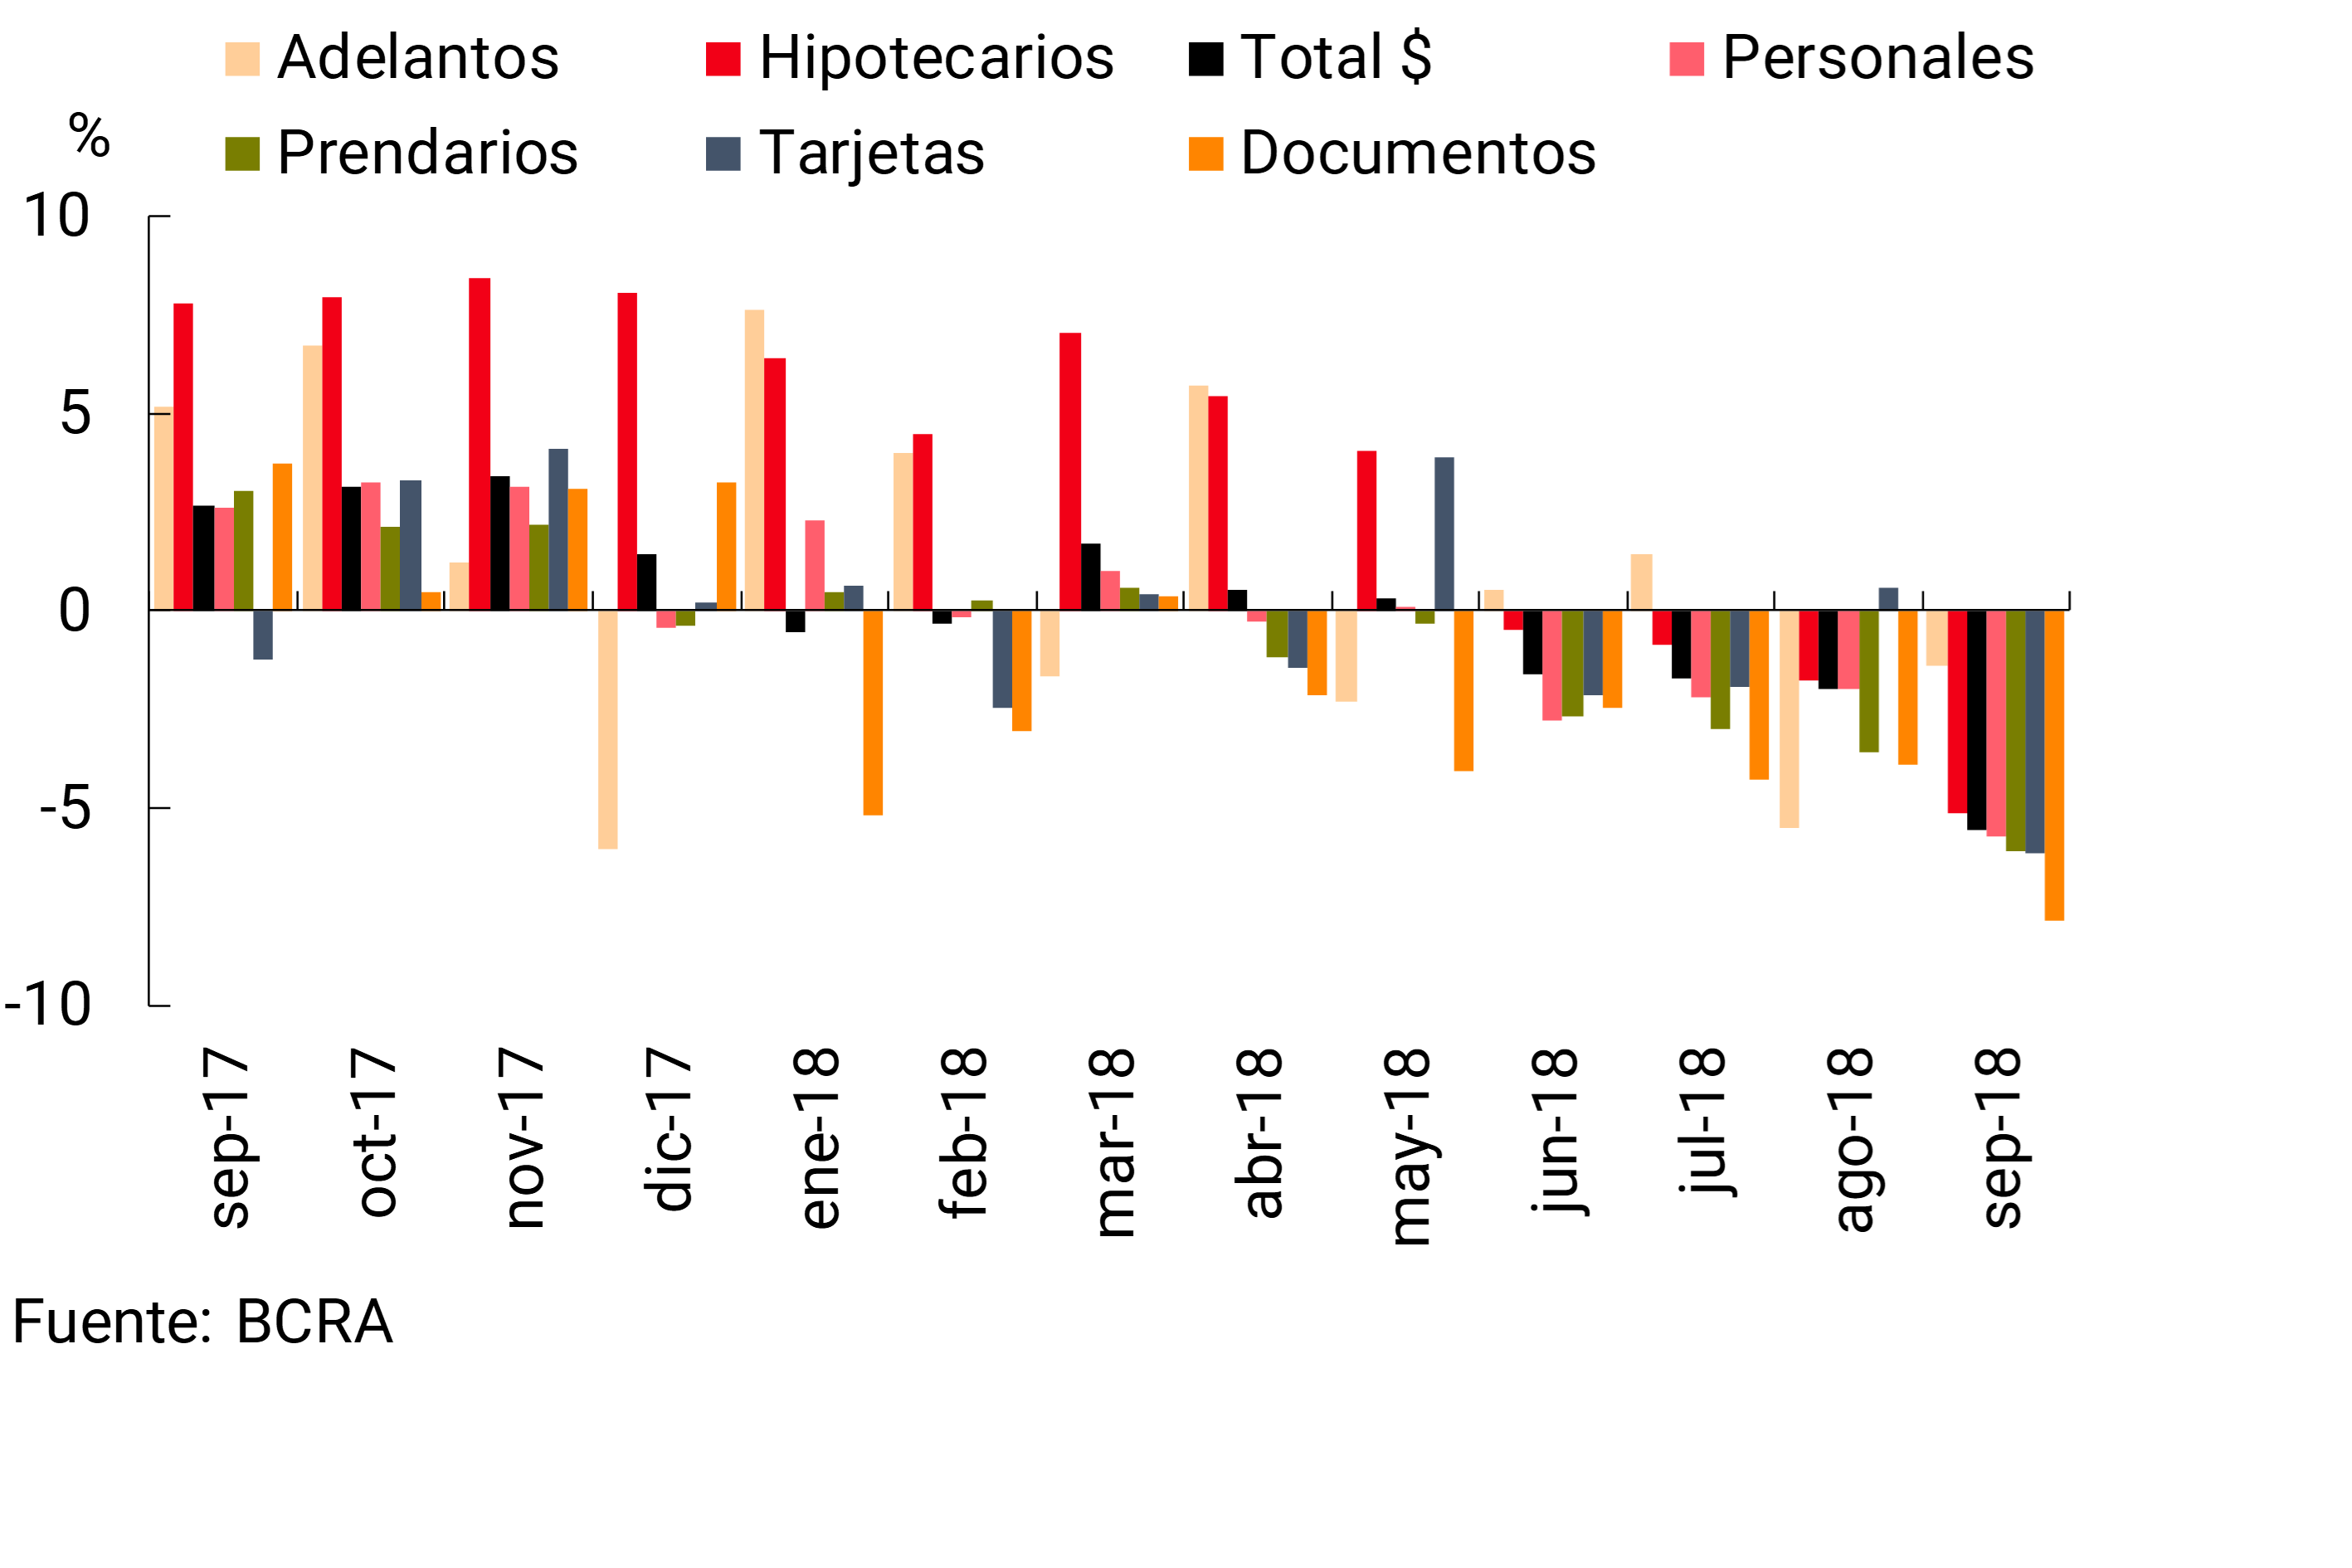
Bank financing in pesos to the private sector continued to decline in real terms in September, in line with what has been evidenced since June. The balance of credit in pesos to the private sector fell 5.6% in September when adjusted for inflation (+0.6% nominal), with a generalized monthly decrease in all credit lines (see Chart 10). For its part, the balance of financing in foreign currency verified a decrease of 3.4% in the period, a performance explained by export pre-financing and cards. 18 Thus, the total balance (in domestic and foreign currency) of loans to the private sector expressed in pesos decreased by 4.1% when adjusted for inflation in the month (+2.2% nominal). The monthly reduction in bank loans was widespread among groups of financial institutions, with foreign private banks showing the largest relative declines.
Figure 10 | Credit Balance in Pesos to the Private Sector – Monthly % Changes – In Real Terms
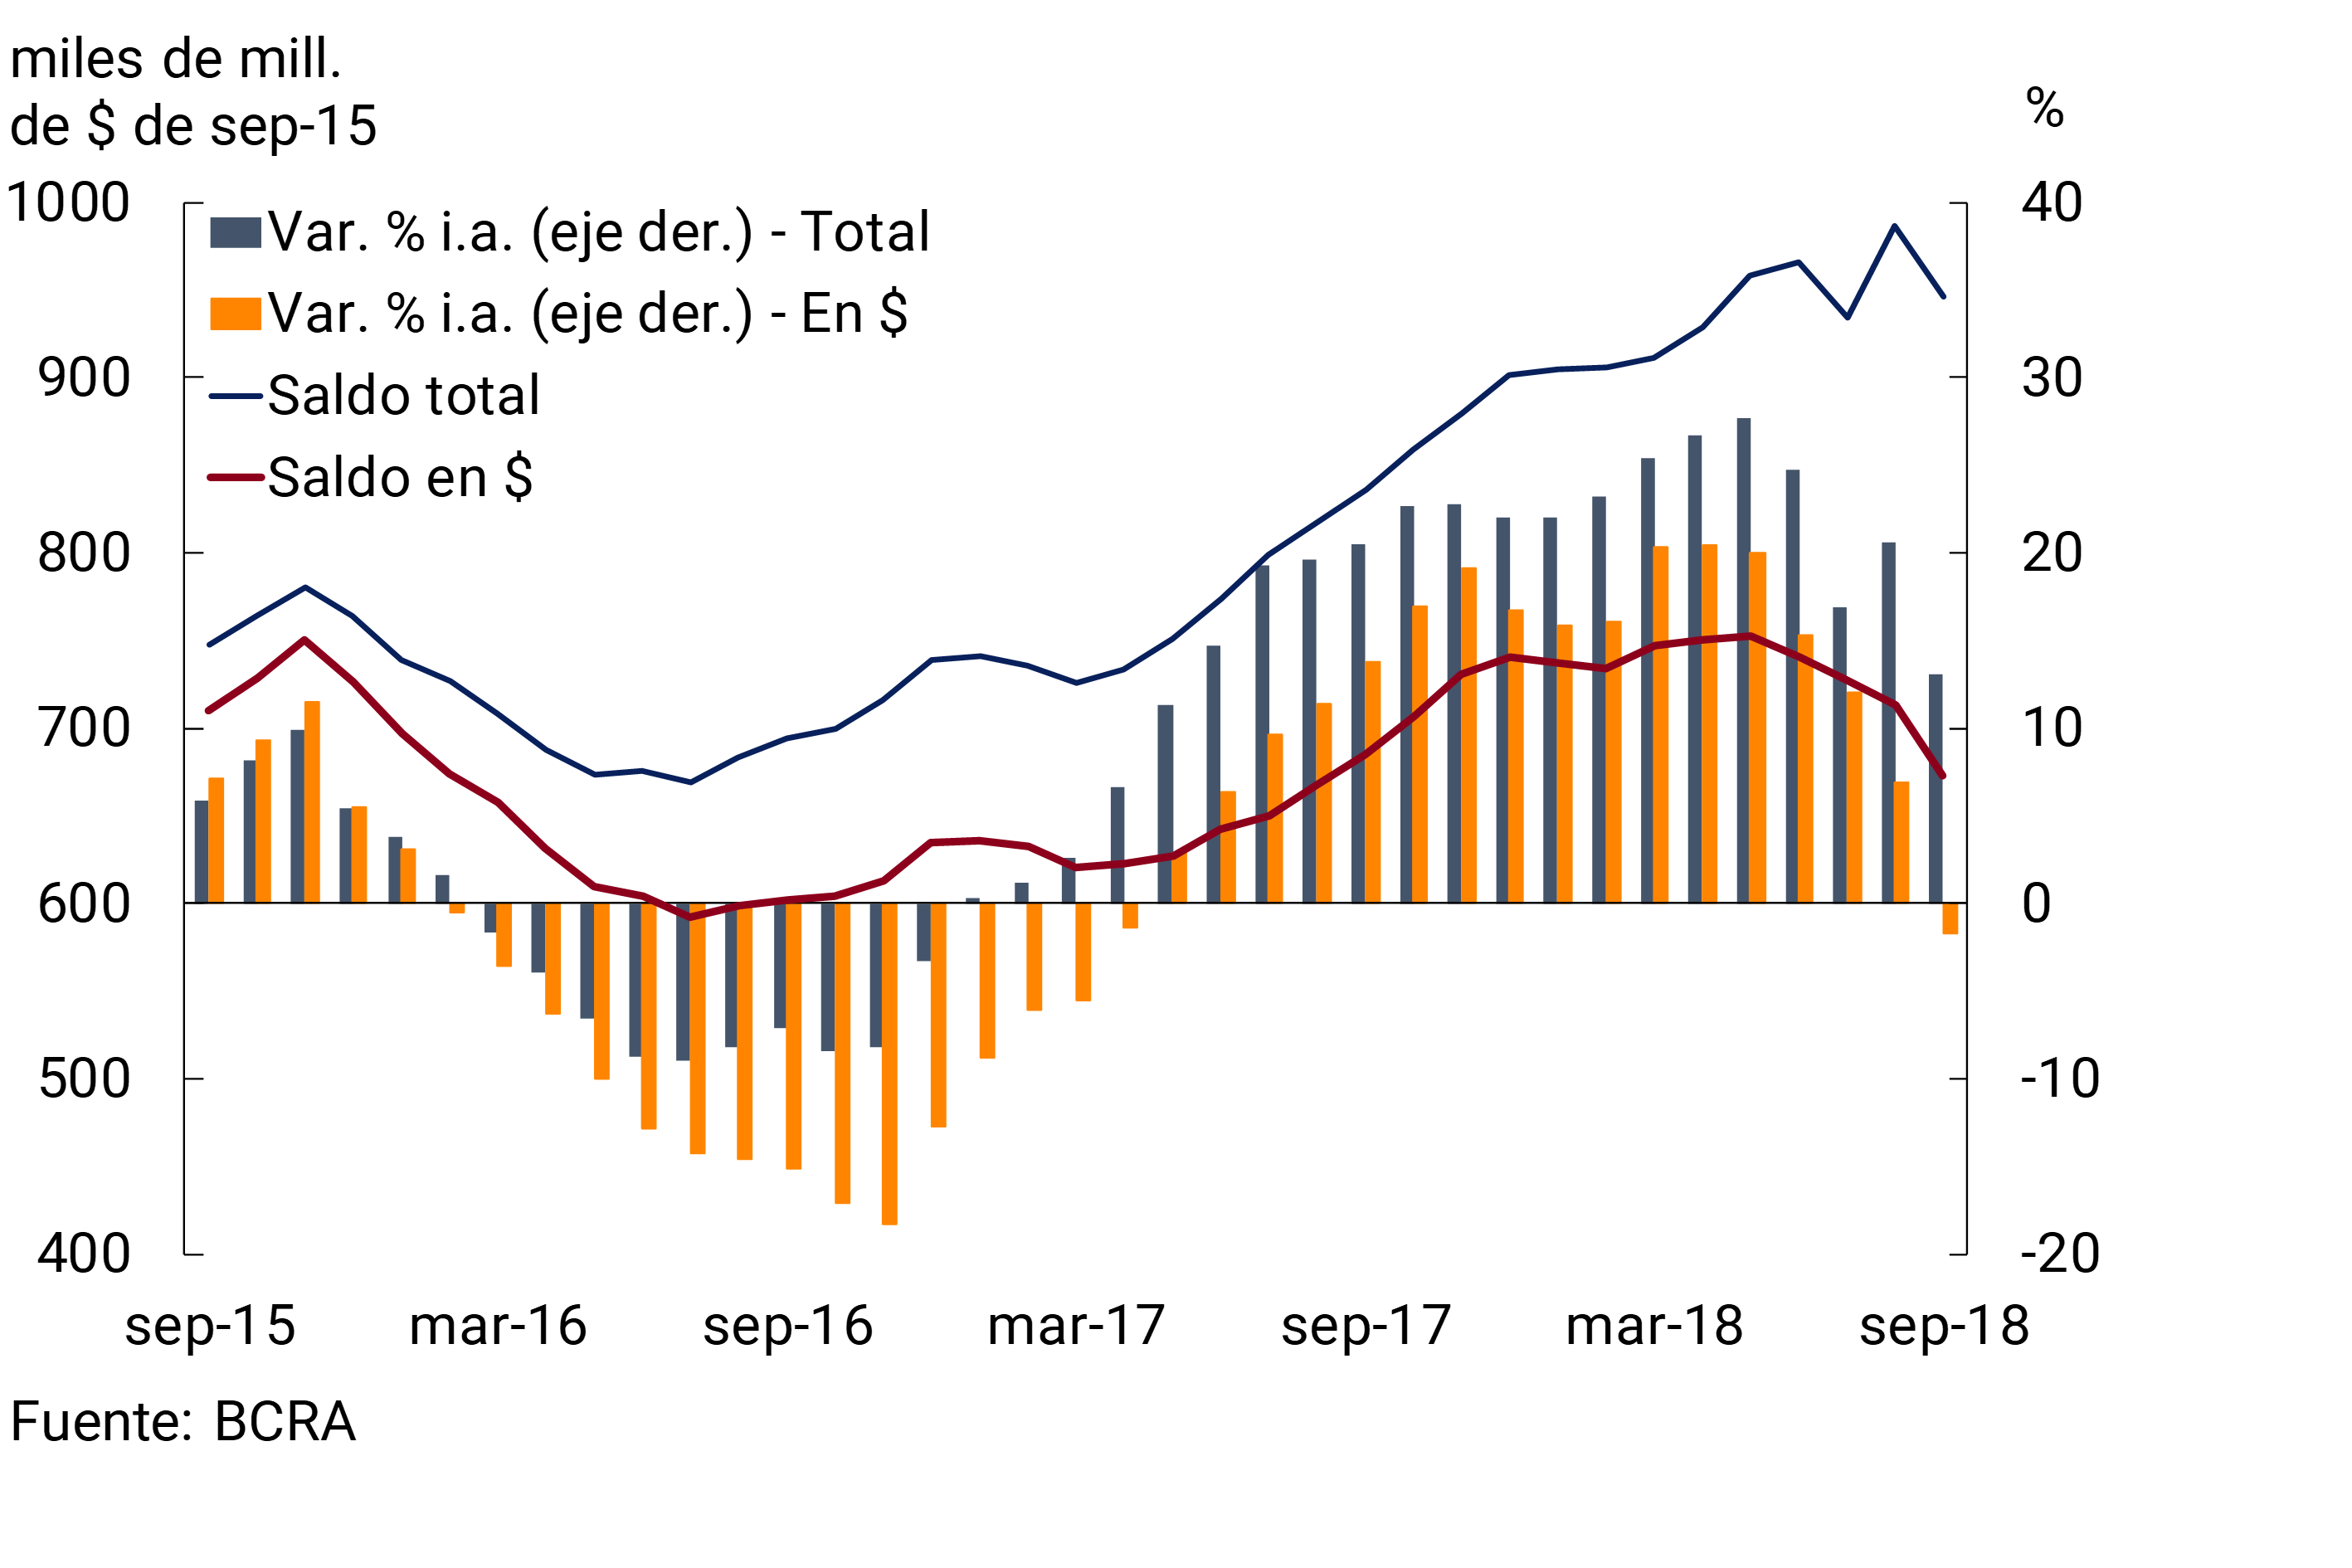
In a year-on-year comparison, in September the balance of bank credit to the private sector showed a slight fall when adjusted for inflation (-1.7% y.o.y.) (see Graph 11). Meanwhile, financing in foreign currency accumulated an increase of 7.4% YoY, also below the variations observed in previous months. 19
Figure 11 | Total Credit Balance to the Private Sector
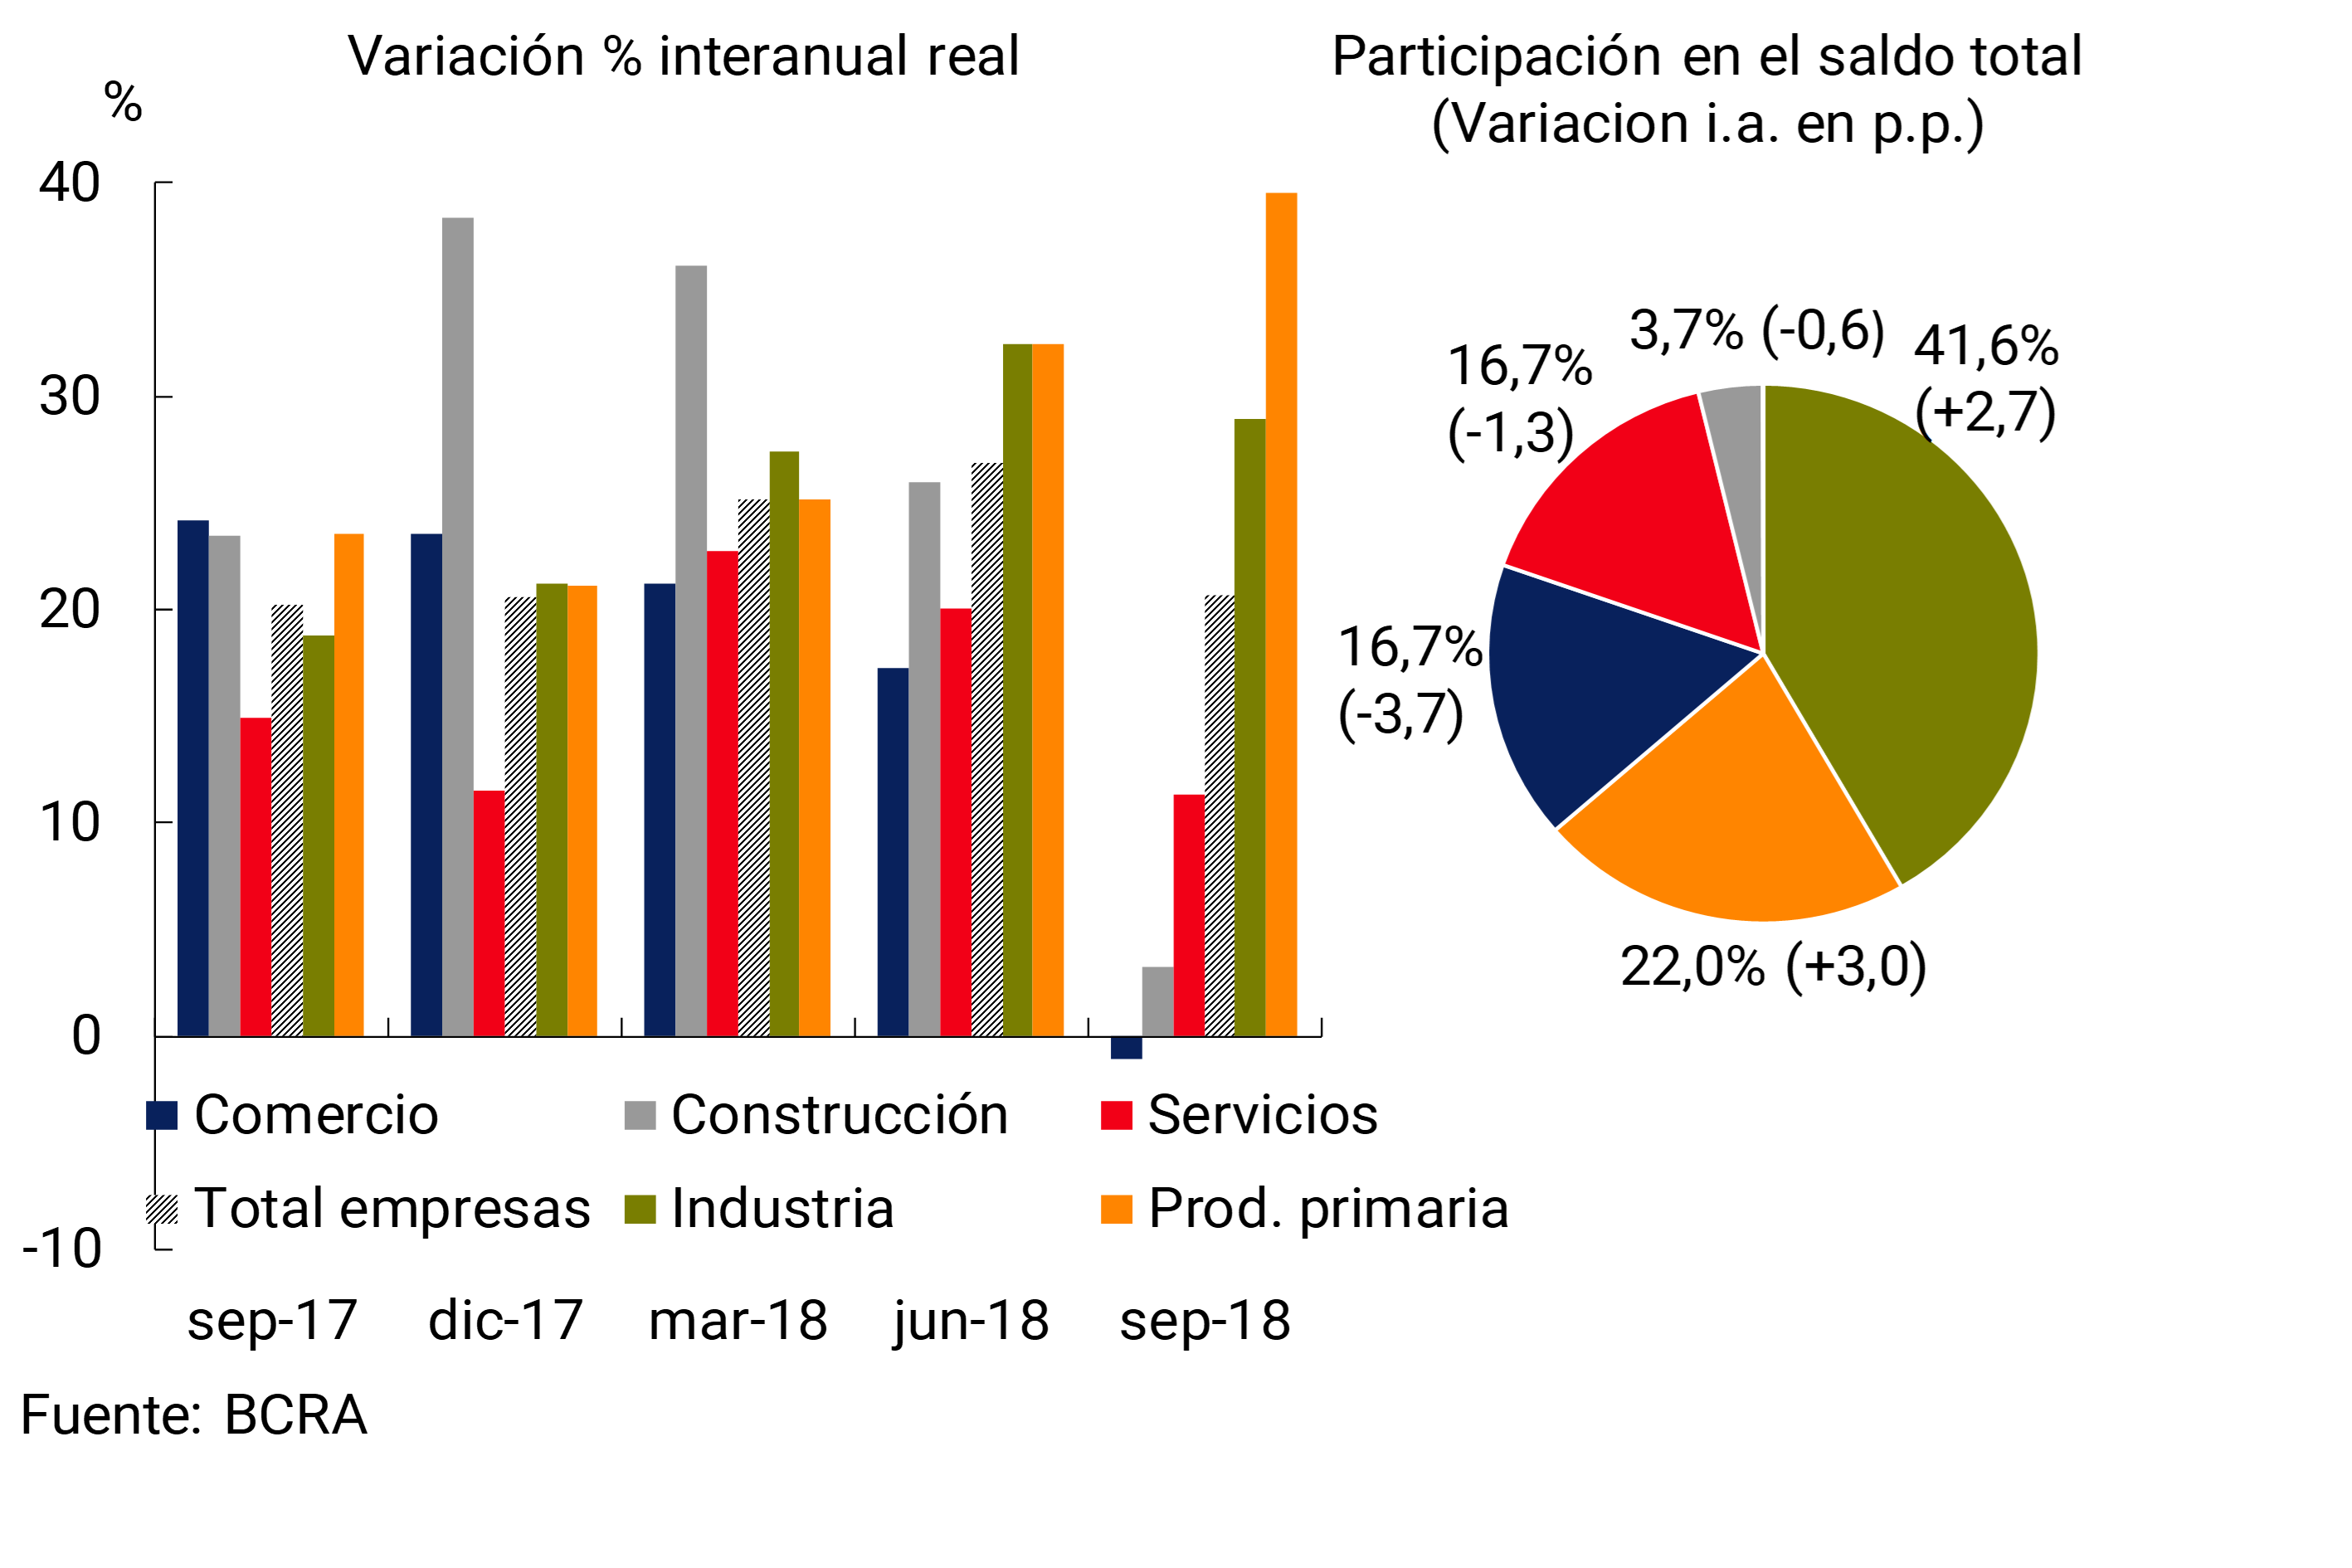
Total credit (in domestic and foreign currency) to companies decreased 2.5% when adjusted for inflation (+3.9% in nominal terms) compared to August. 20 Most of the credits channeled to the different productive sectors fell in real terms in the month, with the exception of loans to primary production, which increased slightly. In a year-on-year comparison, bank financing to companies increased 20.7% in real terms (see Graph 12), with a greater relative dynamism of loans to primary production and industry. 21
Figure 12 | Total Credit Balance to Companies
Financing to households decreased by 5.8% when adjusted for inflation in the month (+0.3% nominal), with a generalized fall in all credit lines. In year-on-year terms, the balance of credit to households accumulated growth of 8.4% in real terms in September, below the variations recorded in previous months (see Chart 13).
Figure 13 | Total Credit Balance to Families
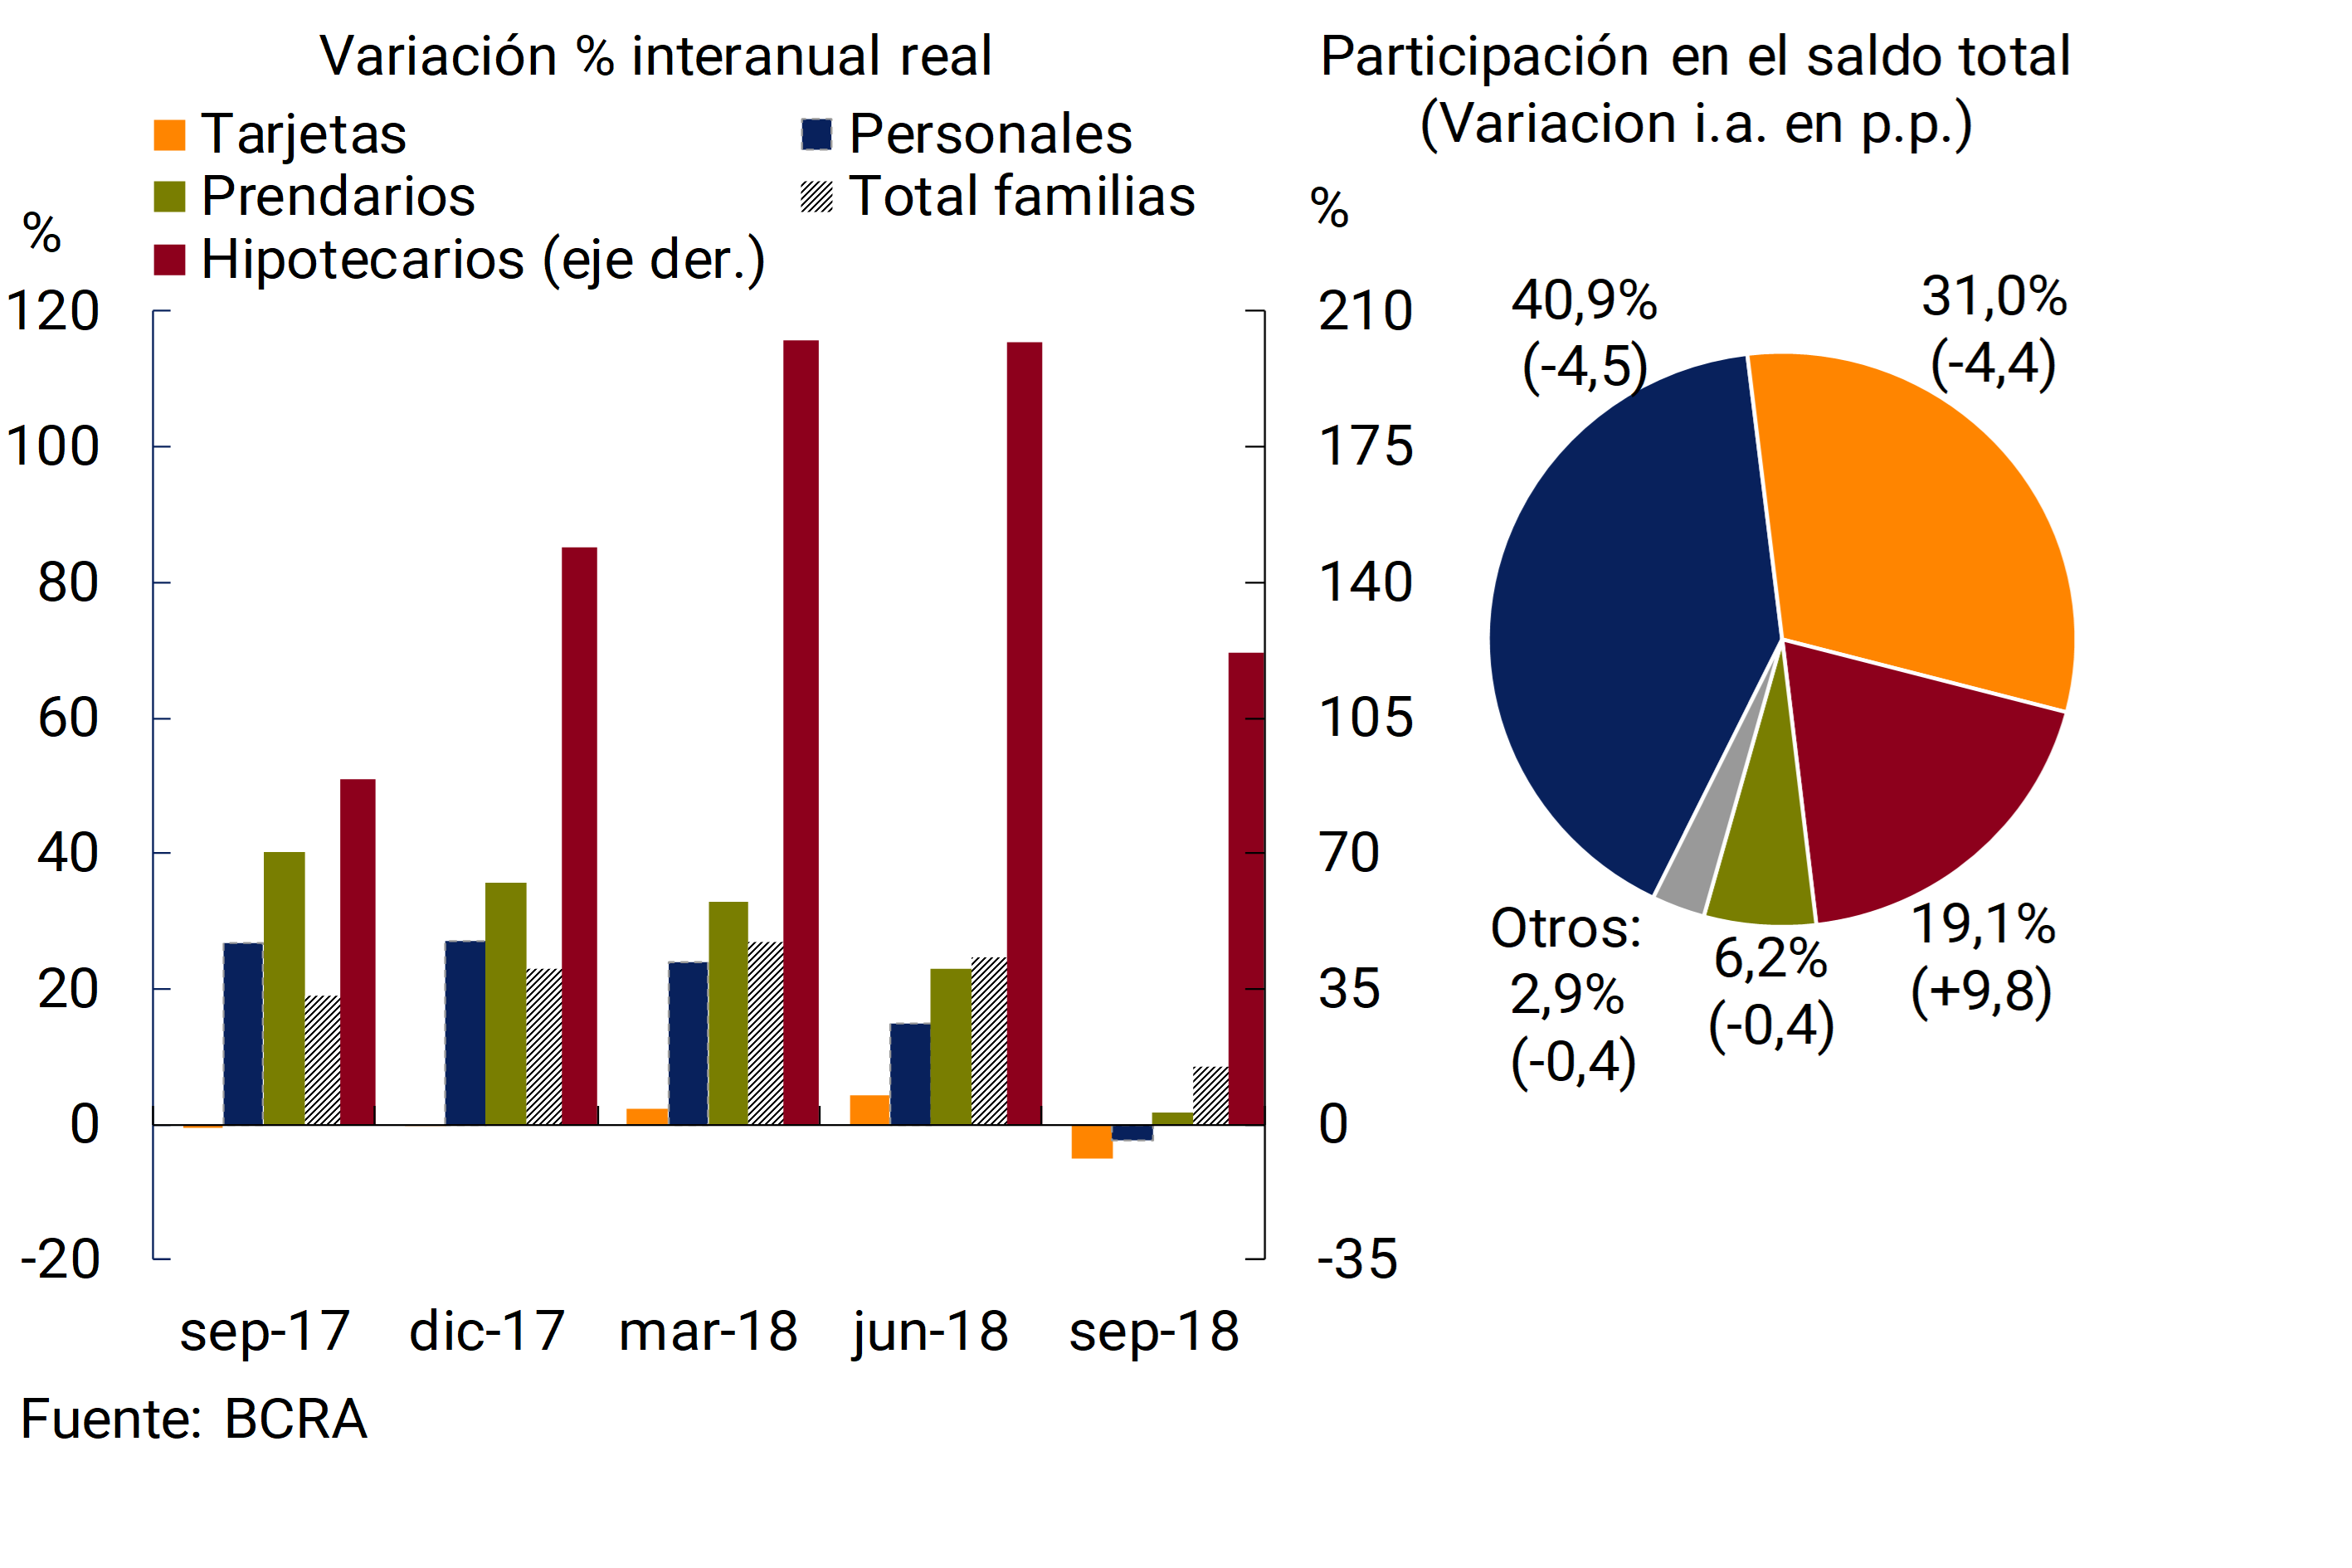
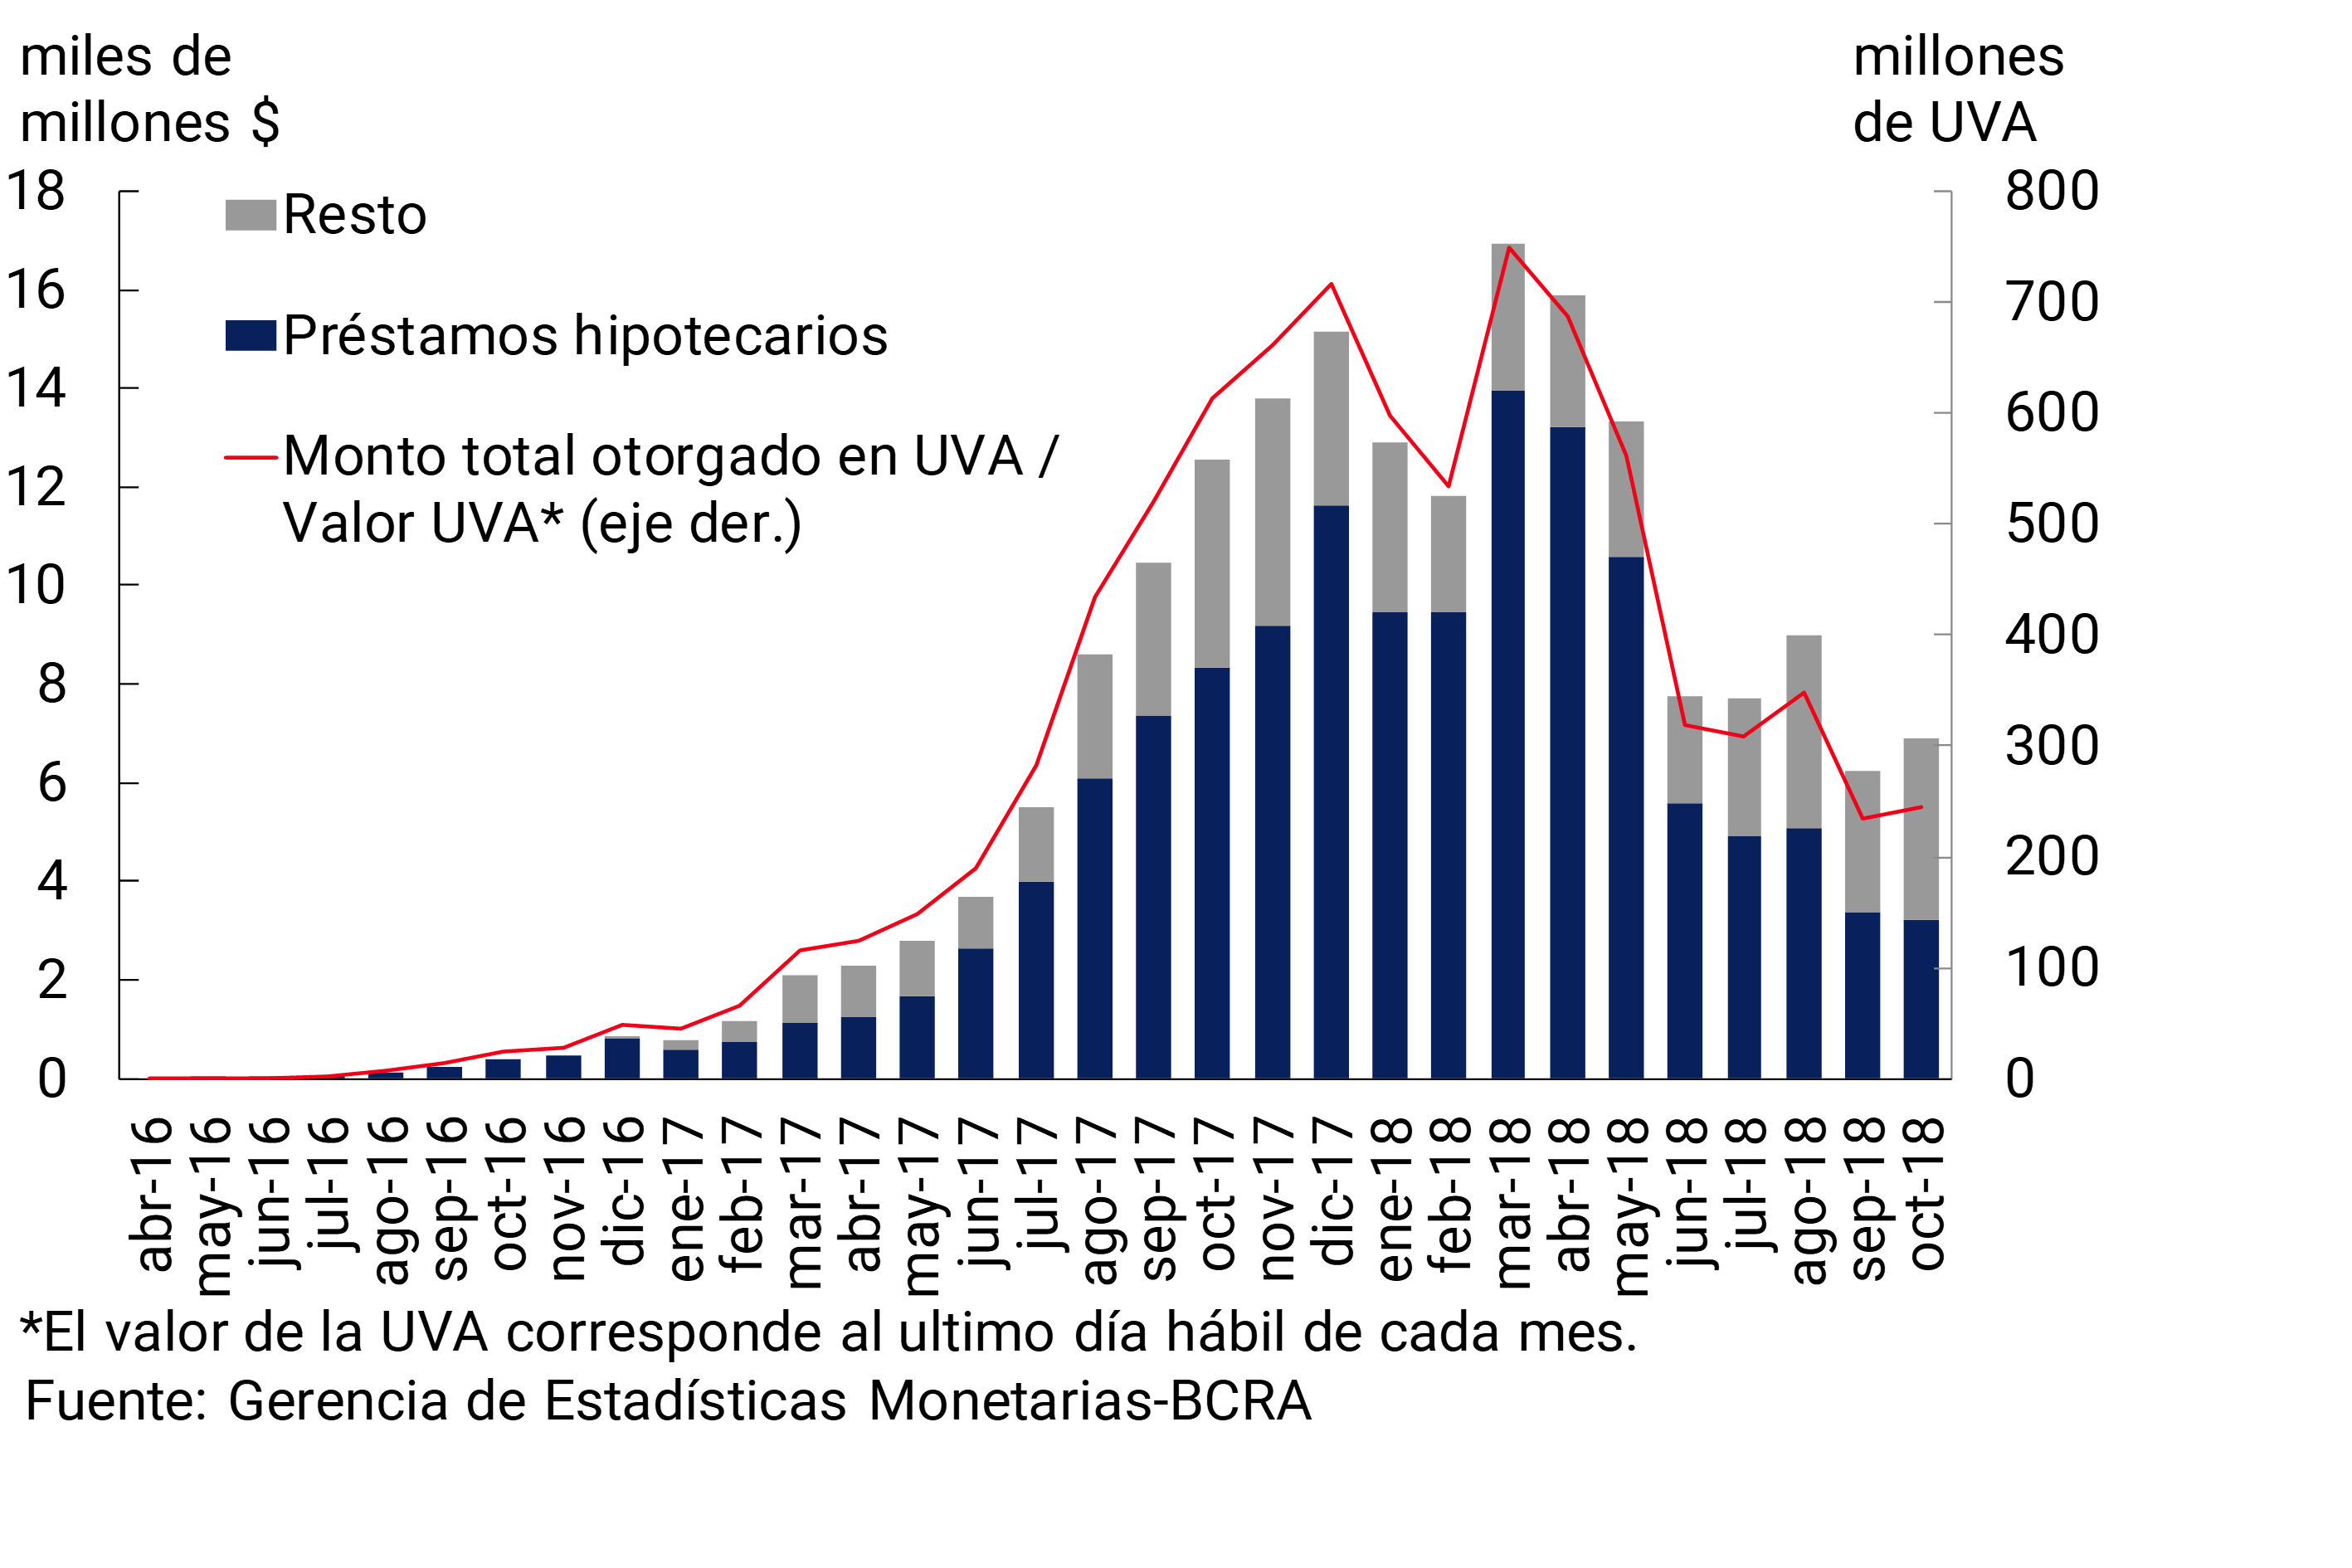
UVA loans have also shown less dynamism since the middle of the year (see Graph 14). In October, the total loans granted in UVA to individuals and legal entities totaled $6,913 million (245 million UVA). 22 Of the total granted in UVA in the month, 47% corresponded to mortgage loans, 36% to personal loans and 17% to pledges. Taking into account the balance sheet of the financial system aggregate in September, UVA financing to the private sector reached a total of $220,942 million, 74% of which corresponded to mortgage lines. 23
Figure 14 | UVA Financing – Amounts Granted
The lending rates of the financial system operated in pesos with the private sector increased in September in all lines of credit and in all groups of banks.24 The rates agreed in the commercial segment (documents and advances) showed the highest relative monthly increases. On the other hand, in the period, the average interest rates operated in UVA followed the same upward trend, with the exception of the rates operated for mortgages, which remained without significant variations with respect to the month of August.
The non-performing loan ratio for private sector loans stood at 2.3% in September, in line with the value observed in the previous month (see Chart 15). Although in a year-on-year comparison this coefficient verified a slight increase (+0.5 p.p.), it remains in an environment of relatively low values both in historical terms and when compared with other emerging and developed economies.25
Figure 15 | Irregularity of Credit to the Private Sector – Irregular financing / Total financing (%)
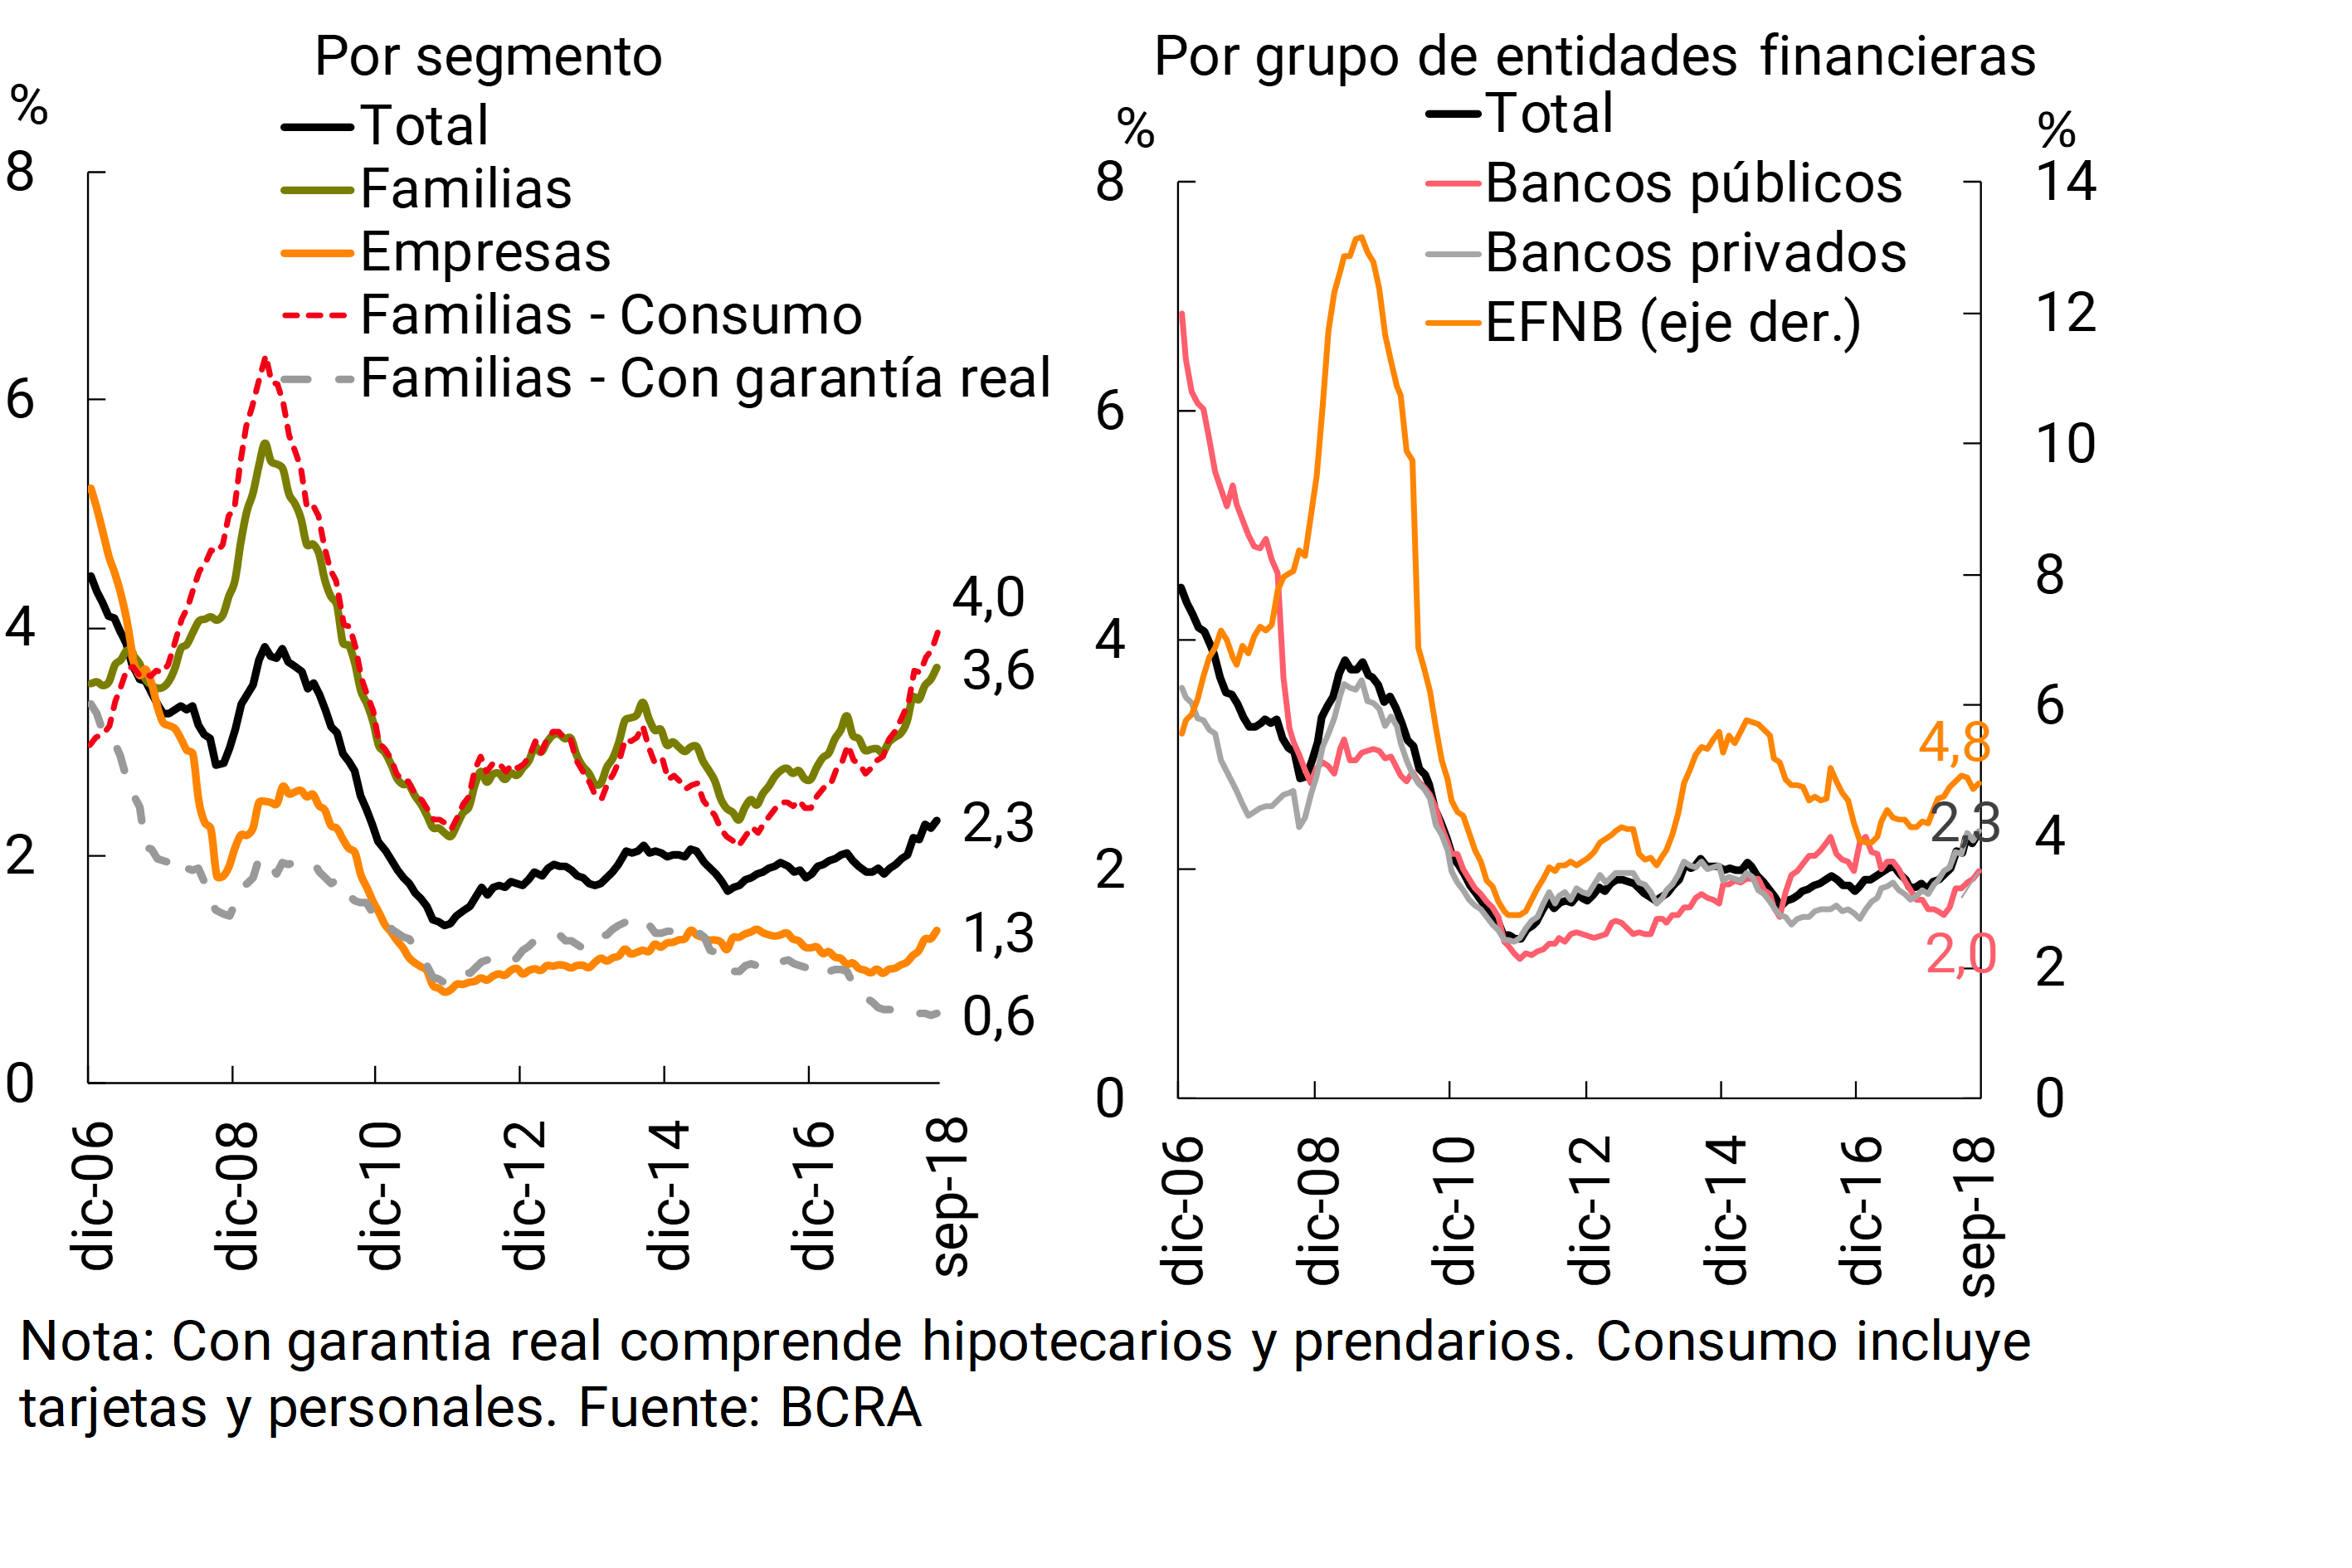
Disaggregated by segment, in September the NPL ratio to households increased slightly to 3.6% of the portfolio (+0.7 p.p. y.o.y.), a performance mainly explained by consumer lines (see Chart 15). For its part, the irregularity ratio of loans to companies remained at 1.3% in the period (+0.3% YoY). In this context, the forecast continued to be high. At the end of the third quarter, the accounting forecasts of the financial system aggregate represented 125% of the private sector’s portfolio in an irregular situation.
It should be noted that, as a result of low credit exposure and irregularity and high levels of forecasts and capital, the financial system maintains a significant degree of resilience in the face of extreme hypothetical scenarios of materialization of this type of risk.26 The results of the credit risk stress exercises, based on sensitivity analysis, carried out by the BCRA for the third quarter of the year have shown a reduced impact on the system’s aggregate, with no significant changes compared to those carried out in recent quarters.
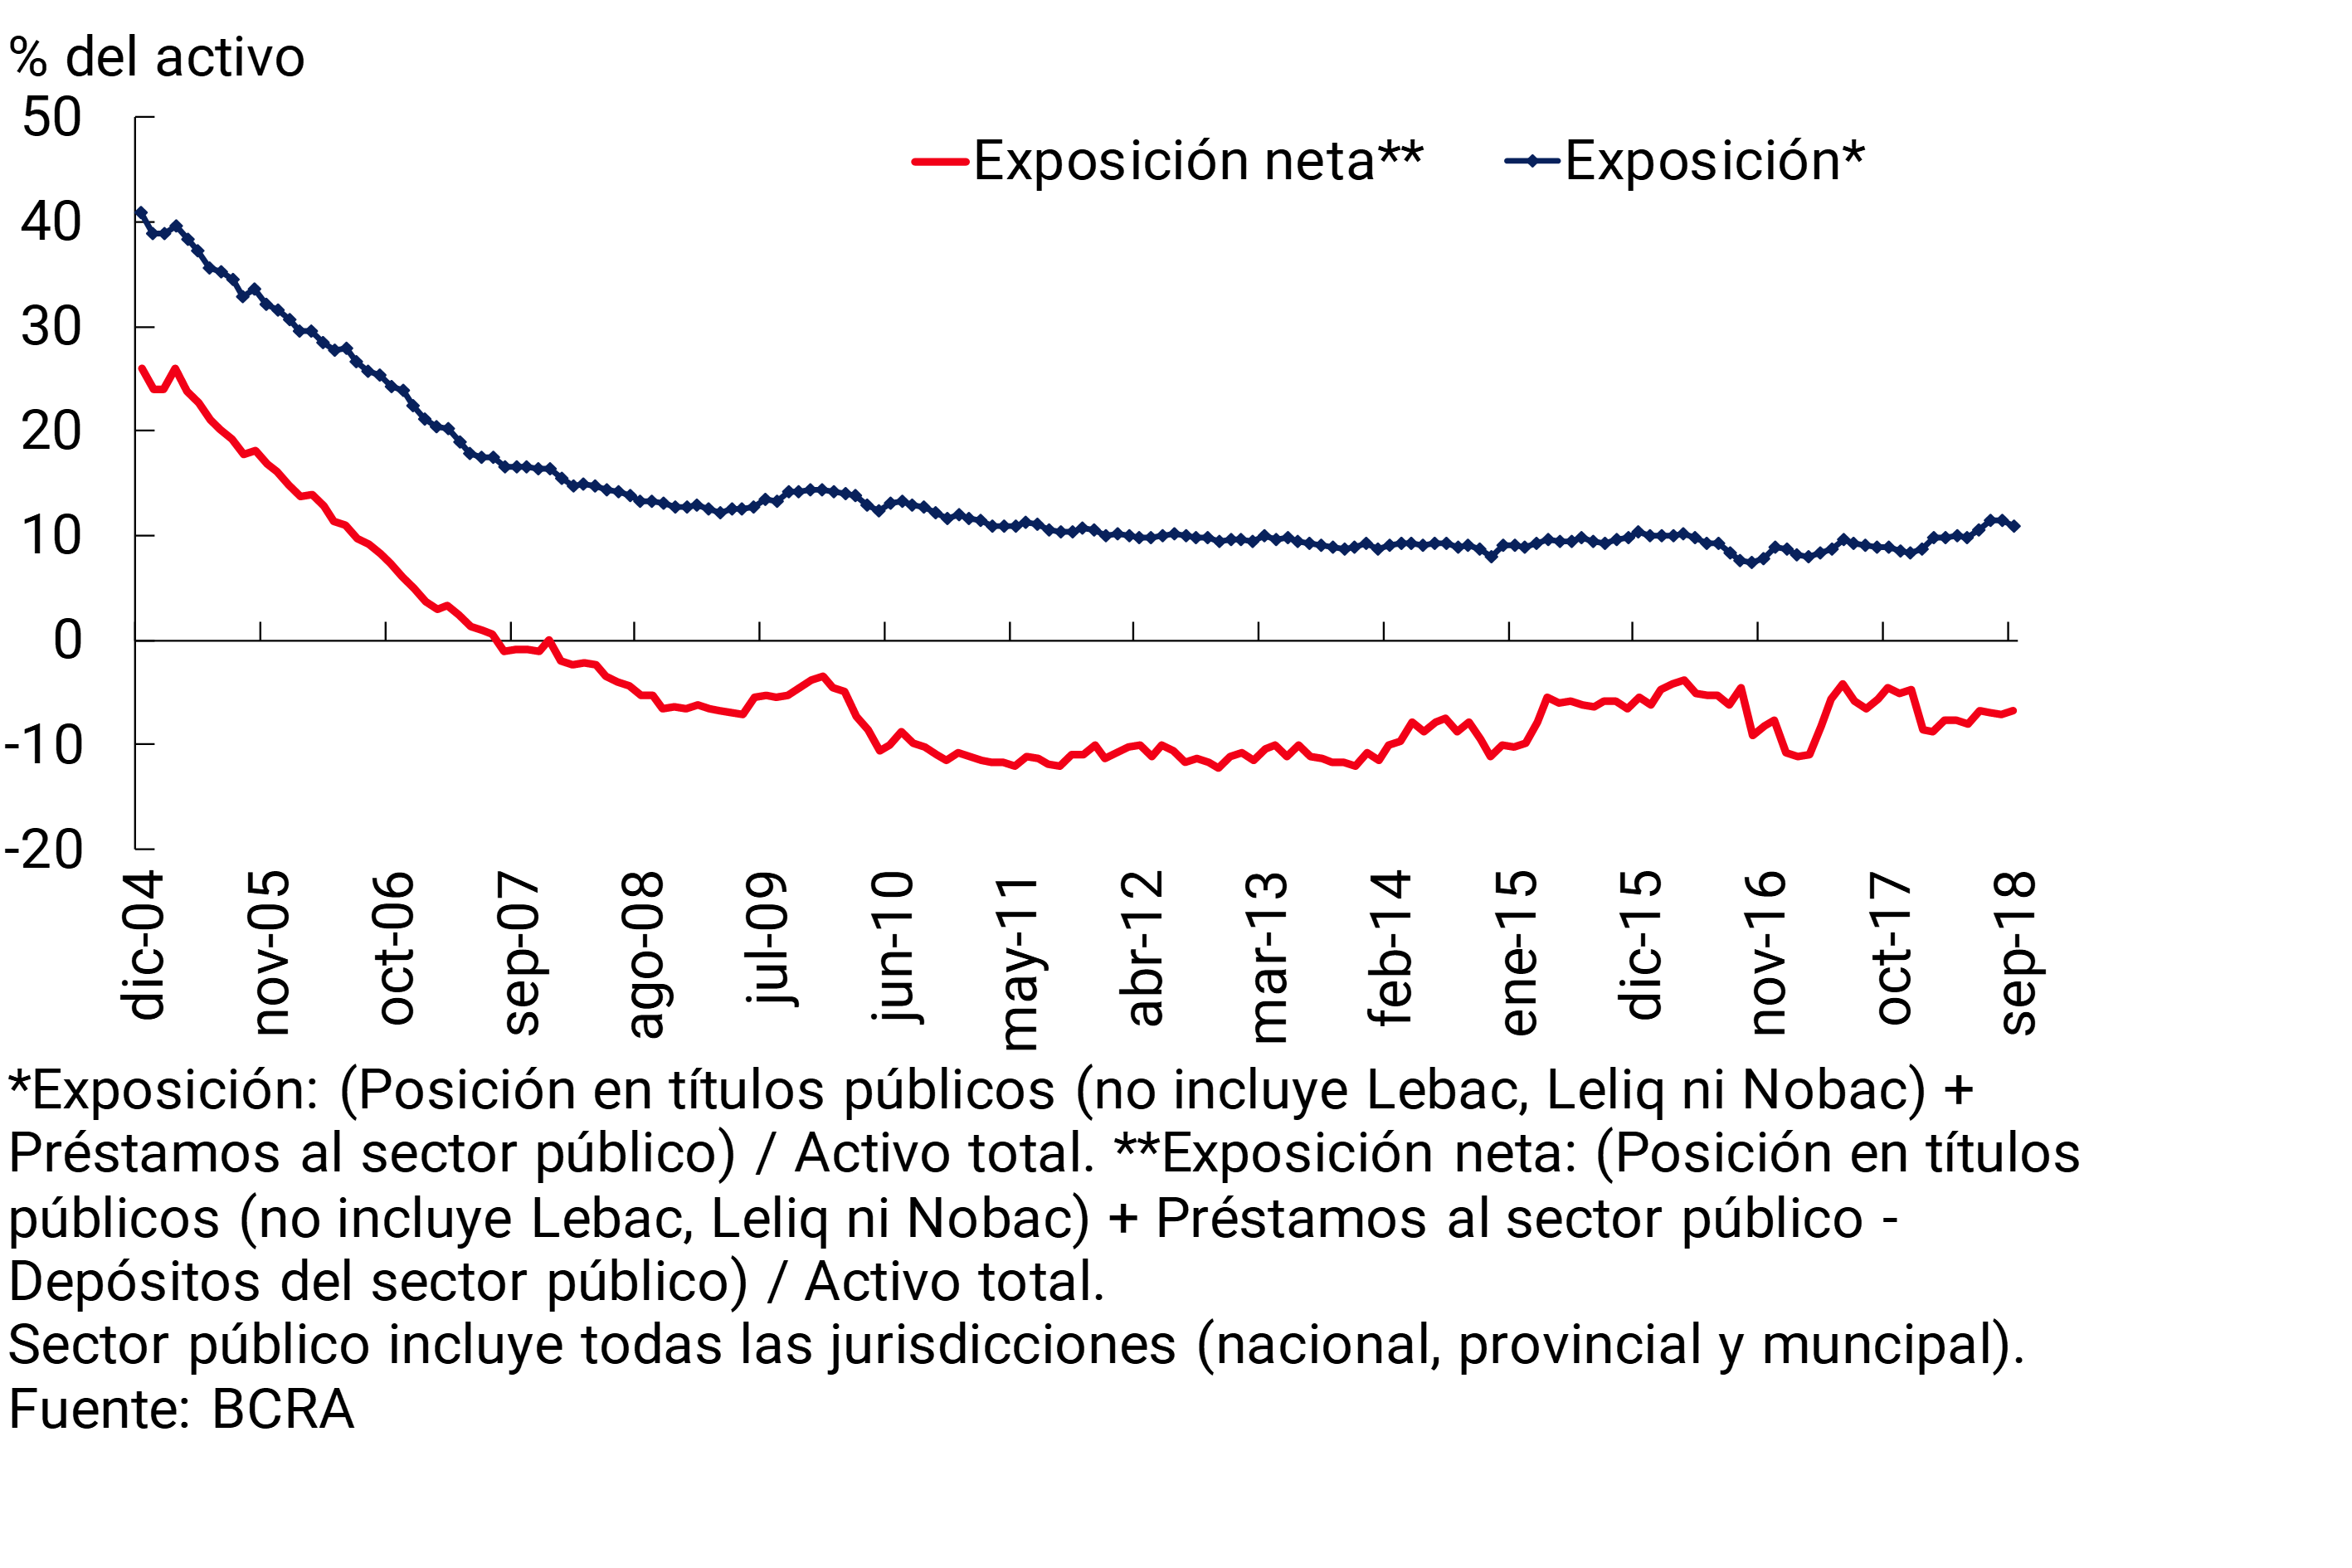
The financial system’s exposure to the public sector remained low ( see Chart 16). At the end of the third quarter of the year, the gross exposure of all financial institutions to the public sector represented 11% of total assets, slightly above the level of a year ago. The balance of deposits in the public sector continued to exceed the balance of credit to this segment. Thus, the public sector continued to position itself as a net creditor of the financial system at a level equivalent to 6.6% of total assets in the month.
Figure 16 | Exposure of the Financial System to the Public Sector
V. Solvency
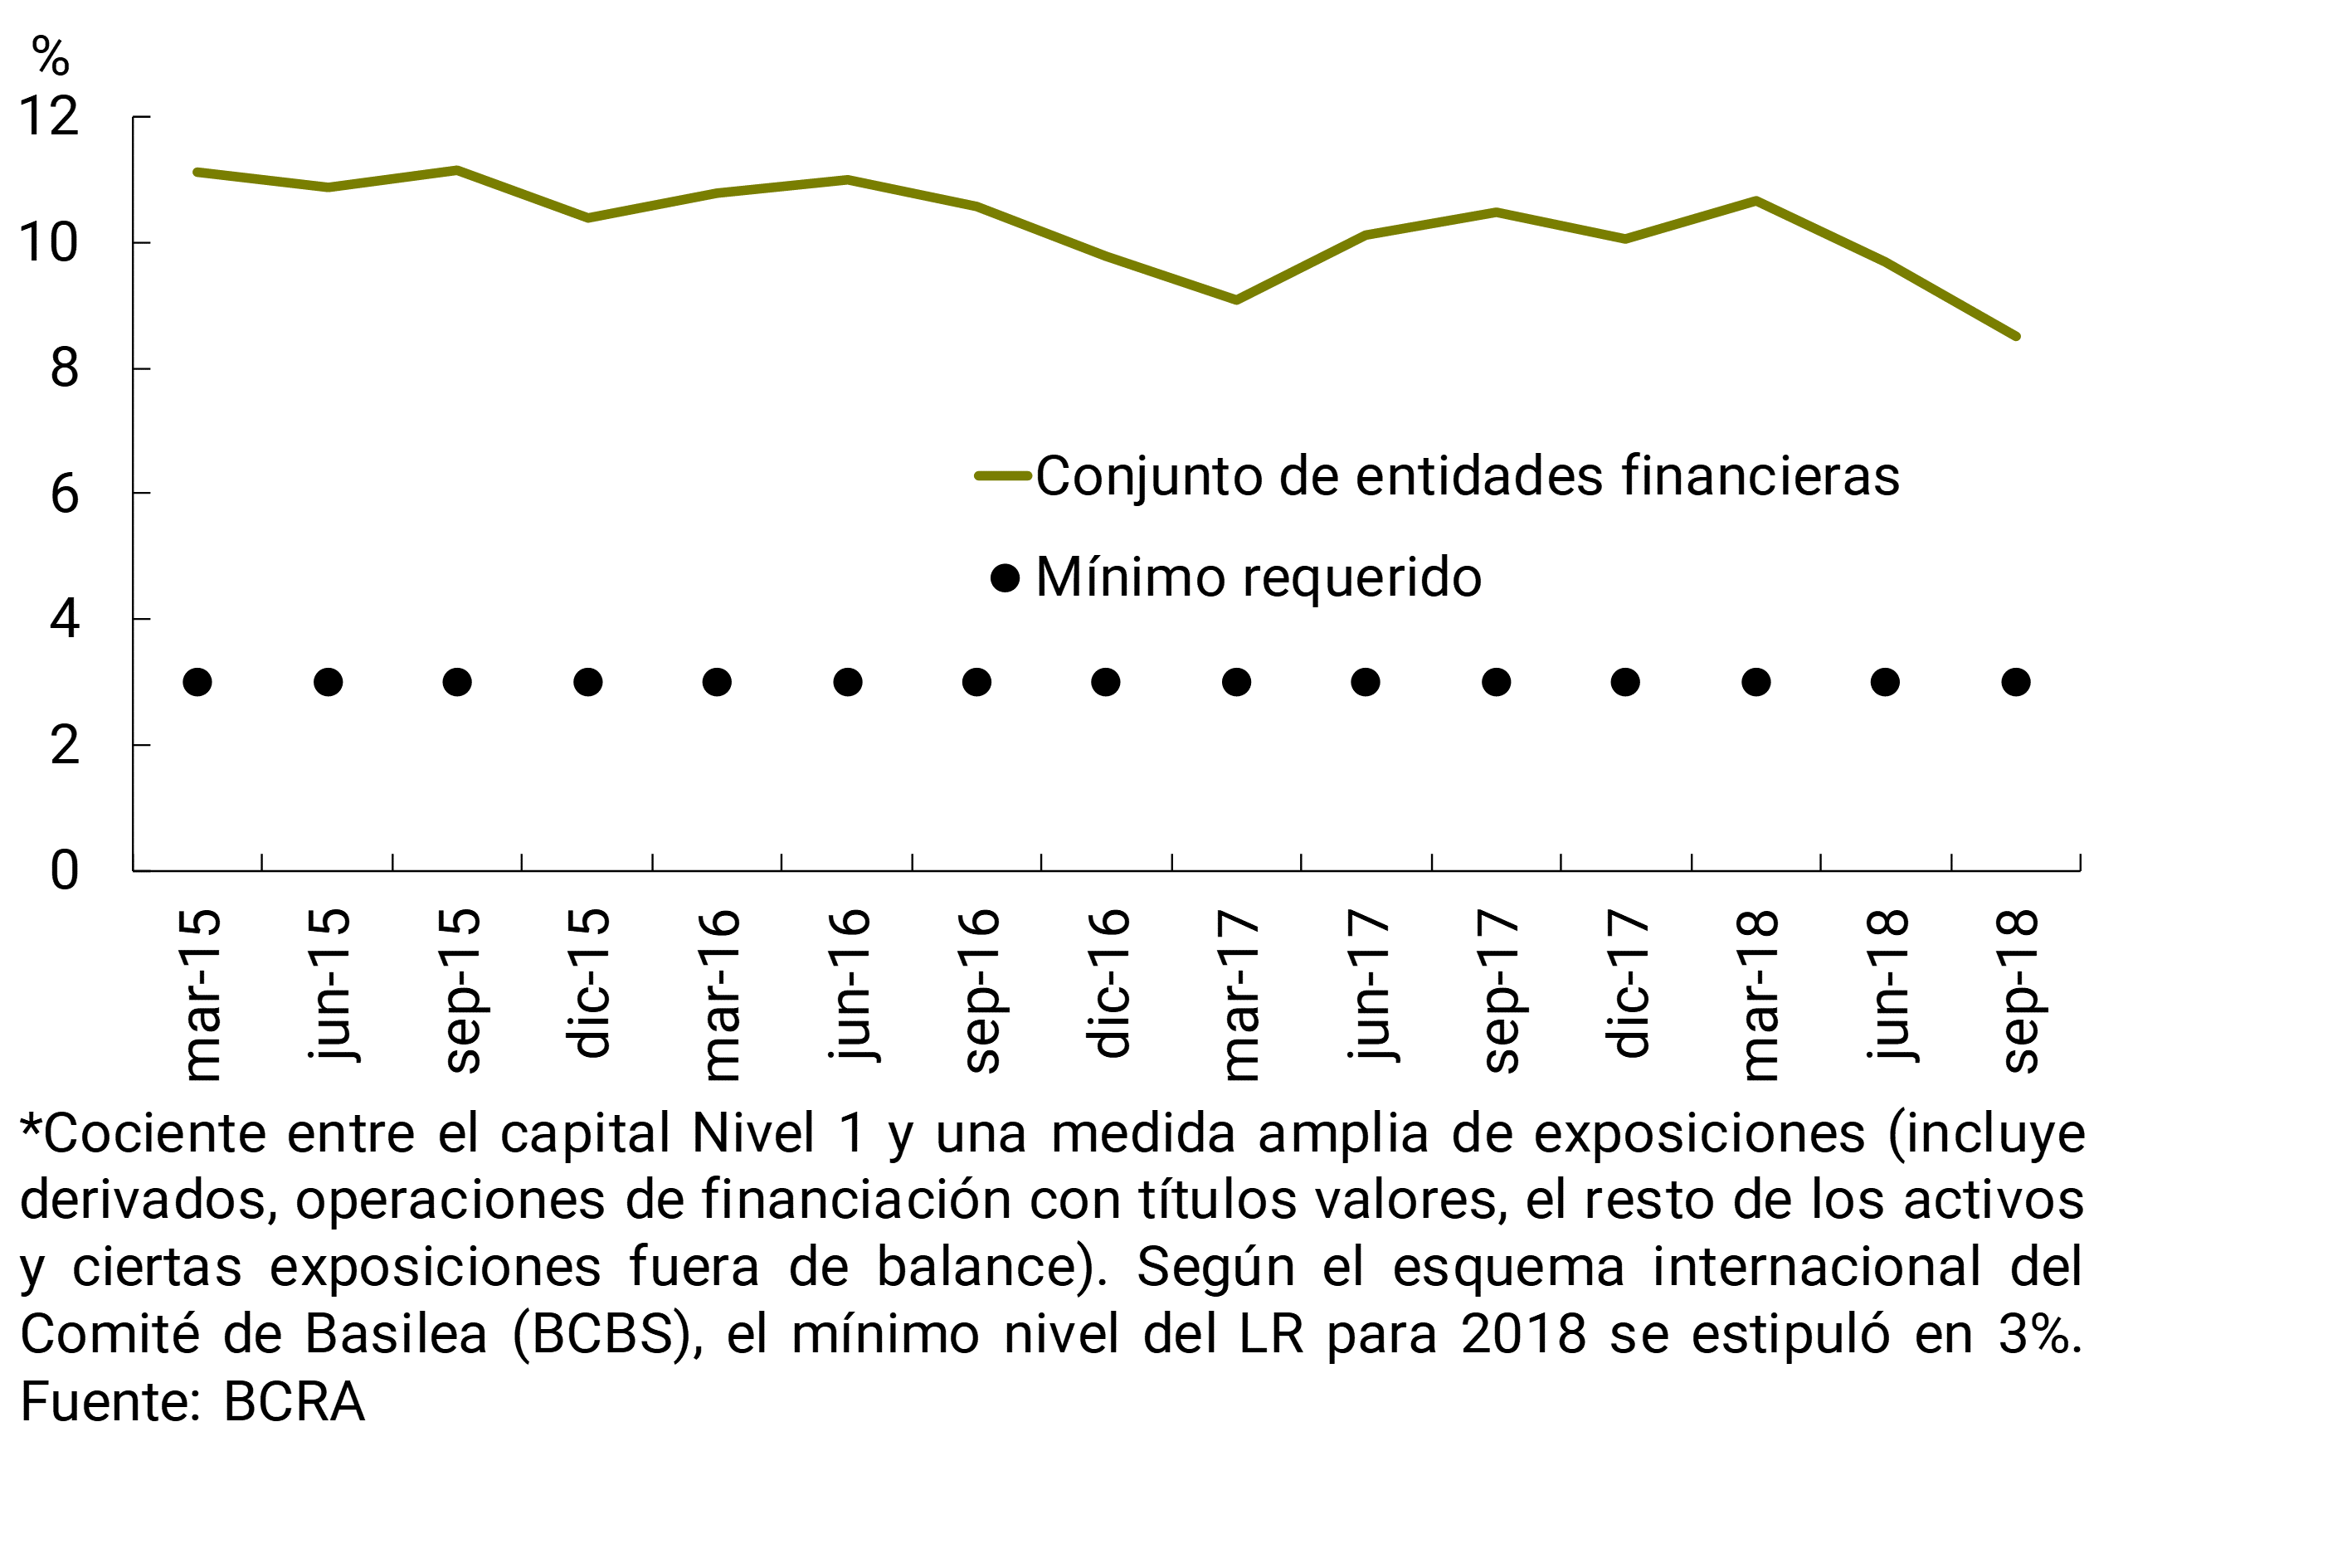
At the end of the third quarter of 2018, the solvency indicators for all banks showed relatively high values. In September, the regulatory integration of capital in the aggregate financial system totaled 14.4% of risk-weighted assets (RWA), similar to last month’s figure (see Chart 17). Most of this integration was explained by the capital with the greatest capacity to absorb eventual losses (Tier 1 capital represented 88% of the total). Surplus capital accounted for 67% of the regulatory requirement at the systemic level. 27 The sector’s leverage continued to be moderate. The leverage ratio for all local banks reached 8.5% in September, much higher than the lower regulatory threshold of 3% (recommended by the Basel Committee, see Chart 18). It can be considered that, from these high levels, the capital integration and leverage ratios declined on a year-on-year basis.
Figure 17 | Integration and Excess Regulatory Capital (Position)
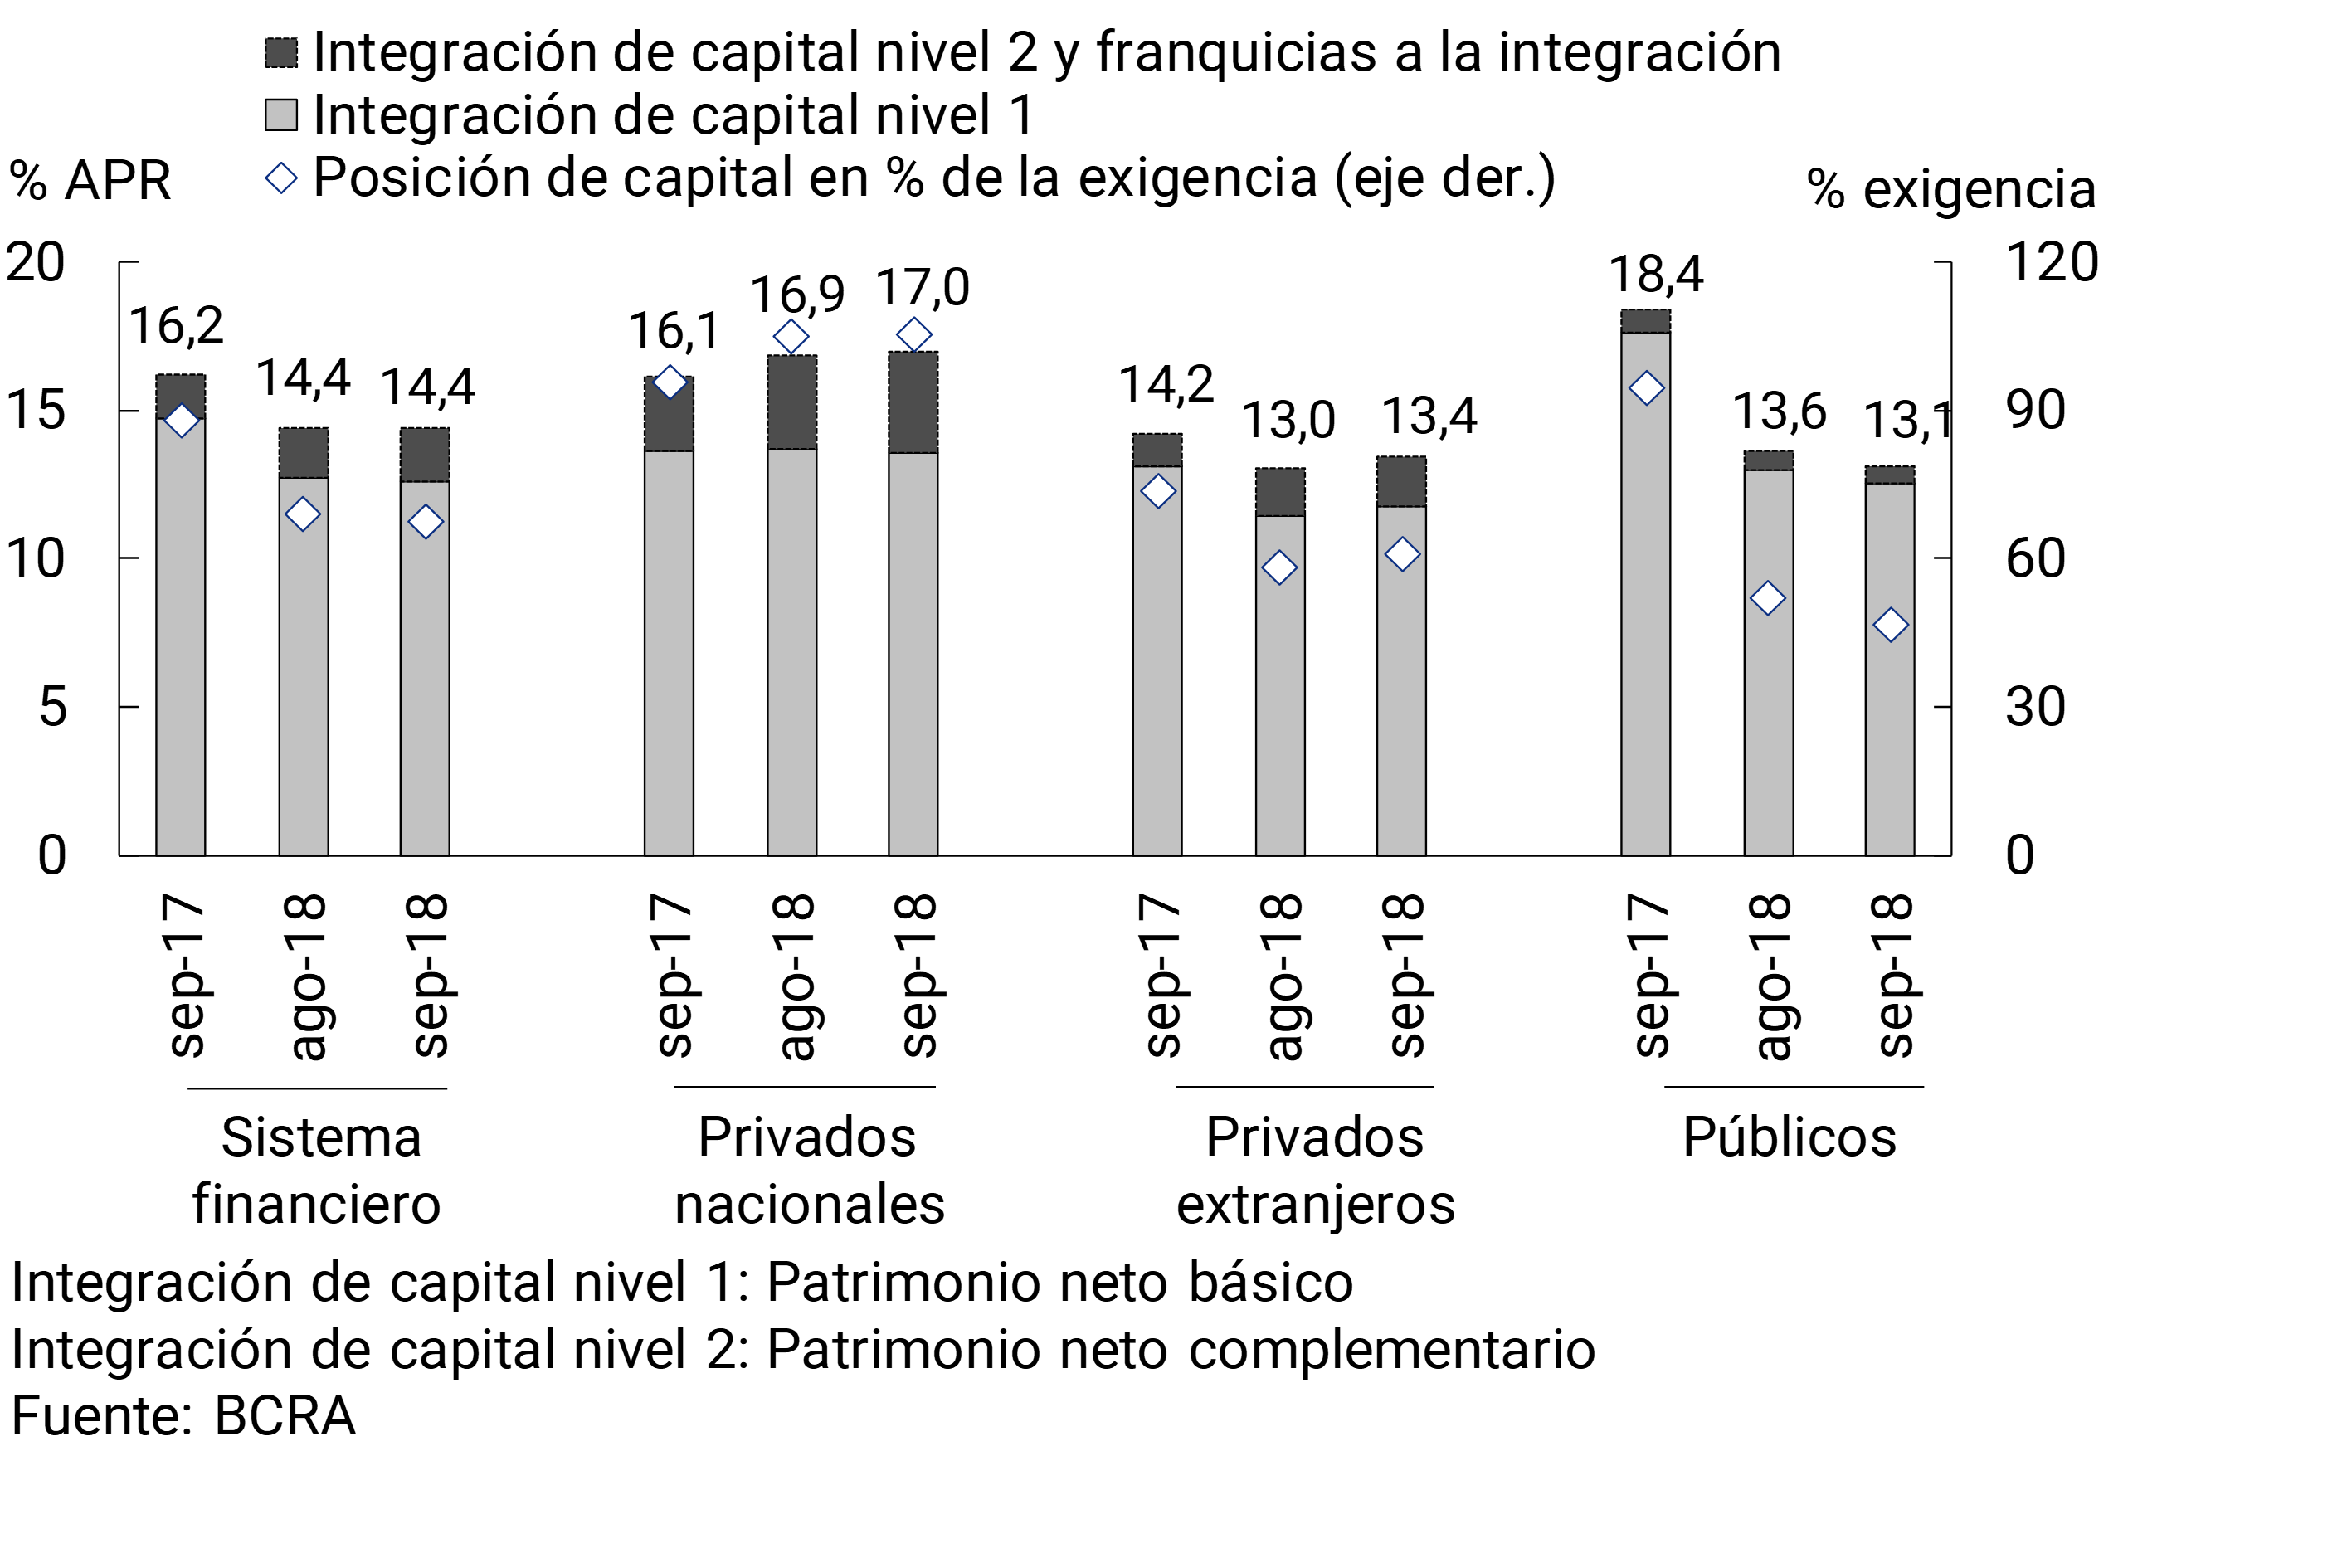
Figure 18 | Leverage Ratio* (LR)
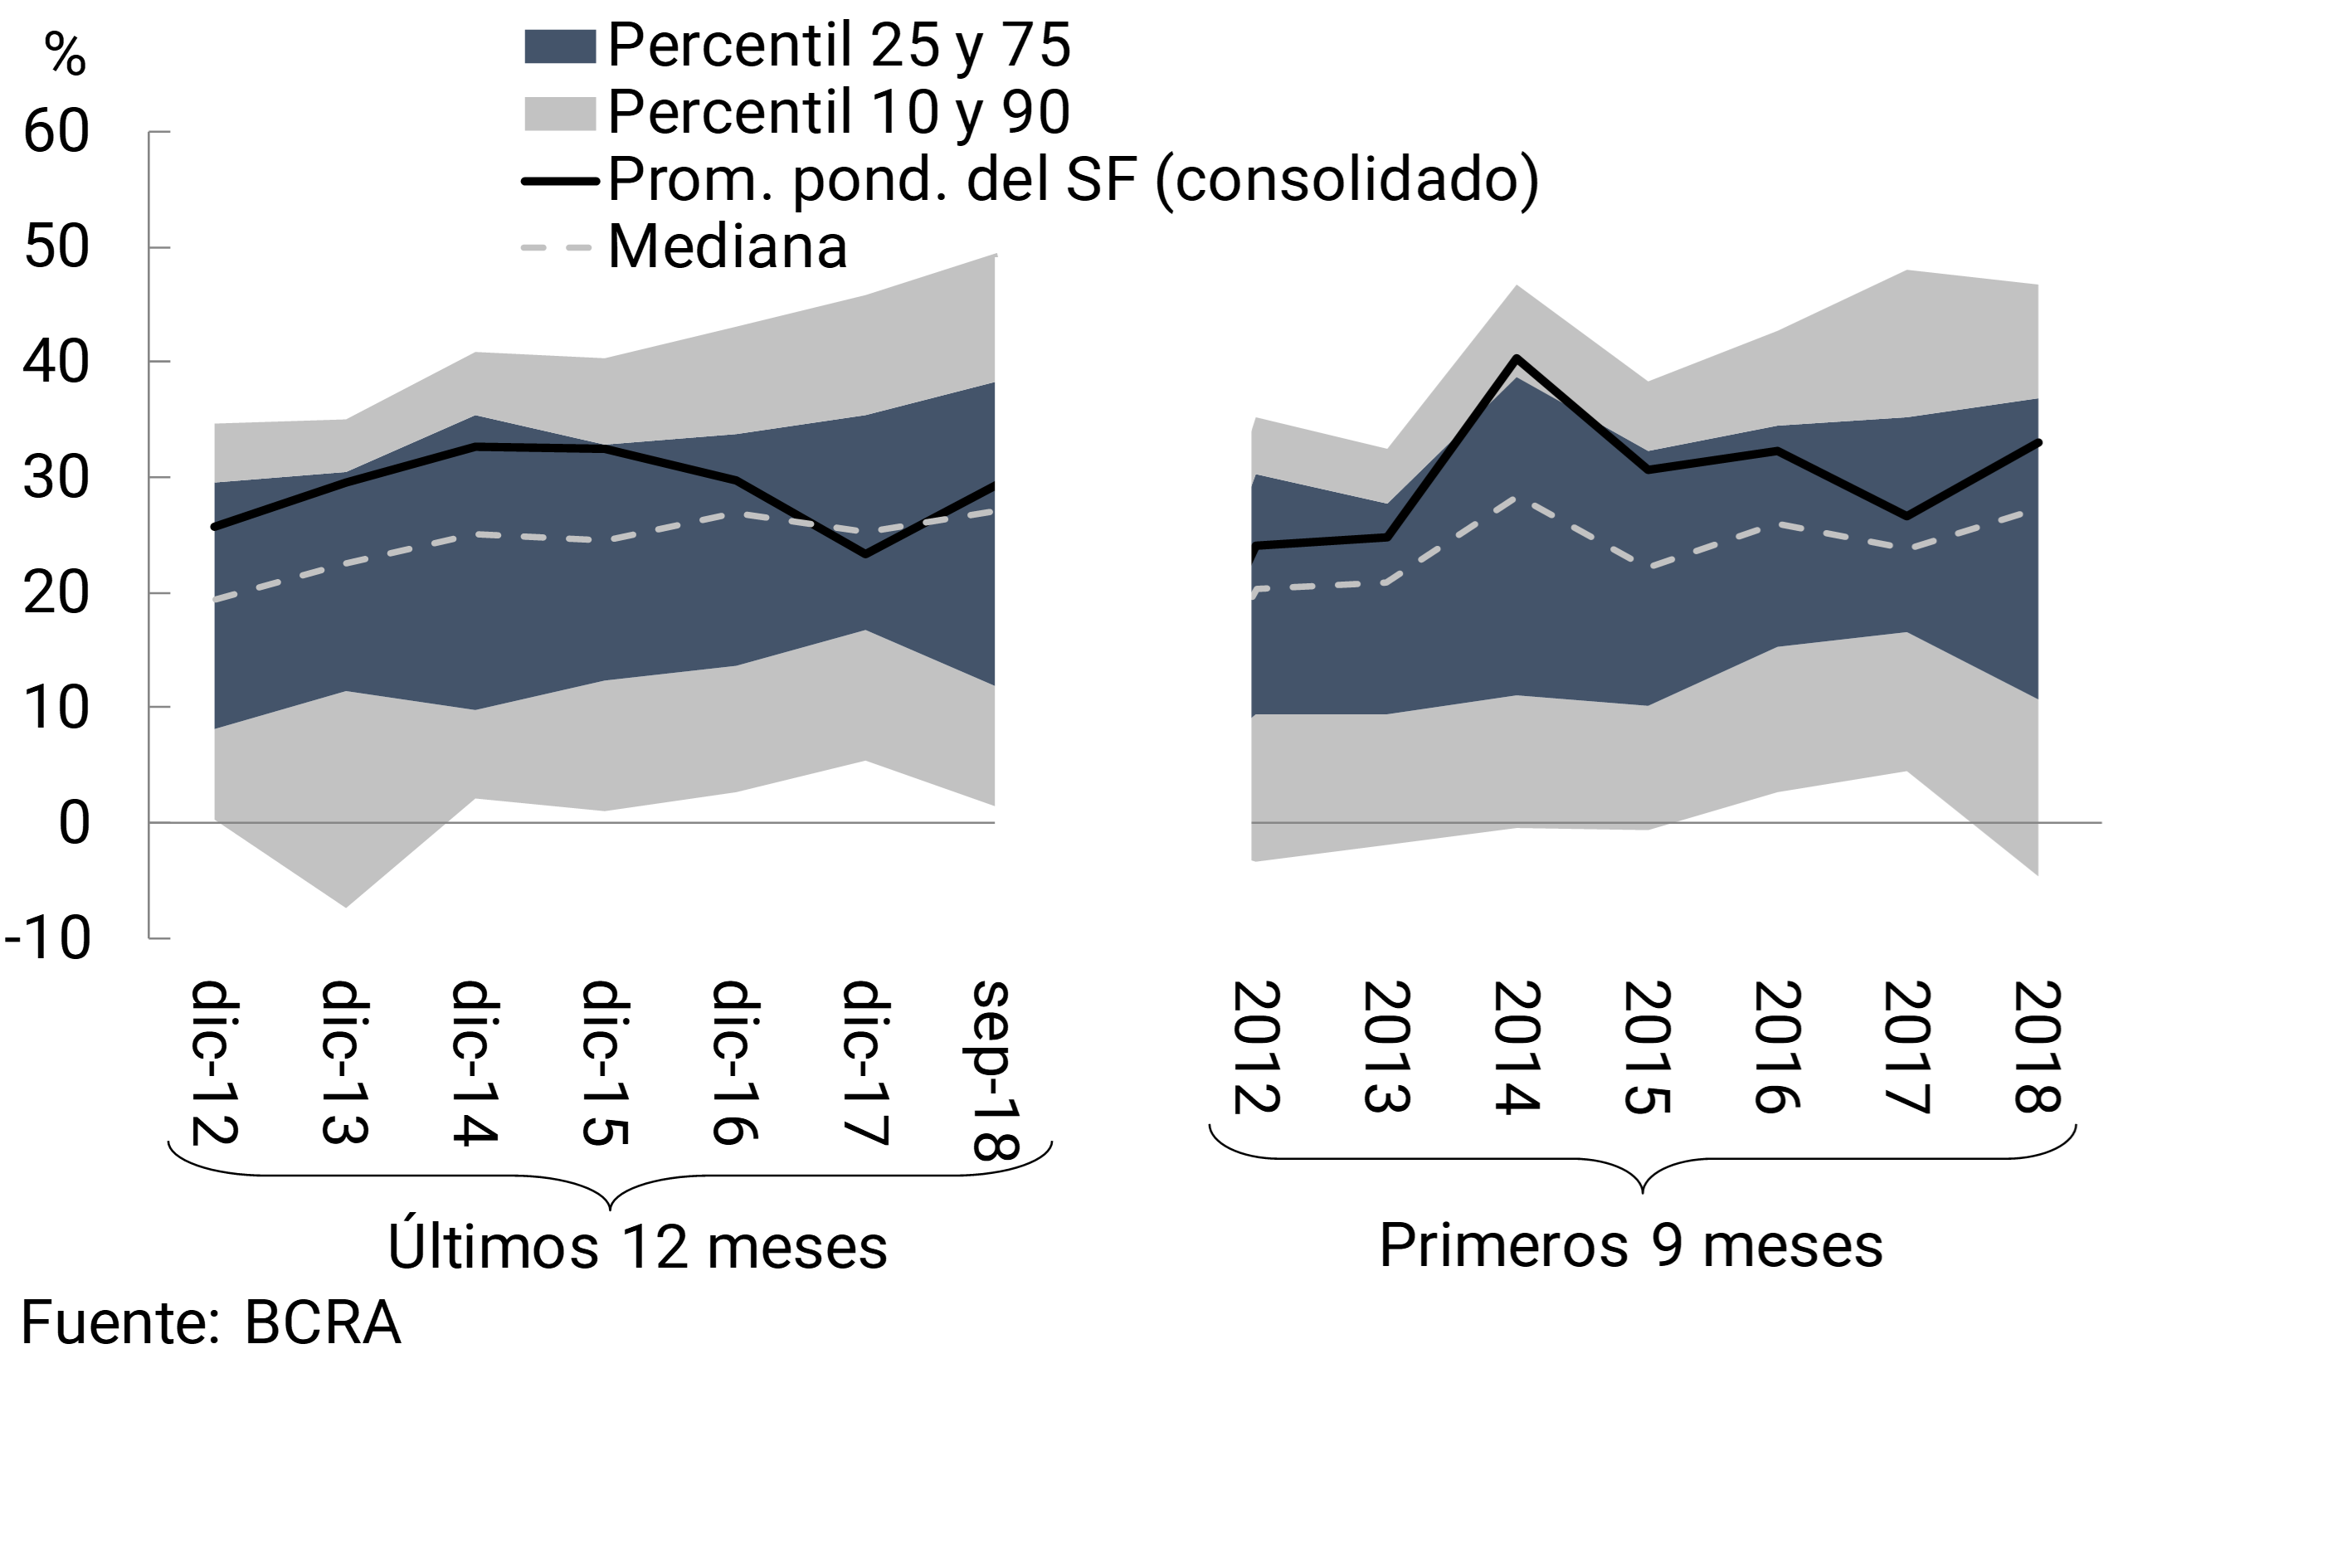
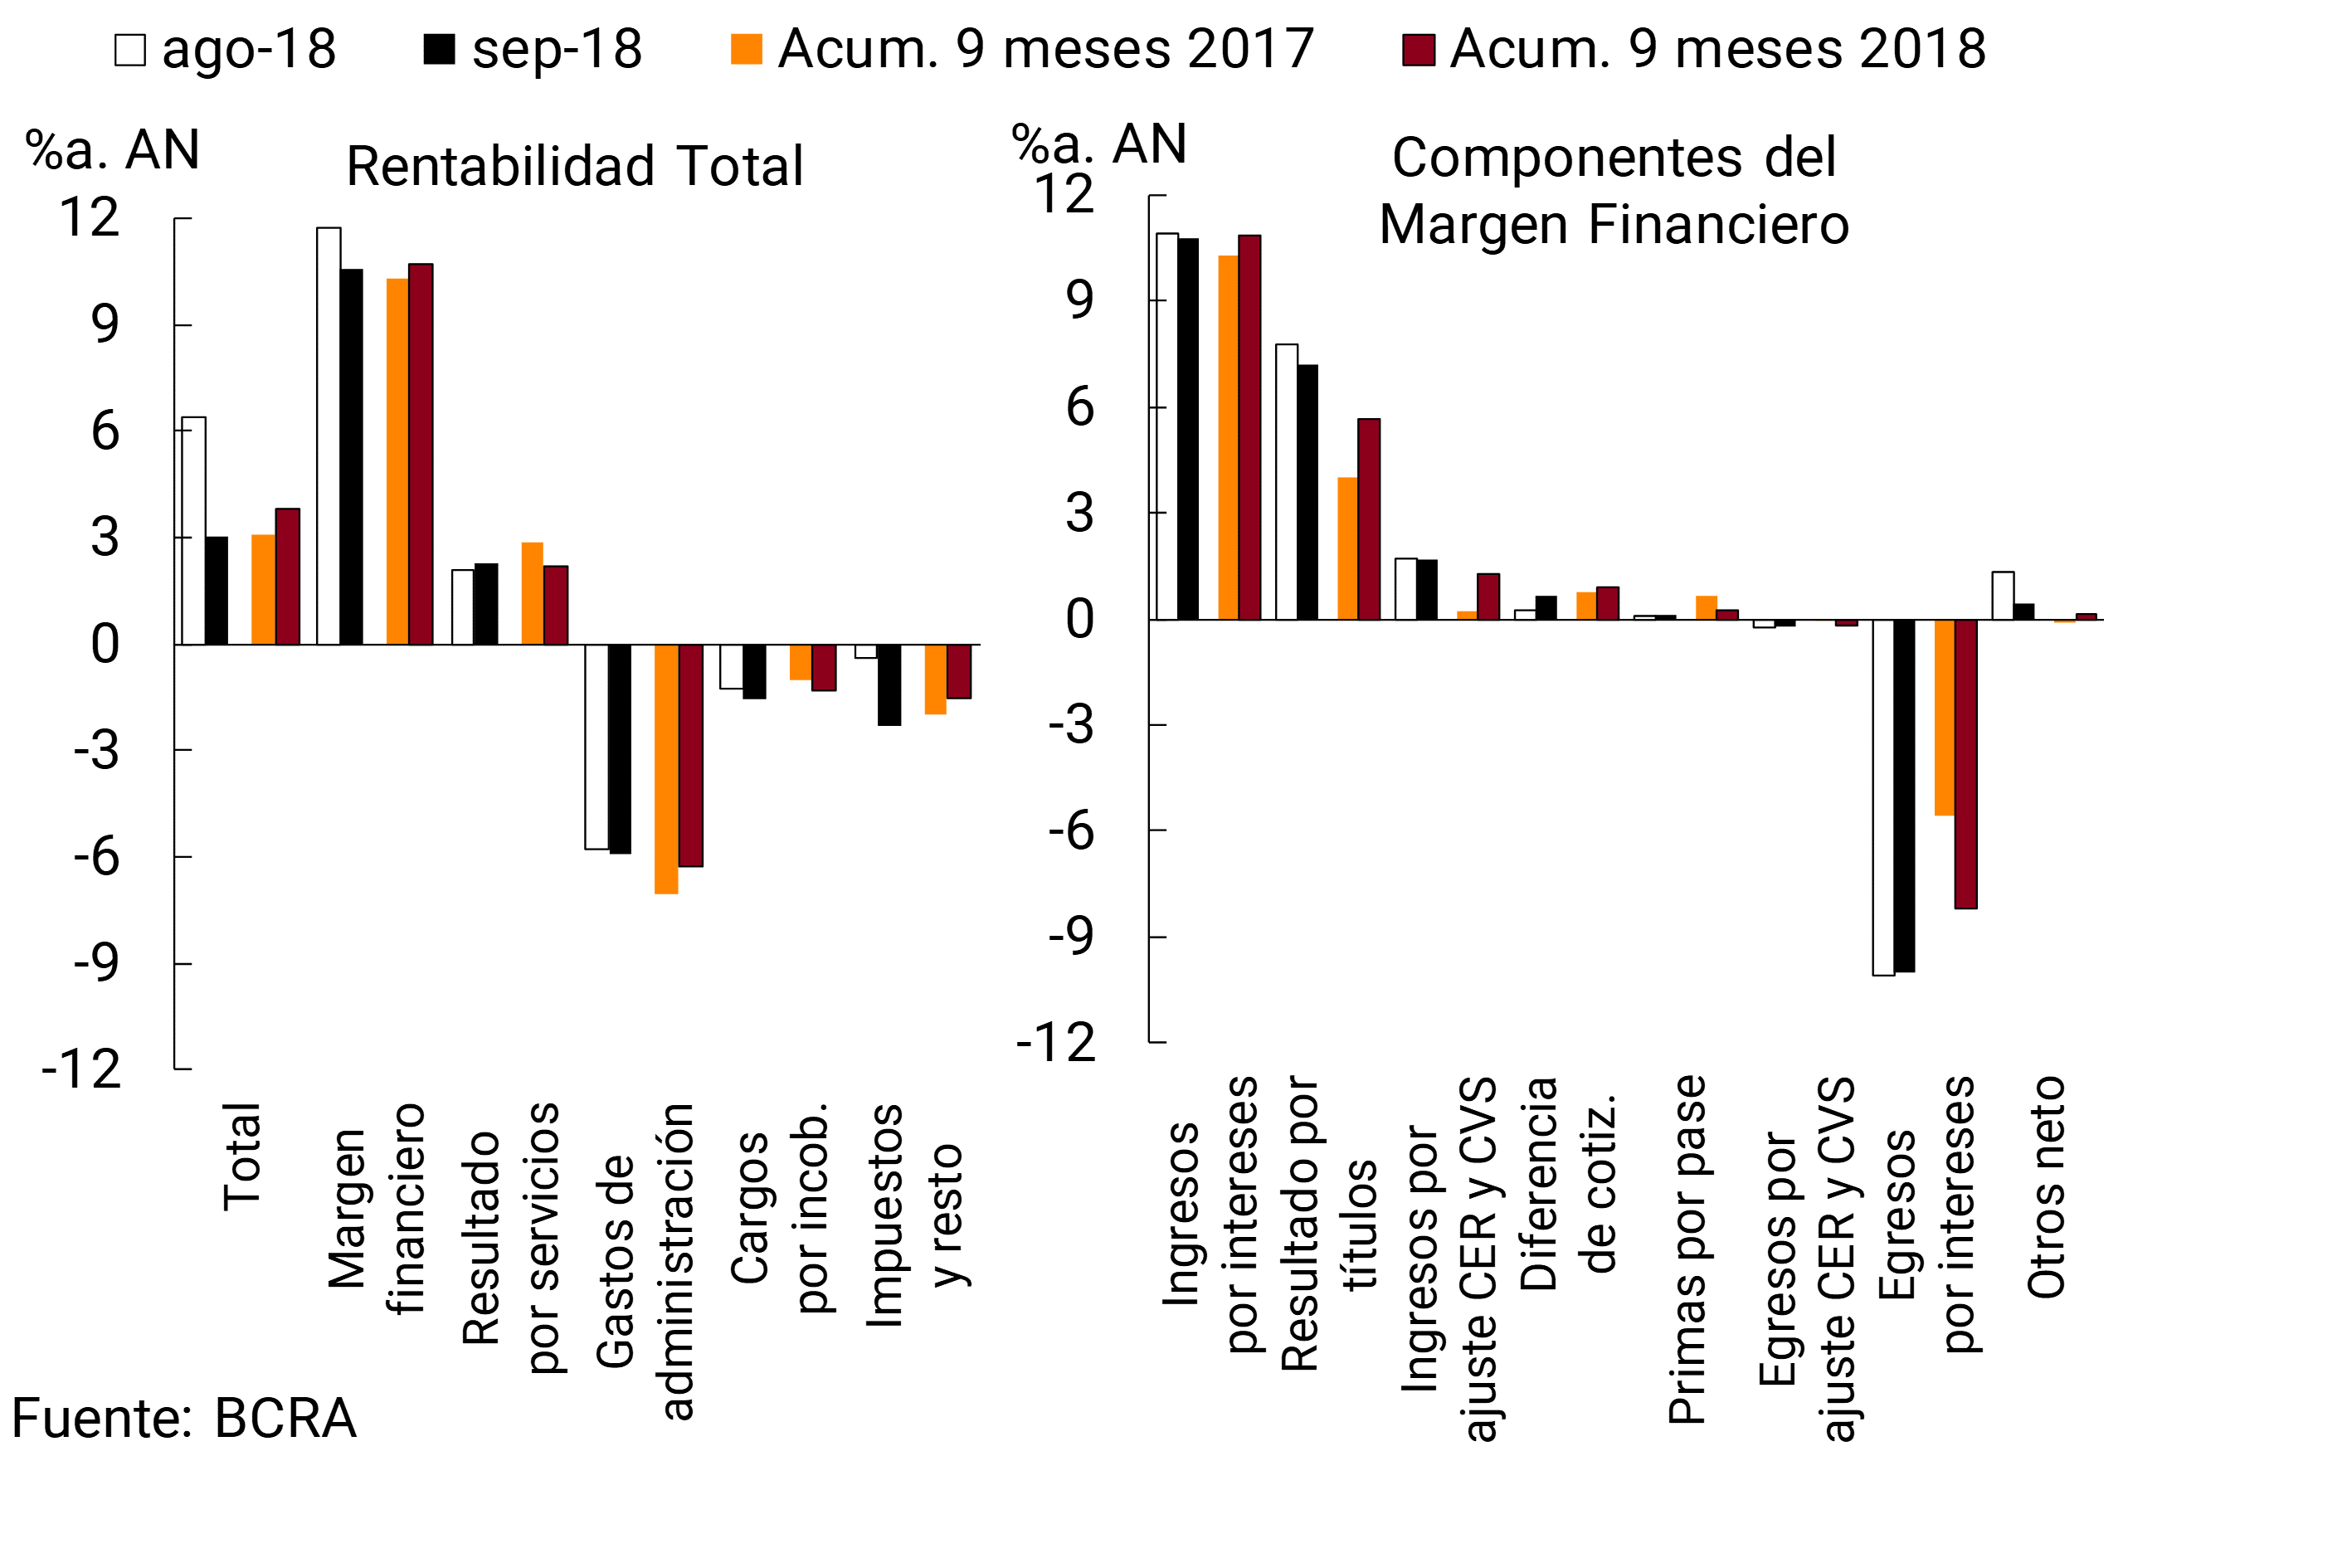
The nominal monthly earnings accrued by the financial system were equivalent to 3% annualized (y.) of assets and 29.1% y. of net worth. These profitability ratios fell compared to August, mainly due to the performance of public banks. For their part, private banks—both domestic and foreign—increased their monthly profits slightly (see Chart 19). In the accumulated nine months of the year, the financial system recorded an ROA of 3.8%y. and an ROE of 33%y.y., in nominal terms, increasing 0.7 p.p. y.o.y. and 6.4 p.p. y.o.y., respectively. It should be considered that the year-on-year increase in the 9-month cumulative ROE was lower than the year-on-year increase in accumulated inflation in the first 9 months of 2017 and 2018. In 2018, there was a significant dispersion in profitability between banks compared to previous years (see Chart 20).
Figure 19 | Profitability by Group of Financial Institutions
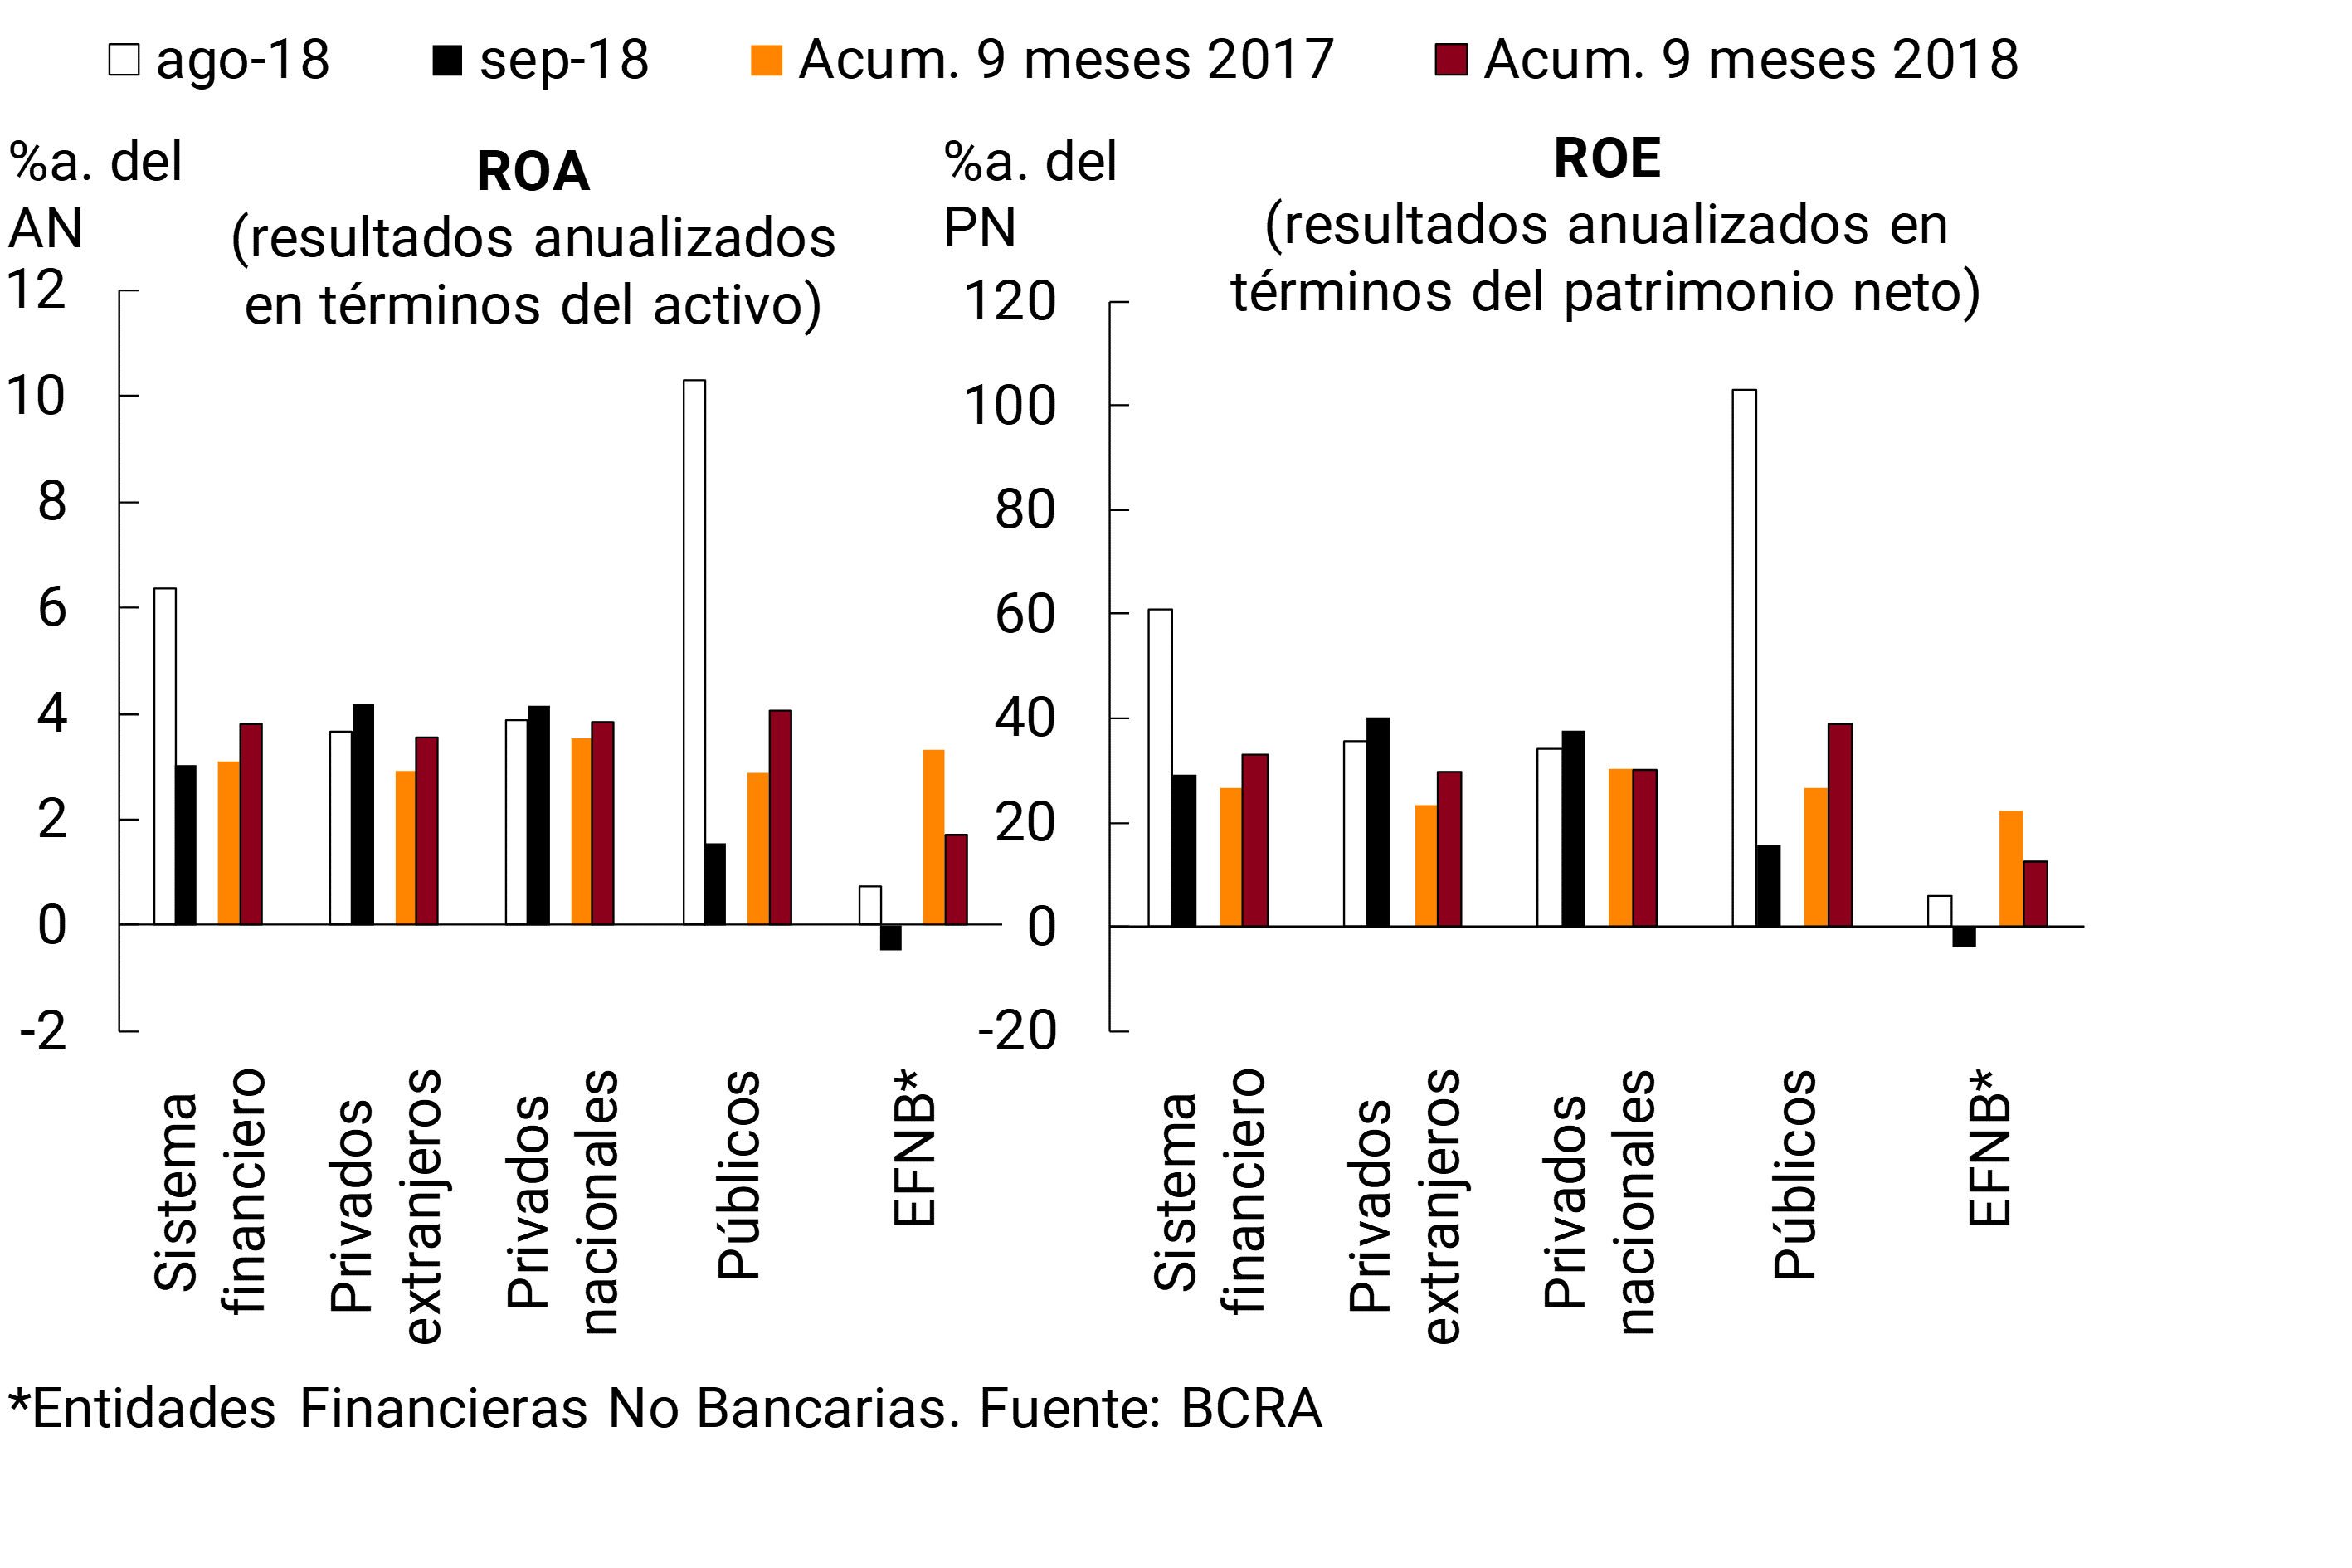
Figure 20 | Return on Equity (ROE)
The financial margin of the financial system fell by 1.2 p.p. of the asset in the month (see Chart 21). The monthly decrease was mainly explained by lower gains from forward operations in foreign currency and securities and, to a lesser extent, by the reduction in interest income. These effects were tempered by an increase in earnings due to differences in quotation. In the nine-month cumulative of 2018, the financial margin totaled 10.7% of assets, 0.4 p.p. more than in the same period of 2017. This increase was mainly due to higher gains on securities, income from CER adjustments and interest income, effects offset by the increase in interest and CER expenses and by the reduction in pass premiums.
Figure 21 | Income Table – Financial System
Taking into account the group of private banks, in September the financial margin increased 0.6 p.p. of assets compared to August. This increase was due to the reversal of the losses evidenced last month due to differences in exchange rates and the increase in gains on securities, effects partially offset by lower profits from forward operations in foreign currency, an increase in interest expenses and a reduction in interest income. In the accumulated nine months of the year, the financial margin of private banks represented 11.7% of assets, 0.4 p.p. more than in the same period of 2017.
In September, net income from services in the financial system continues to show a downward trend. In the cumulative nine months of 2018, these results were reduced by 0.6 p.p. of assets in relation to the same period last year (see Chart 21). In a context where credit irregularity ratios show an increase in recent quarters, bad debt charges in the aggregate financial system increased by 0.3 p.p. of assets in September compared to August (to represent 1.6%a) and 0.3 p.p. in a year-on-year comparison for the first 9 months of 2018 (see Chart 21). Similar behavior was for private banks. Finally, in terms of administrative expenses, the financial system registered a level of 5.9% of assets in September, with no change in magnitude compared to August. Between January and September 2018, these expenses reached 6.3% y/y. of assets, 0.8 p.p. less in a year-on-year comparison (see Chart 21).
Regulations
Summary of the main regulations of the month, implemented by the BCRA, related to financial intermediation activity. The date of publication of the standard is taken as a reference.
Communication A6558 – 04/09/18 | The rules on “Credit management” are adapted. The allocation of financing through specific evaluation methods – screening systems and credit scoring models – is extended to all types of legal entities not related to the financial institution and the maximum limit that can be granted to these legal entities under this modality is increased to 50% of the reference amount (currently $19.8 million) and up to 40% of the global limit. The amount of financing provided for in the rules on “Classification of debtors” is raised to 100% of the reference amount, up to which the option of grouping those of a commercial nature with consumer or housing loans is admitted. The scope as preferred guarantees is extended to all credit insurance, including those “with the scope of a public buyer”.
Communication A6569 – 14/09/18 | Effective as of 9/19/18, the minimum cash requirement rates in pesos for financial institutions with a participation of at least 1% in the total deposits of the non-financial private sector of the system are increased by 5%. The increase in this requirement on term placements of up to 59 days of residual term (excluding those expressed in UVA and UVI) may be integrated in pesos, LELIQ and NOBAC. The increase in the requirement (period and daily) on the other items subject to reserve requirements must be integrated in pesos.
Communication A6572 – 14/09/18 | The rules on “Credit Policy” are adapted to allow entities to grant guarantees to foreign residents on the fulfillment of obligations with their commercial operations of goods and/or services abroad, under certain conditions.
Communication A6573 – 14/09/18 | The rules on “Expansion of financial institutions” are adapted, leaving without effect the time limitation for the installation of mobile branches.
Communication A6575 – 28/09/18 | Effective as of 10/1/18, the minimum cash requirement rates for demand and term deposits of up to 59 days of residual term in pesos are increased by 3% for entities with a participation of at least 1% in the total deposits of the non-financial private sector of the system. This increase may be integrated with LELIQ and/or NOBAC. It is admitted that the requirement corresponding to the increase in the balances of time deposits of the non-financial private sector in pesos and UVA/UVI, with respect to those of 9/30/18, can be integrated with LELIQ and/or NOBAC. The minimum daily integration is reduced to 25% of the total minimum cash requirement. It is admitted that entities may subscribe to BCRA Clearing Notes with a 30-day term, which will accrue 1/5 of the reference rate determined by the BCRA, with holdings of banknotes considered to be of “good use”, but which are not subject to the “Interbank Clearing of Banknotes” (CIB), without the total amount to be subscribed by this mechanism being able to exceed 1.5 times the limit of the CIB. The rules on “Time deposits and investments” are adapted to establish that institutions provide the depositor with the option of receiving the remuneration of fixed-term deposits on a periodic basis (not less than 30 days).
References
1 For a more detailed assessment of the possible risks, vulnerability factors, and degree of resilience of the financial system in the face of possible adverse scenarios, see the Financial Stability Report for the Second Half of 2018.
2 Reference is made to those measures adopted since the date of publication of the previous Report on Banks
4 Second-degree commercial banks are those that can only receive deposits from the country’s financial sector and from foreign banks. Communication A6589.
6 Throughout the Report, the series are deflated using a consumer price index (CPI). As of 2017, the CPI of national coverage prepared by INDEC is taken into account (in September 2018 it presented a monthly variation of 6.5% and 40.5% year-on-year). Until December 2016, the index calculated from the CPIs of the City of Buenos Aires, San Luis and Córdoba weighted according to the National Household Expenditure Survey corresponding to the period 2004-2005 is being worked on.
7 For a more detailed approach, see Chapter 2 of the Financial Stability Report for the Second Half of 2018
8 Differences in balance sheet balances are used to calculate cash flow.
9 Idem, previous note.
10 In this report, foreign currency (EM) mismatch is defined as EM assets minus EM liabilities plus net forward purchases of EM without delivery of underlying (off-balance sheet items). This indicator is used for analytical purposes and not in regulatory terms.
11 For a more detailed analysis, see Chapter 3 of the Financial Stability Report for the Second Half of 2018.
12 For a more detailed analysis, see Chapter 4 of the Financial Stability Report for the Second Half of 2018
13 Private sector deposits in pesos increased 5.6% in nominal terms in October. For their part, private sector deposits in foreign currency began to stabilize towards the second half of September, and in October they increased slightly in source currency.
14 For a better understanding of the regulatory changes that occurred during the month of September, see the Regulatory Section of this report and for a follow-up of the regulatory changes of the last 5 months, see the Regulatory Annex of the Financial Stability Report for the Second Half of 2018.
15 For more details, see Chapter 3 of the Financial Stability Report for the Second Half of 2018.
16 In line with the recommendations of the Basel Committee.
17 For more details see Communication A6575.
18 Variation in currency of origin.
19 Variation in currency of origin.
20 Information extracted from the Central Debtors (includes both national and foreign currency). Loans to residents abroad are not included. Business financing is defined here as that granted to legal entities and commercial financing granted to individuals. On the other hand, loans to families are considered to be those granted to individuals, unless they are for commercial purposes.
21 It should be considered that the information in the Central Debtors cannot be discriminated by currency. Much of the year-on-year increase in corporate lending could be explained by the re-expression of foreign currency balances at the new exchange rate.
22 The value of the UVA is that corresponding to the last business day of October.
23 Includes capital and adjustment of capital for the evolution of the CER.
24 It includes transactions at a fixed and repacable interest rate.
25 For more details, see Chapter 3 of the Financial Stability Report for the Second Half of 2018.
26 For more details, see Chapter 3 of the Financial Stability Report for the Second Half of 2018.
27 Considering Basel III’s regulatory capital margins as minimum requirements (although they do not constitute a regulatory minimum, but their non-compliance imposes restrictions on the distribution of dividends), the financial system would present an excess of core Tier 1 capital integration. For more details, see Chapter 2 of the Financial Stability Report for the Second Half of 2018.
Glossary
%a.: annualized percentage.
% YoY: Year-on-year percentage.
Liquid assets: availabilities (integration of “minimum cash” in current accounts at the BCRA and in special guarantee accounts and other concepts, mainly cash in banks and correspondent offices) plus the net credit balance for transfer operations of financial institutions against the BCRA using LEBAC and NOBAC.
Consolidated assets and liabilities: those arising from deducting transactions between entities in the system.
Net Assets (NA): Assets and liabilities are net of accounting duplications for pass-through, forward and spot transactions to be settled.
APR: Total Risk Weighted Assets.
BCBS: Basel Committee on Banking Supervision (BCBS).
Irregular portfolio: portfolio in situation 3 to 6, in accordance with the “Classification of Debtors” regime.
Credit to the public sector: Position in public securities (without LEBAC or NOBAC) + Loans to the public sector + Compensation to be received + Debt securities and Certificates of participation in financial trusts (with underlying public securities) + Miscellaneous credits to the public sector.
Credit to the private sector: loans to the non-financial private sector including accrued interest and CER and CVS adjustment and leasing.
Contribution differences: Results from the monthly update of assets and liabilities in foreign currency. The item also includes the results originated by the purchase and sale of foreign currency, which arise as a difference between the agreed price (net of the direct expenses originated by the operation) and the book value.
Miscellaneous: miscellaneous gains (including, but not limited to, gains on permanent interests, recovered loans and unaffected provisions) minus miscellaneous losses (including, but not limited to, losses on permanent interests, loss on the sale or impairment of goods in use and amortization of business keys).
Equity exposure to counterparty risk: irregular portfolio net of provisions in terms of equity.
Administration expenses: includes remunerations, social charges, services and fees, taxes and amortizations.
IEF II-17: BCRA Financial Stability Report.
IPCBA: Consumer Price Index of the City of Buenos Aires.
CSF: Liquidity Coverage Ratio (LCR).
LEBAC and NOBAC: bills and notes issued by the BCRA.
LELIQ: BCRA liquidity bills.
LR: Leverage Ratio (LR).
Financial margin: Income minus financial expenses. It includes interest and securities earnings, CER and CVS adjustments, exchange rate differences and other financial results.
Mill.: Million or million, as appropriate.
IFRS: International Financial Reporting Standards.
ON: Negotiable Obligations.
ORI: Other comprehensive results.
OS: Subordinated Obligations.
Other financial results: rental income from financial leases, contribution to the deposit guarantee fund, interest on availabilities, charges for loan depreciation, premiums for the sale of foreign currency and other unidentified items.
PN: Net Worth.
p.p.: percentage points.
SME: Small and Medium Enterprises.
Consolidated profit: Results from permanent holdings in local financial institutions are eliminated. Available since January 2008.
Income from securities: includes results from public securities, temporary shares, negotiable obligations, subordinated obligations, options and other credits for financial intermediation. In the case of public securities, it includes the results accrued in terms of income, differences in share price, exponential increase based on the internal rate of return (IRR) and sales, in addition to the charge for forecasts for the risk of impairment.
Interest income: interest charged minus interest paid for financial intermediation, following the accrual criterion (balance sheet information) and not what is received. It includes interest on loans and deposits of government securities and premiums for passes.
Result for services: commissions charged minus commissions paid. It includes fees related to obligations, credits, securities, guarantees granted, the rental of safe deposit boxes and foreign and exchange operations, excluding in the latter case the results from the purchase and sale of foreign currency, the latter being accounted for in the “Differences in quotation” account. Expenses include commissions paid, contributions to the ISSB, other contributions for income from services and charges accrued from the gross income tax.
ROA: Final result as a percentage of net assets. In the case of referring to accumulated results, the average of the NA for the reference months is considered in the denominator.
SWEE: Final result as a percentage of equity. In the case of referring to accumulated results, the average net worth for the reference months is considered in the denominator.
RPC: Computable Patrimonial Liability. For more details, see Ordered Text “Minimum Capitals of Financial Institutions”.
TNA: Annual nominal rate.
US$: US dollars.
UVA: Unit of Purchasing Value.
ICU: Housing Units.
Share on


