Executive summary
• In line with the economic program of the new national administration presented by the Ministry of Economy, in mid-December the BCRA defined the new monetary and exchange policy framework and at the end of the year published the objectives and plans regarding the development of monetary, exchange, financial and credit policies for the year 2024.
• The cornerstone of the economic program is to eliminate the fiscal deficit and its financing with monetary issuance. Other central elements are the elimination of regulations, restrictions and bureaucratic obstacles, and the correction of relative prices, especially the exchange rate. The recovery of the level of international reserves is also sought from the normalization of foreign trade flows. In December, the BCRA began to move towards the consolidation of monetary policy tools to guide them to achieve monetary stability and reduce inflation. It was established that the monetary policy rate will be that of the passive passes for the BCRA, setting it at a level of 100% (TNA). At the same time, LELIQ tenders were no longer held, and pass operations became the main instrument for absorbing monetary surpluses. Stopping the issuance of LELIQ is an important step for institutions to have incentives to act as financial intermediaries that take deposits to provide credit.
• In December, the balance of financing in pesos to the private sector decreased in real terms, with generalized reductions among groups of financial institutions and credit assistance. In a year-on-year comparison, the balance of credit in pesos to the private sector contracted 23.7% in real terms.
• The non-performing loan ratio to the private sector closed 2023 at 3.7%, increasing 0.5 p.p. y.o.y. The NPL indicator for loans to companies reached 4.4% in December, while the NPL ratio for loans to households stood at 2.8% of the portfolio.
• Between the end of the month, the balance of deposits in pesos in the private sector increased in real terms, mainly due to the seasonality of demand accounts. However, in year-on-year terms, the balance of private sector deposits in pesos accumulated a reduction of 22.8% at constant prices.
• By the end of 2023, liquidity indicators continued to be high for the aggregate financial system. Broad liquid assets of the institutions as a whole amounted to 88.6% of deposits in December, increasing in the month and in a year-on-year comparison.
• The solvency ratios of the financial system also remained at high levels at the end of the year. Financial institutions integrated capital equivalent to 32.4% of risk-weighted assets (RWA) in December, higher than the figure for the previous month and December 2022. In the period, the capital position (integration of capital minus minimum regulatory requirements) of the financial system totaled 302.7% of the requirement in December and 60.2% of the balance of credit to the private sector net of forecasts.
• The financial system closed 2023 with total comprehensive results in homogeneous currency equivalent to 5.4% of assets (ROA) and 27.6% of equity (ROE). These levels were higher than those recorded in the previous 3 years.
• In 2023, retail electronic payments grew driven by technological advances, greater demand, and the actions implemented by the BCRA. During the year, the growth in immediate transfers stood out, with an increase of 36.5% in the volume operated in real terms and 118% in the number of operations.
I. Financial intermediation activity
In December and throughout 2023, the financial intermediation of all entities with the private sector was reduced. On the side of the origins of funds for the financial system – considered in real terms – between the beginning of December the balance of credit in pesos to the private sector fell and the balance of deposits in pesos in this sector increased. 1 On the side of the applications of resources in pesos —in real terms—, in the month the financing to the public sector and the balance of liquid assets in the broad sense increased (mainly due to greater passes with the BCRA) and the deposits of the public sector decreased. 2
In December, the real balance of financing in pesos to the private sector fell 16.8% compared to the previous month (+4.5% nominal). The fall in the period was reflected in all groups of financial institutions and credit assistance. 3 In the context of an increase in the inflation rate, the balance of financing in pesos to the private sector accumulated a year-on-year decrease of 23.7% in real terms (see Chart 1). 4
Graph 1 | Credit balance to the private sector in pesos
In real terms*
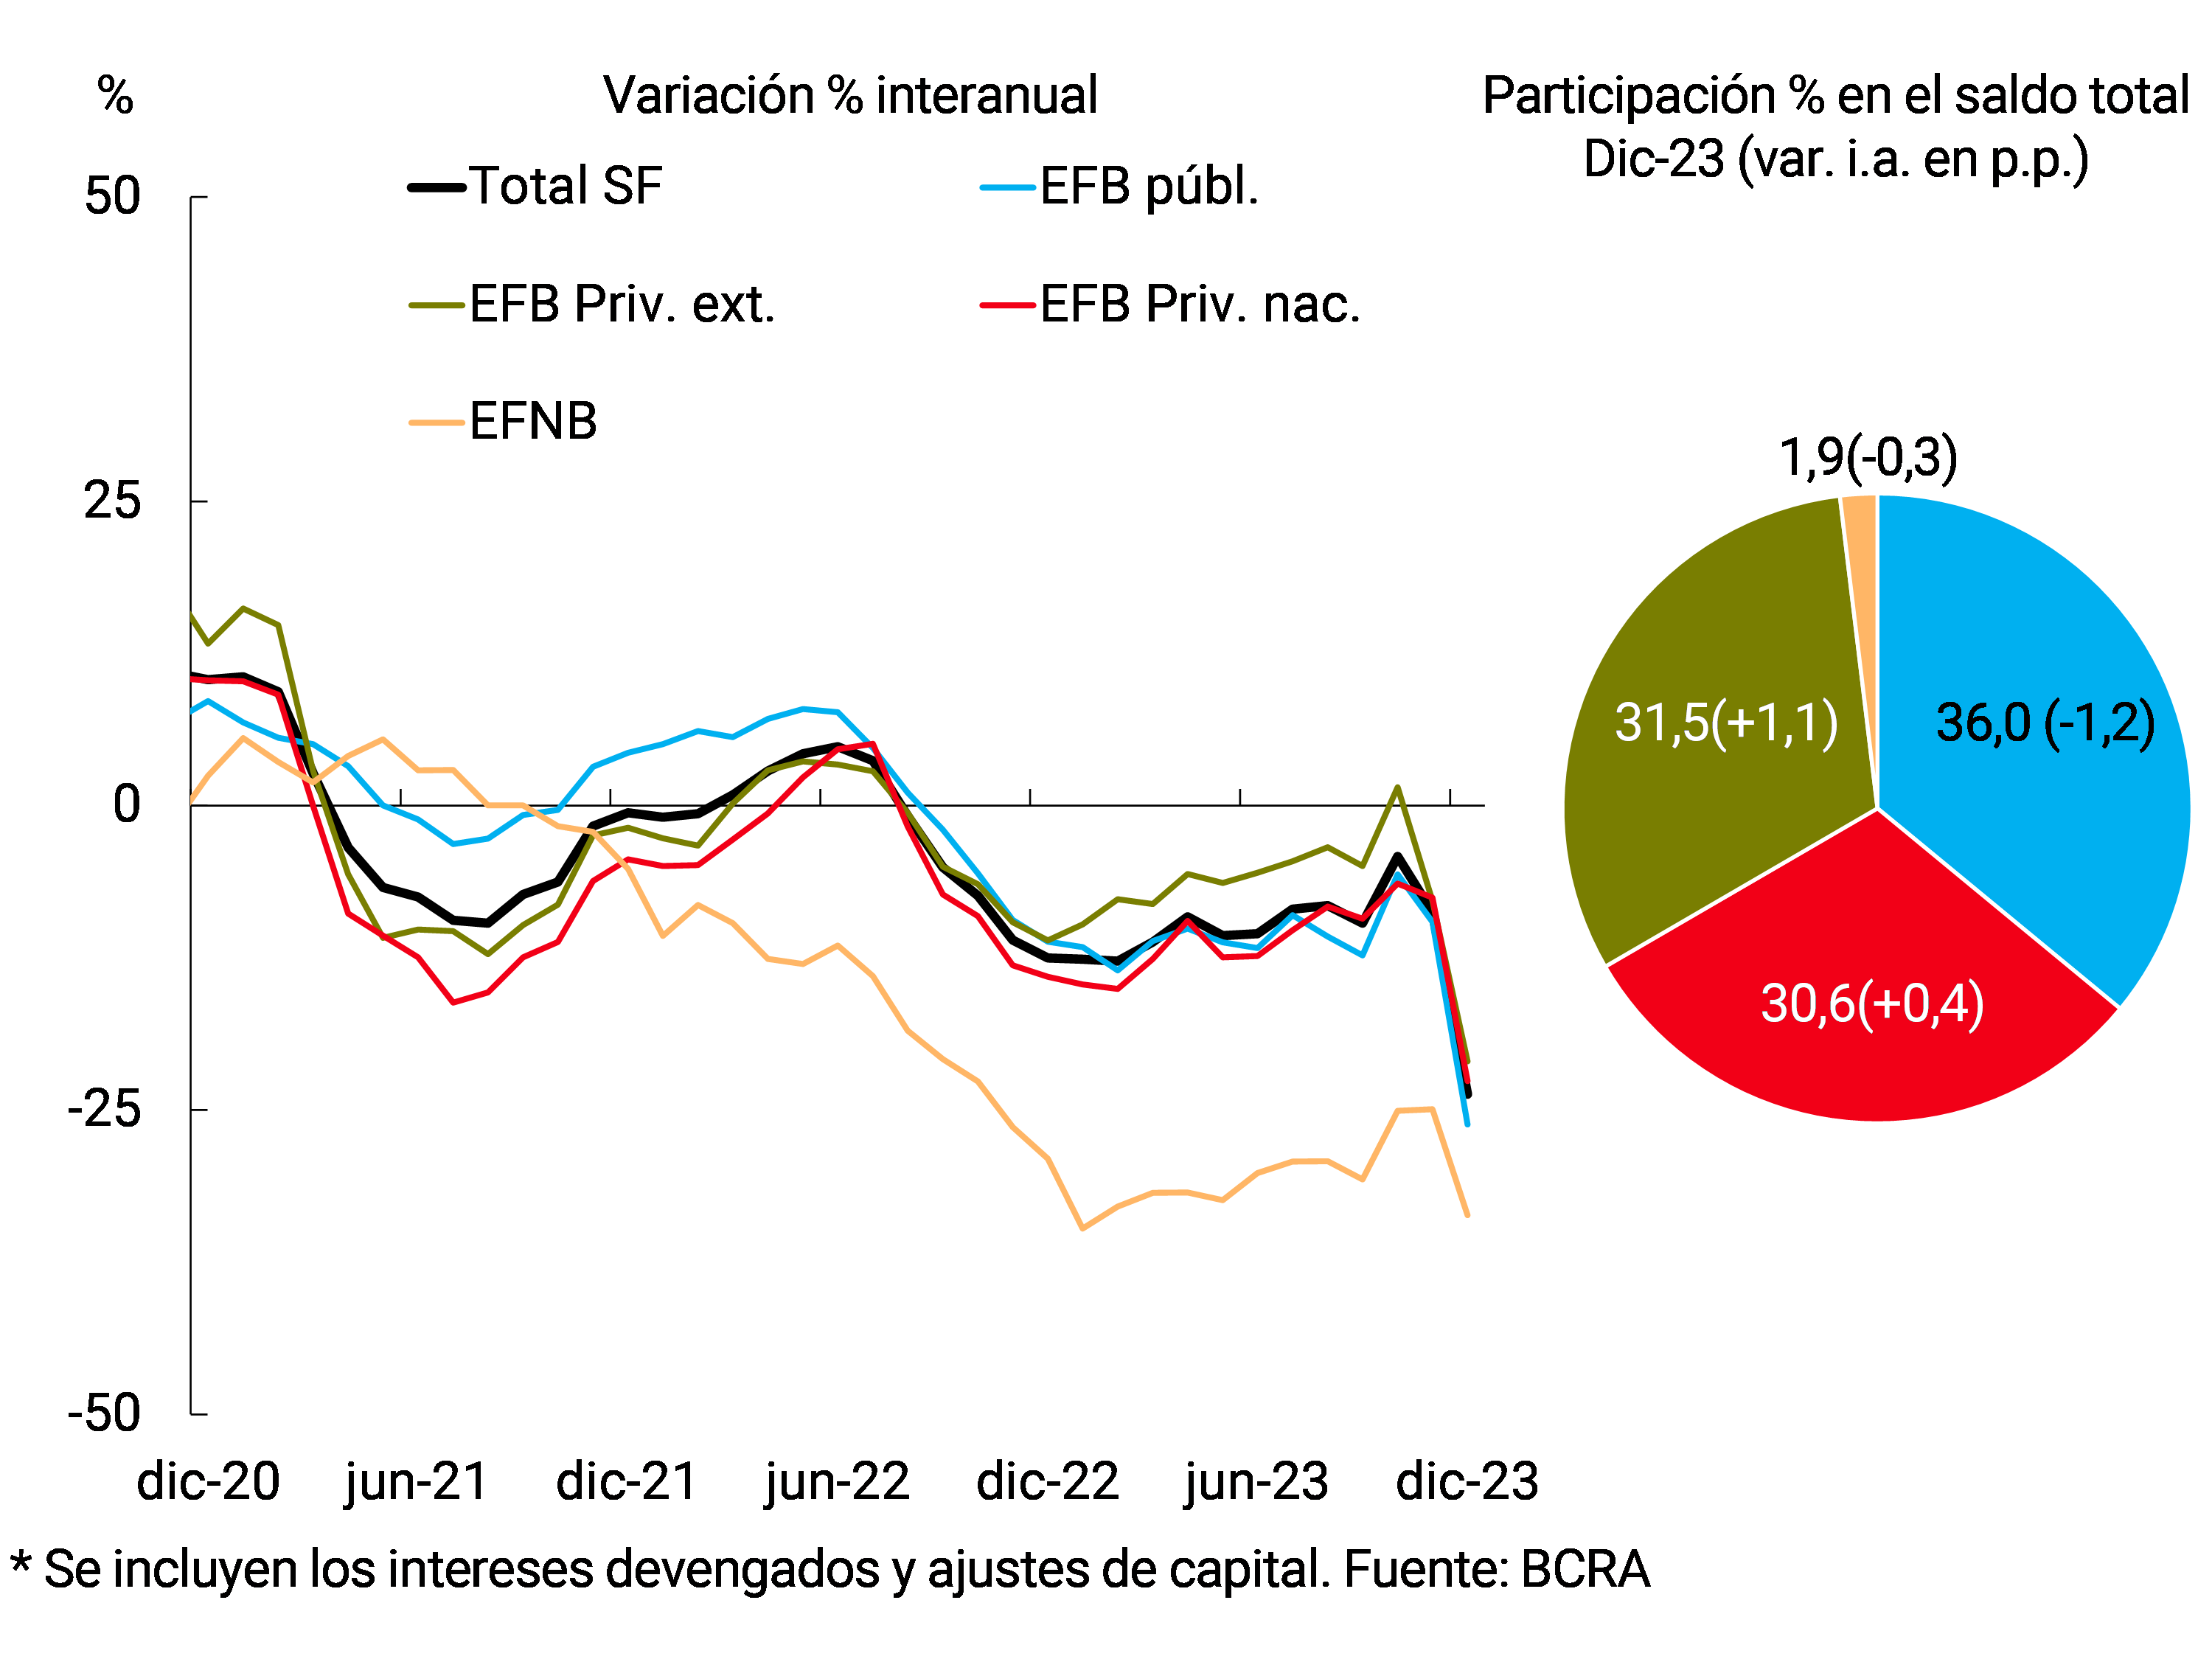
The balance of financing to the private sector in foreign currency fell by 7.1% in the last month of 2023, accumulating a decrease of 6.9% y.a.5 Thus, the real balance of total loans (in domestic and foreign currency) to the private sector accumulated a fall of 10.7% in the month (+12% nominal) and 18.8% in a year-on-year comparison.
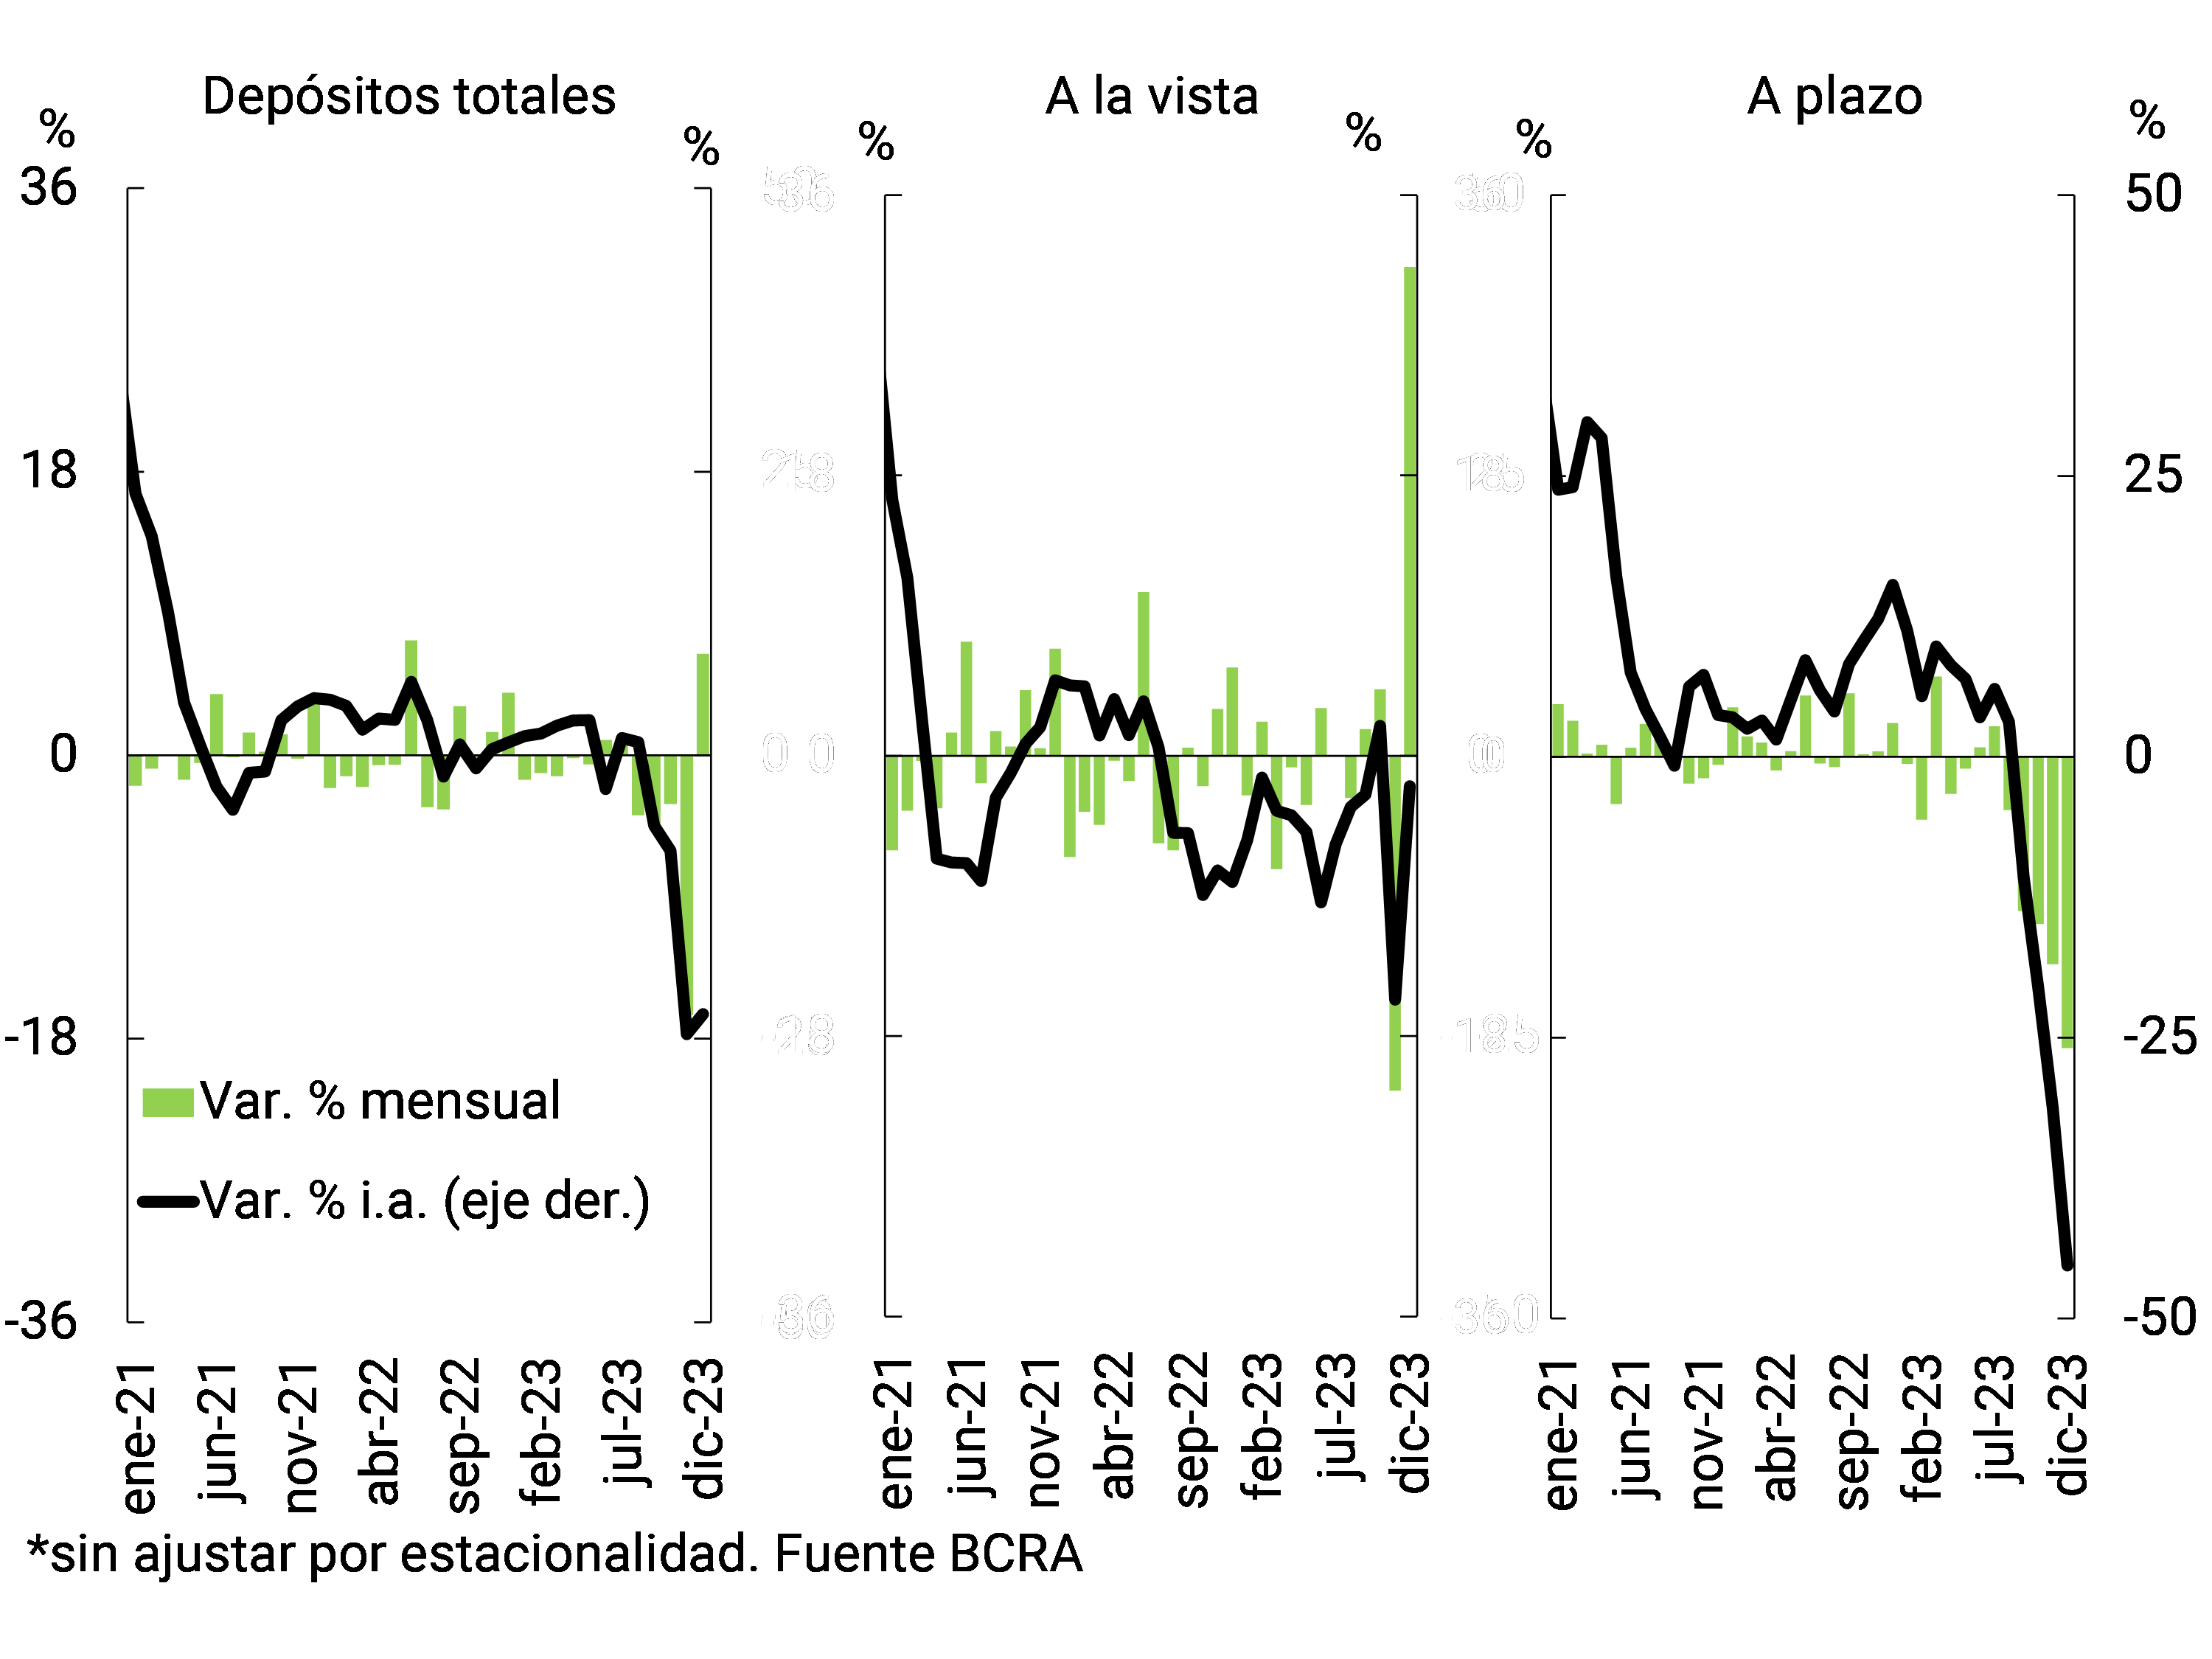
The balance of deposits in pesos in the private sector increased 6.4% in real terms between the peaks of December (+33.6% nominal, see Graph 2). The monthly increase was explained by the performance of demand accounts (+31.4% real or 64.9% nominal), reflecting the seasonal effect of the collection of the half bonus. For its part, the real balance of time deposits in pesos of the private sector fell in the month (-18.7% real or 2.1% nominal). Within this last segment, in December the balance of fixed-term deposits in UVA increased by 67.9% in real terms (110.7% nominal). 6 On the other hand, traditional fixed-term deposits (without an adjustment clause) in pesos fell 21.9% in real terms in the period (2% nominal). In this scenario, the real balance of total private sector deposits in pesos accumulated a fall of 22.8% in a year-on-year comparison.
Graph 2 | Balance of private sector deposits in pesos
In real terms* – Sistema financiero
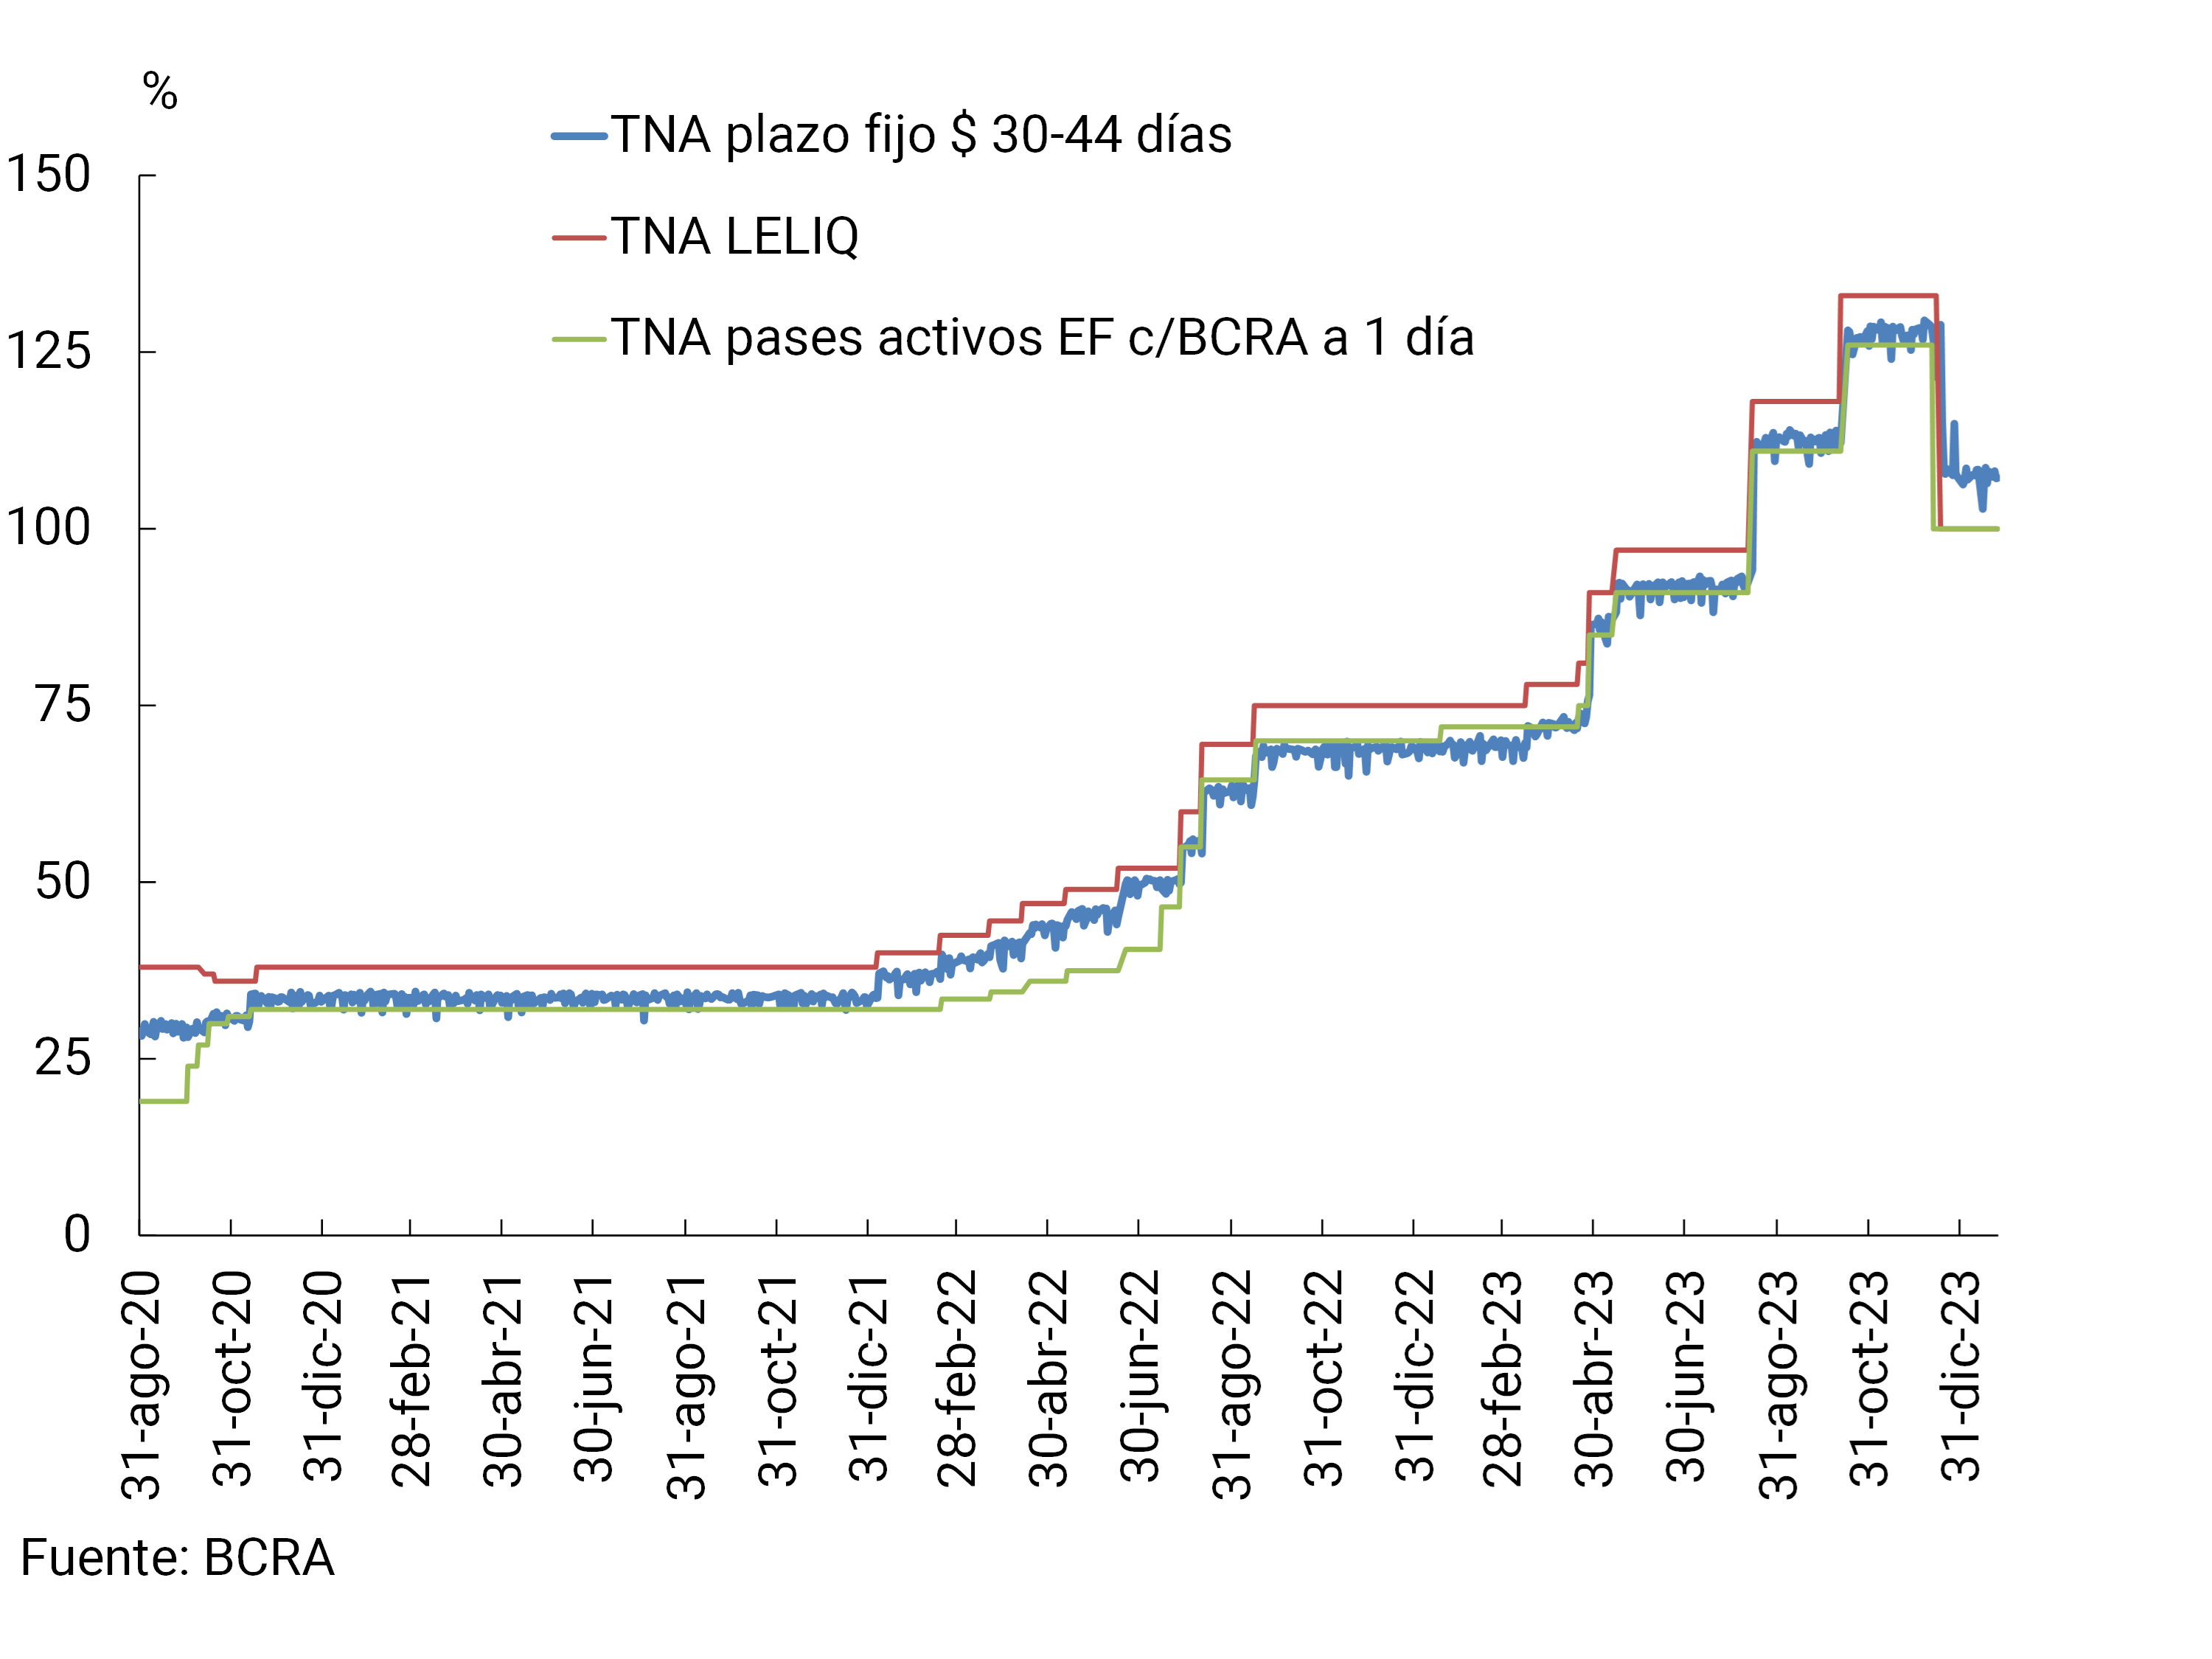
In accordance with the new monetary and exchange policy framework released on December 12, 2023, all tools will be aimed at achieving monetary stability and reducing inflation levels. Since that date, the BCRA considered it appropriate to reduce the rate of passive passes to 100% (TNA) (see Graph 3). As of December 19, the BCRA also adopted several measures with the purpose of clarifying and simplifying the monetary policy rate signal. The monetary policy rate became that of the one-day passive passes for the BCRA. At the same time, it stopped carrying out LELIQ tenders, with passive pass operations becoming the main instrument for absorbing monetary surpluses. In this way, it contributes to the generation of incentives for institutions to increase financial intermediation, instead of placing the funds in remunerated liabilities of the BCRA. Also in December, the minimum interest rate for fixed-term deposits was set at 110% (TNA) and it was considered prudent for the banking system to continue offering fixed-term deposits adjustable by UVA, eliminating the minimum pre-cancellation rate for these. 7 Finally, at the end of December 2023, the BCRA extended the minimum term for pre-cancellable UVA deposits to 180 days and provided that entities must offer to collect these deposits for up to $5 million per customer, being able to accept them for higher amounts. 8
Graph 3 | Interest
rate developments In real terms* – Financial system
As for the foreign currency segment, the balance of private sector deposits increased 11.9% in the month,9 a characteristic movement that occurs at the end of the year influenced in part by the tax calendar. In this context, the real balance of total private sector deposits (in domestic and foreign currency) accumulated an increase of 20.4% compared to November (51.1% nominal). In a year-on-year comparison, the total balance of deposits (including all currencies and sectors) increased 14.4% in real terms.
II. Evolution and aggregate composition of the balance sheet
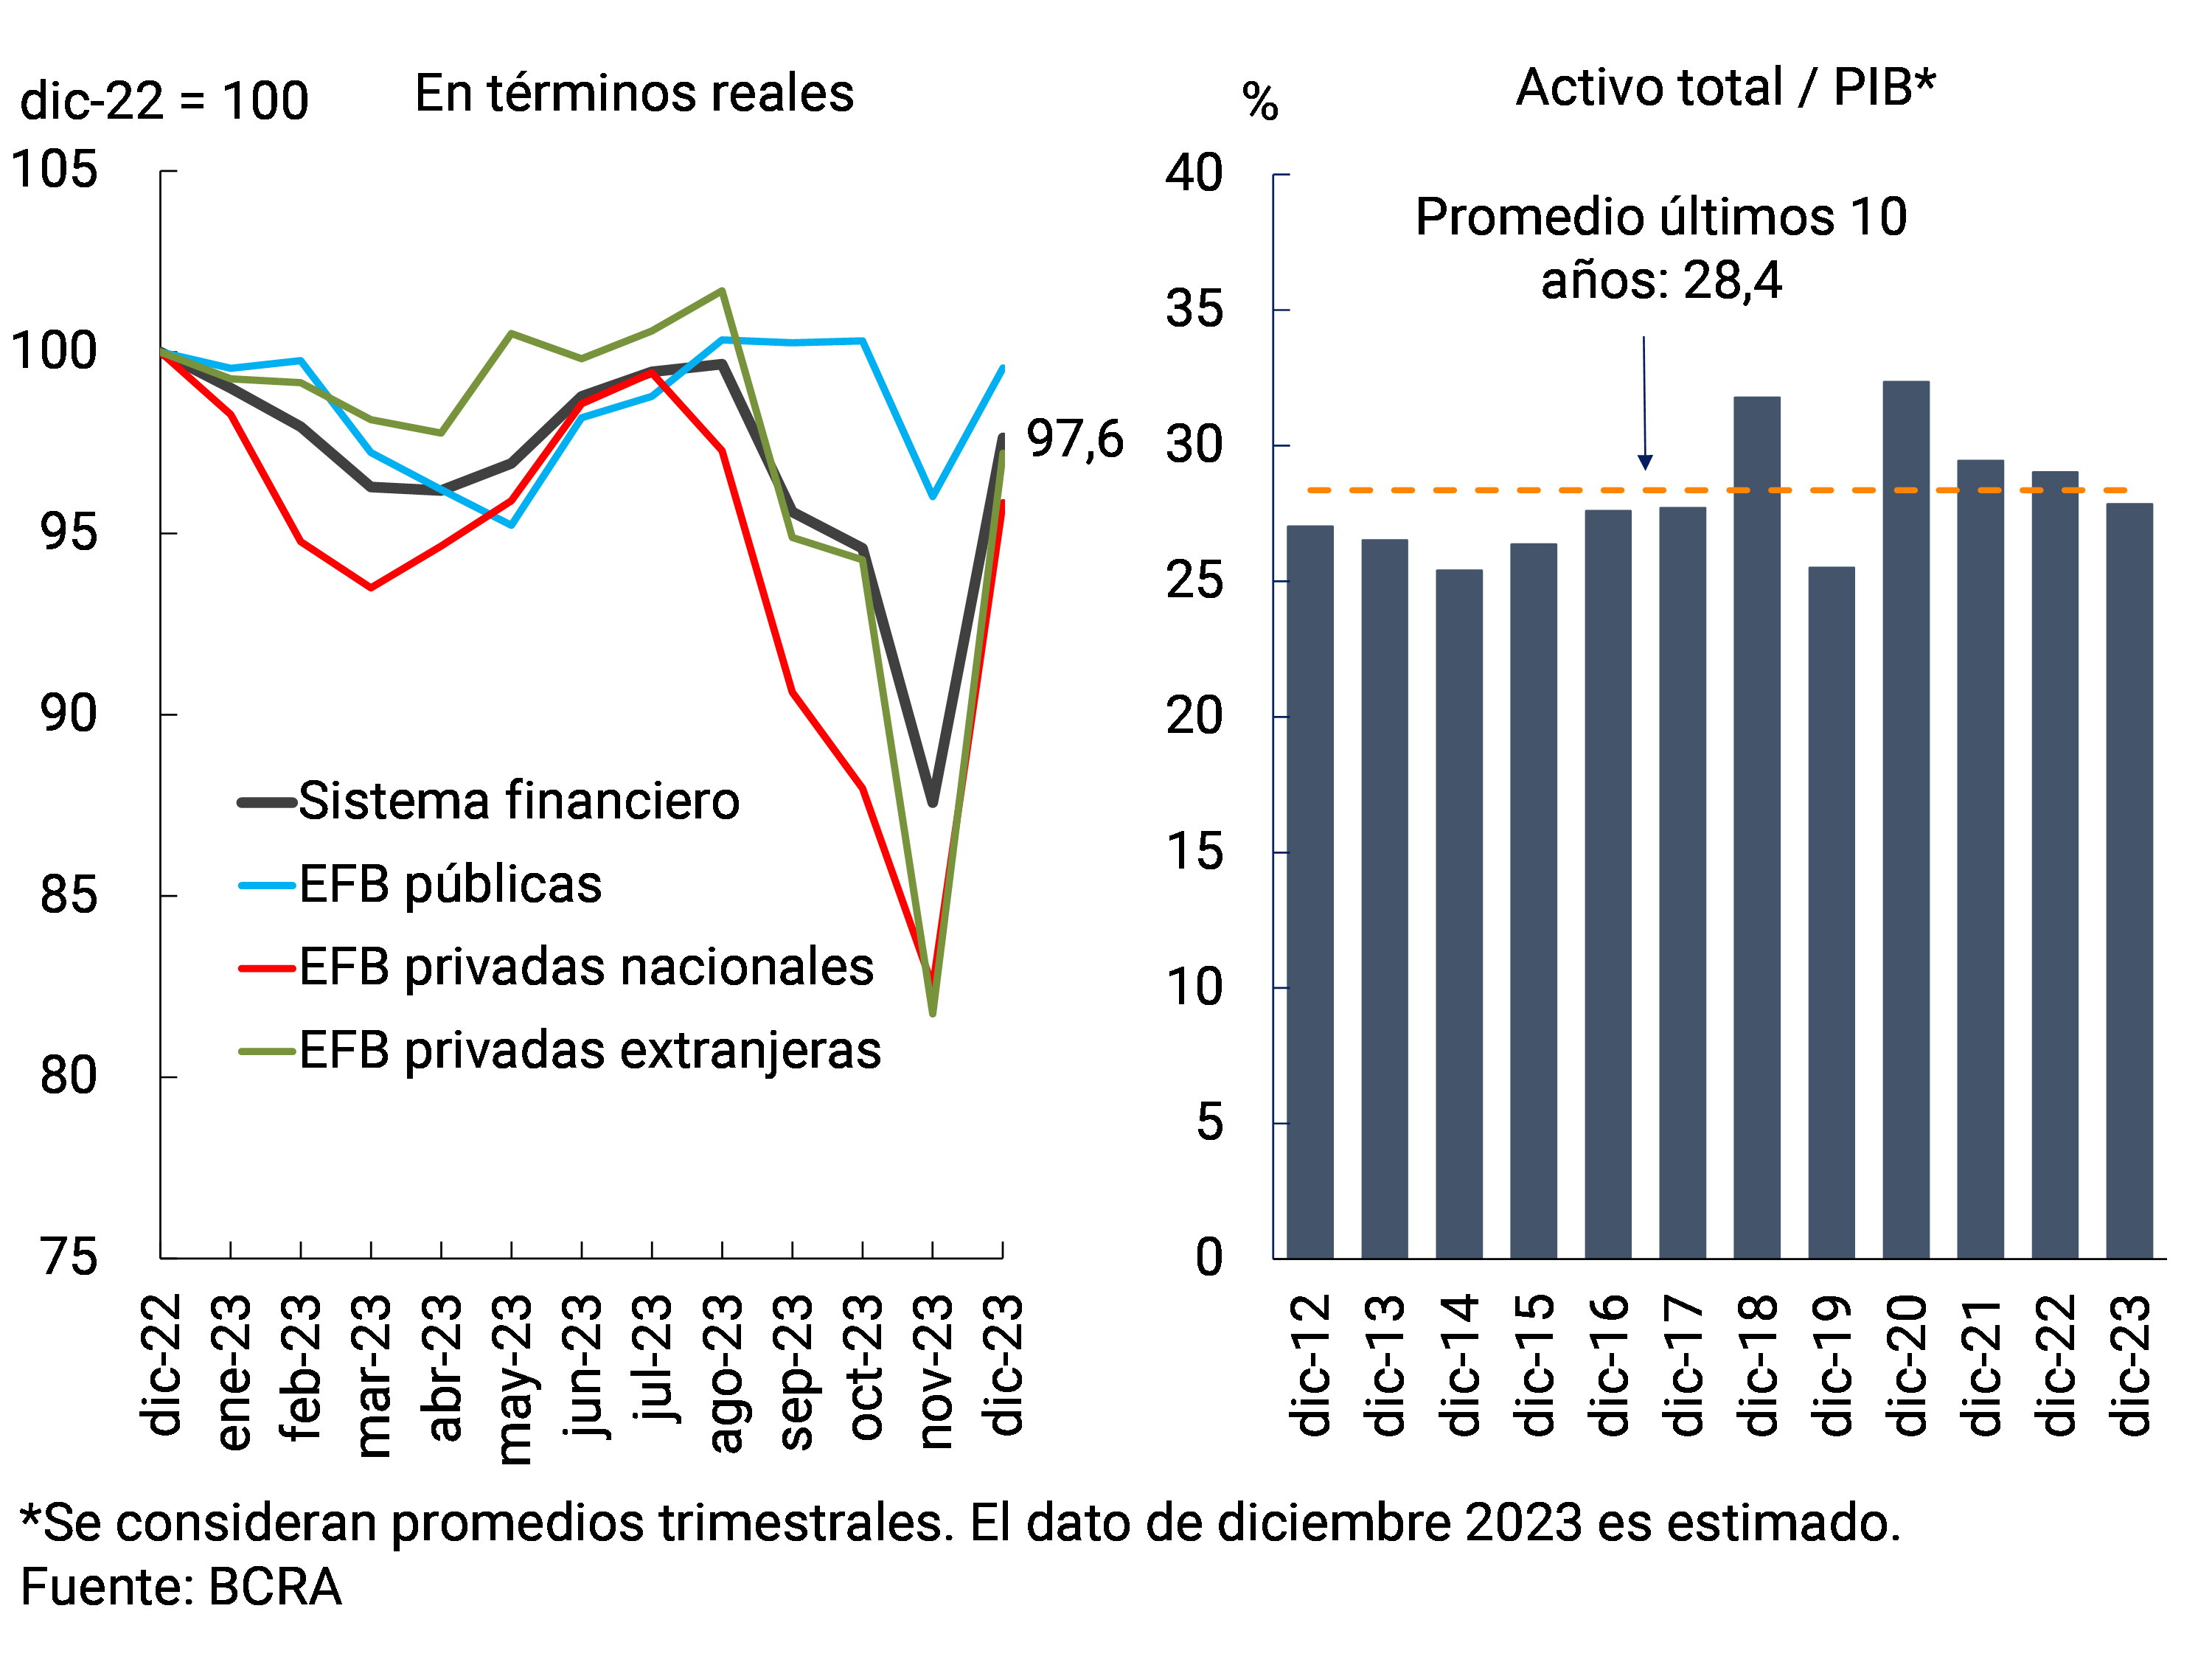
The total assets of the financial system grew 11.5% in real terms in December,10 driven mainly by private financial institutions (see Chart 4). However, throughout 2023 the sector’s total assets accumulated a slight reduction (-2.4% at constant prices). It is estimated that the assets of the aggregate of entities represented 27.8% of GDP at the end of 2023, slightly below the level observed a year ago (29%) and the average of the last 10 years (28.4%).
Figure 4 | Total assets of the financial
system In real terms* – Financial system
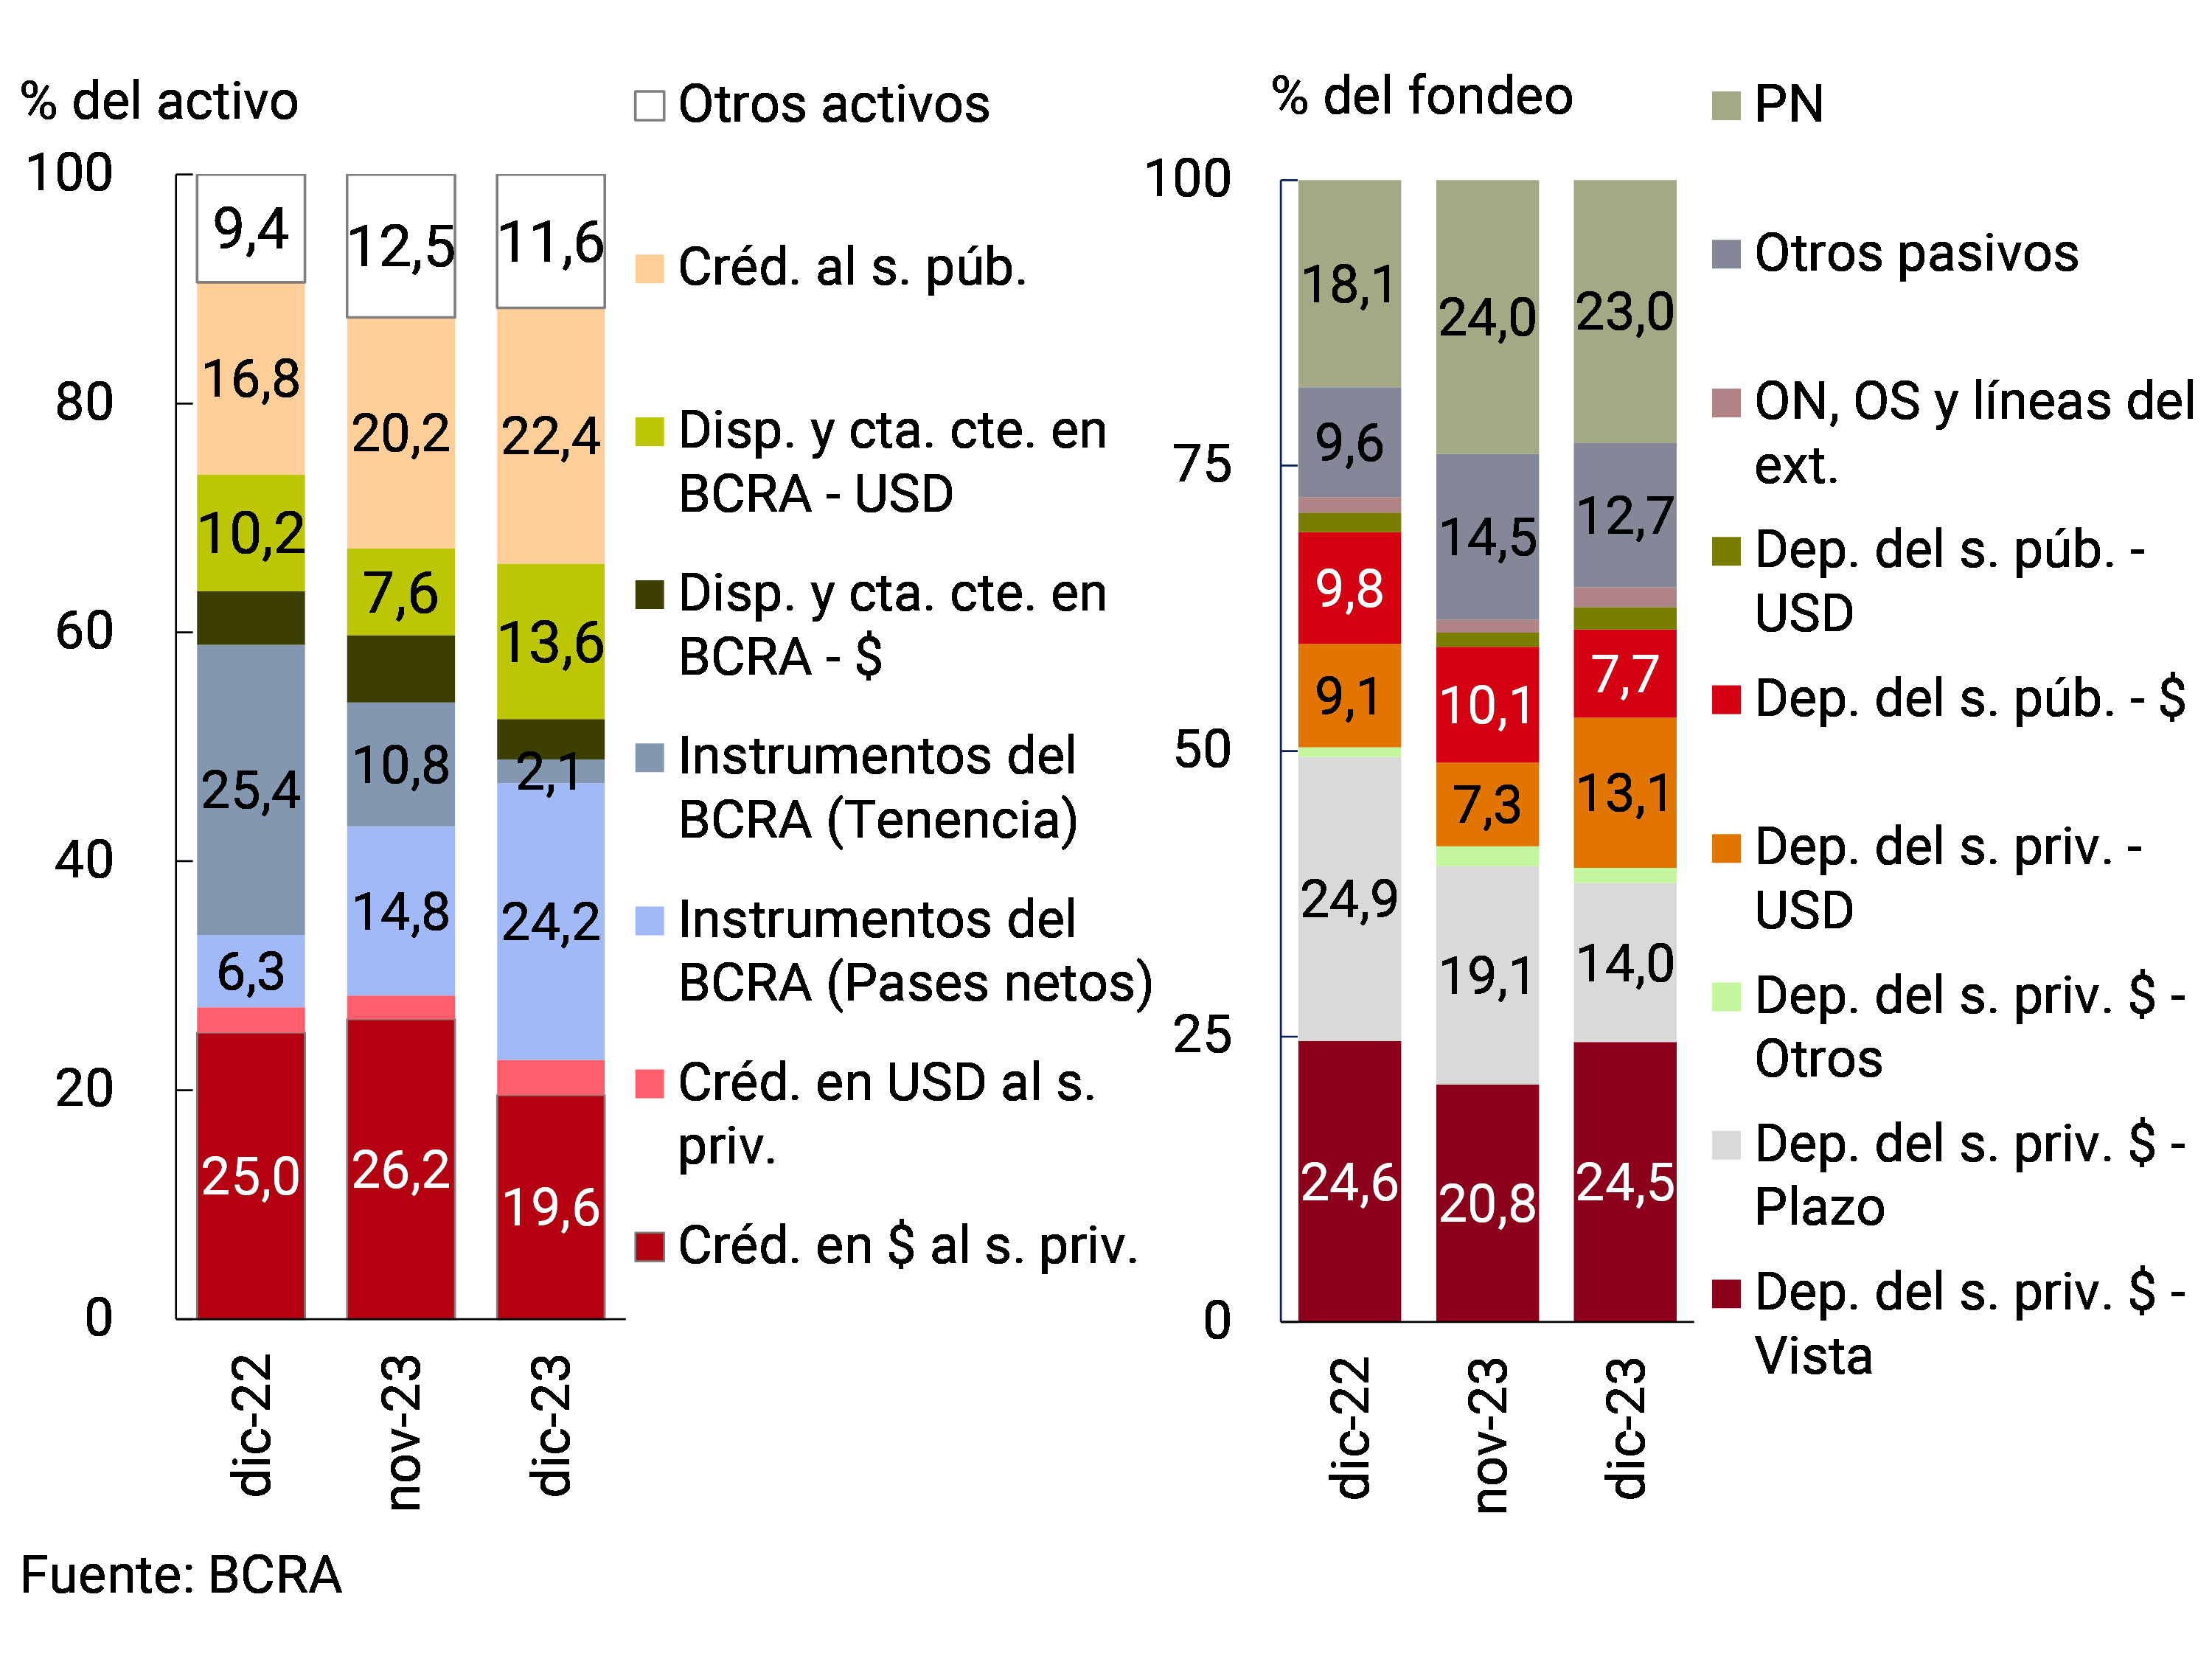
With respect to the composition of the sector’s total assets, in December there was an increase in the relative weight of net passes with the BCRA (in line with the objective of this Institution, which aims to make the passes the main instrument for absorbing monetary surpluses). To a lesser extent, the relevance of foreign currency availabilities and current accounts and financing to the public sector also increased. On the other hand, credit to the private sector in pesos and the holding of BCRA instruments reduced their share of the total during the period (see Chart 5). Considering the most relevant components of total funding, in the month deposits in foreign currency and demand accounts of the private sector in national currency increased their relative importance, while time placements in pesos of the private sector and deposits in the same denomination of the public sector reduced their weighting in total funding.
Graph 5 | Composition of assets and funding Financial
system – Participation %
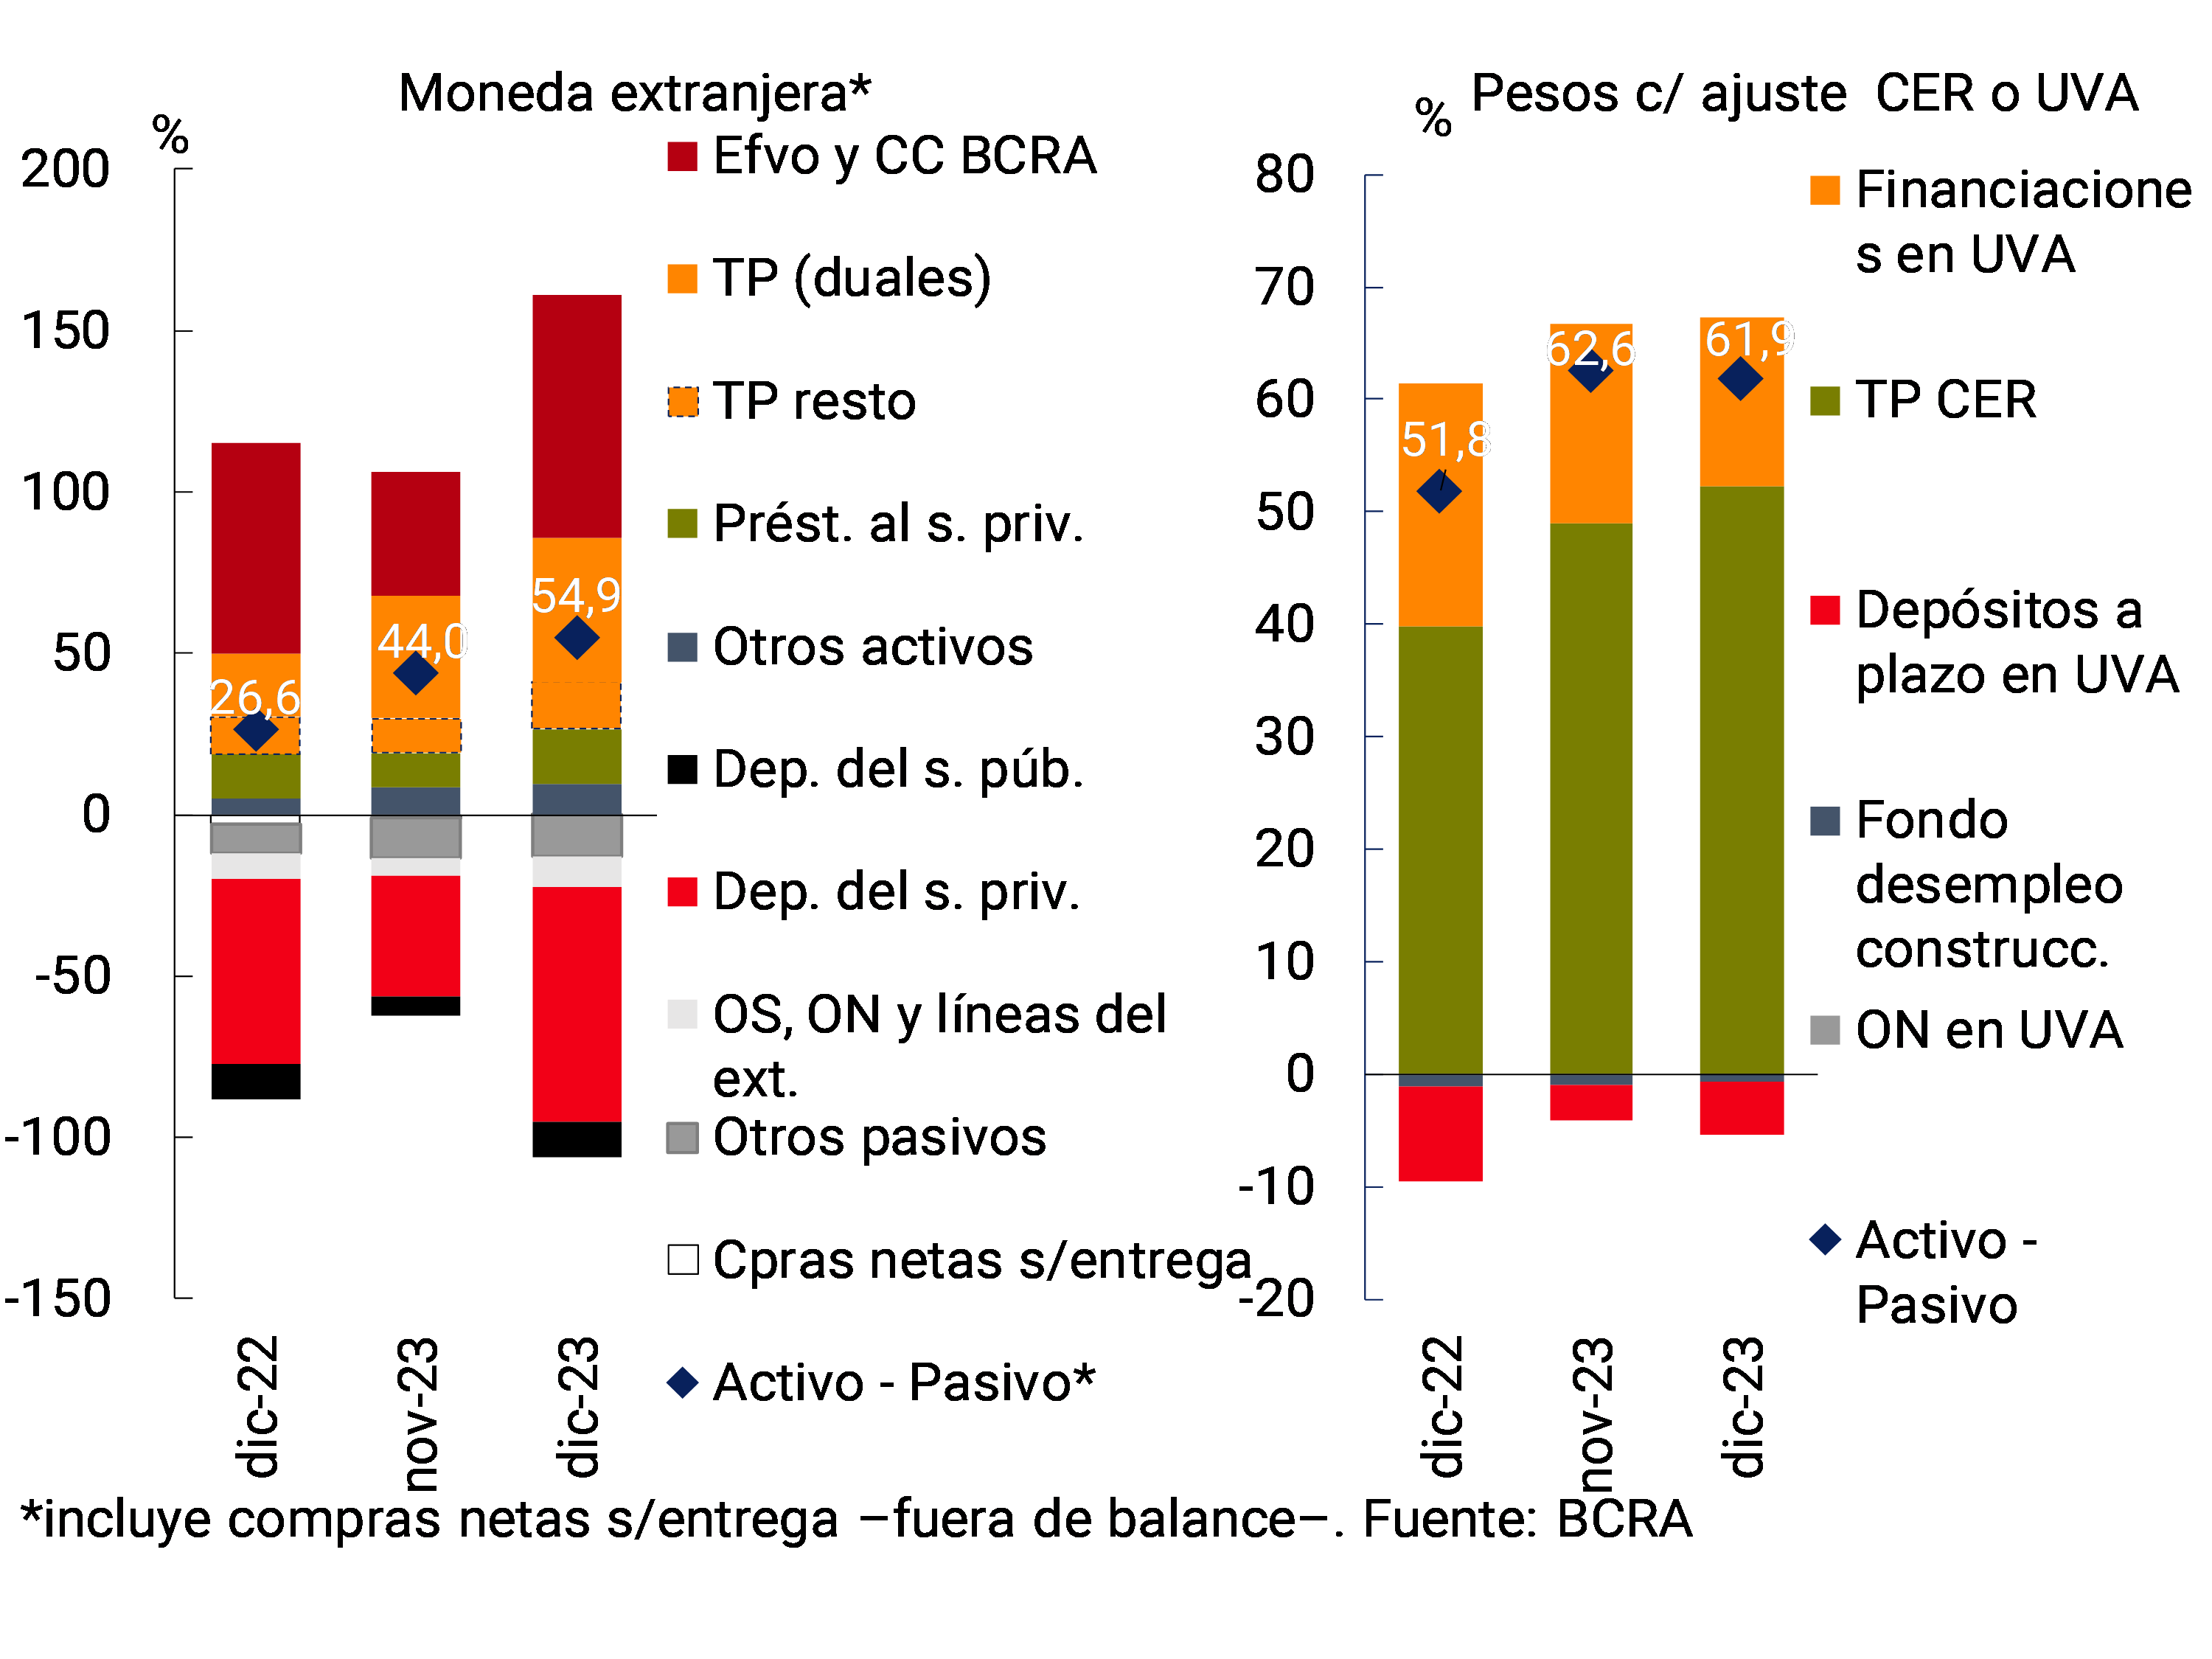
At the end of the year, the estimated spread between foreign currency assets and liabilities of the aggregate financial system stood at 54.9% of regulatory capital (RPC), 10.9 p.p.11 and 28.3 p.p. above the record for November and the end of 2022, respectively (see Chart 6). 12 For its part, in the month the estimated spread between assets and liabilities in pesos with capital adjustment by CER (or that are agreed in UVA) totaled 61.9% of the PRC at the aggregate level, slightly below the November record and 10 p.p. higher than the December 2022 record.
Graph 6 | Spreads between assets and liabilities by currency
Financial system – As % of PRC
III. Portfolio quality
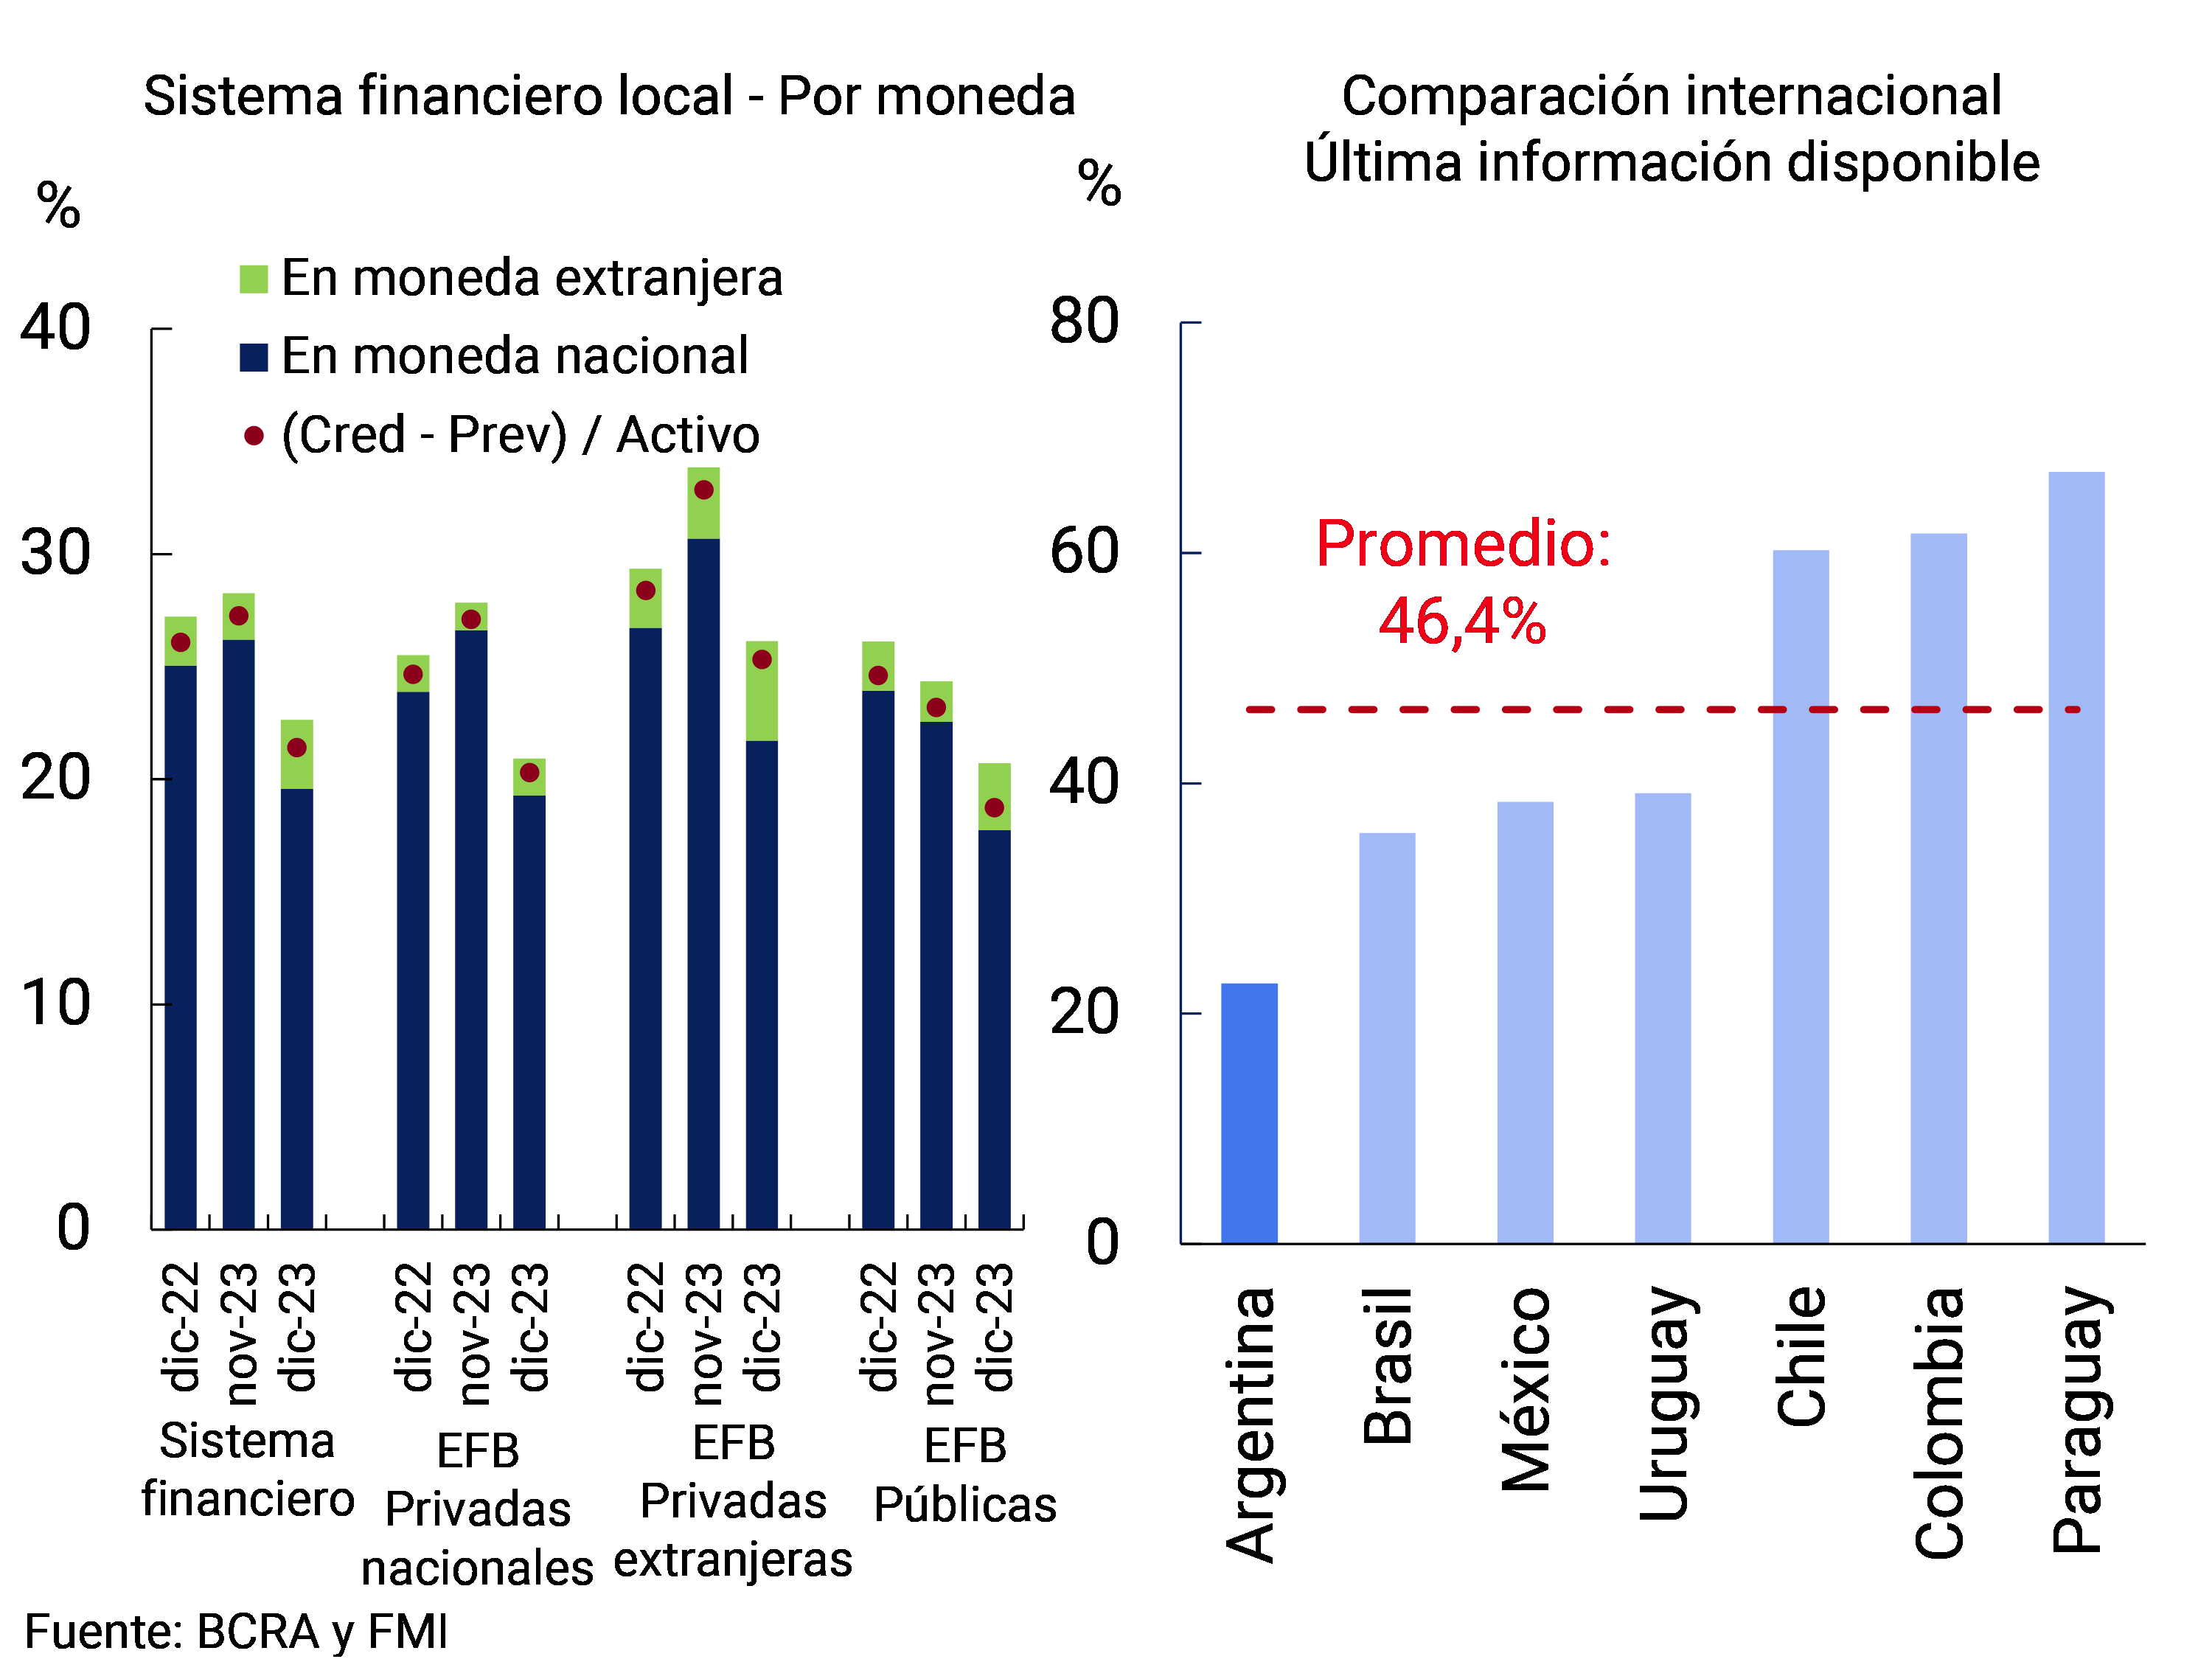
The gross exposure to the private sector of all financial institutions totaled 22.6% of total assets at the end of 2023, reducing 5.6 p.p. in the month and 4.6 p.p. compared to the record of a year ago. This indicator is lower than the average of the last 10 years (39.2%) and the levels observed in other countries in the region (see Graph 7). The monthly performance was reflected in all groups of financial institutions, reflecting the effect of a fall in the real balance of credit to the private sector (see Section I) and an increase in the assets of the financial system in real terms (see Section II). Within the segment in pesos, in December this quotient stood at 19.6% (-6.6 p.p. monthly and -5.5 p.p. y.a.) for the aggregate of the financial system. When deducting the balance of forecasts, total financing to the private sector represented 21.4% of assets at the systemic level.
Graph 7: Credit balance to the private sector in terms of assets
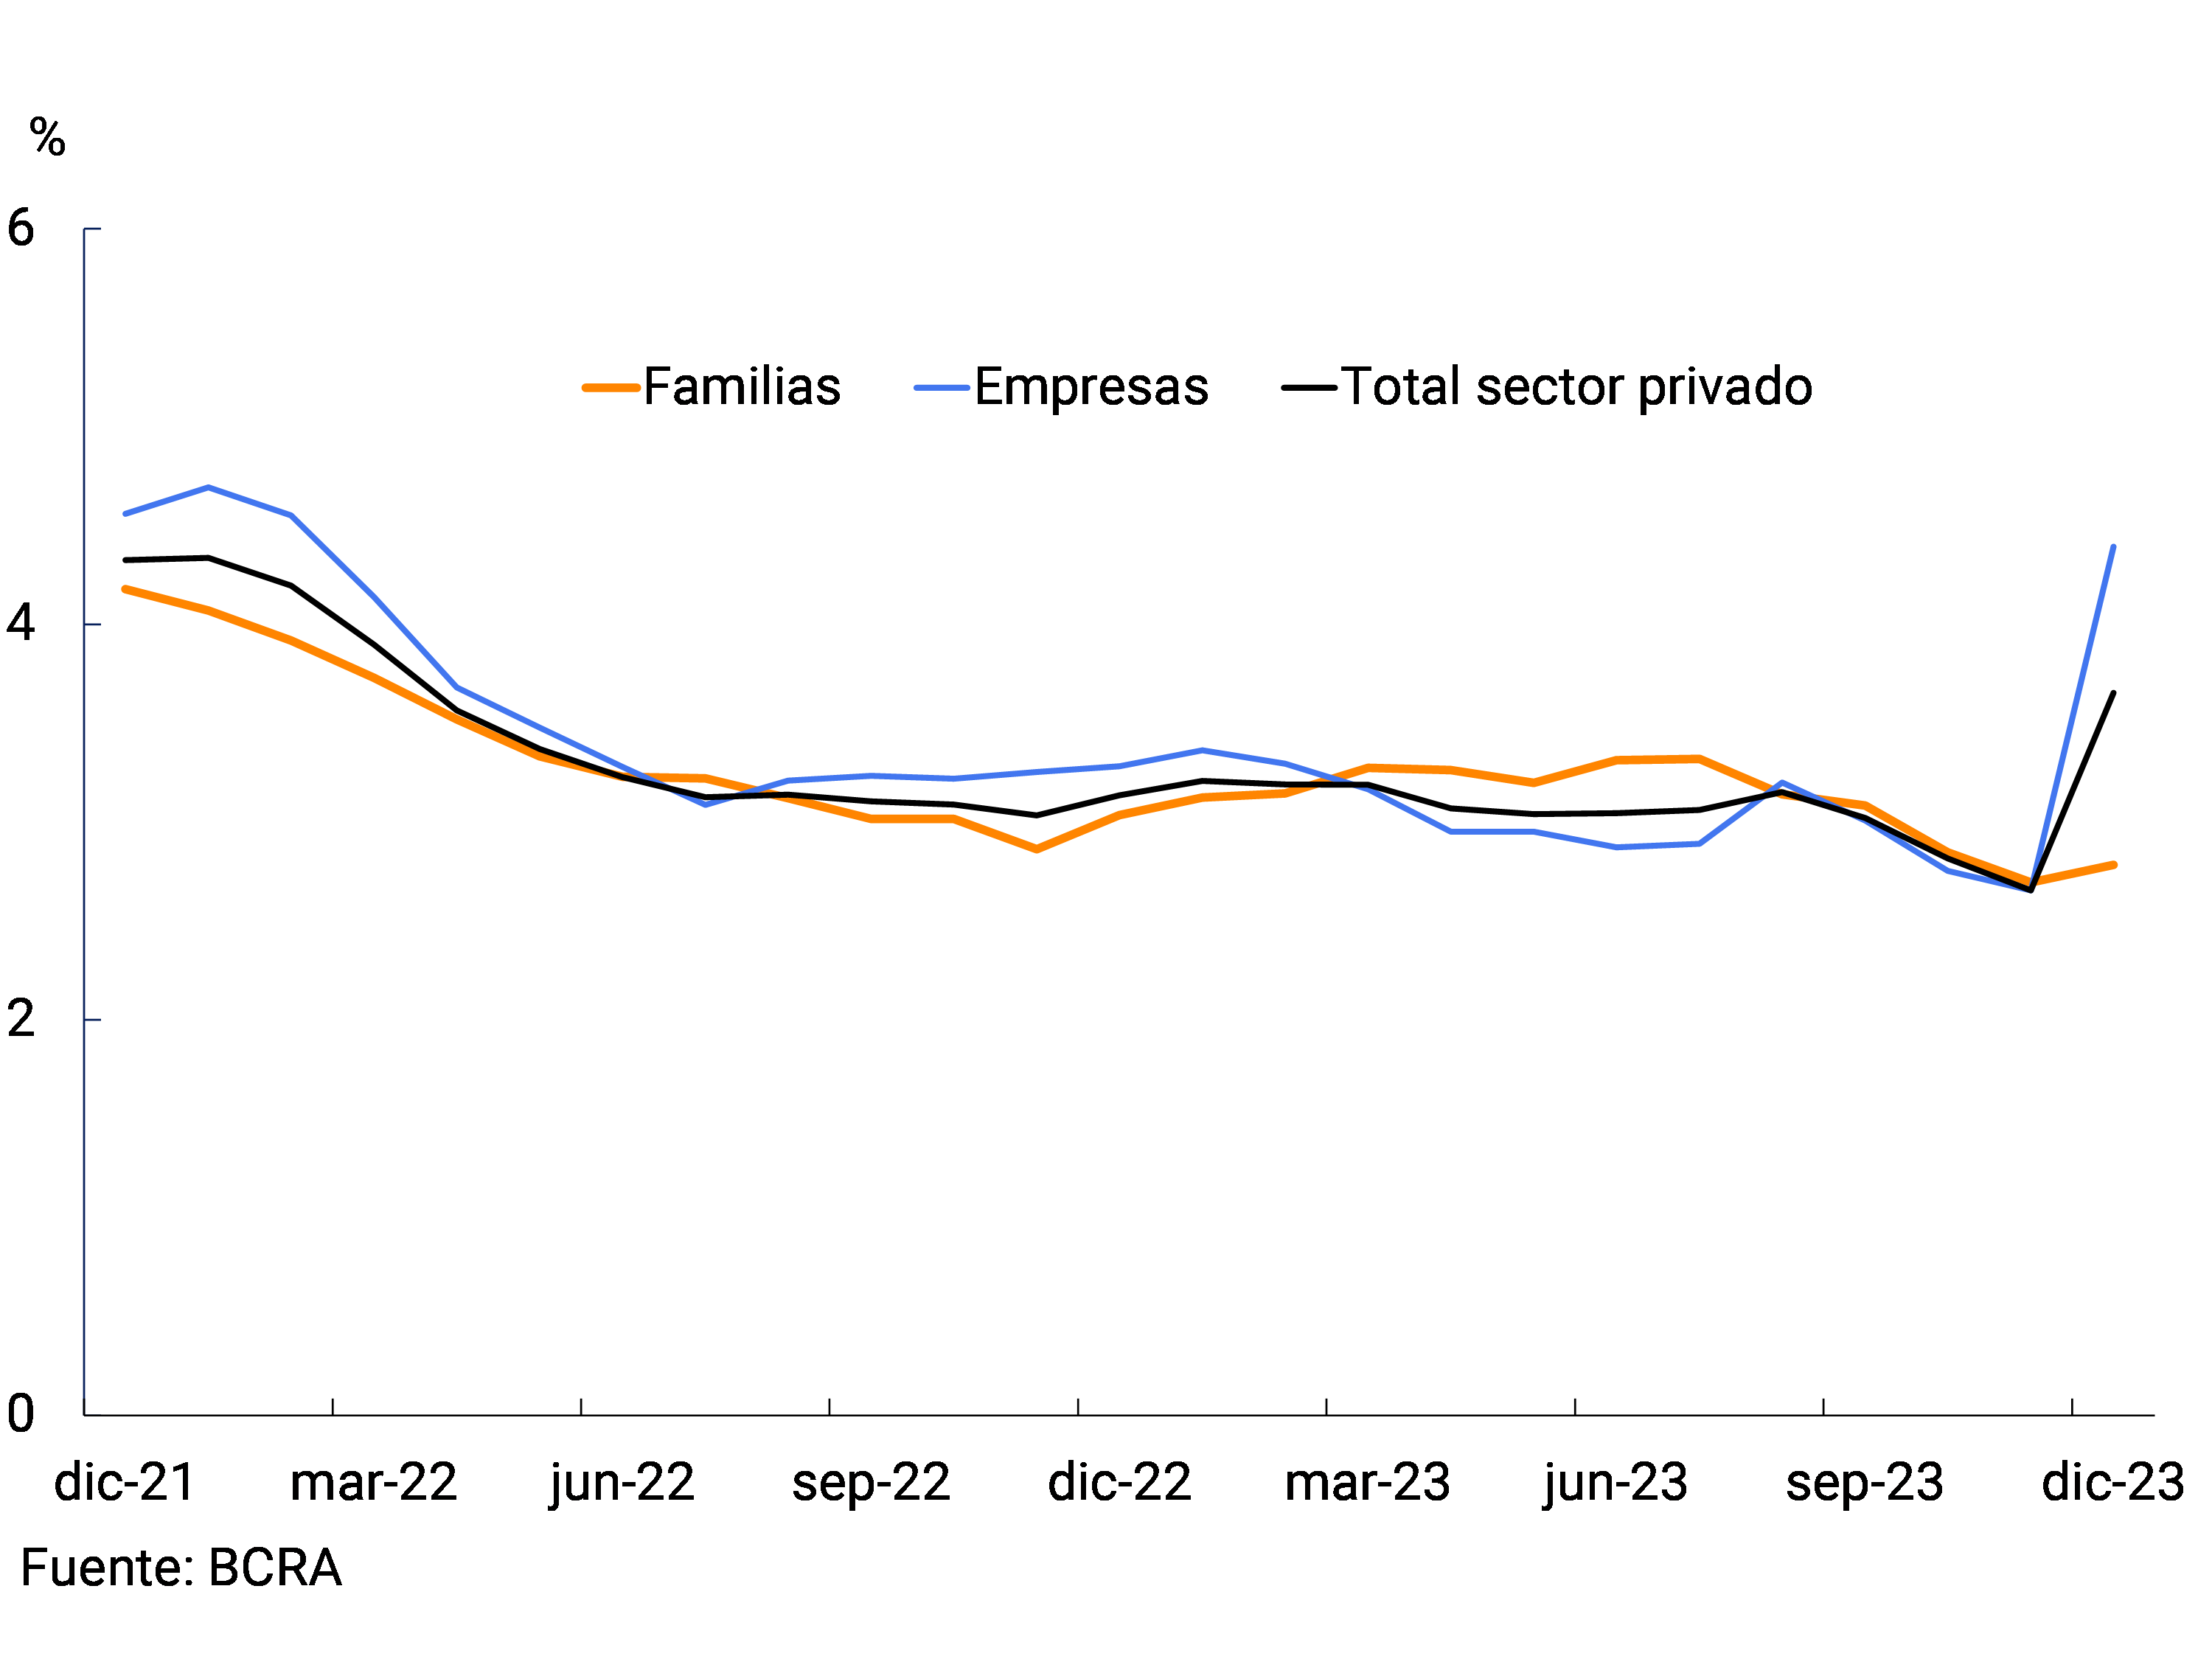
In December, the irregularity ratio of credit to the private sector stood at 3.7%, increasing 1 p.p. compared to last month’s value and 0.5 p.p. in a year-on-year comparison. The increase in the month was explained by the segment of financing to companies (see Graph 8), mainly due to the effect of the revaluation of previously existing debt in foreign currency in an irregular situation. 13 In particular, the non-performing loan ratio for companies reached 4.4% in the month (+1.7 p.p. monthly), a dynamic reflected mainly in financing to industry. On the other hand, the NPL on loans to households stood at 2.8% of the portfolio, remaining unchanged in magnitude compared to the November level (+0.1 p.p.).
Figure 8 | Irregularity ratio of credit to the private
sector Financial system
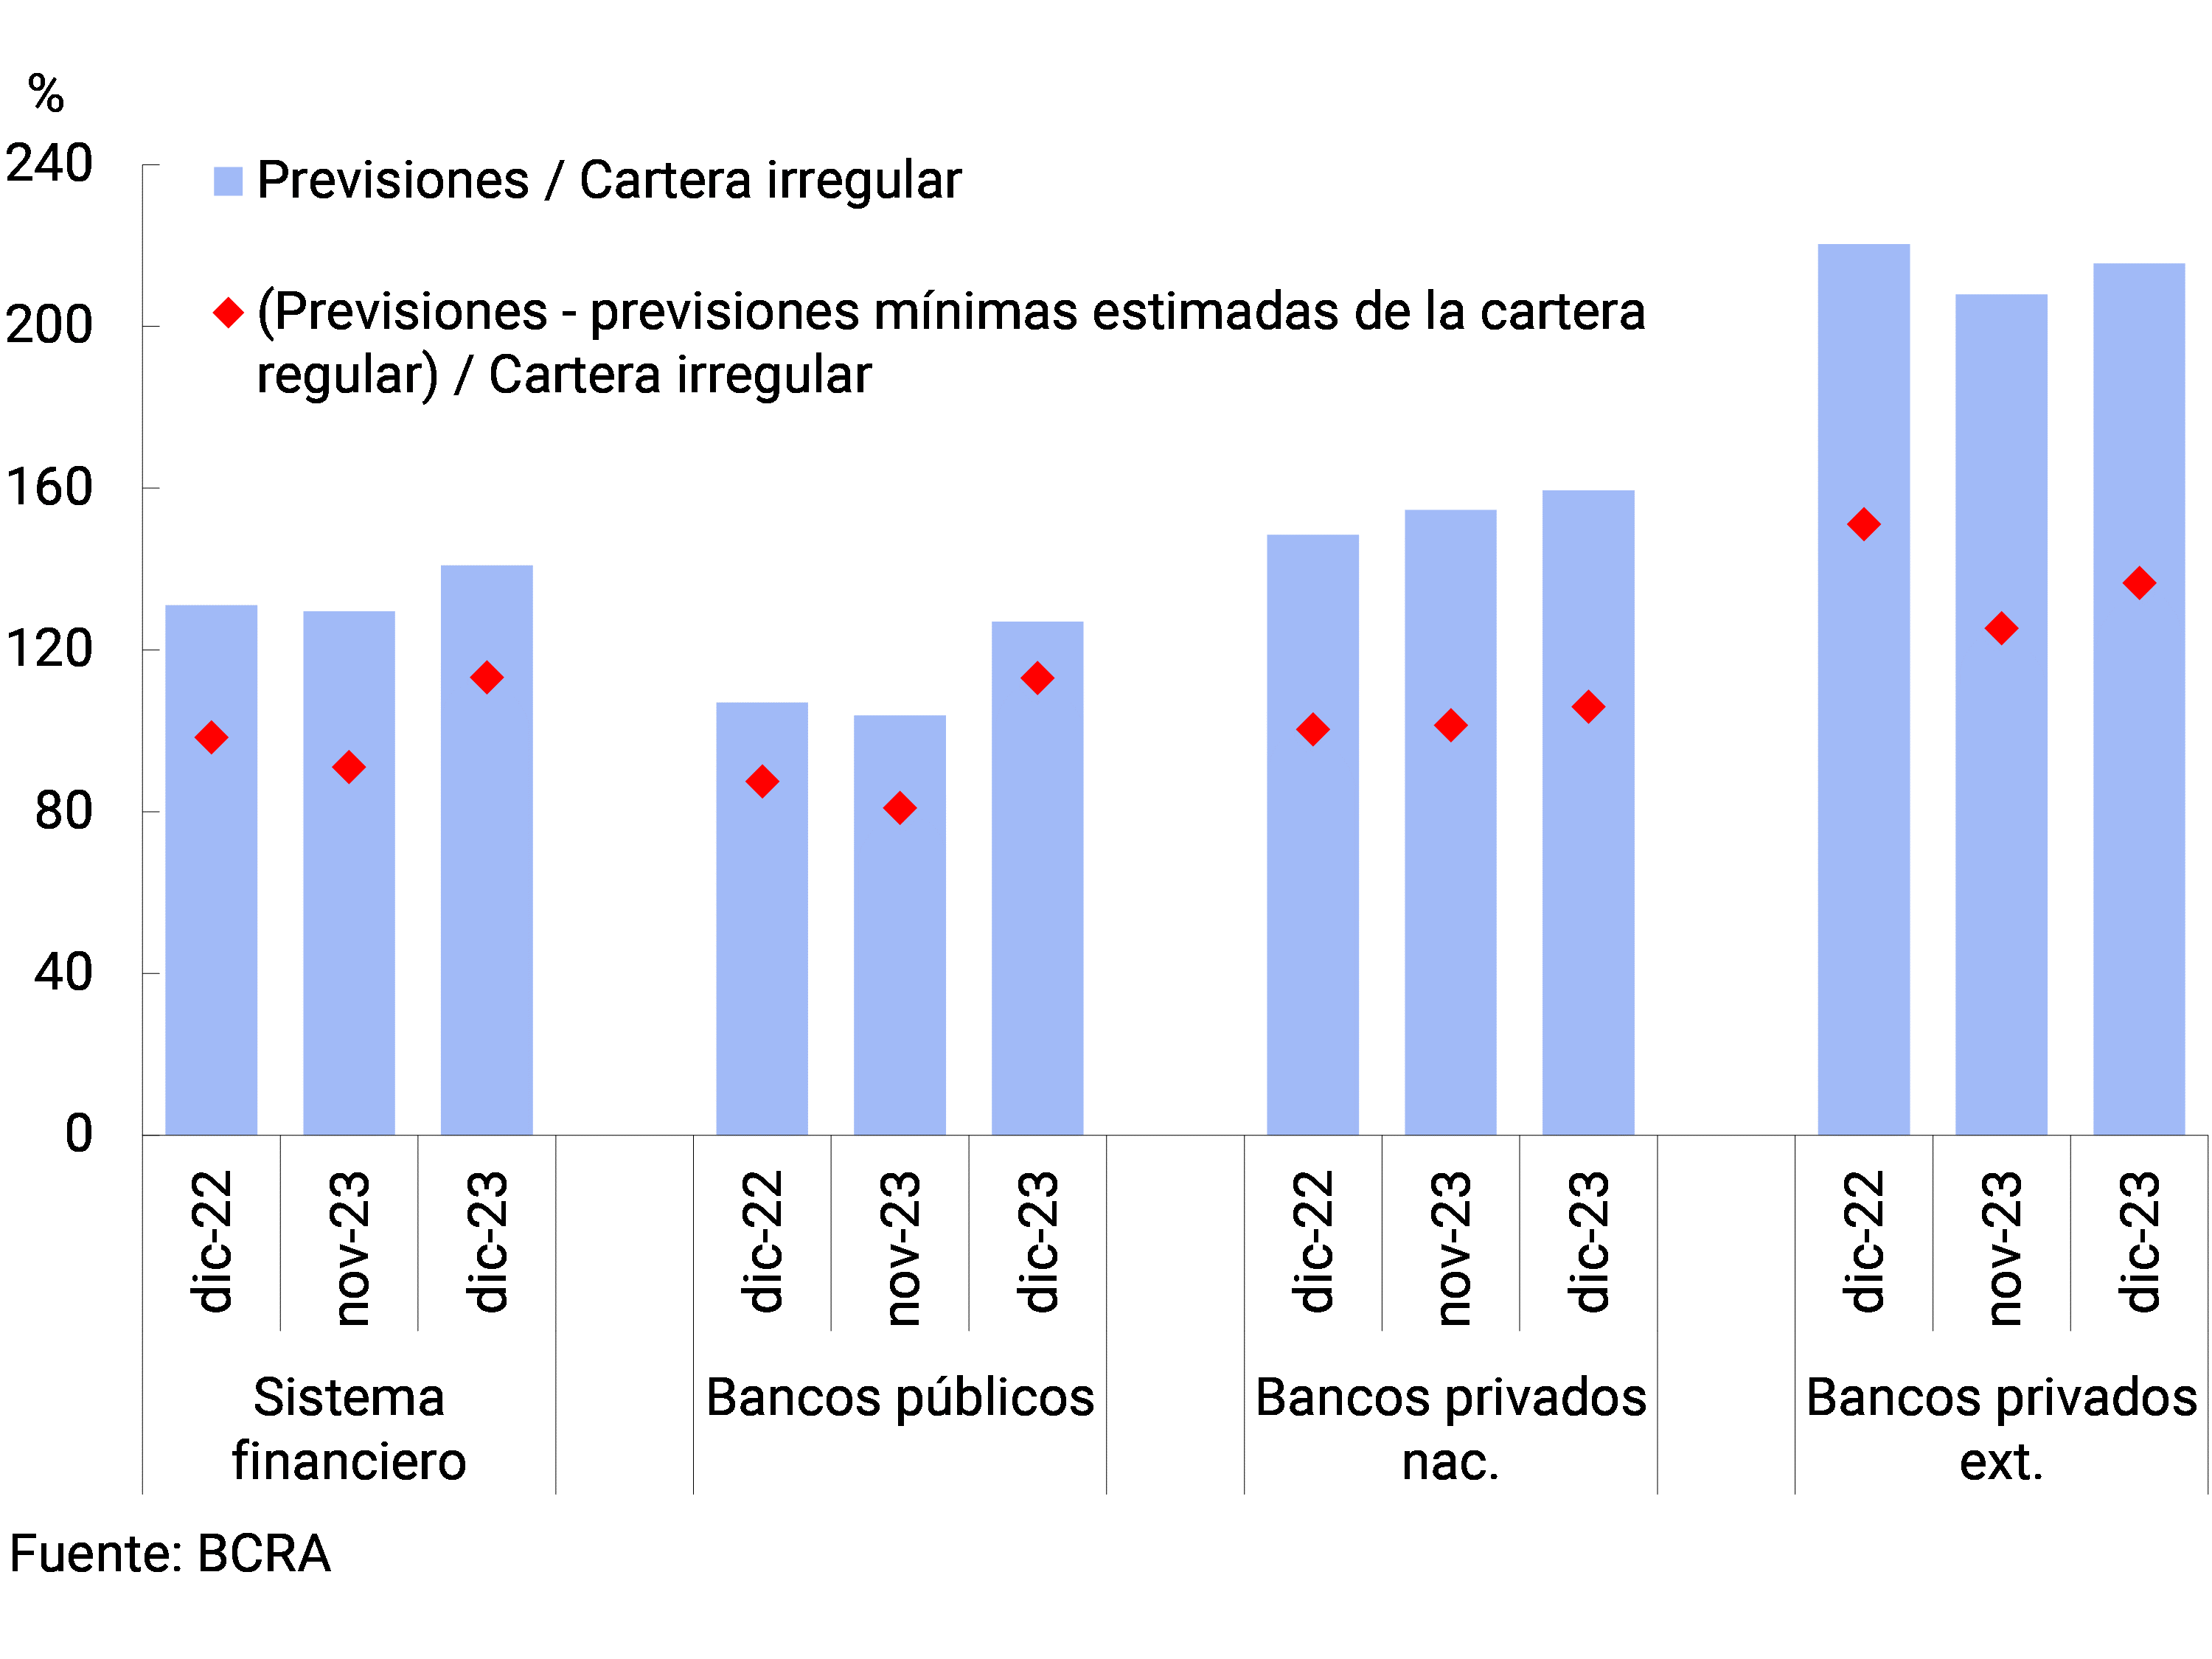
The financial system maintained high levels of forecasting during 2023. In December, the total forecast balance of all institutions represented 141% of the credit in an irregular situation (+9.9 p.p. y.o.y.; see Figure 9) and 5.1% of total financing to the private sector (+1 p.p. y.a.). The balance of net forecasts of those corresponding to the portfolio in regular situation14 represented 113.2% of said portfolio.
Figure 9 | Financial system forecasts
IV. Liquidity and solvency
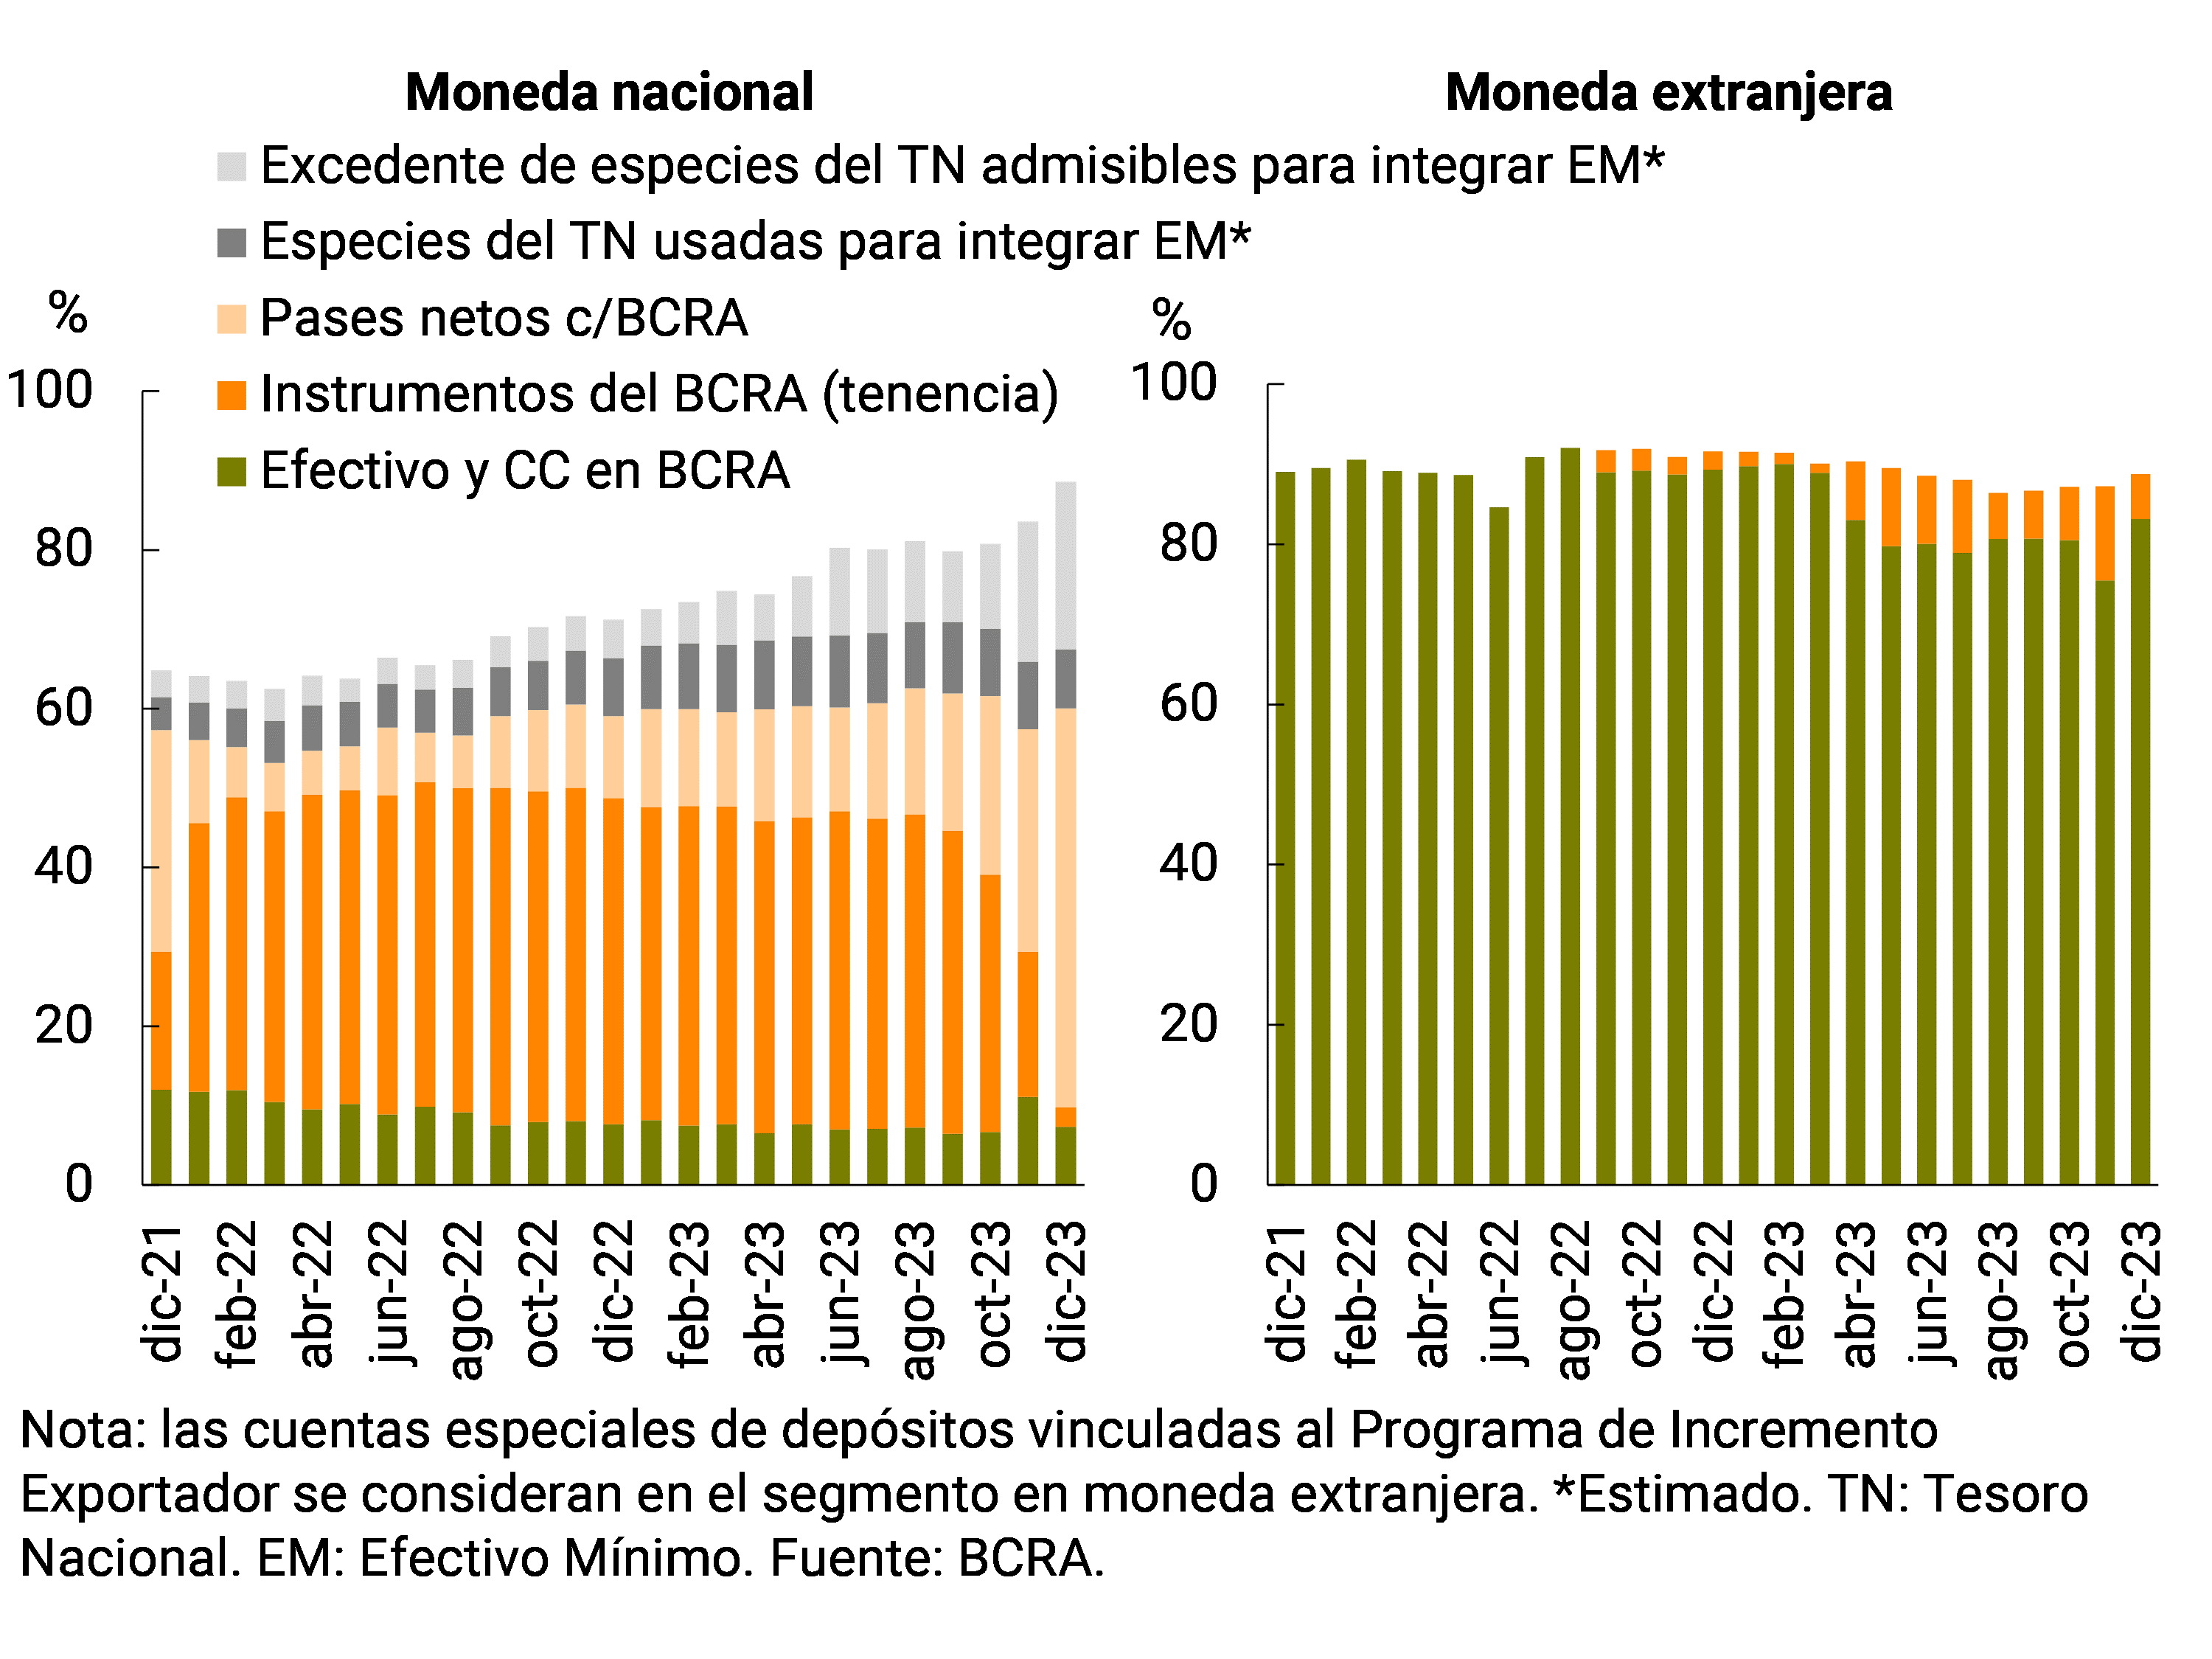
By the end of 2023, the aggregate financial system continued to present high and growing levels of liquidity. Thesector’s 15th broad-sense liquid assets amounted to 88.6% of deposits in December, 4.5 p.p. above the previous month’s figure (and +14.2 YoY). The ratio reached 88.6% for items in pesos and 88.8% for those in foreign currency in the period (see Chart 10). When disaggregating liquidity in national currency, in the last month of 2023 the relevance of the passes against the BCRA increased, as opposed to the performance of the holding of instruments of this Institution and the balance of current accounts that the entities have in it.
Figure 10 | Liquidity of the financial
system As a % of deposits
On December 19, the BCRA adopted measures on the liquidity management scheme. With regard to the operations through which the BCRA can inject liquidity, there will continue to be the possibility for financial institutions to make passes against the BCRA and this Institution will offer puts on Treasury instruments that it deems appropriate. The BCRA also provided that those securities that may be sold to this Institution by the put mechanism will not be counted for the purposes of the limit of credit fractionation to the public sector. 16
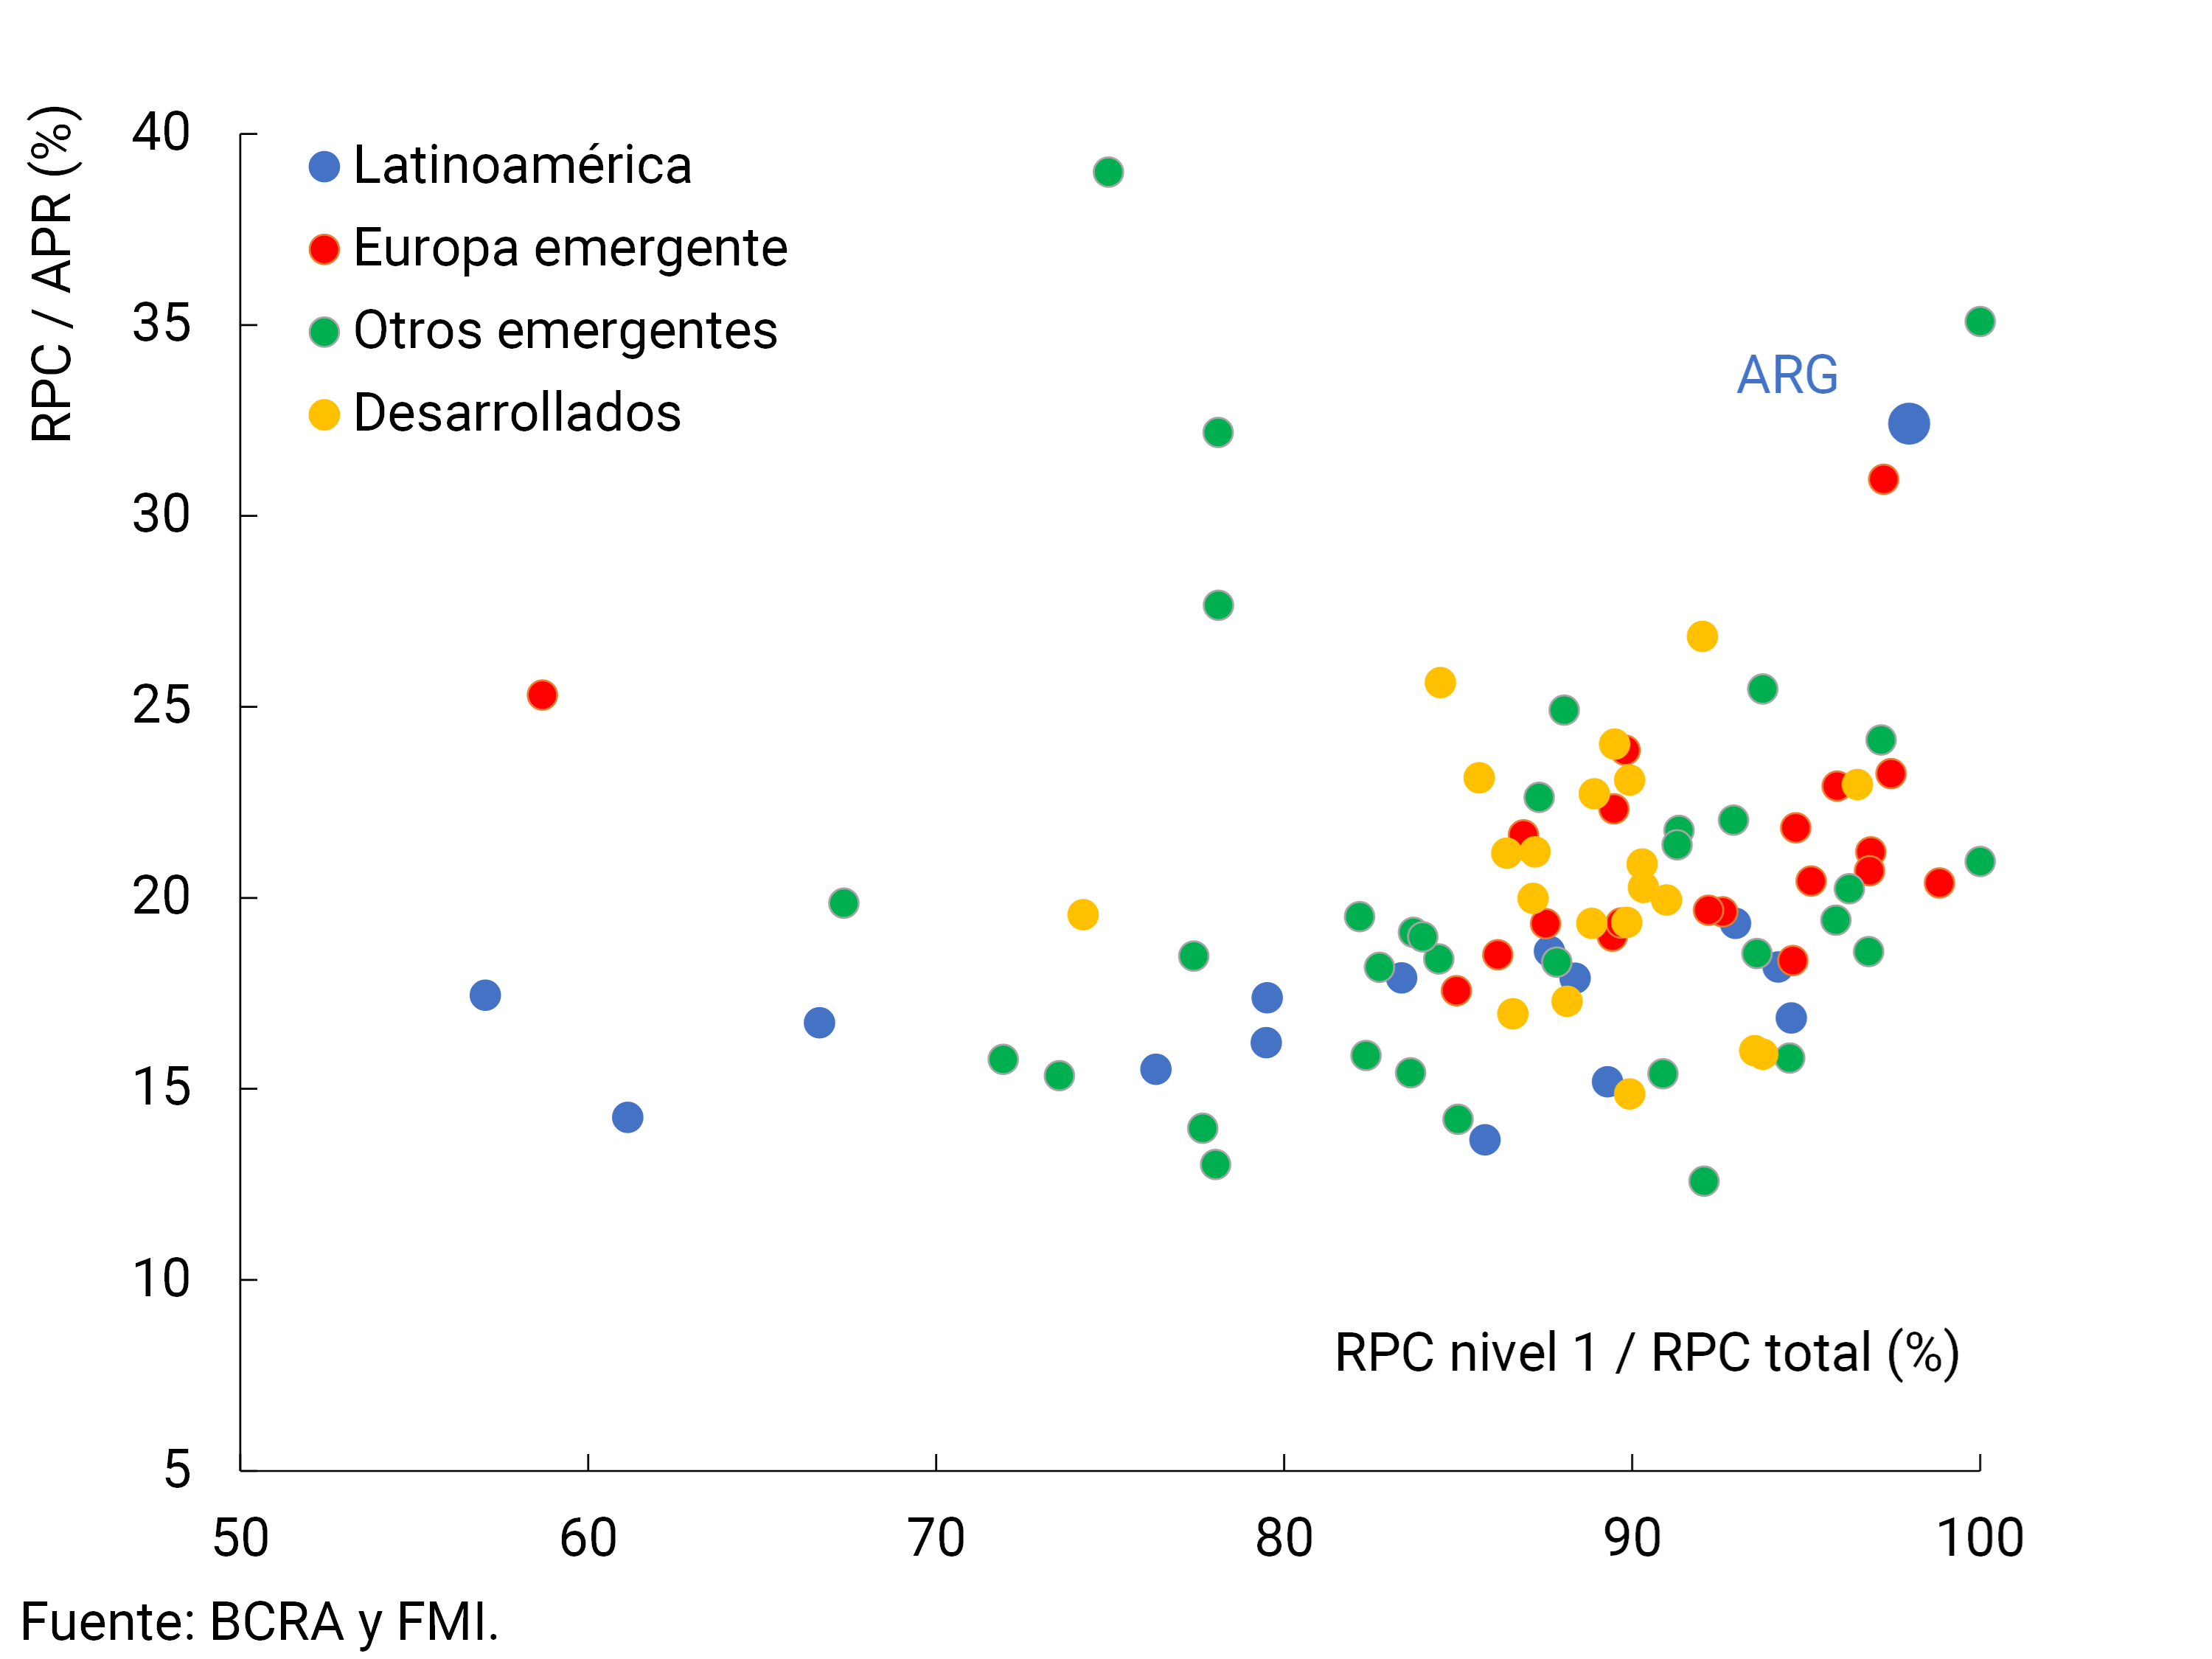
Similarly, the sector’s aggregate solvency indicators continued to be high and rising. The entities as a whole integrated capital equivalent to 32.4% of risk-weighted assets (RWA) at the end of the year (+1.6 p.p. monthly, +2.6 p.p. y.o.y.). As of December, the capital position (integration minus minimum regulatory requirements) of the financial system totaled 302.7% of the requirement (+17 p.p. compared to November and +28.9 p.p. y.o.y.) and 60.2% of the balance of credit to the private sector net of forecasts, well above the average of the last 10 years (21.4%). In this context, the capital ratios of the local financial system remained above the records of most countries, both emerging and developed (see Chart 11).
Figure 11 | Capital Integration
International Comparison – Financial Systems
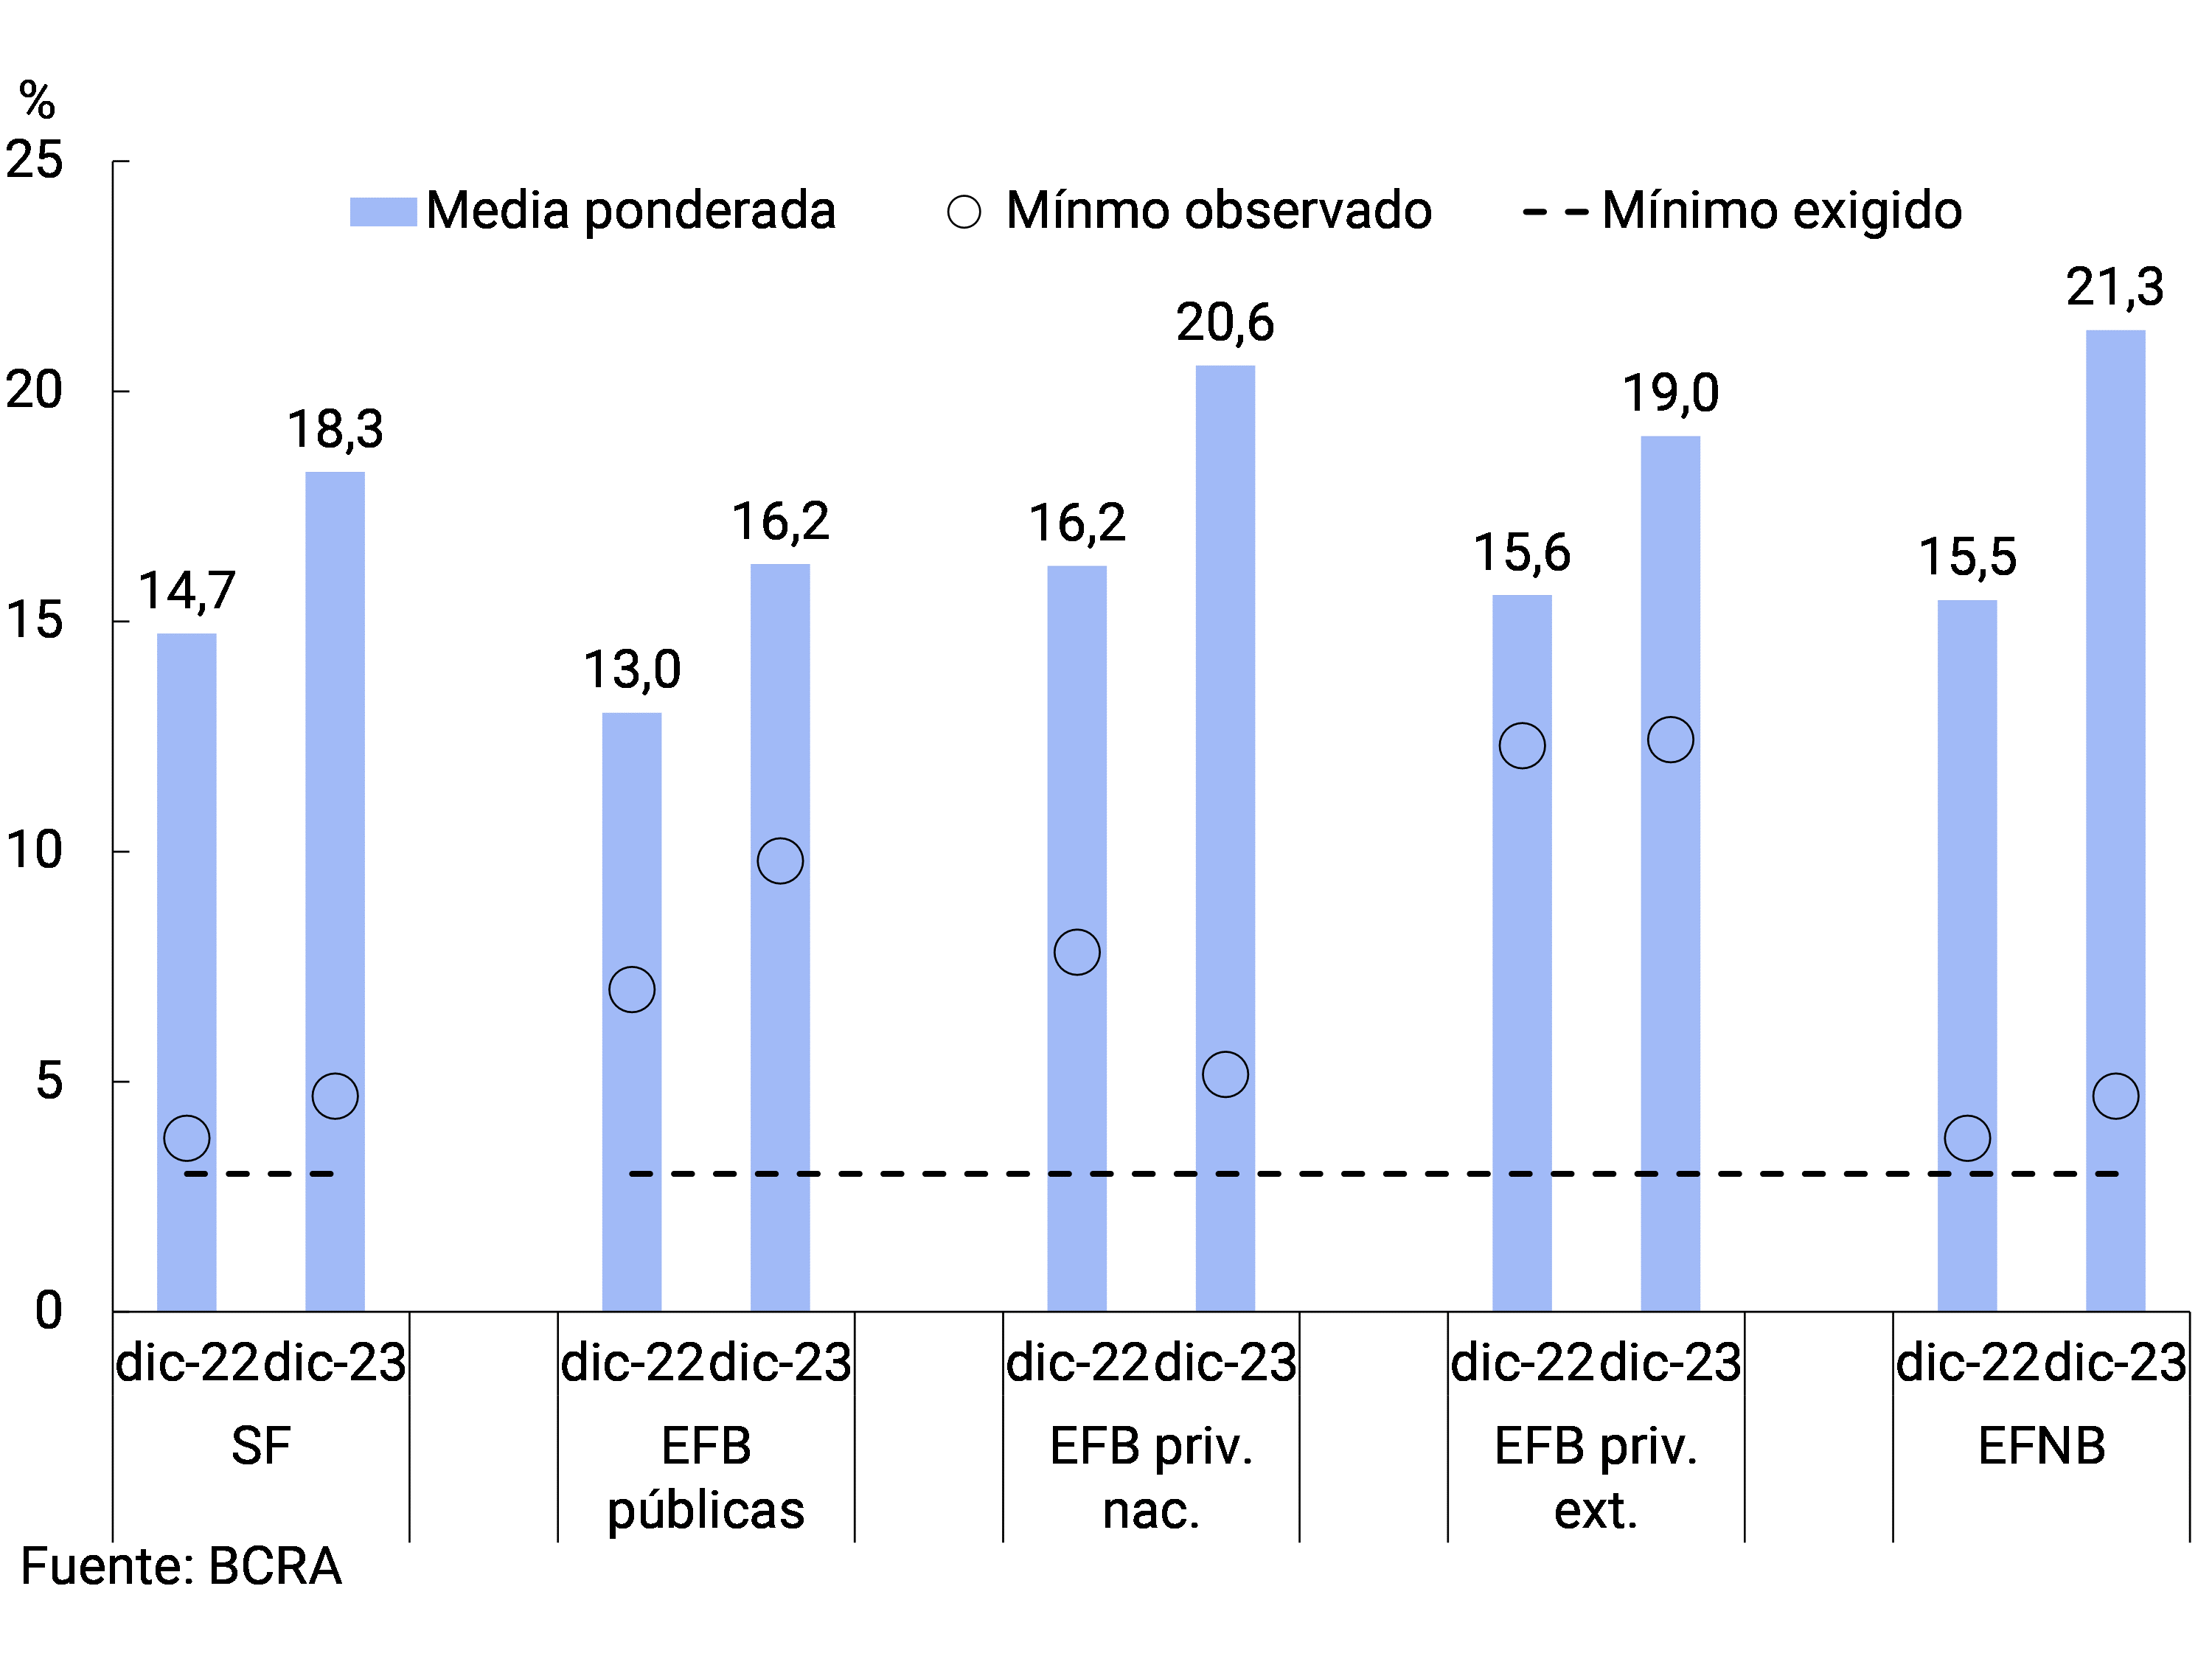
The leverage ratio closed the year at 18.3% for the financial system as a whole,17 3.5 p.p. above the record of a year ago, remaining in the aggregate at a level significantly above the minimum requirement (established at 3%, see Chart 12).
Figure 12 | Leverage
ratio Capital Tier 1 in terms of a broad measure of exposure
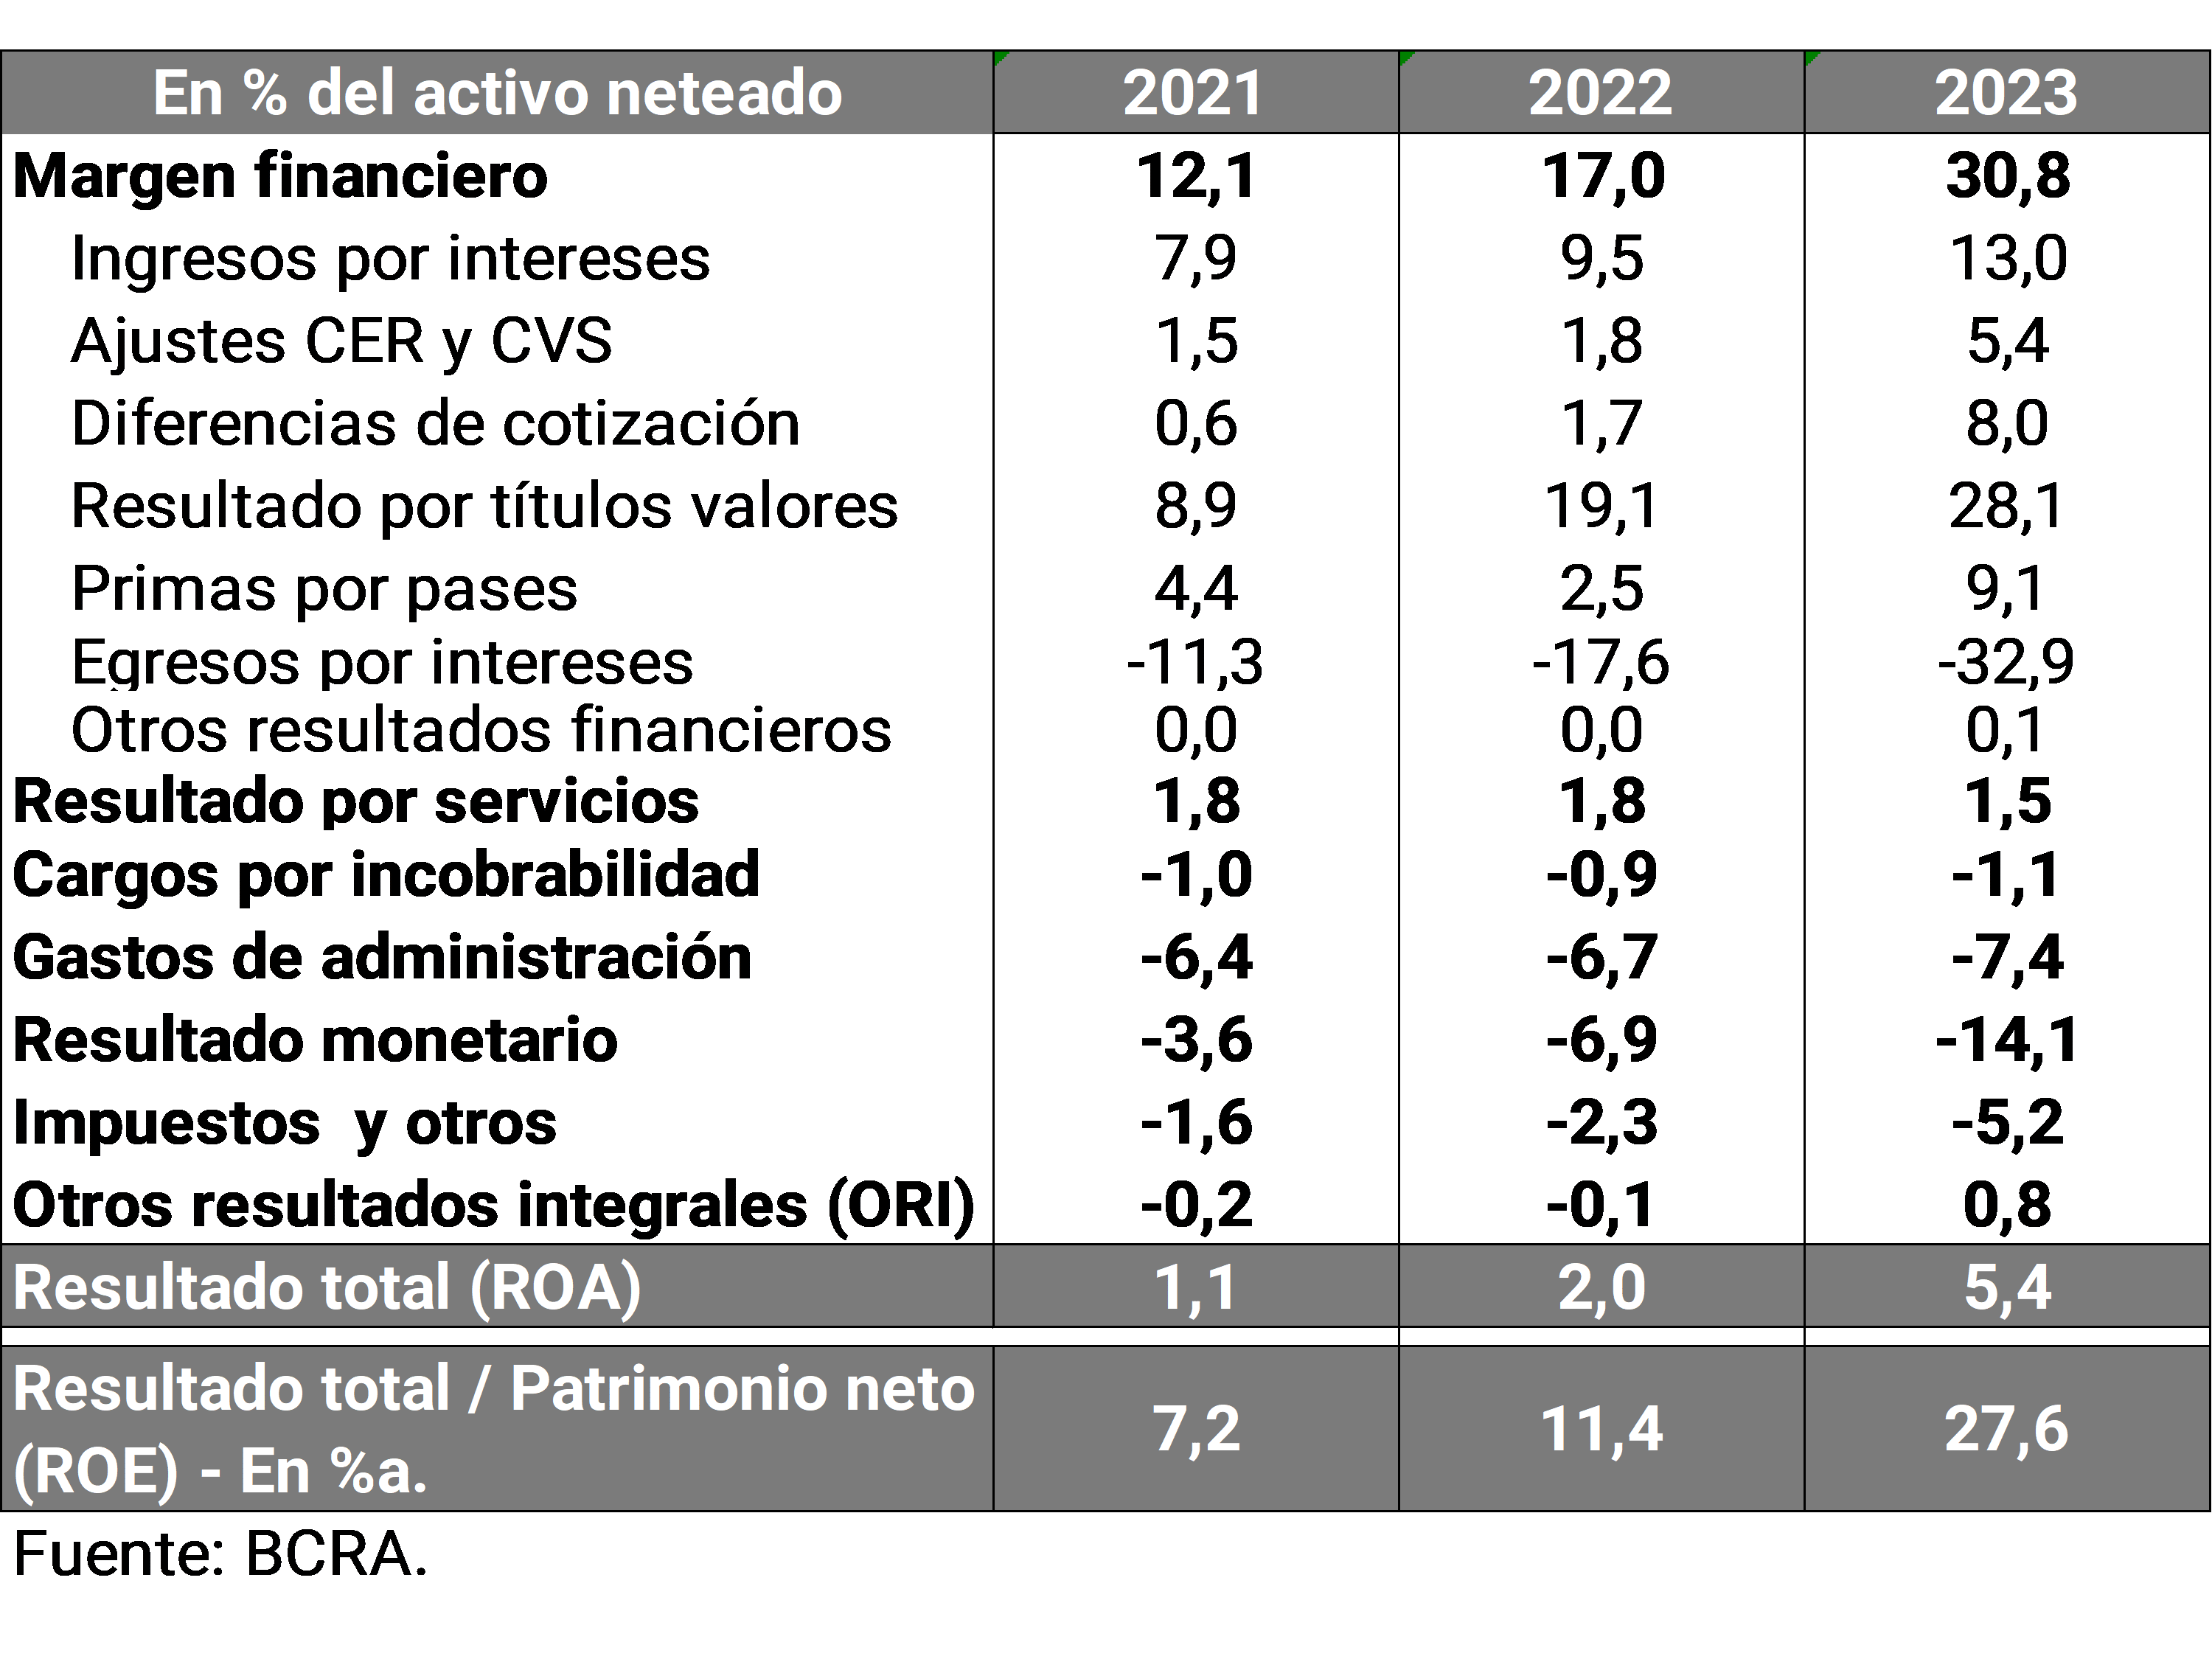
The financial system closed 2023 with profitability levels higher than those verified in previous years. During the year, all financial institutions accumulated total comprehensive income in homogeneous currency, equivalent to 5.4% of assets (ROA) and 27.6% of equity (ROE). The year-on-year growth in ROA was mainly explained by a higher financial margin, an effect partially offset by an increase in losses due to exposure to monetary items and both tax and administrative expenses (see Table 1).
Table 1 | Financial System Profitability Table
V. Payment system
During 2023, electronic means of payment continued to expand in the retail sphere, in response to the increase in demand from users and the growing momentum from the BCRA.
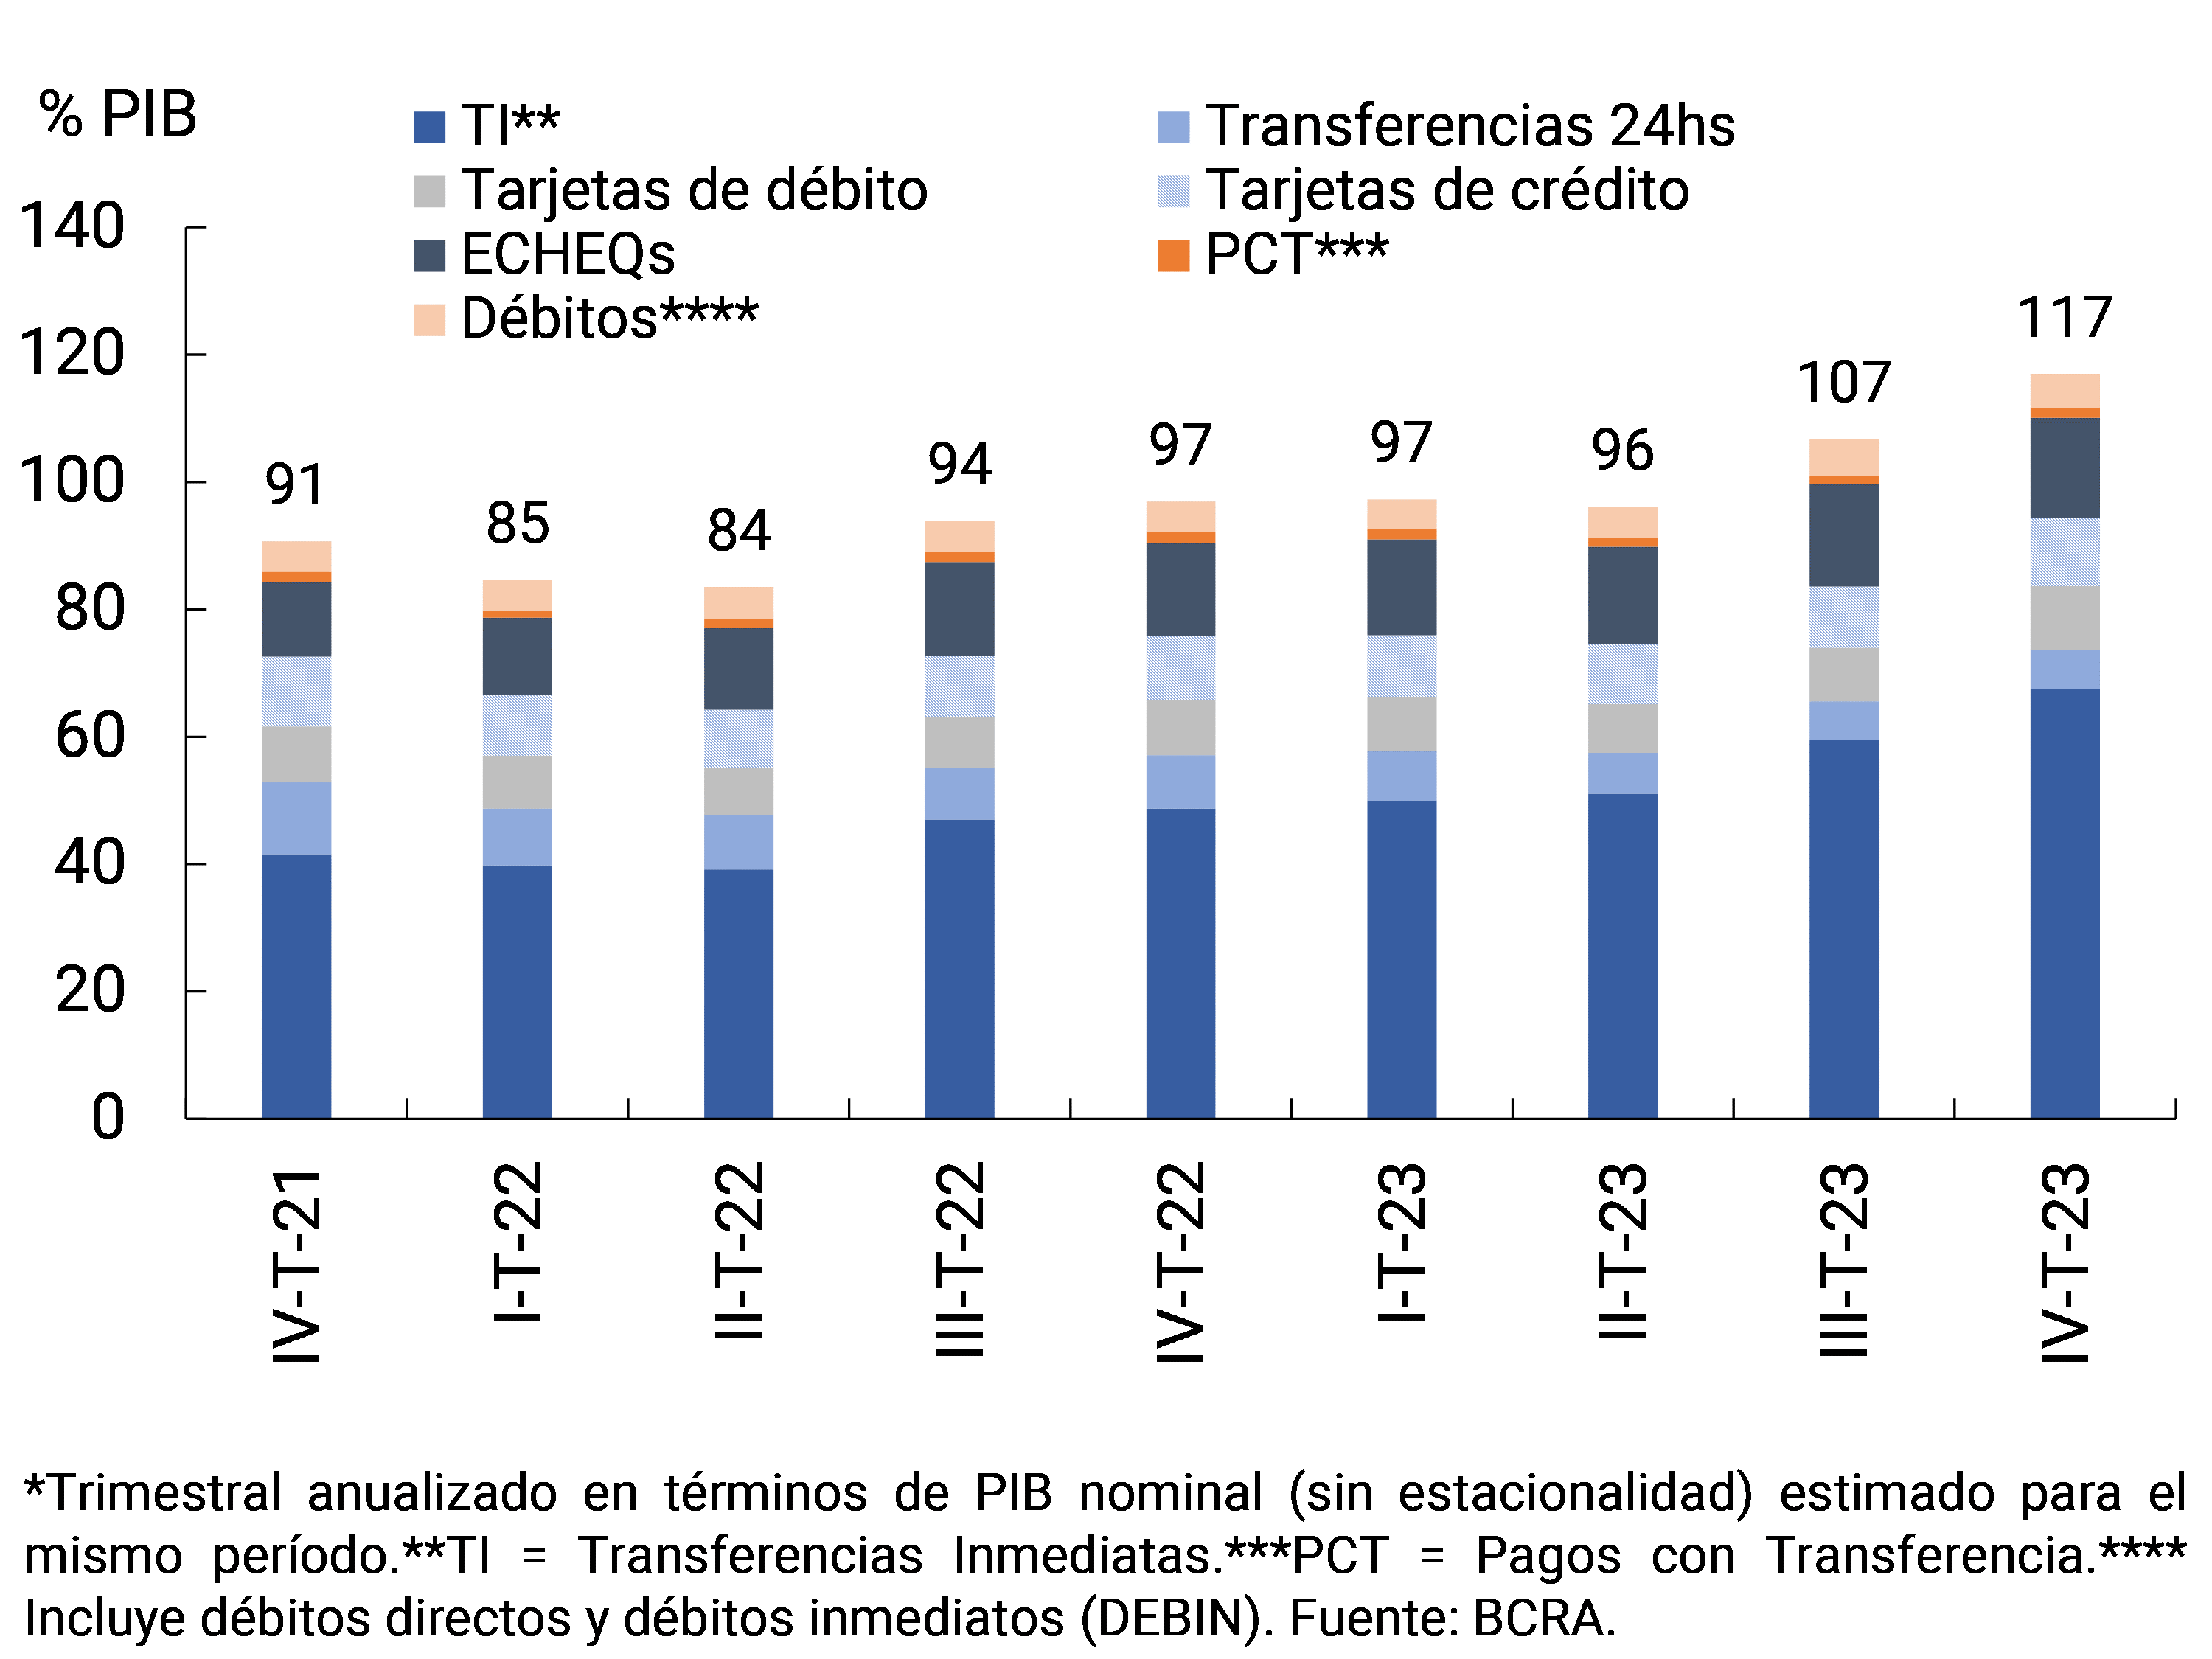
Technological advances contributed to the increased relevance of electronic payment transactions in the economy in recent years (see Figure 13). It is estimated that the combination of the main electronic payment methods in relation to the local Gross Domestic Product (GDP) grew by around 20 p.p. throughout 2023. Among the factors that explained the performance of the last year, immediate transfers (TI) experienced a growth of 36.5% in real terms. When considering the IT operated at the end of 2023 (last three annualized months), it is estimated that they came to represent 67.4% of GDP, showing an increase of 18.7 p.p. y.o.y.
Figure 13 | Main retail electronic payment methodsEstimation of amounts traded as a % of GDP*
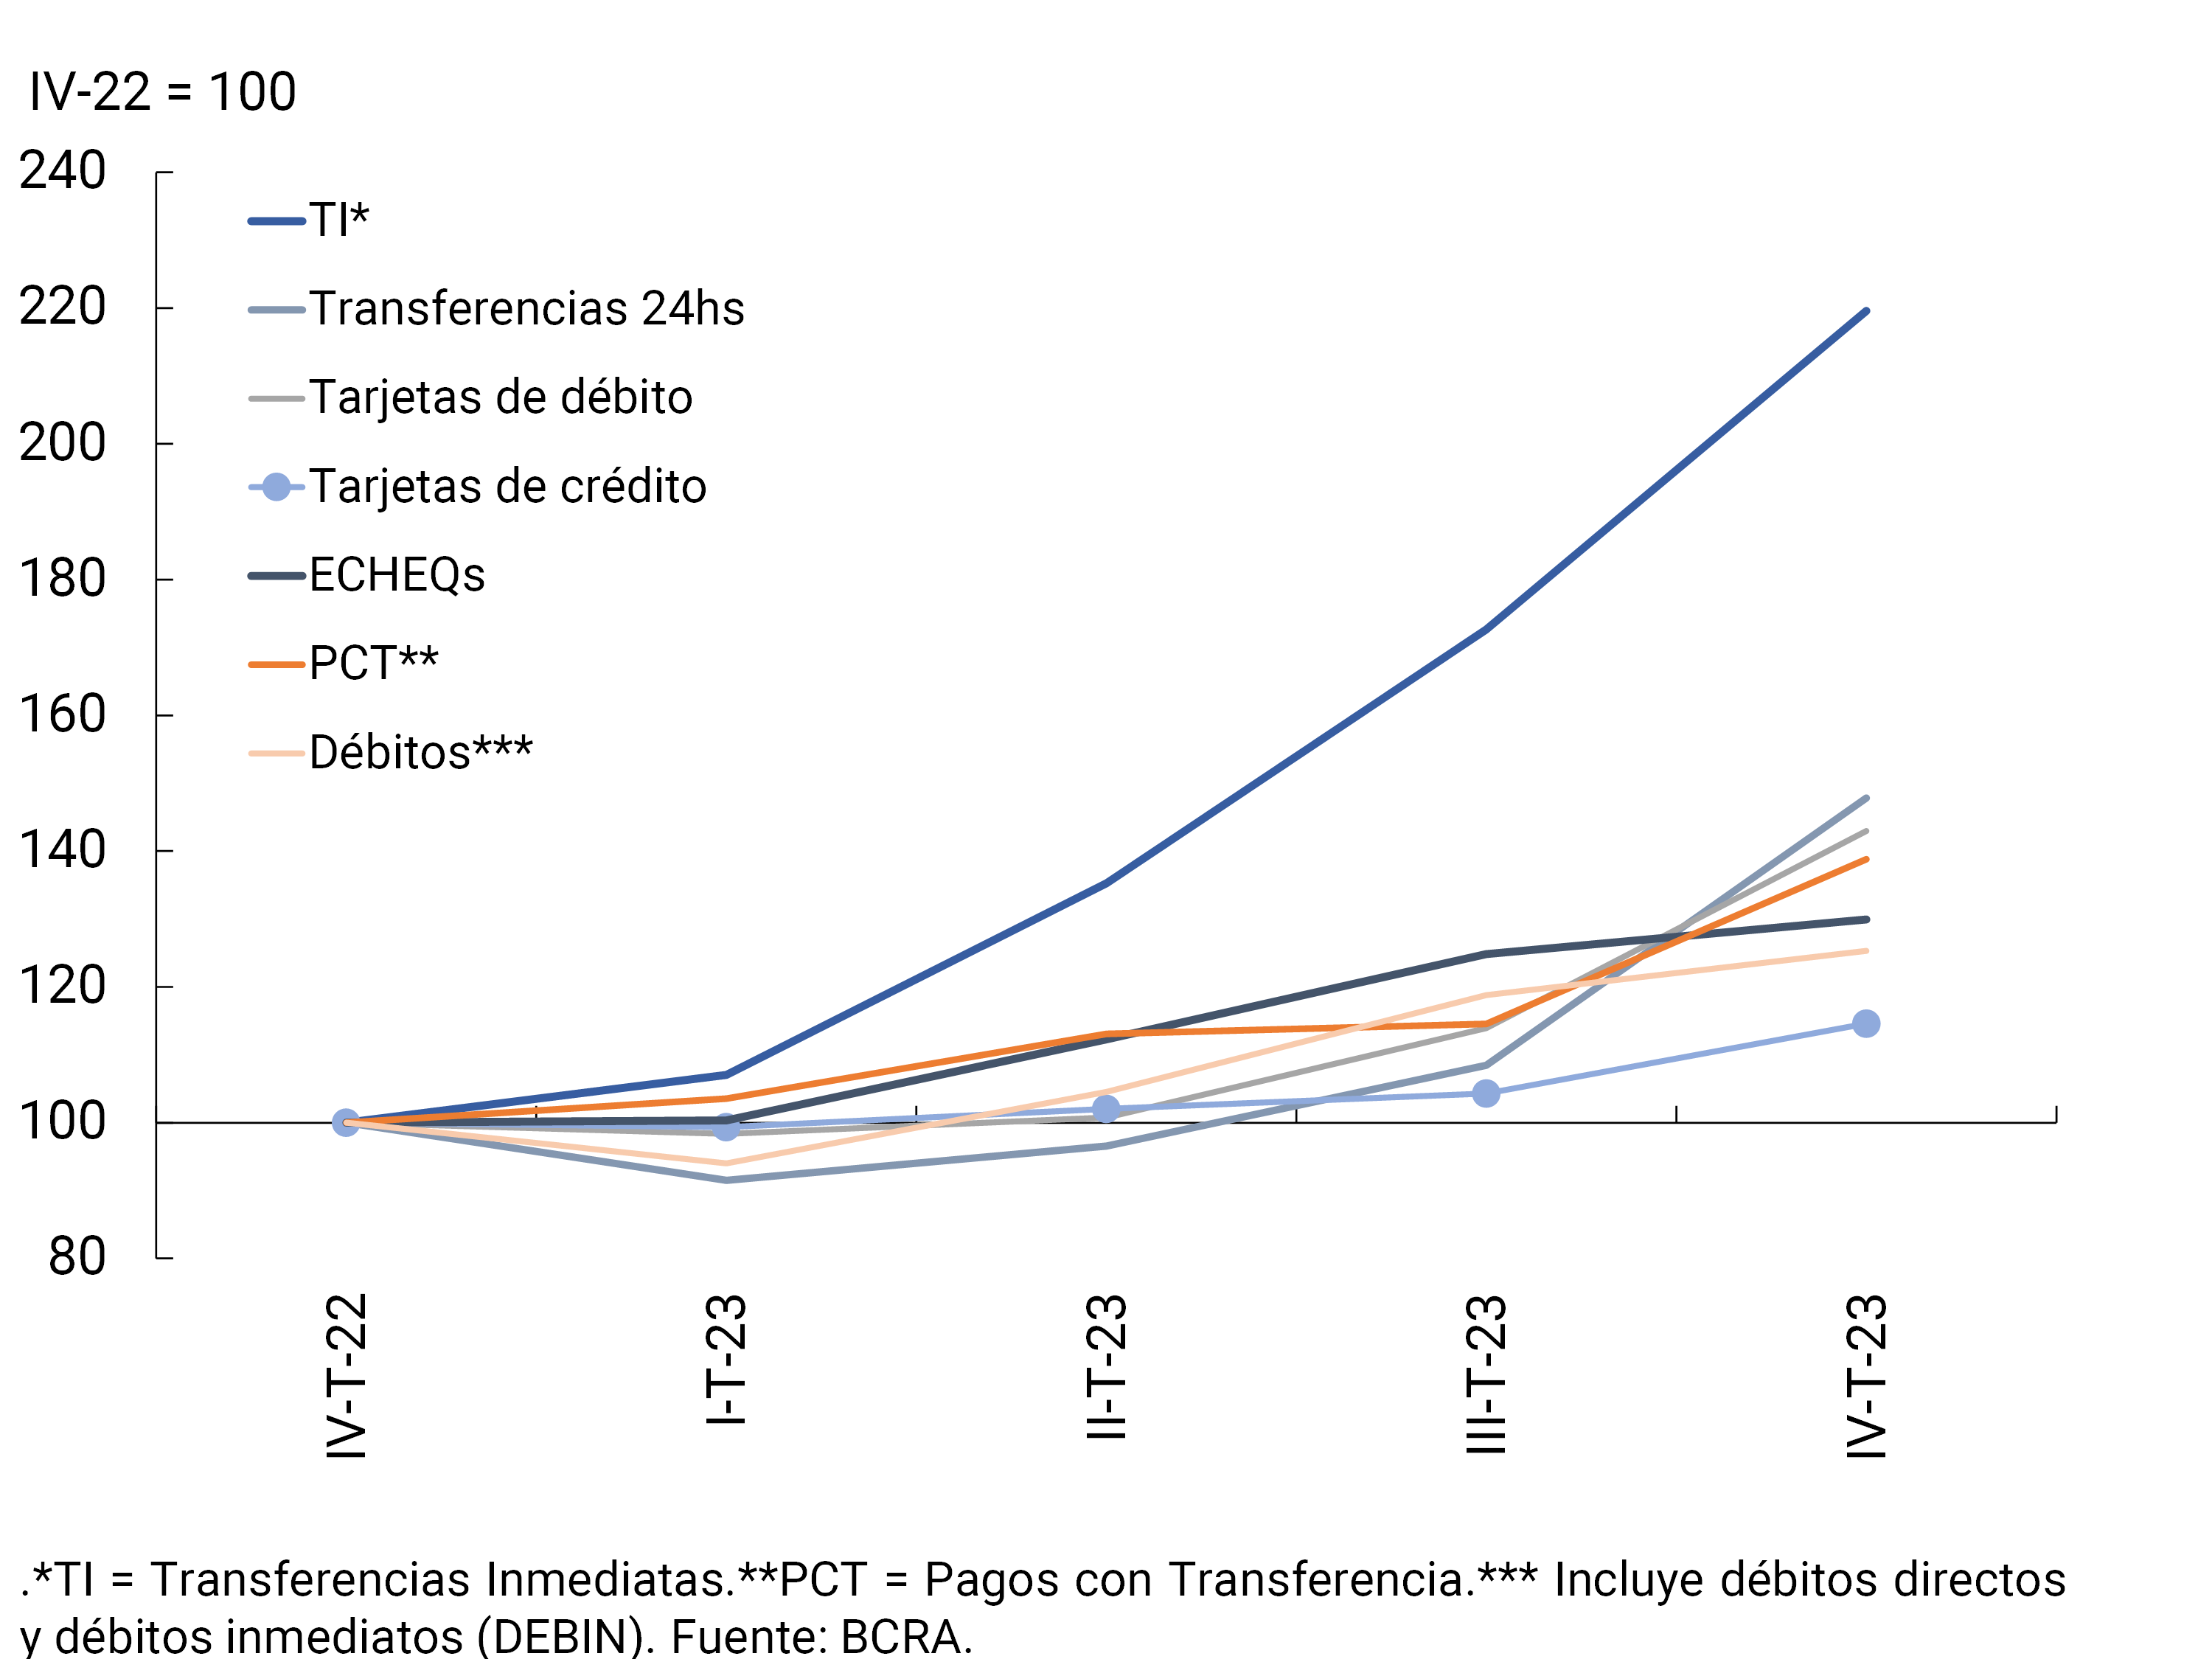
In 2023, the number of payment transactions carried out increased in all retail electronic means considered (see Chart 14). When broken down by type of instrument and compared to December 2022, immediate transfers (TI) increased 118%, the clearing of Electronic Checks (ECHEQs) increased 20%, and payments with transfers (PCT) experienced an increase of 37%.
Figure 14 | Main retail electronic payment methodsNumber of transactions – Base index
References
1 In accordance with the most relevant variations in the components in national currency of the aggregate balance sheet of the group of entities.
2 Regarding the foreign currency segment, in December the main sources of funds in the financial system were the reduction in financing to the public sector and the increase in the balance of private sector deposits. These variations were mainly due to an increase in liquid assets.
3 Includes principal adjustments and accrued interest.
4 Regarding the financing channeled mainly to MSMEs, it is estimated that the balance of the Financing Line for Productive Investment of MSMEs (LFIP) totaled $2.6 trillion at the end of 2023, representing 11.7% of total credit to the private sector and 20% of the total financing balance to companies.
5 Expressed in currency of origin.
6 The real balance of pre-cancellable UVA deposits almost tripled in the month, although it maintained a low share of the total number of deposits to the private sector (0.8%). Meanwhile, UVA deposits without early cancellation option increased by 10% in real terms in the period.
9 Expressed in currency of origin.
10 In a context in which the nominal peso-dollar exchange rate increased 124% between the peak of the month.
11 See footnote above.
12 Includes off-balance sheet foreign currency forward purchase and sale operations. Liabilities include deposits that have variable remuneration depending on the evolution of the exchange rate – associated with the Export Increase Program – and within assets the BCRA’s LEDIV are computed.
13 As part of the transition to a regime that ensures macroeconomic stability, a new exchange rate was established in mid-December in the Free Exchange Market (MLC).
14 In accordance with the criteria of the minimum regulatory provisions for the risk of uncollectibility.
15 Considers availabilities, BCRA instruments in national and foreign currency, and all public securities authorized to be used as part of the requirement that arises in the Minimum Cash standard.
16 Acquired by primary subscriptions, as of 12/18/23, according to Communication “A” 7921.
17 Tier 1 capital in terms of a broad measure of exposure.
Share on


