1. Context
The expected international and local scenario continues to be favorable for the expansion of financial intermediation in Argentina. In recent months, the improvement in credit conditions for the country has been consolidated, with a reduction in risk margins for public and private debt in international markets and equity placement operations carried out by several banks (in view of the sector’s expansion expectations). However, there are several risk factors that could eventually generate stress events (of low probability in the coming quarters) that imply less access to financing through international markets and greater volatility in the exchange rate. On the other hand, the Argentine economy has certain characteristics (relatively healthy sectoral balances, exports that are not very concentrated in terms of recipients, the BCRA’s strategy of accumulating international reserves, banks with low exposure to the public sector, for example) that would mitigate the possible effect of a materialization of an external source of risk. With respect to the evolution of the local economy, given the expansive phase and the characteristics of the strength of the financial system, there should be very marked negative deviations from what is expected (of very low probability) for financial stability to be compromised.
International situation
Transmission channels and recent developments
The international context could impact Argentina through the trade channel, given the evolution of global activity and the terms of trade, and the financial channel, fundamentally conditioned by risk appetite. In terms of these variables, the international context has improved since the publication of the last IEF in May.
Figure 1.1 | Emerging Economy Instrument Prices and Estimated Portfolio Flows

The reactivation of the world economy and Argentina’s main trading partners continued to consolidate, highlighting the beginning of the recovery in Brazil1. The terms of trade did not register substantial changes in recent months, remaining close to the average levels observed in 2013-2017. In the financial markets, the scenario of ample liquidity, low expected volatility was maintained, with advances in the main stock market indices and limited interest rates for long-term sovereign debt until the beginning of November. This allowed positive portfolio flows to emerging economies to continue (see Figure 1.1), with record amounts of debt placements by these countries in international markets and improvements in bond and equity prices.
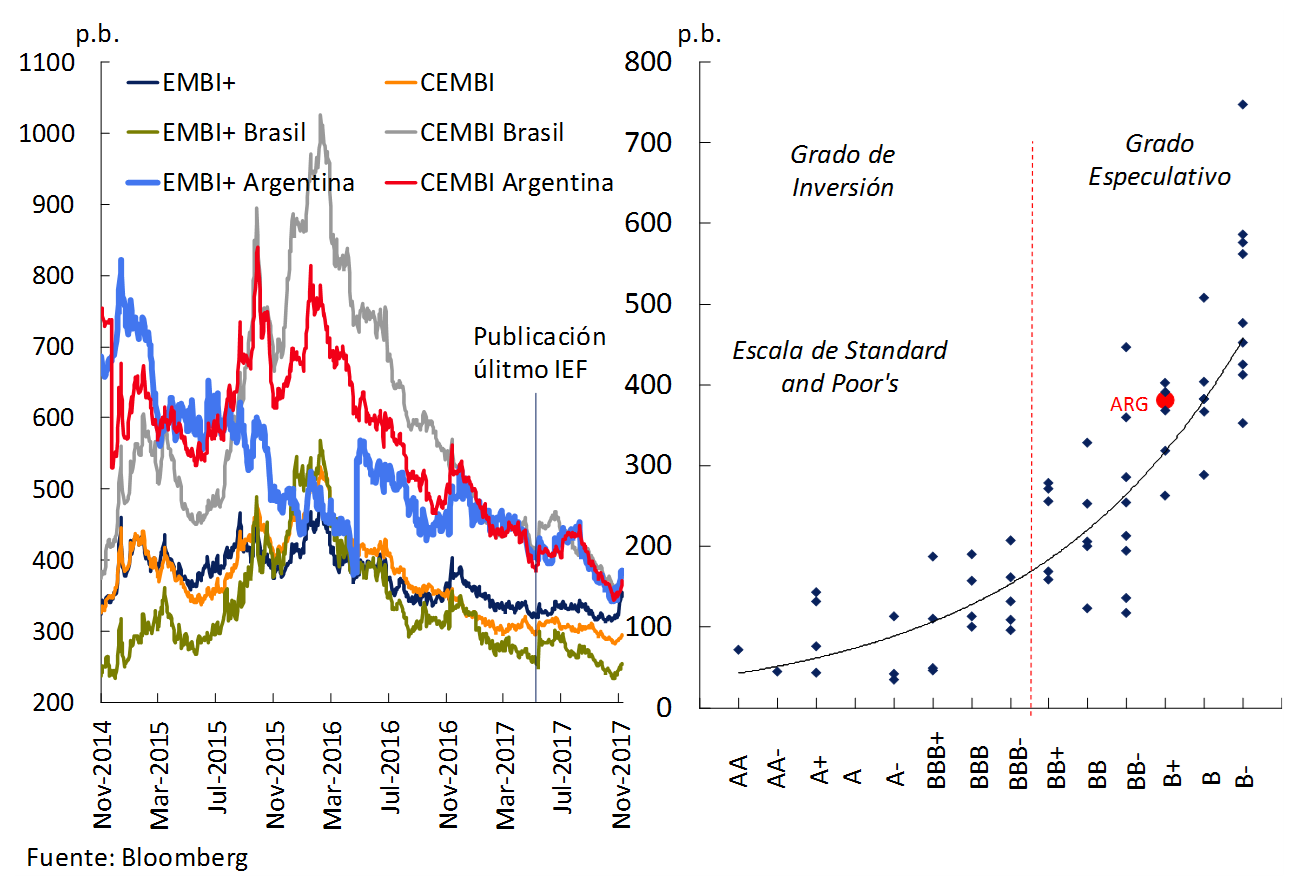
In this context, and in view of the good macroeconomic outlook and the possibility of further improvements in the debt rating2, the compression of risk spreads on Argentine securities was more noticeable than that observed on average for the rest of the emerging economies as a whole (see Figure 1.2). The risk associated with Argentina’s sovereign and corporate bonds (measured through the EMBI+ and CEMBI surcharge) contracted to levels of around 340-350 bps in mid-October, which had not been recorded since 2007.
Figure 1.2 | Perceived risk of Argentina’s debt
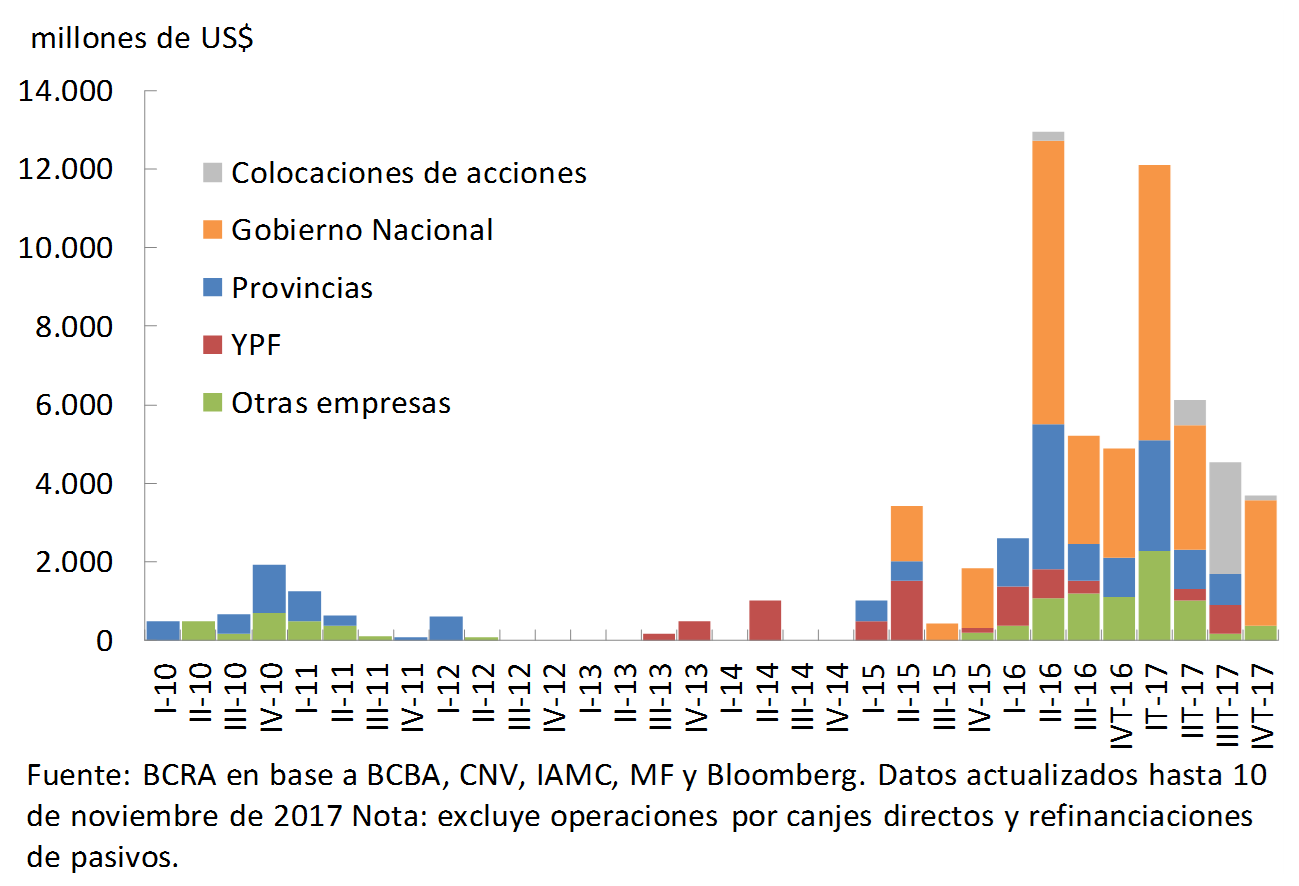
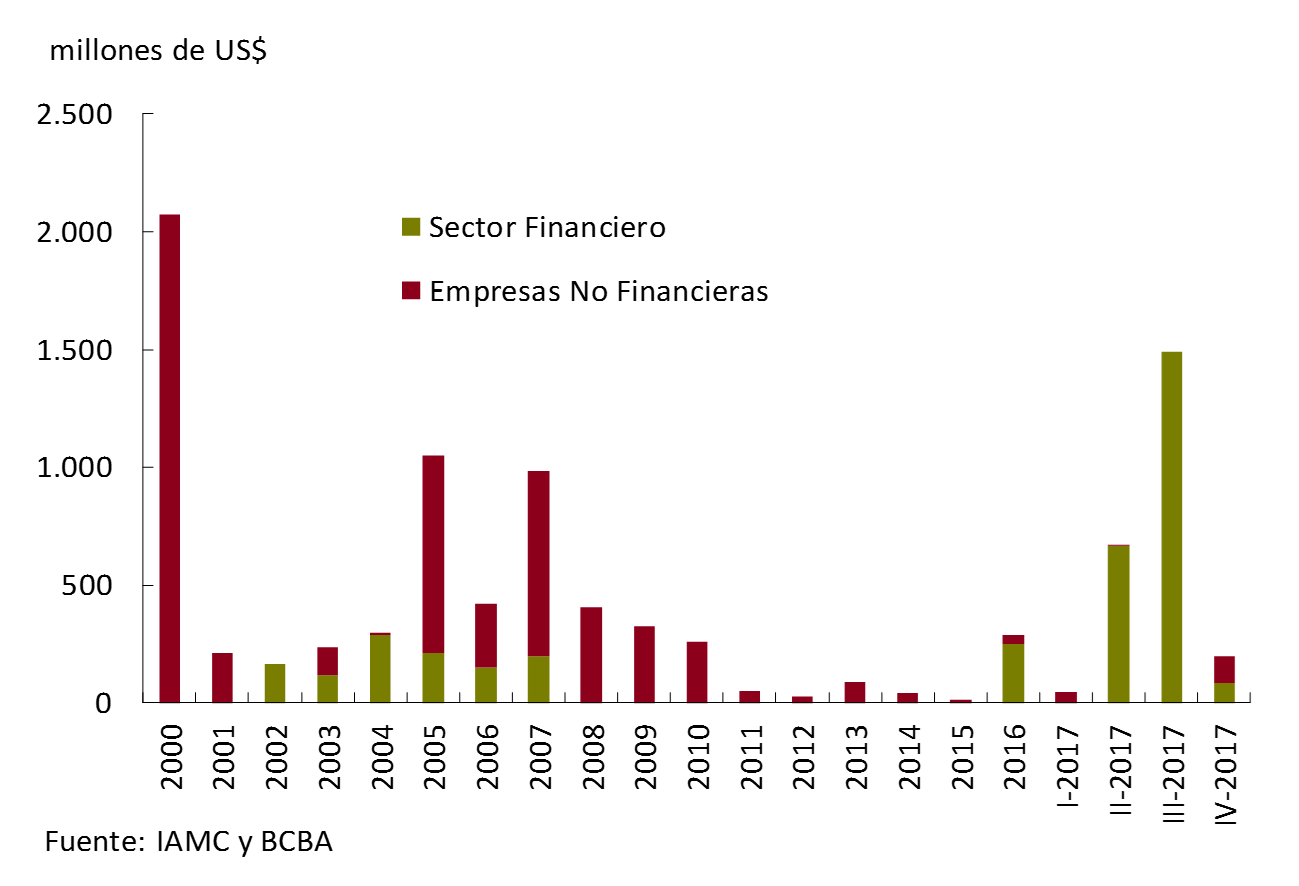
This allowed new debt placements to be carried out in the foreign markets, both by the national public sector and by the provinces and the corporate sector, although with less dynamism than observed in the first half of the year. This type of operation is allowing access to financing for larger amounts and longer terms than in the local market3. In addition, with improvements in stock market indices and lower costs of placing new shares, several capital increase operations in foreign markets have been highlighted in recent months, while additional transactions are expected in the coming months (see Figure 1.3). So far, these operations have been mostly carried out by banks, in view of the expected growth process in the financial sector (see Chapter 2). With respect to portfolio flows to Argentina, net income linked to non-resident portfolio investments continued to increase in the foreign exchange market4.
Figure 1.3 | Financing through international markets
Main external risks to financial stability
The expected scenario for the coming months continues to be positive, with sustained growth in the global economy and Argentina’s trading partners and relatively favorable credit conditions in external financial markets5. The most relevant external source of systemic risk for Argentina would be the one that operates through the financial channel: a sudden change in risk appetite (especially of emerging economy assets) in financial markets that has a significant impact on the supply of external credit and brings with it pressures on the exchange rate and an increase in its volatility. In this sense, it would operate as a materialization of refinancing and/or currency risk, based on the limited mismatches existing in the sectoral balance sheets6.
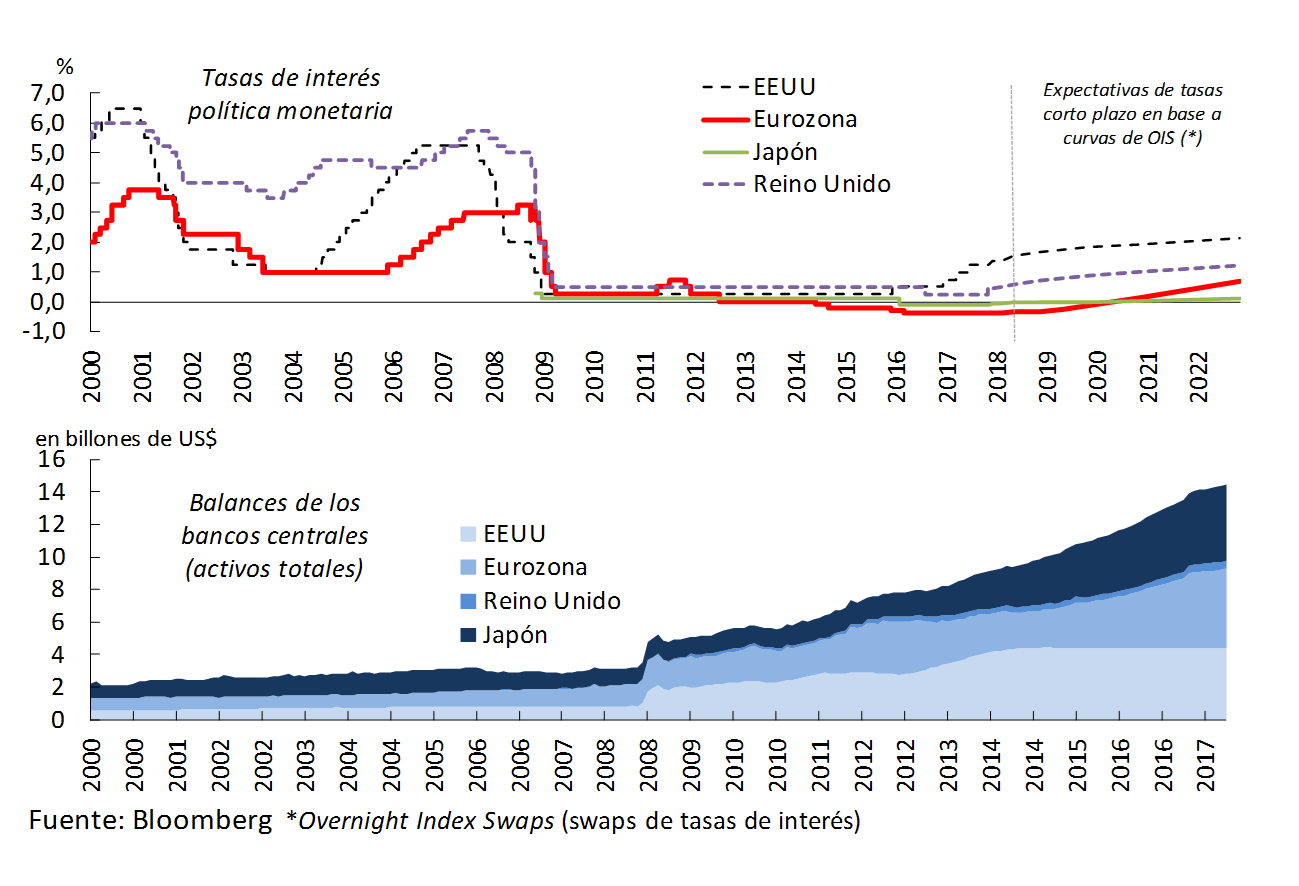
The factors that could eventually trigger an abrupt negative change (low-probability event) with respect to the baseline scenario do not present substantial changes with respect to those listed in the last IEF. It highlights the possibility that a sudden change in monetary policy expectations in the main developed economies7 (see Figure 1.4) could have an impact on risk appetite and portfolio flows to emerging economies. The potential impact would be magnified after an extended period of positioning risky assets (with valuations at all-time highs for certain segments). Unexpected changes in trade and fiscal policies in large economies could also be a factor of uncertainty. Another potential source of risks is geopolitical issues. The emerging economies themselves could cause a change of scenario if the perception of the situation of large countries (such as China or Brazil) changes.
Figure 1.4 | Monetary policy of major central banks
With an eventual closure of the possibility of financing abroad, financing alternatives for the public sector would be limited. The corporate sector, even with recent debt placements, would show a low vulnerability to this source of risk. This sector maintains relatively healthy balance sheets, with low leverage and debt service burdens in historical and international comparison (see Section 1). Faced with the possible greater volatility due to an extreme negative scenario, the BCRA’s strategy of floating exchange rate with intervention in the markets for preventive accumulation of international reserves would give more room to avoid disruptive effects. Given the country’s reinsertion into the markets, the weight of this channel would increase, making adequate monitoring necessary.
Local context
The local economic situation also continued to improve in recent months, strengthening the conditions for credit to continue gaining momentum without compromising financial stability (see Chapter 2). Given the new macroeconomic configuration, the economy is expected to be able to sustain itself in a growth phase over the next few years. This process is not without risks. However, given the strengths of the financial system (see Chapters 2 and 3), the stress exercises carried out indicate that the local context would have to deteriorate in a very extreme way – an event of very low possibility – for a substantial negative impact on the solvency of banks to be generated (see Chapter 3).
Figure 1.5 | LEBAC Interest Rate Curve and Real Rates

The growth of the economy has been consolidating8, with high diffusion at the sectoral level and job creation. The greatest dynamism is verified in sectors such as construction, financial intermediation, agriculture, fishing and transport and communications. In the future, given the growing dynamism of investment, the upward phase of this cycle is expected to be longer than on previous occasions9.
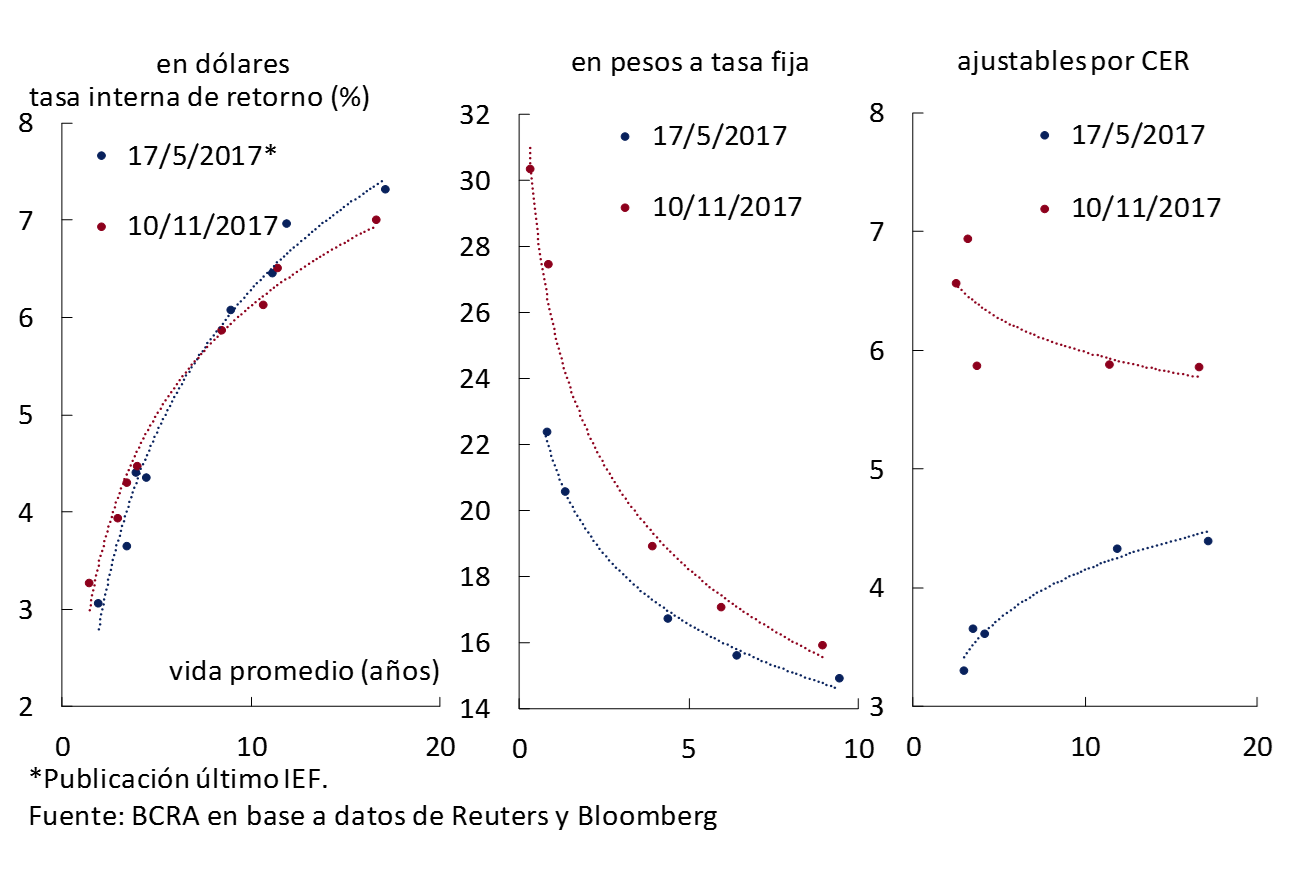
Inflation continued to decelerate in the third quarter, although more slowly than desired by the BCRA, showing some persistence of its core component. Thus, in October and November, the BCRA decided to reinforce the anti-inflationary bias of its monetary policy10. In the previous months, the BCRA carried out operations in the secondary LEBAC market, restricting liquidity conditions, which led to increases in yields and changes in the shape of its curve (see Figure 1.5). This was also reflected in the cut-off rates of the tenders of these instruments. The pass-through to market rates implied, for example, a rise in interest rates on deposits, which had an impact on the expectation of higher real returns for investors11. In the medium term, expectations of progress in the disinflation process are maintained, although at a slower pace than sought by the BCRA, as evidenced by market forecasts (for example, according to REM) and the negative slope of the yield curve of fixed-rate Treasury bonds in pesos.
Figure 1.6 | Government bond yield curves
With respect to the fiscal situation of the national government, the primary deficit was around 4% of GDP, an evolution consistent with the schedule of gradual reduction of the primary fiscal deficit (4.2% of GDP in 2017 and 3.2% for 2018). Net income from resources associated with money laundering remained stable in real terms in the first eight months of 2017 compared to the same period of the previous year. Primary expenditures expanded by 1% in real terms in the same period, highlighting a greater dynamism of social benefits. In the future, the recent announcement of a series of guidelines for policy changes that cover different dimensions, such as taxation, labor, social security and institutional, stands out. With regard to the tax reform project, it would include, among other modifications12, the taxation of the financial income of individuals currently exempt (see Box 1). On the other hand, the national government provides for coordination in the ordering of public accounts with the subnational districts.
Box 1. The financial income tax of individuals
A tax reform bill was recently sent to the National Congress that, among other changes, proposes taxing the financial income of individuals. There, rates of 15% are established for income from placements in foreign currency and in UVA/CER (without taxing exchange differences or updates) and 5% for income from placements in pesos, with a non-taxable minimum13. For the actions, the current treatment is maintained. In principle, the exemptions in force in Argentina constitute an exception with respect to what has been observed in other countries (see Section 2).
The impact of this modification on banking and capital market rates would be limited. This is because legal entities (which are already taxed) and foreign entities14 (which have a high elasticity to changes in returns), together constitute the bulk of the investment base in market instruments (such as LEBACs, public securities and FCIs). What could be verified, given the establishment of a new set of relative prices for individuals, is a change in the composition of portfolios in this segment. In this way, the final effects by type of asset will depend – in addition to the specifications of the bill to be approved and its subsequent regulation – on the elasticities of each of them for the different types of investors. Immediately after the announcement of the project guidelines, there were no significant changes in the prices of financial assets that would indicate significant modifications in the portfolios.
In order to cover the financing needs of 2018, it is expected that in the coming months the Government’s placements in international markets will become more important15. The risks perceived in the debt market remain limited, with the yield curve of bonds in dollars showing contraction in longer-term rates. In the local market, the yield curve of specie in pesos adjustable by CER moved upwards in relation to what was observed when the last IEF was published, with the same trend for the curve of fixed-rate instruments in pesos (see Figure 1.6). It is noted that the level of indebtedness remains low. The national public debt represented 51.2% of GDP as of March 31, 2017 (of which 20.1 p.p. correspond to debt with the private sector).
In a favorable economic context, in recent months there has been greater dynamism in financing to the private sector through the capital market16 (see Figure 1.7). These developments were registered at the same time as the upward trend in the cost of financing that occurred from April onwards, accompanying the rise in the monetary policy rate. The improvement in the growth rate of the amounts of fixed-income instruments was driven by the placements of financial trusts.
Figure 1.7 | Financing the private sector through debt instruments

In the current phase of the financial cycle, there is ample potential for the capital market to complement its activity with the banks as a whole, for example, by providing funding and collaborating in the process of mitigating risks linked to the granting of credit (see Chapter 3). For the impact of this type of operation to be significant, progress must be made in the process of disinflation and deepening of the markets17. It is worth mentioning that recently the PEN sent to Congress a draft Law on Productive Financing that includes various modifications to the local capital market.
Despite the progress in the construction of a yield curve for fixed-rate public securities in pesos, so far the placement of bonds in pesos by the financial sector is mostly at a variable rate and with limited terms (about 30 months on a weighted average for operations carried out since June). There were only one-off operations in pesos adjustable by inflation (which serve for banks to limit their term mismatch and in CER / UVA), which occurred prior to the increase in the yields of the debt adjustable by CER observed since mid-May18. One possibility to manage liquidity risks and mismatches for banks is given by the securitization of mortgages that they generate, transactions that in Argentina have not occurred with this type of underlying for several years. Further development of the derivatives market would also facilitate the possibility of managing risks19.
With better economic prospects and the possibility of recategorizing shares from frontier to emerging market in 2018, the value of the Merval in real terms accumulated a significant increase in 2017, reaching maximum levels20. This positive performance was accompanied by bank share prices (see Box 2). The lower cost of placing shares led to several operations in the primary market (local and international), especially by financial institutions (see Figure 1.8). The opening of this mechanism for raising capital for the local financial system is essential in view of the expected process of deepening the levels of intermediation (see Chapter 2).
Figure 1.8 | Placements of shares of Argentine companies
Box 2. Bank share prices
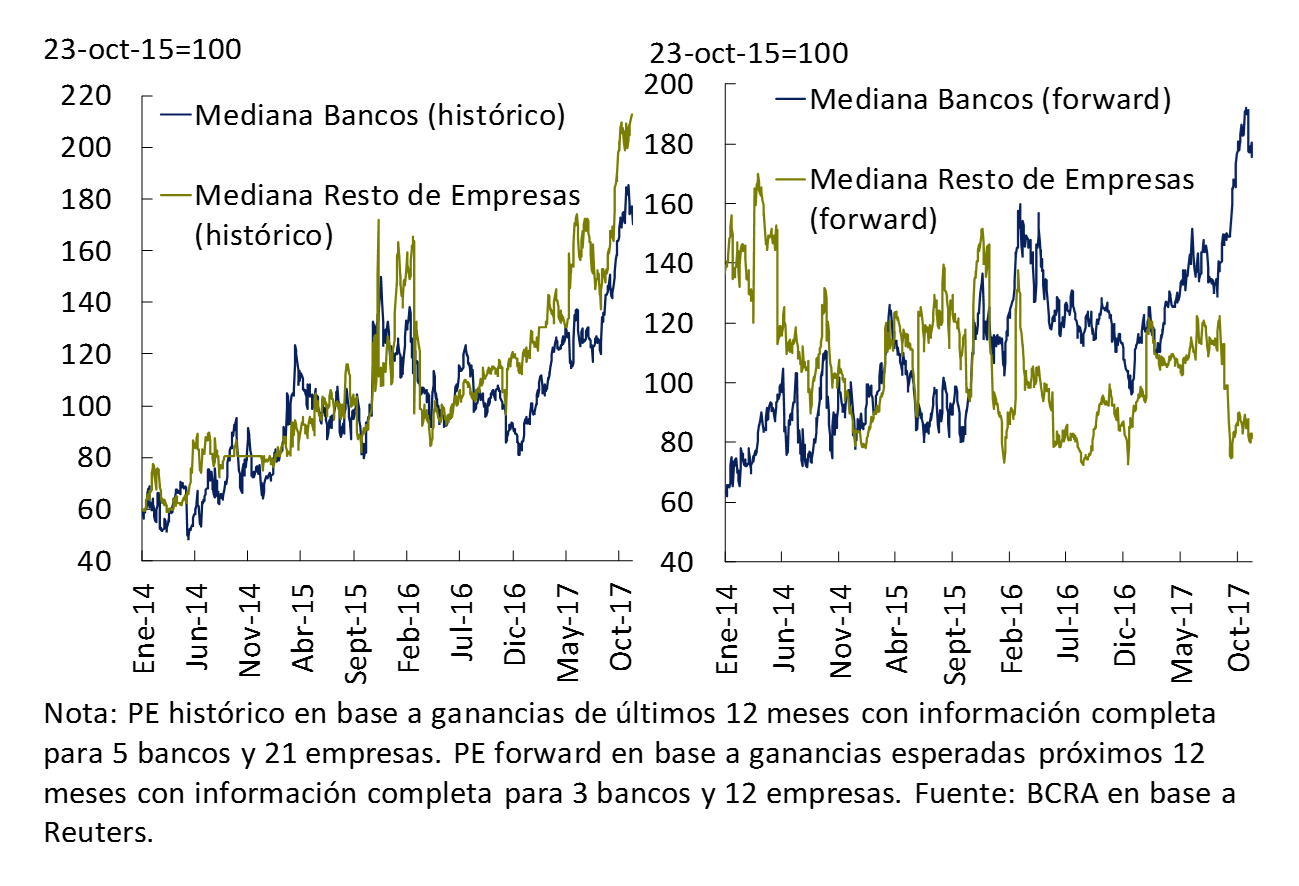
Since the publication of the last IEF, bank shares have continued to rise, reinforcing the trend of the last two years. With an improvement in expectations about macroeconomic developments, this trend was similar to that observed for the Merval (see Figure 1.9). The relative increase in the price of the portfolio of bank shares led to an increase in the price-to-recent earnings ratio (historical PE), one of the most widely used measures to monitor valuations in the stock markets. The rise in this indicator for banks was similar to that observed for the rest of the listed companies (see Figure 1.10). This development would be capturing expectations of increases in the profits of financial institutions in the future and lower volatility of the same. Taking into account market estimates of earnings expected only for the next 12 months, the forward PE ratio for financial institutions shows a clearer upward (albeit volatile) trend than the rest of the companies considered21. This is consistent with improvements in the expected earnings for the next 12 months relatively more marked for the rest of the Merval than for the banks.
Figure 1.9 | Equity price
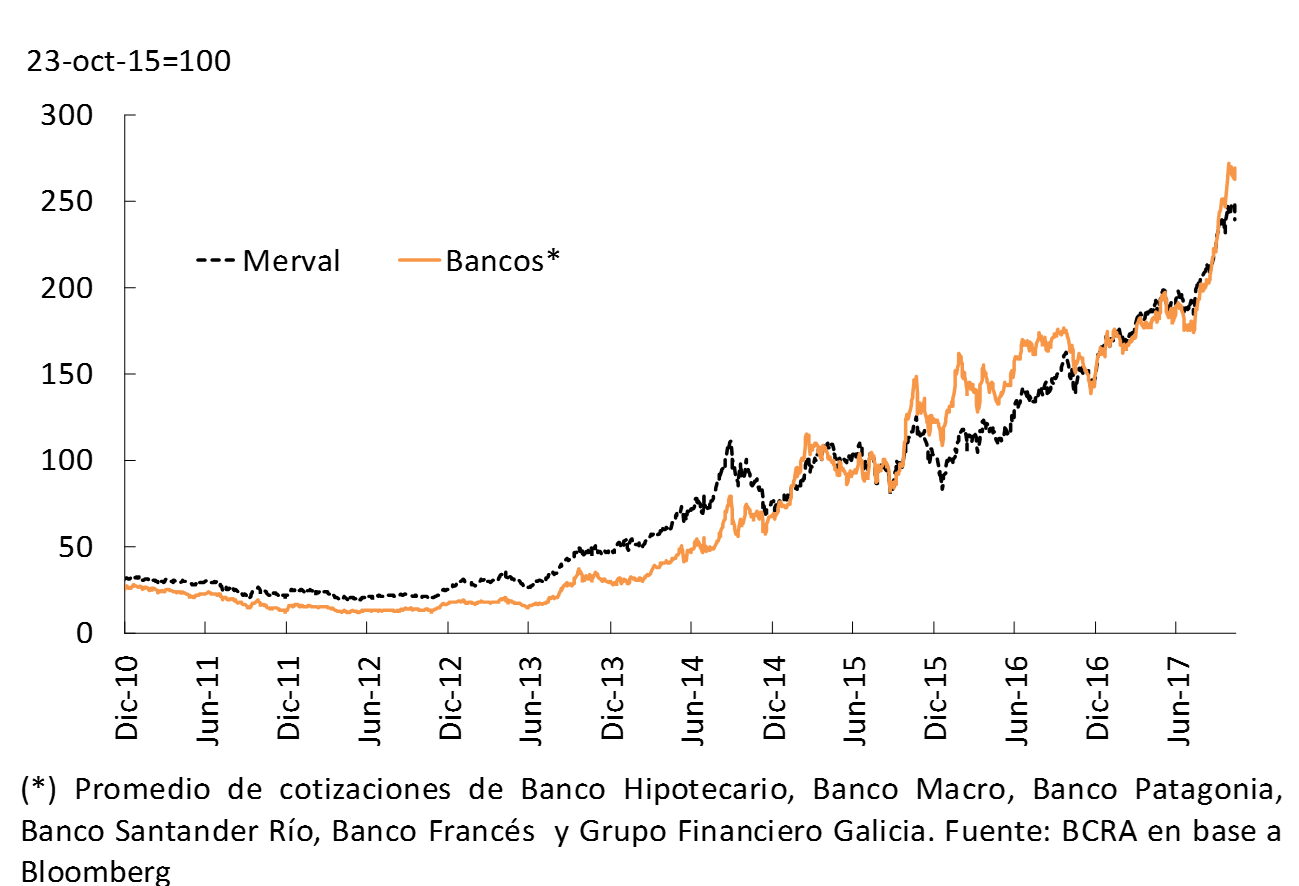
Figure 1.10 | Price-to-earnings ratio per share
2. Situation of the financial system
Unlike what was mentioned in the previous edition of the IEF, given the context of disinflation and economic growth, bank credit is expanding at relatively high rates and is beginning to recover depth in terms of GDP. Private sector deposits have not followed this dynamic, in part due to the effects of ample liquidity on the balance sheet of the financial system. However, savings channeled through banks are expected to gain momentum given the greater demand for funding driven by credit growth. Given the increase in exposure to risks inherent in the intermediation process, the institutions as a whole maintain high levels of solvency, as a result of the profitability obtained and the placements of shares during the period. The path of profitability reduction that began at the end of 2015 has slowed down since the second quarter of this year, due to higher intermediation volumes, stability in interest rate margins and relative reduction in expenses. The downward pressure on profitability is expected to be sustained as a result of the continuation of the disinflation process and greater competition, with the challenge for banks to improve their efficiency and maintain adequate levels of solvency in the current expansionary phase of the financial cycle remaining.
Financing to the private sector gains momentum
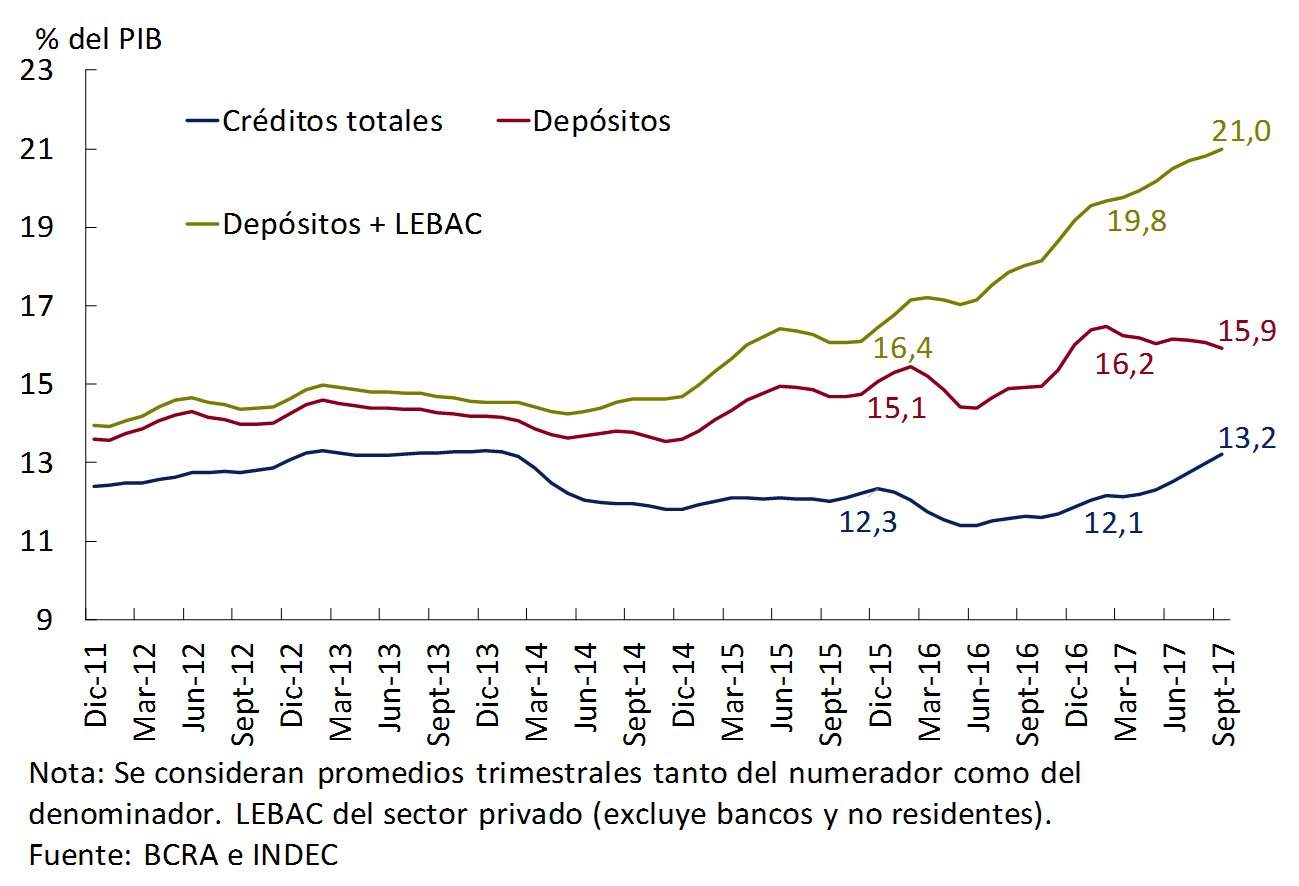
Given the new macroeconomic configuration, banks’ intermediation activity showed an improvement compared to what was indicated in the previous edition of the IEF (published in May). In recent months, total financing to the private sector has grown strongly. Its ratio to GDP rose by more than 1 p.p., to 13.2% (see Figure 2.1). On the other hand, the deposits of companies and households in terms of GDP fell slightly in recent months, to 15.9%22. It is worth mentioning that, unlike what has been recorded in recent decades, and given the change in economic policies promoted since the end of 2015, a certain synchronization between the economic cycle and the financial cycle would be observed (see Box 3).
Figure 2.1 | Brokering with the private sector – As % of GDP
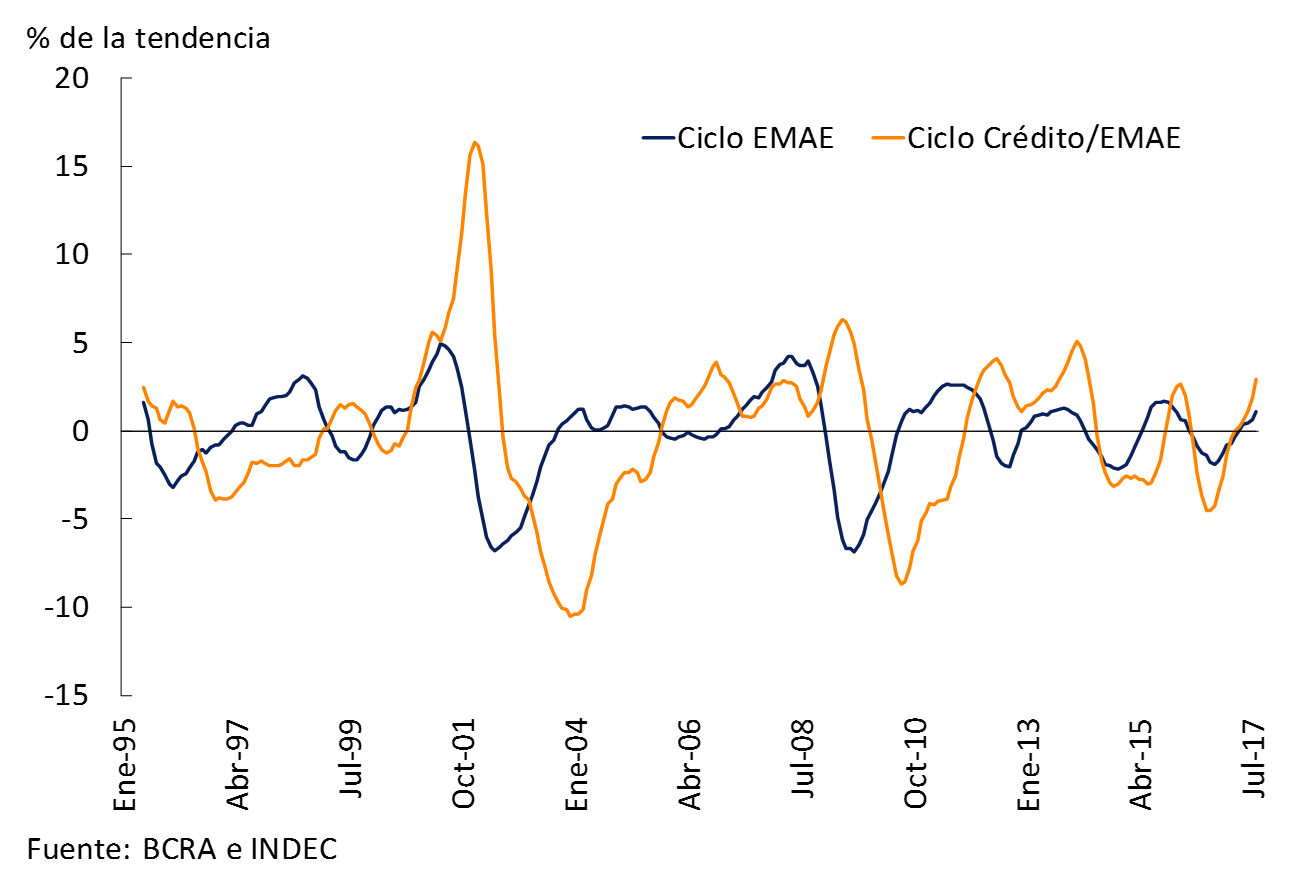
Box 3. Financial cycle and business cycle
Cycles can be characterized by their frequency (how often they are repeated) and their amplitude (how far they are from their long-term trend)23. In the case of Argentina, over the past 20 years the financial and output cycles have been inherently variable in terms of these two characteristics24 (see Figure 2.2). Both cycles have abrupt and marked contractions, but they tend to reverse relatively quickly, giving rise to periods of expansion longer than those of contraction. In recent history, the financial cycle in Argentina has tended to show greater breadth and a certain lag compared to the economic cycle. This is a difference from what usually happens in advanced economies, where the financial cycle is longer than the business cycle. Since 2016, a greater correlation between the two cycles has been observed.
Figure 2.2 | Evolution of the business cycle and financial cycle
The balance sheet of the financial system expanded throughout 2017, with important changes in its composition, within the framework of adequate compliance with prudential regulatory requirements. As of September, net assets25 increased 42.1% YoY or 14.6% YoY in real terms, accelerating compared to the previous IEF. Credit to the private sector reached 50% of total assets, increasing by almost 8 p.p. compared to the level in March 2017 (see Table 2.1). On the other hand, in the last six months, the relative importance of liquid assets and the holding of monetary regulation instruments has decreased. Bank financing to the public sector – at its three levels – currently stands at 9% of the total assets of the system. This level is limited in historical terms, in part, due to the prudential regulatory framework implemented by the BCRA. This framework was recently modified to include even stricter limits (see Box 4).
Table 2.1 | Equity situation – Financial system

Box 4. Regulatory changes on banking exposure to the public sector
In order to continue strengthening the prudential framework regarding banks’ exposure to the public sector, this institution recently established new parameters to authorize banks to take on debt from provincial and municipal governments, setting stricter limits on this exposure. Communication “A” 6270 that came into force last August is aligned with the provisions of the Fiscal Responsibility Law. On the one hand, it maintains part of the requirements that this institution must consider before giving its agreement for entities to finance a local government (for example, that the request for debt is analyzed by the Ministry of Finance and that said debt has an income guarantee). On the other hand, as a novelty, the debt/revenue service ratio is significantly reduced so that the provincial/municipal state can obtain the approval of the BCRA: it went from 40% to 20%. This ratio, which previously computed only the debt with the financial system that has guarantees, as of Communication “A” 6270 includes debt contracted abroad and that contracted with the financial sector that is not guaranteed.
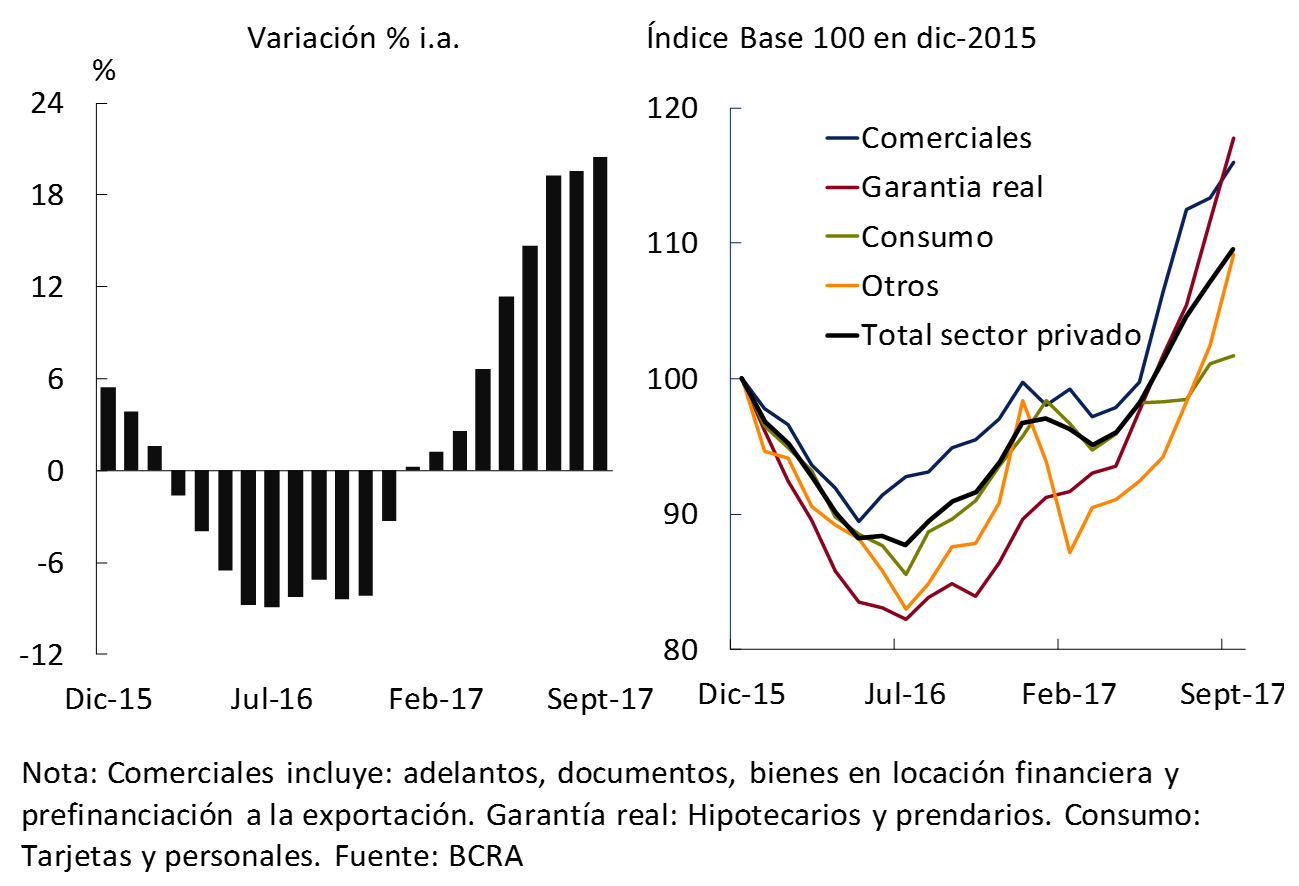
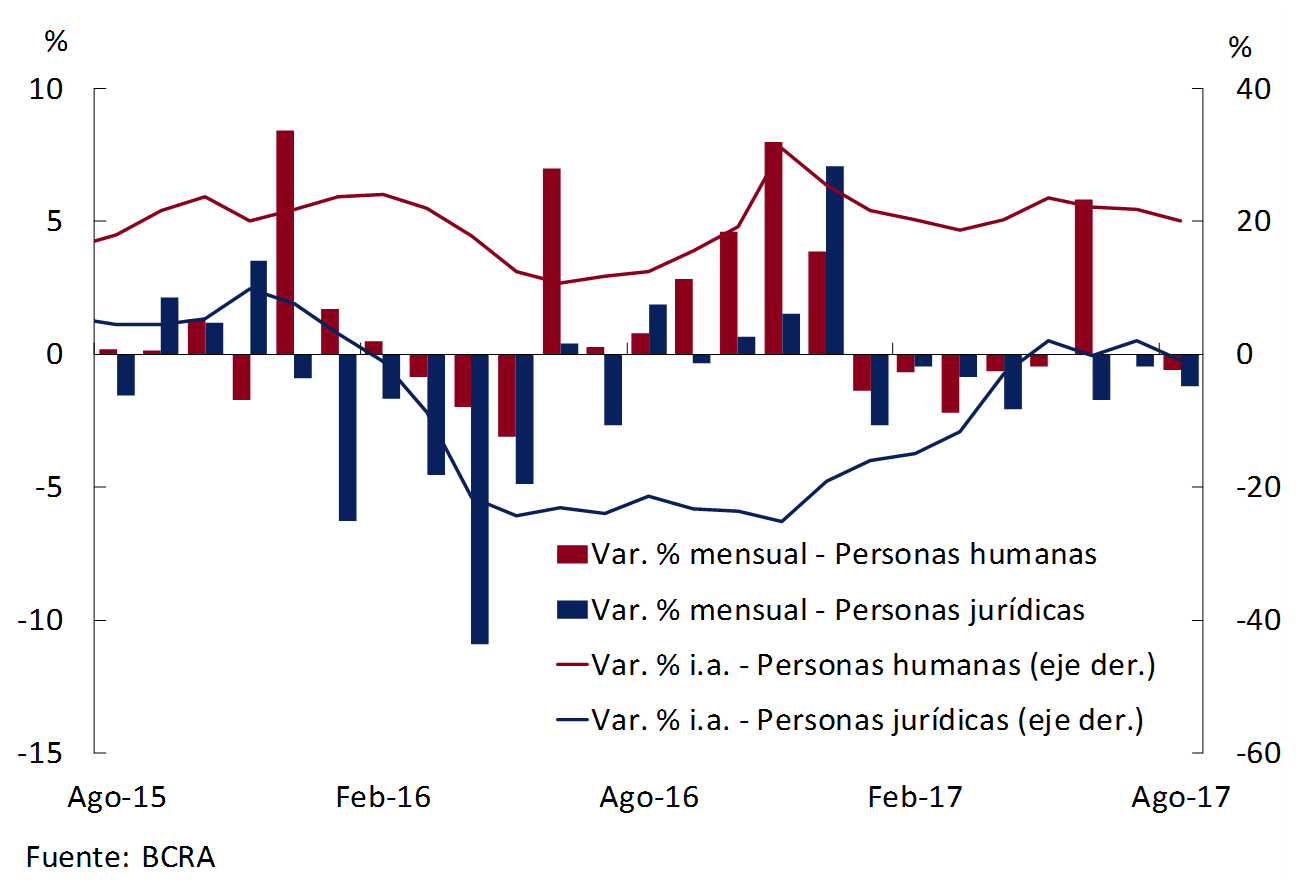
Since the beginning of 2017, and with greater intensity in recent months, bank financing to the private sector has been growing in real terms significantly and uninterruptedly (see Figure 2.3). As of September, the total credit balance to this sector increased by 49.4% YoY or 20.5% YoY when adjusted for inflation, the largest variation in the last five years26. Compared to what was published in the last IEF, all credit lines showed a positive evolution adjusted for inflation, highlighting the segment with real collateral (mostly mortgage loans) and the commercial segment (mainly export pre-financing). This occurred in a context in which the active interest rates traded were reduced.
Figure 2.3 | Total credit balance to the private sector. In real terms
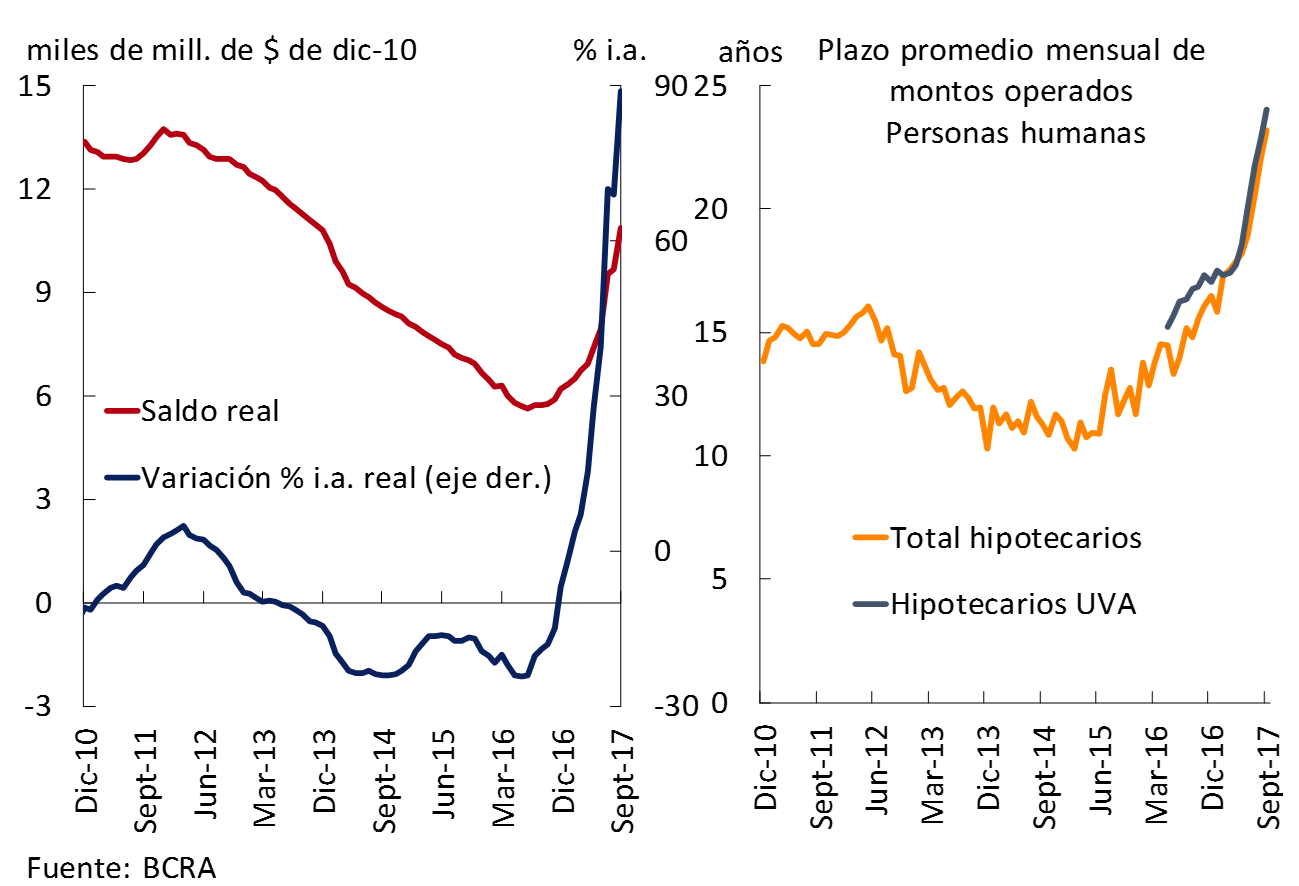
The low level of household indebtedness (see Chapter 3), coupled with existing housing needs and the implementation of various policies by the BCRA (see Regulatory Annex), including UVA loans, accounted for much of the performance of mortgage lines (see Figure 2.4). This type of credit to individuals considerably increased its average granting term, going from almost 12 years at the end of 2015 to more than 23 years at the end of the third quarter of 2017. For the aggregate of the financial system, from the launch of the UVAs in April 2016 to the beginning of November 2017, the amount of loans operated in UVA accumulated more than $54,800 million, corresponding 69% to mortgage lines.
Figure 2.4 | Balance of mortgage credit to families
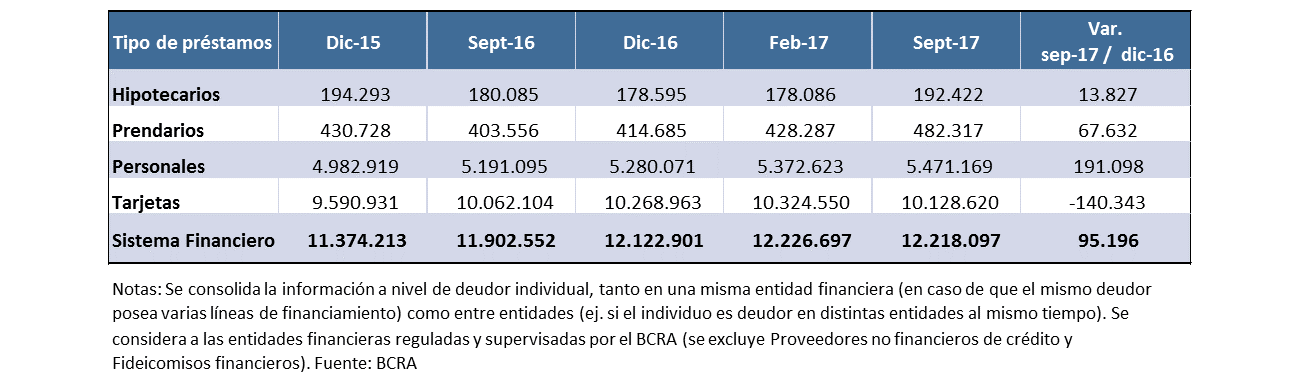
The greater intermediation observed in mortgage loans to households was also reflected in the increase in the number of debtors in this segment, reaching a total of almost 192,422 as of September 2017 (see Table 2.2). In addition, debtors with personal and pledge loans also showed an increase so far this year.
Table 2.2 | Number of debtors in the financial system. Human persons – In units
In a context where liquidity levels are still high (albeit falling), and passive interest rates in real terms have not yet consolidated in positive territory, so far in 2017 total private sector deposits have grown at a slower rate than that observed for loans. These relative behaviors are expected to continue in the short term (see Box 5). Private sector placements accumulated a nominal increase of 37.2% YoY in September, equivalent to 10.6% YoY when adjusted for inflation, a performance mainly explained by deposits from individuals (see Figure 2.5) and, within these, by deposits in foreign currency (with an increase of 84.4% YoY.27)28. Private sector deposits accounted for 59% of funding in September, gaining 2.7 p.p. compared to March and falling 2.1 p.p. compared to the level of a year ago29.
Figure 2.5 | Balance of total private sector deposits. Change % in real terms
Box 5. Interaction between the evolution of credit, liquid assets and deposits
Assuming that loans will continue to expand strongly in the coming years, it is relevant to analyze possible dynamics regarding the structure of the system’s balance sheet. A three-year projection exercise of the balance sheet is then presented, assuming different real growth rates of credit30, which are contrasted with a projection of deposits31. In particular, if credit continues to be more dynamic, the increase in deposits would be insufficient to meet funding needs. Thus, institutions would continue to reduce voluntary liquidity to a “minimum tolerable” level32. Once this source of funding is exhausted, for credit to grow at the assumed rate, an additional source of resources would be required: for example, deposits to grow above what was initially projected.
Given the configuration of the balance sheet, for different credit trajectories and “minimum tolerable” levels of liquidity, a general idea can be obtained regarding when (threshold) the system will require stronger growth in deposits (see Table 2.3). For example, if credit grows at 1.2% real monthly33 and banks do not want their voluntary liquidity in pesos to be less than 20%34 of deposits, it is estimated that the threshold would be reached by mid-2019. This date is advanced (delayed) the higher (lower) the growth of credit and the higher (lower) the “tolerable minimum” of liquidity.
Table 2.3 | Estimation of the moment of exhaustion of voluntary liquidity
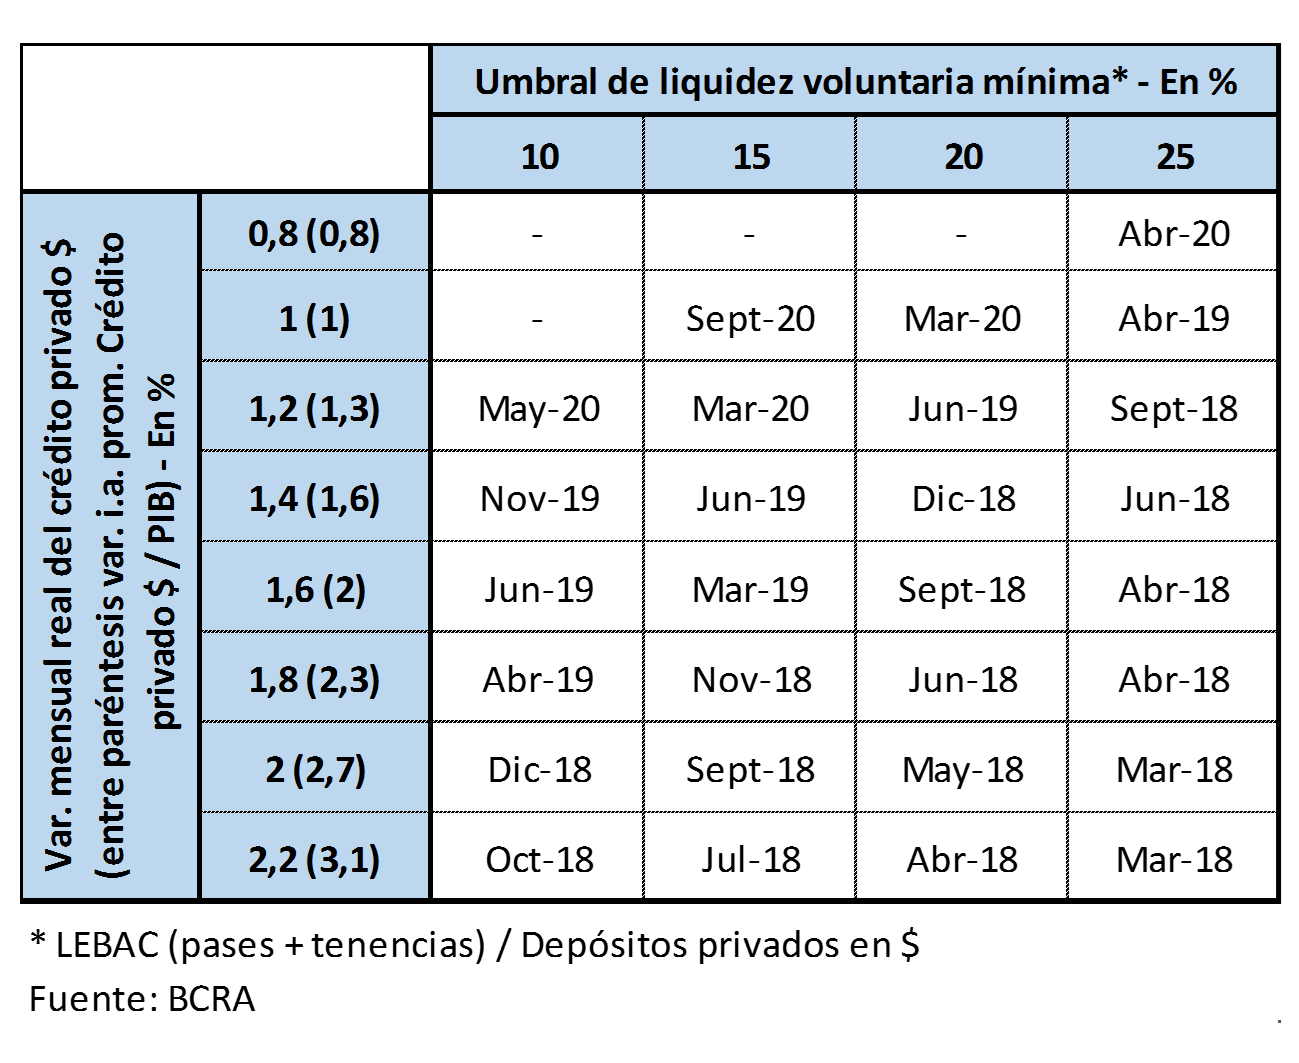
In general, it is perceived that in the short term the financial system at the aggregate level35 has surplus liquidity to sustain the increase in credit without the need to resort to other sources of funding or make a significant additional effort, in terms of interest rates, to attract deposits.
Credit from the financial system to the private sector is expected to sustain its expansionary phase over the next few years. With the consolidation of the economic growth process (with a significant boost from investment, and in particular construction), and the continuation of the disinflation process, a favorable scenario would be created for the continuation of the deepening of credit to the productive sector and to households (especially mortgage credit). In this regard, at the international level, there is important empirical evidence showing a strong association between sustained processes of disinflation and significant credit growth (see Box 6).
Box 6. Disinflation processes and depth of the financial system
In general, it is observed that disinflation processes tend to have a positive impact on the economic and social structure of a country, often resulting in a favorable impact on the growth of the economy36. One channel, for example, is related to the redistributive improvement that is generated. On the other hand, in contexts of lower inflation, sources of uncertainty are reduced, enabling families and companies to make better savings and investment decisions. In this line, it is possible to suggest that these events are associated with improvements in the levels of financial intermediation, making credit allocation more efficient, positively impacting the aggregate demand and supply of the economy. A valid question then is, is it empirically observed that economies that go through a “sustained” process of disinflation see a significant increase in the credit-to-GDP ratio?
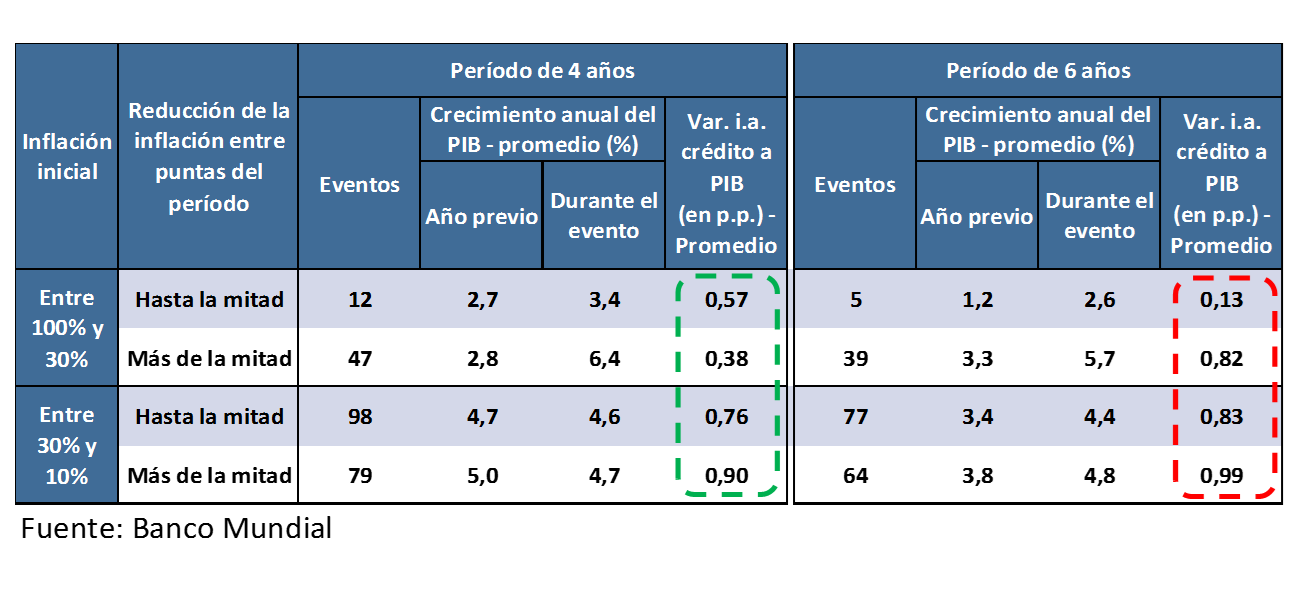
The following is a simple description of the evidence—from the mid-1960s to the present—of association between international experiences of disinflation and the deepening of credit. The information presented here does not attempt to address statistical aspects of complexity, but only seeks to show correlations based on cases collected from the World Bank database37. The analysis considered all economies with information, although special attention was paid to those with a moderate credit depth—less than 25% of GDP—and that had initial inflation levels of more than one digit38. On this set, the performance of financial intermediation was then examined, in particular the credit-to-GDP ratio. This analysis was disaggregated by considering the initial level of inflation and the different intensity of the disinflation process evidenced over periods of 4 and 6 years after the time of the beginning of disinflation .
From the data observed, it emerges that in the experiences of disinflation in economies with moderate depth of credit to the private sector, the latter performed more than outstandingly, with growth in the credit-to-GDP ratio that in some cases reaches 1 p.p. per year on average, in contexts of output expansion (see Table 2.4)39. Moreover, in general, the rate of increase in the level of credit depth tends to be accentuated in relatively longer episodes of disinflation.
Table 2.4 | Disinflation processes. International evidence
The system’s operational infrastructure maintained its trend of expansion during 2017. The number of branches in the country amounted to 5,385 as of September, growing 1.3% compared to the same month of the previous year. The number of ATMs, self-service terminals and other automatic devices increased by 6.1% YoY to 20,652 units (see Box 7). It should be noted that in 2017 the BCRA continued to promote the deepening of access to financial services throughout the country, taking measures to simplify the mechanisms for opening branches, as well as to promote the reduction of the operating costs that they must face (see Box 8).
Box 7. Measuring financial inclusion in Argentina
The Central Bank, within the framework of its purpose of promoting economic development with social equity, has as one of its main objectives to promote the “financial inclusion” of the population; that is, to expand the levels of access and use to financial services. To this end, as a starting point, it is necessary to carry out an analysis of the state of financial inclusion in the country through the development of specific metrics for its different components (access, use and quality).
Focusing on the dimension of access to financial services, key in terms of financial inclusion, given that the number and coverage of access points (PDAs) define the possibilities of users to make use of financial services. In our country, PDAs are bank branches, automated teller machines (ATMs), self-service terminals and automated offices. As of September 2017, the financial system had a total of 26,037 PDAs nationwide, distributed in the 23 provinces and in the Autonomous City of Buenos Aires (see Table 2.5). Almost half of the total number of FLW in the country is located in 2 jurisdictions: CABA and the Province of Buenos Aires, with marked differences in their distribution at the provincial level.
Table 2.5 | Access Points (PDAs). Distribution by Province of FLW, adult population and area
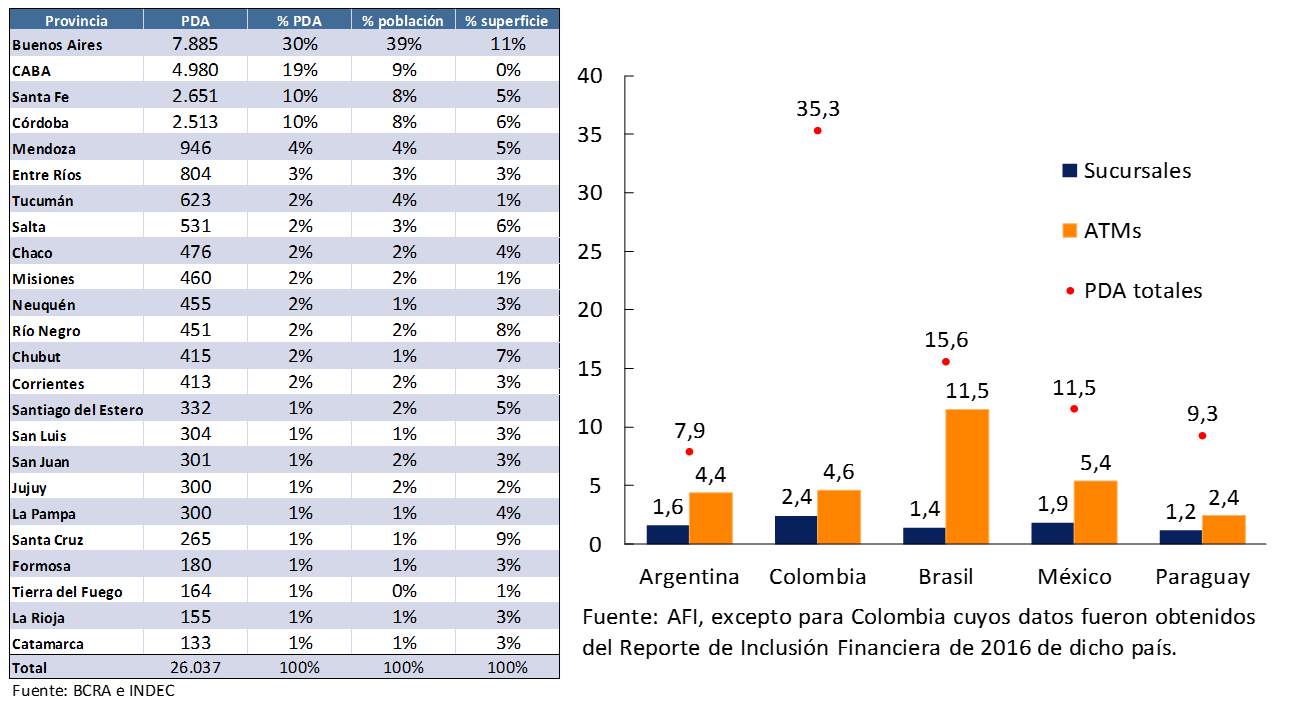
Considering the FLW per inhabitant, Argentina currently has 7.9 FLW per 10,000 adults (see Table 2.5). Broken down by type of PDA, it can be seen that there are 1.6 branches and 4.4 ATMs per 10,000 adults, levels that are still below those recorded in other countries in the region.
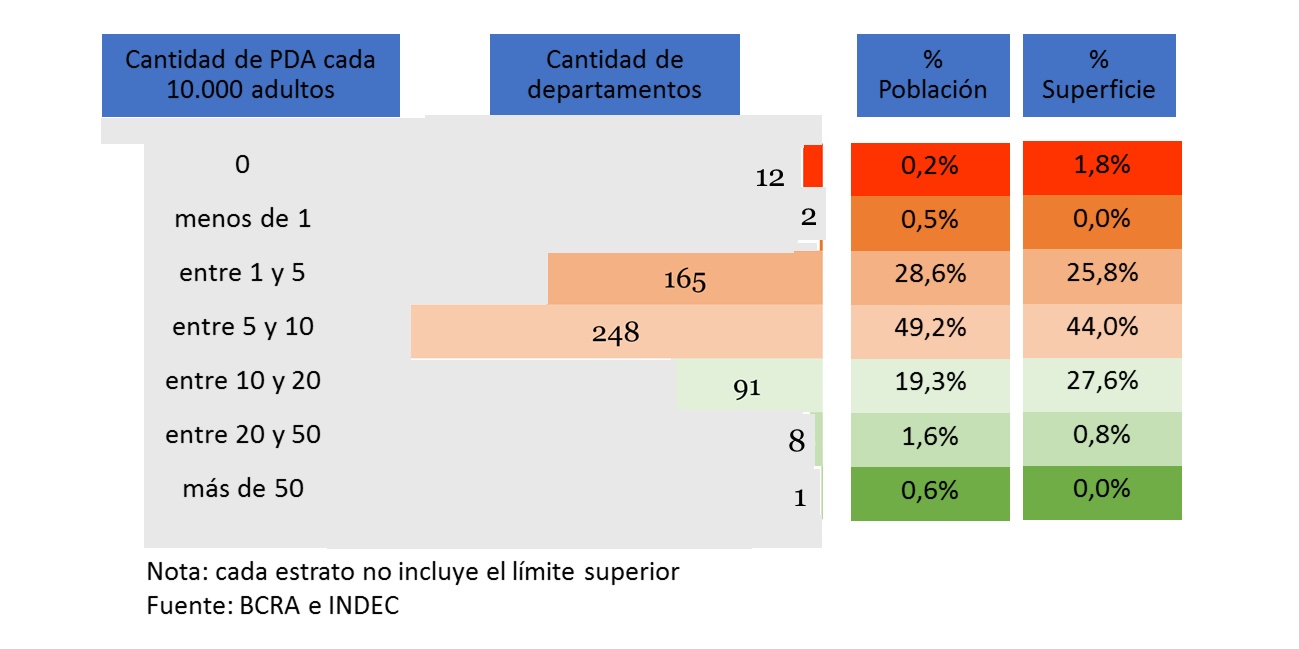
Another indicator to measure access to financial services refers to the percentage of administrative units that have at least one access point. An initial analysis was carried out measuring the number of FLW in relation to the adult population by department (see Figure 2.6), showing that: (i) 97.3% of the departments – out of a total of 527 – have at least one ADP for every 10,000 adults; (ii) 12 departments (2.2%) do not have FLW; (iii) About 78% of the adult population lives in departments that have between 1 and 9.99 PDA per 10,000 adults; (iv) only 100 departments, in which 22% of the adult population lives, have more than 10 FLW per 10,000 adults. The access indicators presented here show that there is still ample potential for Argentina to continue deepening and improving society’s access to financial services.
Figure 2.6 | ADP per 10,000 adults and population and area coverage
Box 8. Measures that promote the expansion of the branch network
Since the publication of IEF I-17, the BCRA has implemented a set of measures aimed at promoting the expansion of infrastructure for the provision of financial services. In particular, by promoting the elimination of unproductive procedures and costs, these actions significantly reduce the time to open branches (whose processing could sometimes take more than a year). Among them, the following stand out:
• The reduction of the requirements for the opening of branches: only the minimum security measures (A6275) are required.
• The unification of the different types of operating houses of the entities into “branches”, authorizing them to carry out all banking operations (A6271).
• The modernization of the minimum physical security requirements in the entities, adapting them to the risk of the operation of each unit (A6272).
Profitability and creditworthiness performance
As mentioned in Chapter 1, inflation continued to slow in the third quarter of 2017. Given the interaction between the disinflation process and the composition of the financial system’s balance sheet, particularly its funding, the challenge remains for banks to ensure adequate levels of profitability and solvency40. In other words, lower levels of inflation will continue to be reflected in diminishing profits from taking funds with transactional deposits and lending them at higher nominal rates. Moreover, a context of increasing competition together with higher remuneration in real terms to depositors, will add downward pressures on profitability. In this framework, financial institutions must make efficiency gains to adequately accompany the process of recomposition of financial intermediation currently underway.
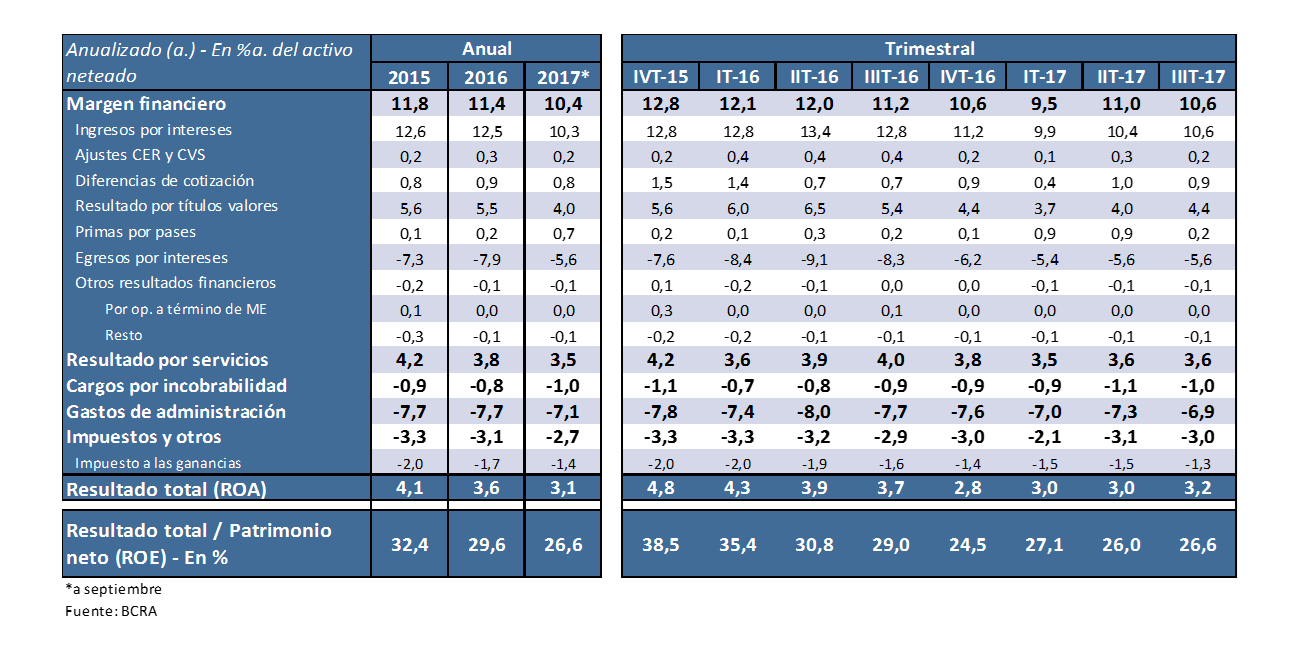
Unlike what was observed at the time of publication of the previous IEF (May 2017), when the profitability of the aggregate financial system verified a downward trend that began at the end of 2015, in the second and third quarters of this year the profits of the entities tended to stabilize. The ROA (return on assets) of the financial system reached 3% annualized (y) during the second quarter of 2017, a level similar to that observed in the first quarter of the year, increasing to 3.2% yr. in the third quarter (see Table 2.6). Despite this performance at the margin, profitability in the accumulated January-September 2017 totaled 3.1% of assets at the system level, while throughout 2015 and 2016 it reached 4.1% and 3.6% of assets, respectively.
Table 2.6 | Profitability of the financial system
The financial margin of banks increased slightly in the last 2 quarters of 2017. When compared to the first quarter of the year, there is a recovery in interest income in terms of assets, mainly due to the sustained positive performance of credit to the private sector. On the other hand, the financial margin includes the recomposition in the differences in quotation obtained by the entities, in view of the evolution of the nominal peso-dollar exchange rate observed in the period. These movements more than offset the slight increase in financial expenditures for interest, in a scenario of slightly higher interest rates paid for fixed-term placements (a movement partly offset by a certain decrease in the weighting of the latter in the total). On the other hand, although the anti-inflationary bias of monetary policy strengthened during the period (see Chapter 1), the results for public securities and premiums for passes remained unchanged in recent quarters, due to the reduction in the portfolio of these instruments.
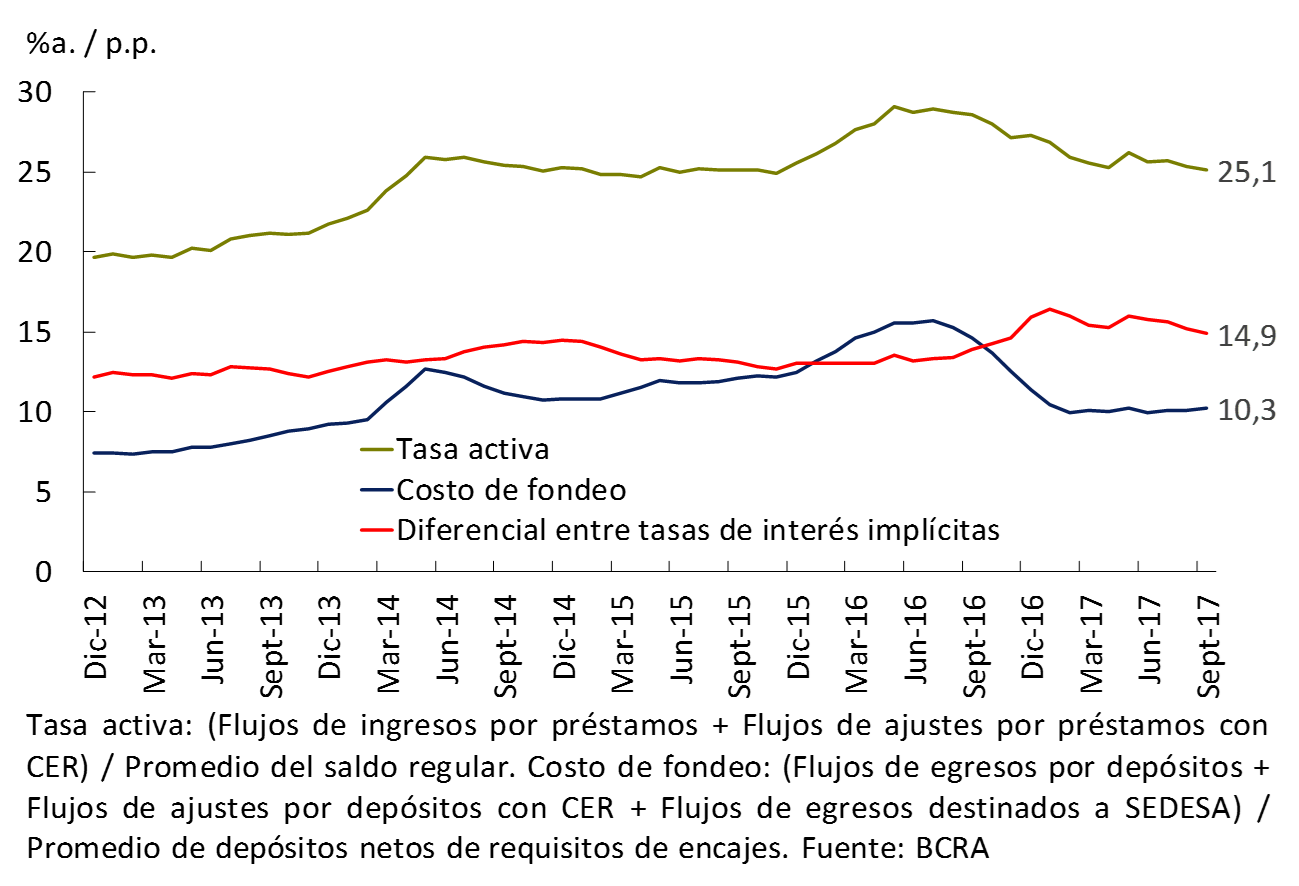
In this context, it can be seen that the differential between implicit lending rates and the implicit funding cost for deposits—both in pesos—of financial institutions increased slightly in year-on-year terms as of September 201741, from a level close to 13.9% to 14.9% (see Figure 2.7). This year-on-year increase originated in a relatively steeper reduction in the cost of funding for deposits in pesos, compared to the fall in the lending rate in the same period. The former was influenced by the increase in the weighting of transactional deposits, while the latter was conditioned by an increase in the share of longer-term loans42. However, if we consider the maximum value observed at the beginning of 2017, throughout this year the entities gradually reduced this differential in implied rates.
Figure 2.7 | Estimation of the implicit interest rate* and the implicit funding cost for deposits*- Items in national currency – Financial system. Accumulated 3 months mobile
Results from services generated by banks stabilized, reaching 3.6% of assets in both the second and third quarters of the year (slightly above the beginning of 2017). Beyond this evolution in the margin, this source of income for banks totaled 3.5% of assets so far in 2017, below previous years. It should be considered that the policies promoted by the BCRA continue to promote greater competition in the financial system. In addition to the entire set of deregulation initiatives taken throughout 2016 and the beginning of this year43, in recent months the BCRA implemented the relaxation of the regulations on complementary activities of entities, giving banks the possibility of joining the fintech market (see Section 3). It is expected that, in a context of greater dynamism in credit and an expansion of the financial products provided to companies and households, the results of the entities’ services will be consolidated as a source of income.
Bad debt charges show a very slight increase in the margin, reaching around 1.1/1% of assets in the second and third quarters of the year. This development is taking place in a context in which banks have begun to gradually expand their debtor base, with NPL ratios remaining low (see Chapter 3).
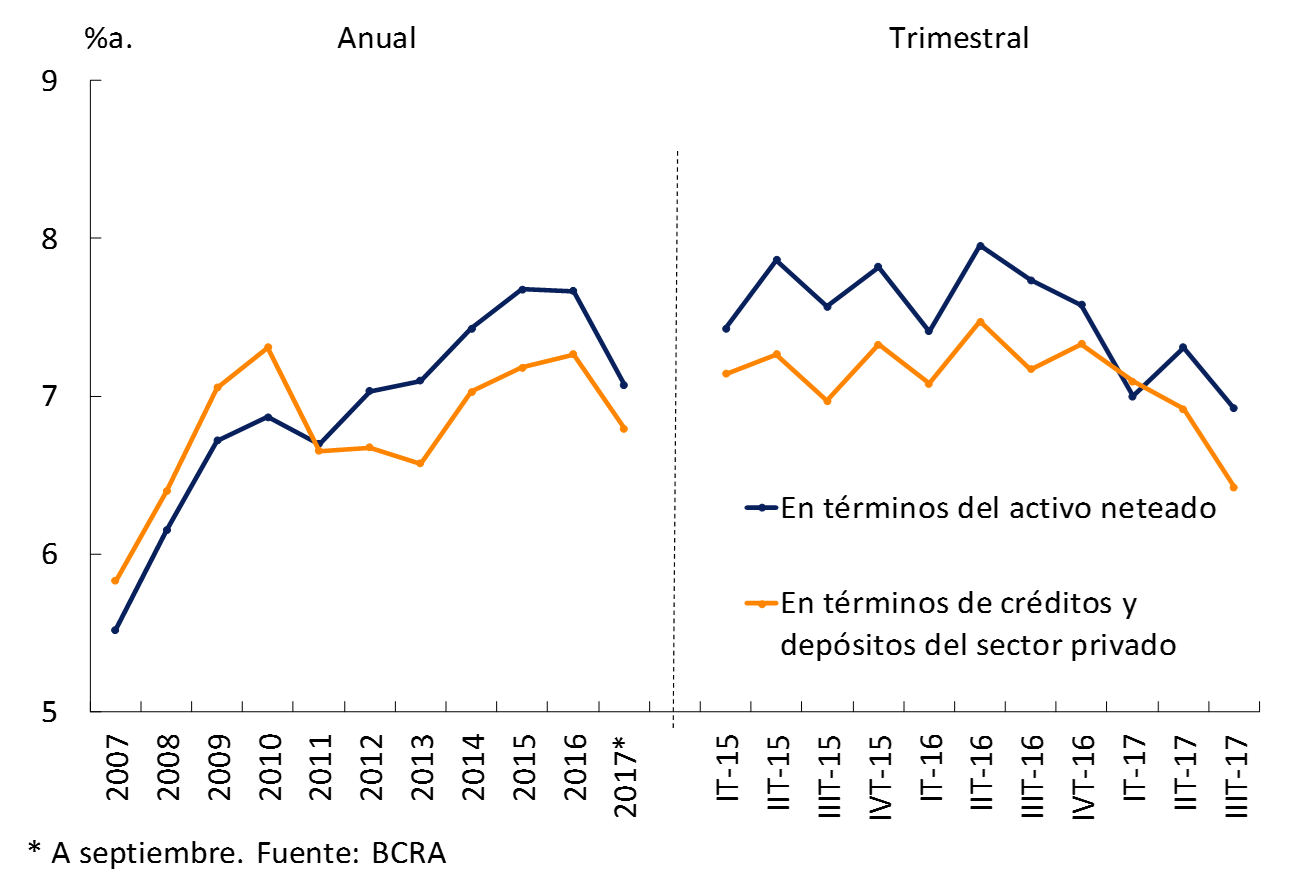
In 2017, banks’ administrative expenses continued the downward trend that began in the second half of last year (see Figure 2.8). However, they still remain at high values from a historical and international comparison. Thus, in the third quarter of the year they reached 6.9% of assets, bringing the cumulative figure for January-September to 7.1% of assets, below the ratios of the previous 3 years44. The value observed for administrative expenses in 2017 continues to be well above those observed in other countries in the region (between 2% and 3%45). With respect to the achievement of higher levels of efficiency by local banks, which is essential in the current context, according to BCRA estimates, there would be ample room to improve it, in terms of production and economies of scale (see Section 4). In this regard, it should be noted that the BCRA accompanies this process by promoting the reduction of banks’ costs and promoting the use of new technologies (see Box 8, Regulatory Annex and Chapter 5 of previous editions of the IEF).
Figure 2.8 | Administrative expenses – Financial system
Robustness in the composition of local bank capital
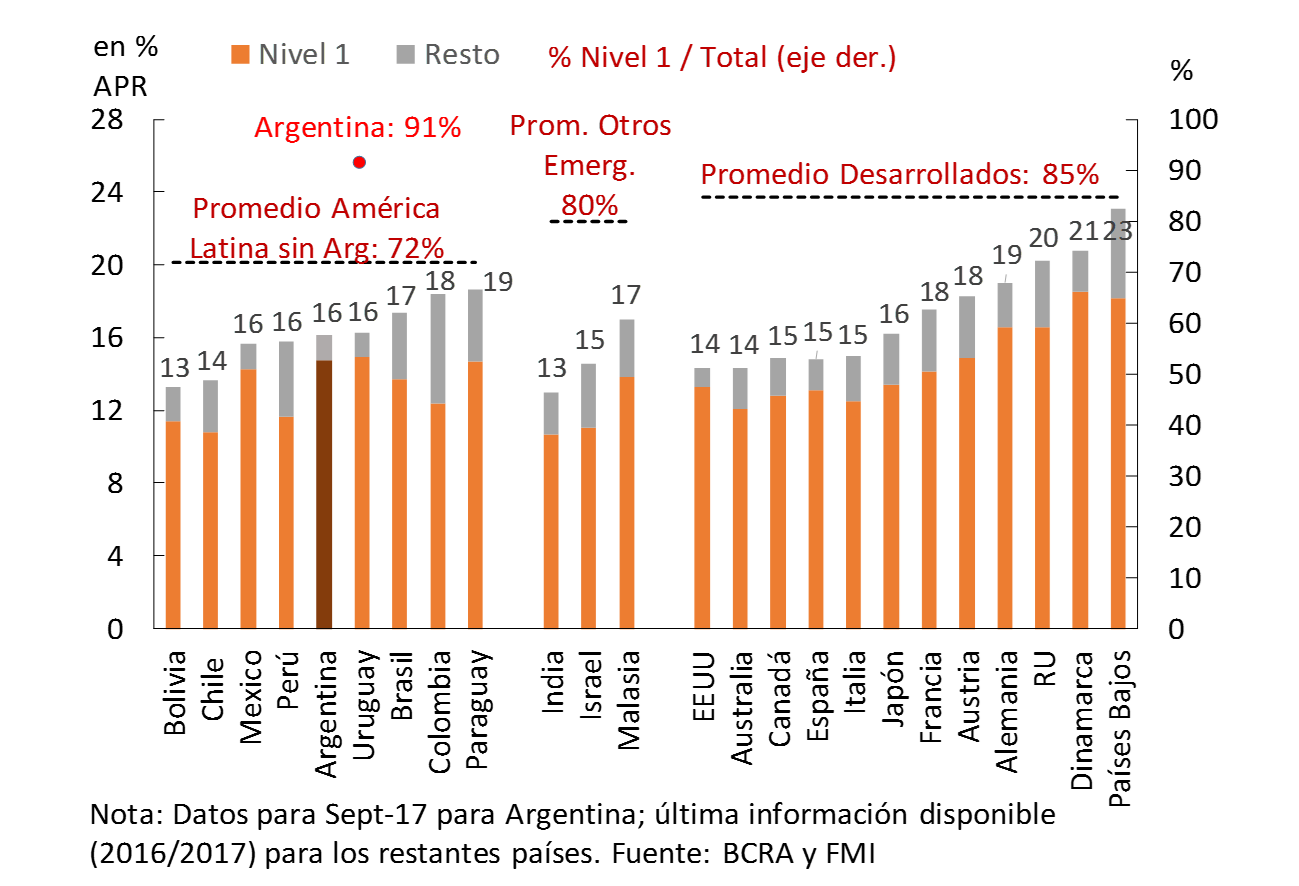
At the end of the third quarter of the year, the financial system continued to observe relatively comfortable levels of solvency, slightly lower than six months earlier (publication of the IEF I-17), reflecting the effects of the expansion of credit to the private sector. The capital integration of the financial system totaled 16.2% of risk-weighted assets (RWA), almost 0.7 p.p. less than last March, an evolution that was verified in all groups of banks. Level 1 integration, which has the best capacity to absorb eventual losses, represents more than 91% of the total. This value is higher than that observed in other economies in Latin America (average of 72%) and developed countries (average of 85%) (see Figure 2.9). In the current context of strong expectations of expansion in the sector (involving the need for funding and greater exposures to risk on the balance sheet), a growing number of institutions have been making capital increase decisions (see Box 9).
Figure 2.9 | Level and composition of capital integration
Box 9. Bank capitalization decisions
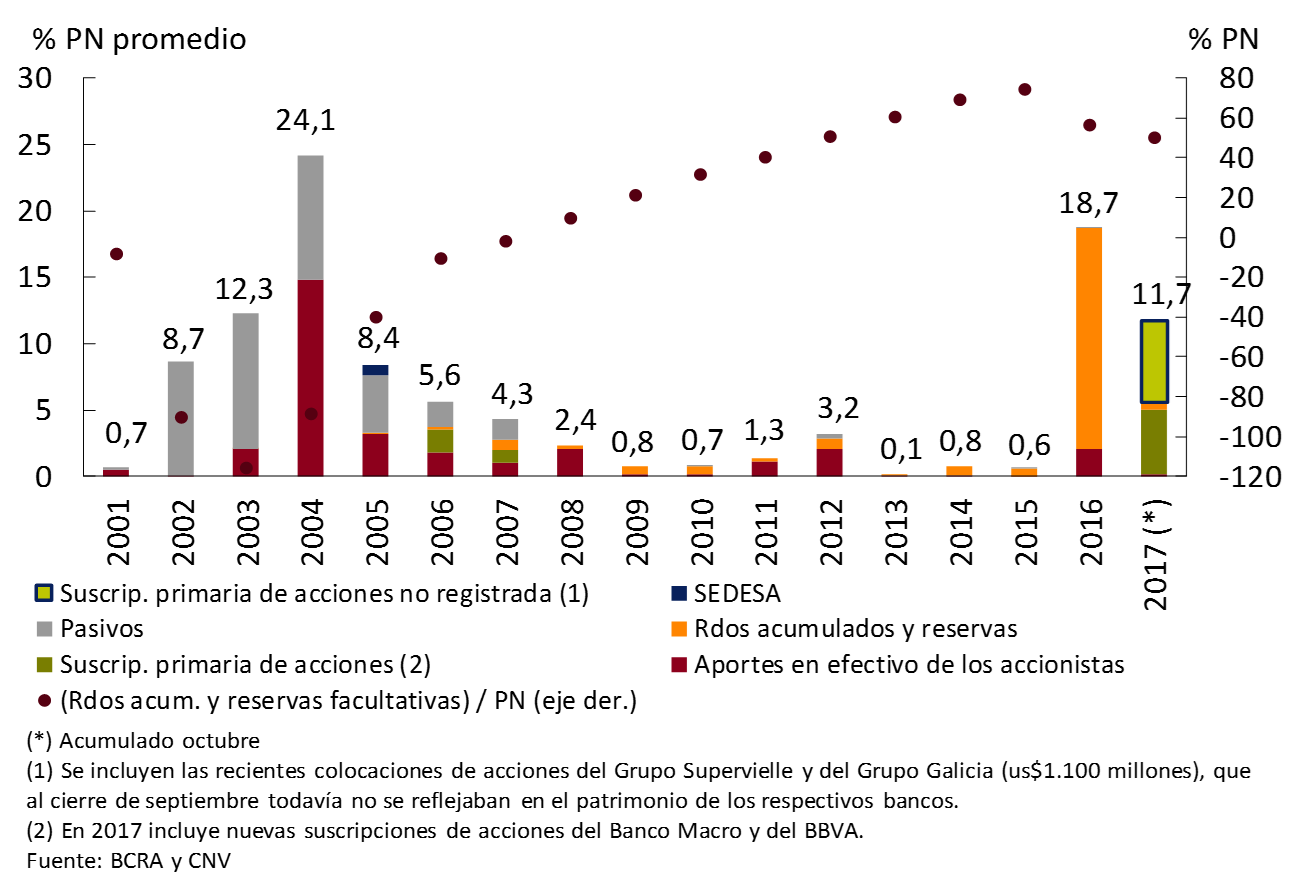
Following the new macroeconomic policy configuration, banks have begun to readapt their strategies to expand their capital base. During the period of exchange clamps, and in response to the existing regulatory framework for accessing the foreign exchange market and for the distribution of dividends, a large part of the banks chose to accumulate the profits obtained, thus significantly increasing the proportion of these funds in terms of equity (reaching a level of almost 75% at the end of 2015) (see Figure 2.10). Between 2011 and 2015, at the aggregate level, there was only an average annual level of new capitalizations of approximately 1.2% of the banks’ net worth, in a context in which no entity chose to increase its capital and subscribe new shares in the market. This behavior was modified from 2016. In that year, the National Government decided to capitalize the magnitude of the accumulated results of previous years of a public bank, among other smaller operations observed. So far in 2017, several banks have issued primary shares in the market, announcing that they will use such resources to finance their organic growth business strategy (expand credit) and analyze possibilities of strategic acquisition of other entities, thus seeking to expand their scale and improve their efficiency levels. These subscriptions represent almost 5% of the system’s average net worth so far this year, a value that extends an additional 6 p.p. if the placements of the Financial Groups that own banks are considered – a considerable part of the resources will be channeled to the latter.
Figure 2.10 | Financial System Capitalization Decisions
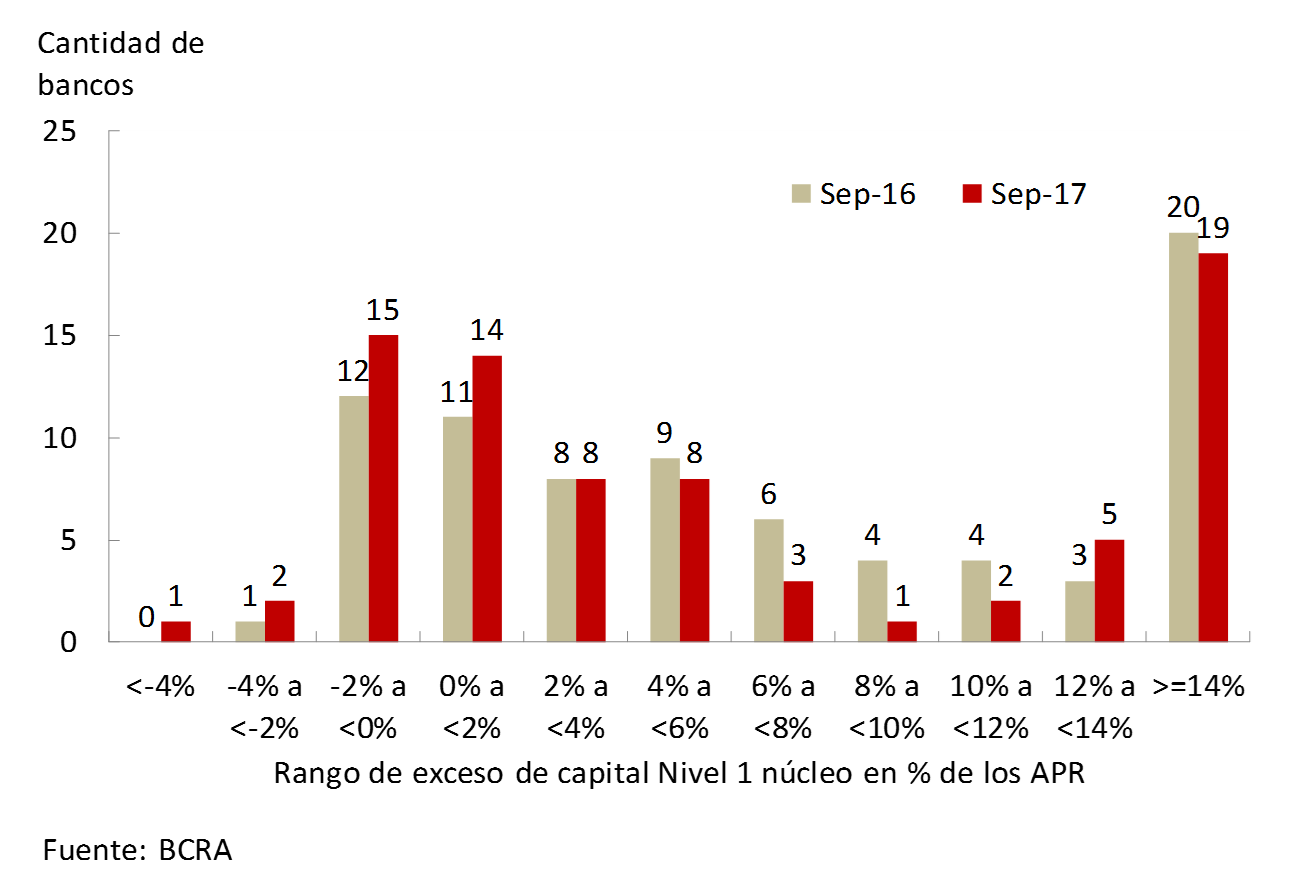
When performing the theoretical exercise of incorporating regulatory capital margins as minimum requirements46, banks have an excess integration of core Tier 1 capital – common shares and retained earnings – of 4.5% of RWAs (5.1% a year ago). Eighteen (18) banks were not able to fully cover all margins as of September 2017, although the majority of the aforementioned group (15 of the 18) are at values close to those stipulated by the current margins – less than 2 p.p. of the RWAs to cover the margins – 47 (see Figure 2.11). This situation results in restrictions on distributing profits for entities that do not fully cover margins.
Figure 2.11 | Tier 1 Excess Ordinary Capital Estimation Exercise, Including Capital Margins
The Leverage Ratioof 48 for the financial system increased moderately in the first half of 2017 to 10.1% as of June – the latest information available – a value in line with that observed in recent years. This indicator is well above international recommendations (3%).
3. Stability analysis
Taking into account the risk factors identified in the analysis of the context and the evolution and composition of the balance sheet (which define risk exposures and liquidity, forecast, and capital coverage margins), it is estimated that the financial system maintains a relatively solid position, with a significant degree of resistance to extreme events of credit risk materialization. This overall assessment shows no significant changes with respect to the one carried out in the previous edition of the IEF. In the face of an improvement in the operational context, risk exposures increased (still moderate to low) due to the deepening of financial intermediation with companies and households (relatively low in debt). Credit is gaining relevance in the balance sheet of the financial system, gradually increasing certain equity mismatches (UVA and interest rates), while the high liquidity and capital coverage buffers are being retooled. The sources of systemic vulnerability (excessive credit growth, leverage, interconnection, risks in systemic institutions, among others) remain limited. In addition to the accumulation of risks typical of a growth stage, in the medium term the financial system maintains the challenge of adapting to an environment of disinflation and greater competition.
Low exposure to systemic risk factors remains
Local banks as a whole retain low exposure to the main sources of systemic risk. The small size of the banking sector coupled with its moderate concentration, the lack of complex financial products and services and the low degree of interconnection between institutions contribute to this situation. Regarding the potential procyclicality of the financial system, following the recommendations of the Basel Committee, the BCRA defined a countercyclical capital margin in due course (see Box 10).
Box 10. Definition of the rate for countercyclical capital margin49
This regulation seeks to mitigate the cyclical risks associated mainly with excessive credit growth. Its design leads financial institutions to accumulate “capital buffers” in strongly expansive periods to be used in contractionary stages. This seeks a double objective: to strengthen the solvency of financial institutions and to smooth the credit cycle. Given its nature, this standard requires a constant review of the conditions that lead to setting its level. One of the central indicators used for this purpose, as suggested at the international level, is the gap in the credit/GDP ratio with respect to its long-term trend. In addition, the local methodology analyzes GDP growth and its cycle, and quantitative and qualitative indicators referring to the strength of credit providers and demanders.
In April 2016, the BCRA set a rate of 0.00% for the countercyclical capital margin applicable to exposures in Argentina (Com. “A” 5938), and reviews this percentage quarterly. The latest information analyzed shows consistent signals to keep the rate at 0% as of December 2017.
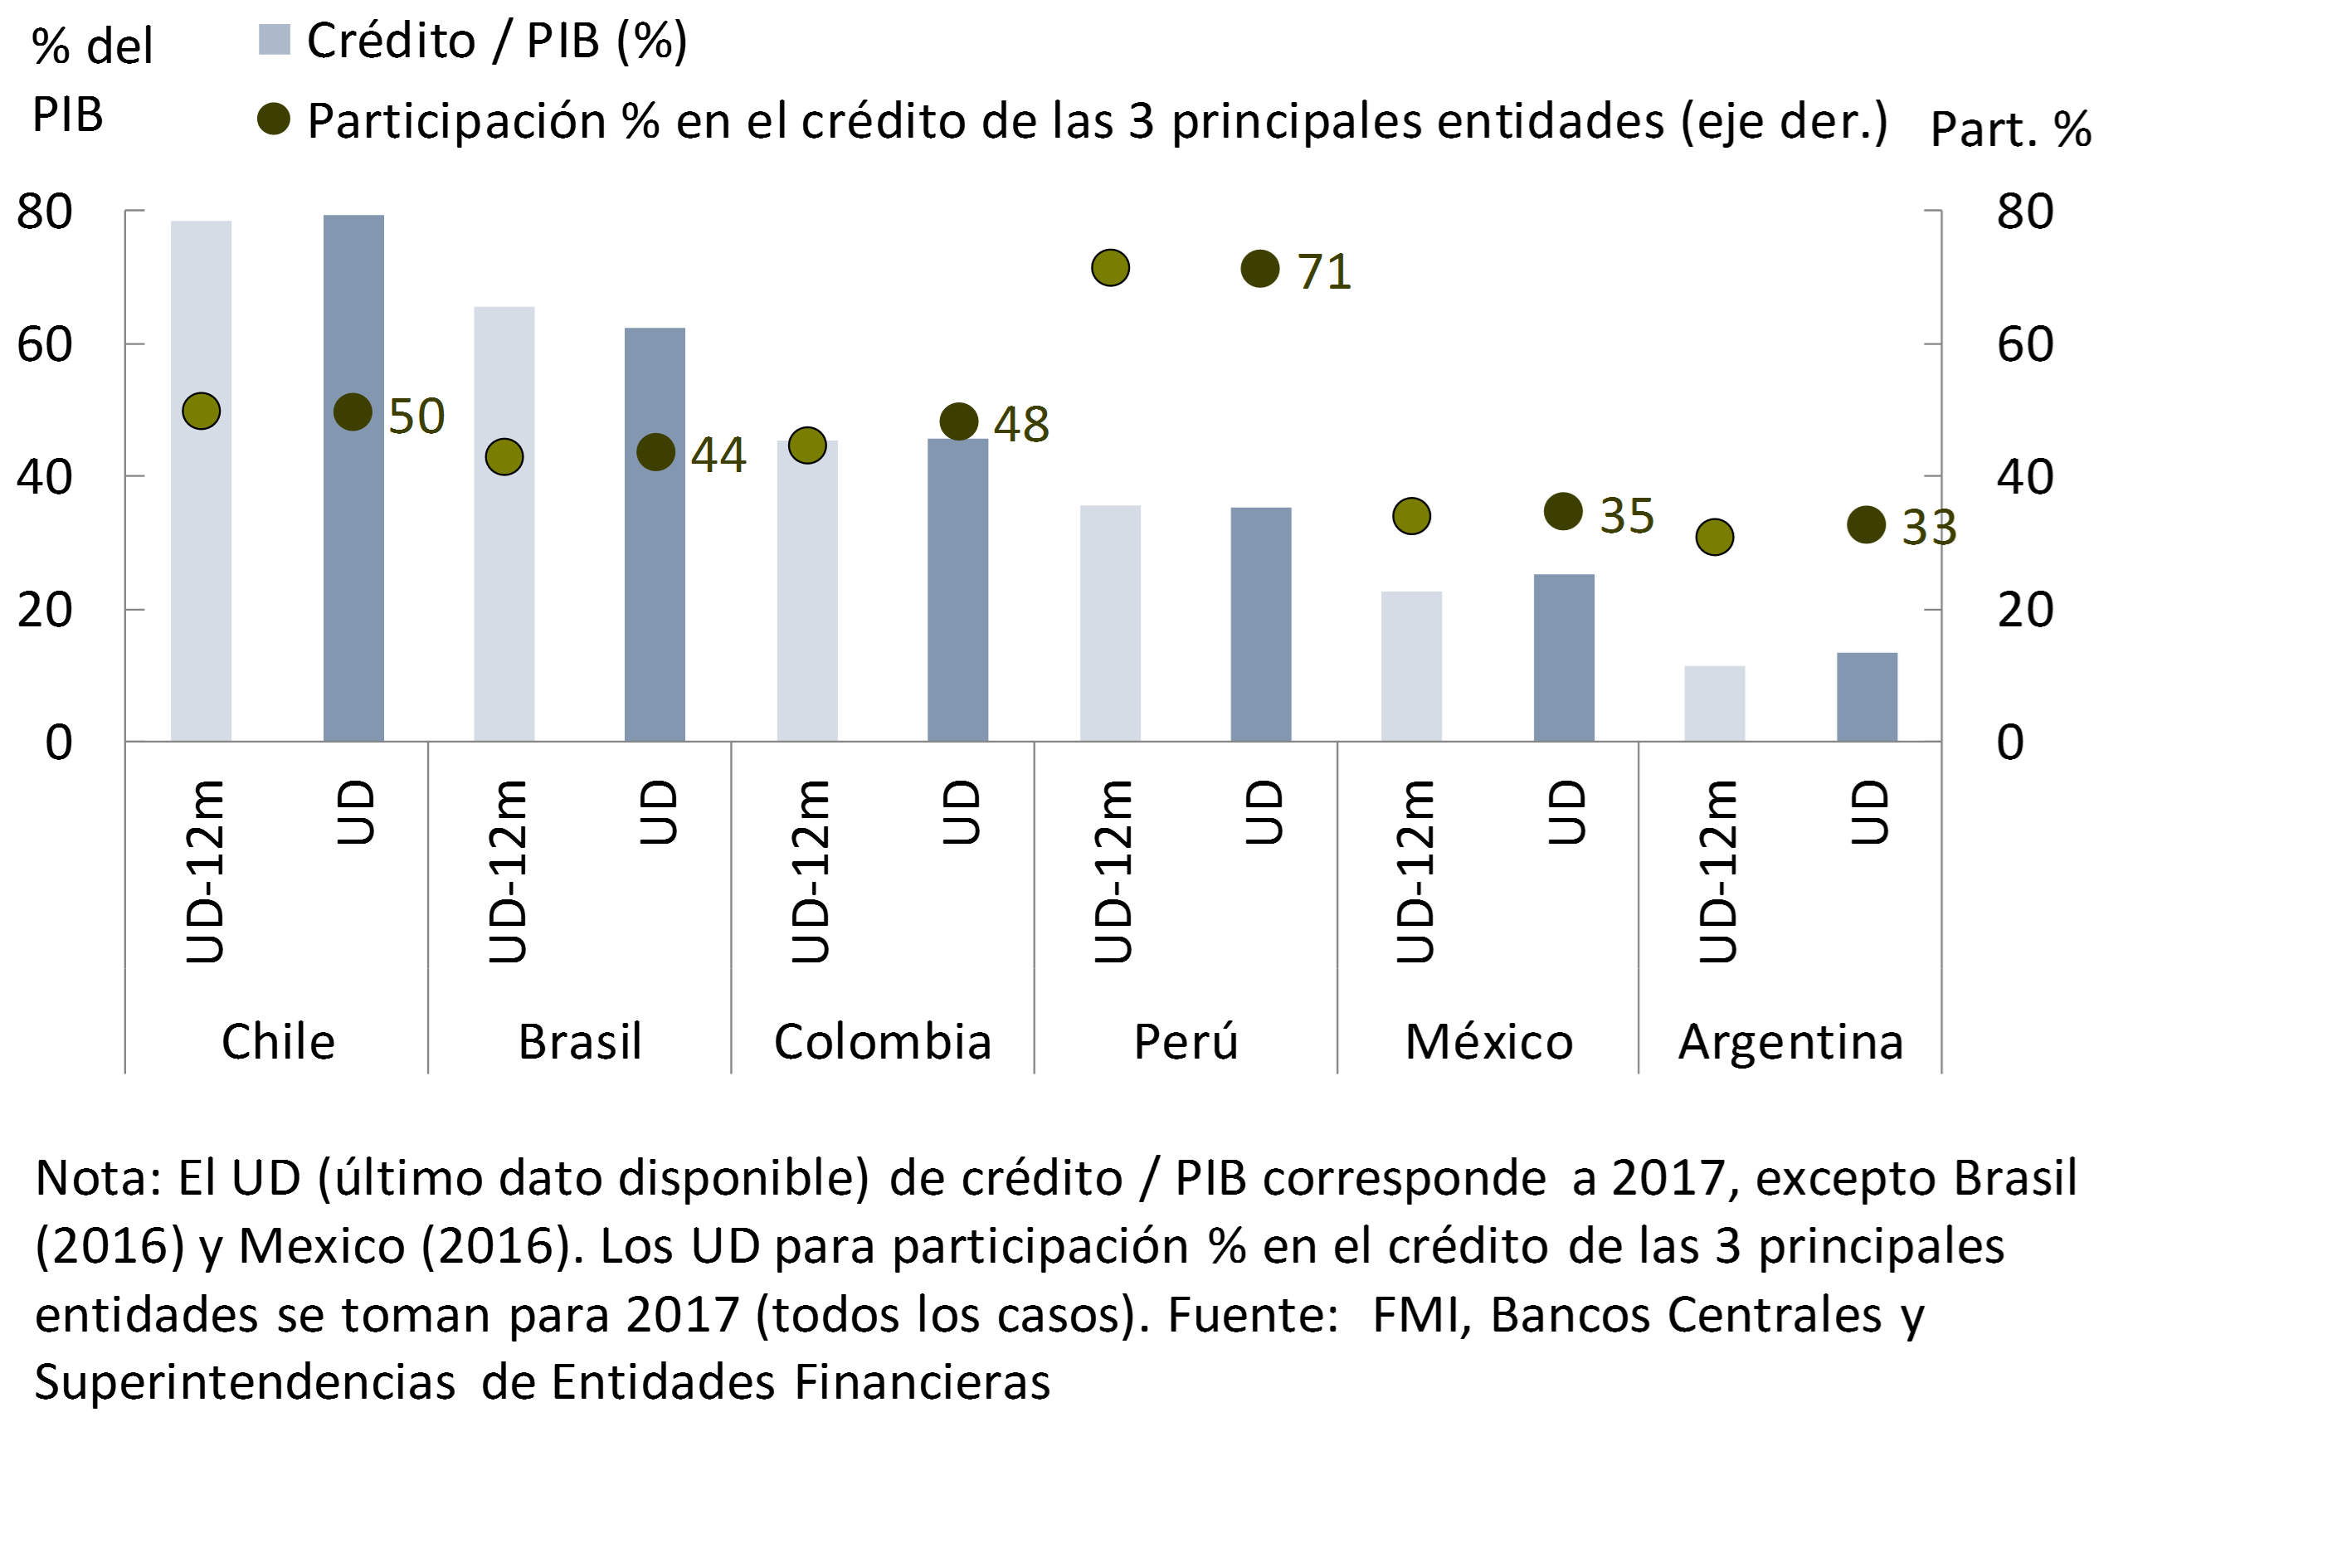
In terms of credit depth in the economy, although it has increased recently (see Chapter 2), it is still well below that evidenced in other economies in the region (see Figure 3.1). In addition, the importance of the largest banks within the financial system is less important than in other countries. For example, credit to the private sector held by the three largest banks at the local level accounts for one-third of total bank financing to the private sector, which is lower than in other Latin American countries. In other countries in the region, larger banks account for a larger proportion of credit and, in turn, have a greater relevance in the economy.
Figure 3.1 | Depth of Credit to the Private Sector and Concentration of Credit in Large Banks – International Comparison
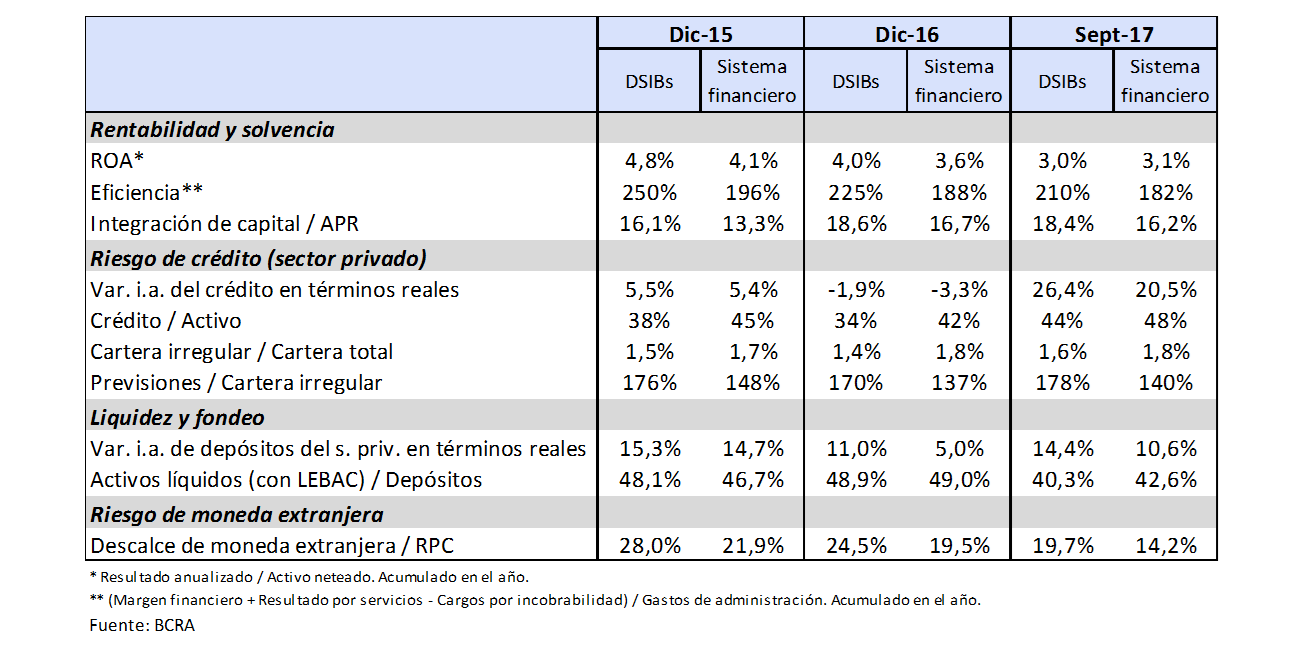
In relation to the identification of systemically important entities at the local level, and following international guidelines, the BCRA timely determined50 that five financial institutions must maintain an additional capital conservation margin of 1% of risk-weighted assets. Taking into account the monitoring of the evolution of this group of entities, although there is some disparity between the indicators of individual soundness, they show on average levels similar to those of the aggregate financial system (see Table 3.1). It should be noted that this group of banks evidenced in 2017 a greater relative dynamism in financial intermediation.
Table 3.1 | Indicators for Systemically Important Local Banks (DSIBs)
From moderate levels, banks’ exposure to credit risk increases
The expansion of credit to the private sector over the past six months has led to an increase in the financial system’s gross exposure to the private sector (see Table 2.1 in Chapter 2), although it is still below the peak levels seen years ago. This pattern was common to all groups of entities, with a greater increase in public banks. On the other hand, the growth in gross exposure to the private sector was tempered by a year-on-year fall in the level of concentration of debtors’ credit51.
The irregularity ratio was around 1.8% in the third quarter of 2017, a level similar to those shown in the previous IEF (see Figure 3.2). This figure remained low, both when compared to the average of the last 10 years and in relation to other financial systems. The level of forecasting remained high52.
Figure 3.2 | Irregularity of credit to the private sector by sector. Irregular portfolio / Financing – Financial system
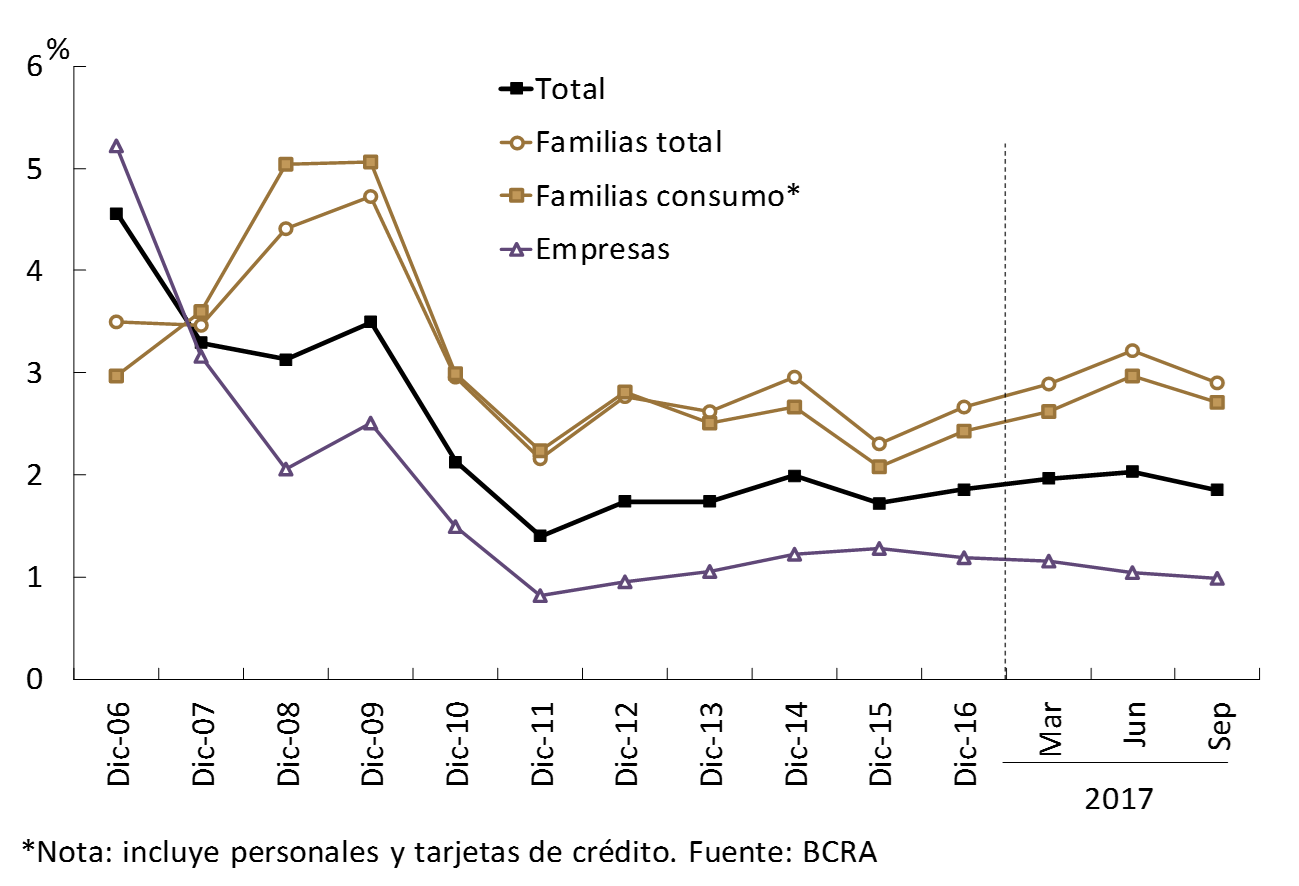
The increase in the financial system’s exposure to the private sector in 2017 was explained by both the segment to households (+2.9 p.p. of assets to 22.5%) and companies (+3.8 p.p. of assets to 27.4%), reflecting the effect of the expansion of financing lines (see Chapter 2). The irregularity of loans to households represented 2.9% of the total balance, being higher than that evidenced in 2016, although slightly lower than in mid-2017 (-0.3 p.p.). In particular, non-performing loans are relatively lower in investment lines, especially mortgage lines (see Box 11). In the case of the productive sector, the delinquency of financing reached 1% of the balance, maintaining a slightly decreasing trajectory.
Box 11. The local mortgage market and home prices
One of the lessons learned from the international crisis that began in 2007/08 is that episodes of significant expansions in mortgage financing to households—often hand in hand with periods of relaxation of granting criteria—in scenarios of marked increase in leverage as well as in real estate prices, can increase the systemic vulnerability of economies. In other words, financial stability conditions are put at risk, eventually causing tensions on both the financial situation of households and the public sector in the face of changes in macroeconomic conditions.
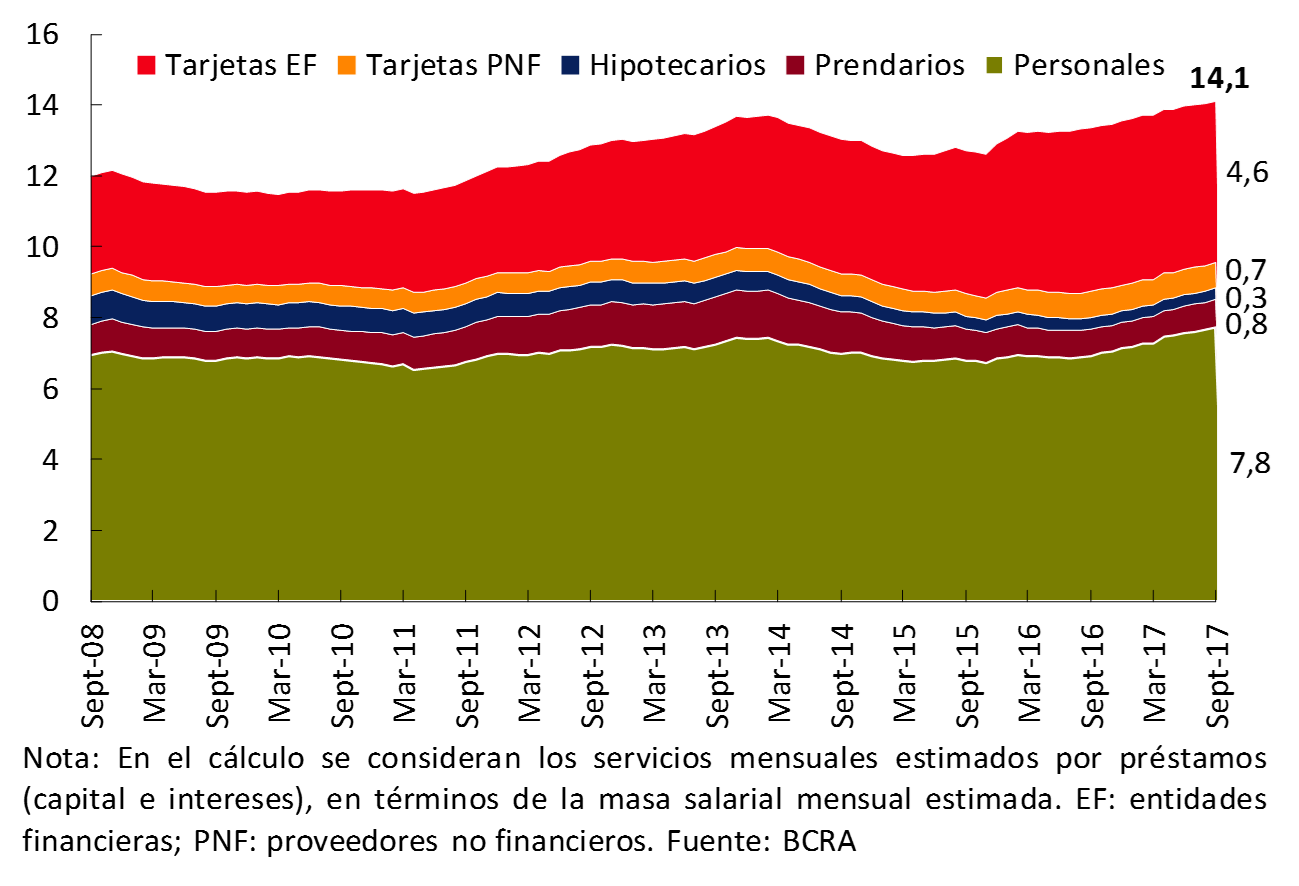
Considering the aforementioned lessons, the BCRA monitors the current expansion of the local mortgage market, a trend that is being driven both by favorable macroeconomic conditions and by the greater access of the population with housing needs to this market. This monitoring shows that the level of mortgage credit to households is still very low, representing less than half a point of output (a value that is in the order of 10% of GDP in economies such as Mexico, Bolivia and Brazil; exceeding 20% in Chile). Moreover, the low leverage of households in general and through mortgages in particular, means that the financial burden they face is also low (see Figure 3.4) and the default rate is very limited (irregularity is around 0.3%). It should be considered that the most active local entities in the mortgage segment tend to observe relatively more conservative credit criteria than in other economies in the region, both in terms of the amount lent in relation to the value of the property (in general up to 75%) and in the ratio of the weight of credit installments in income (mostly up to 25%).
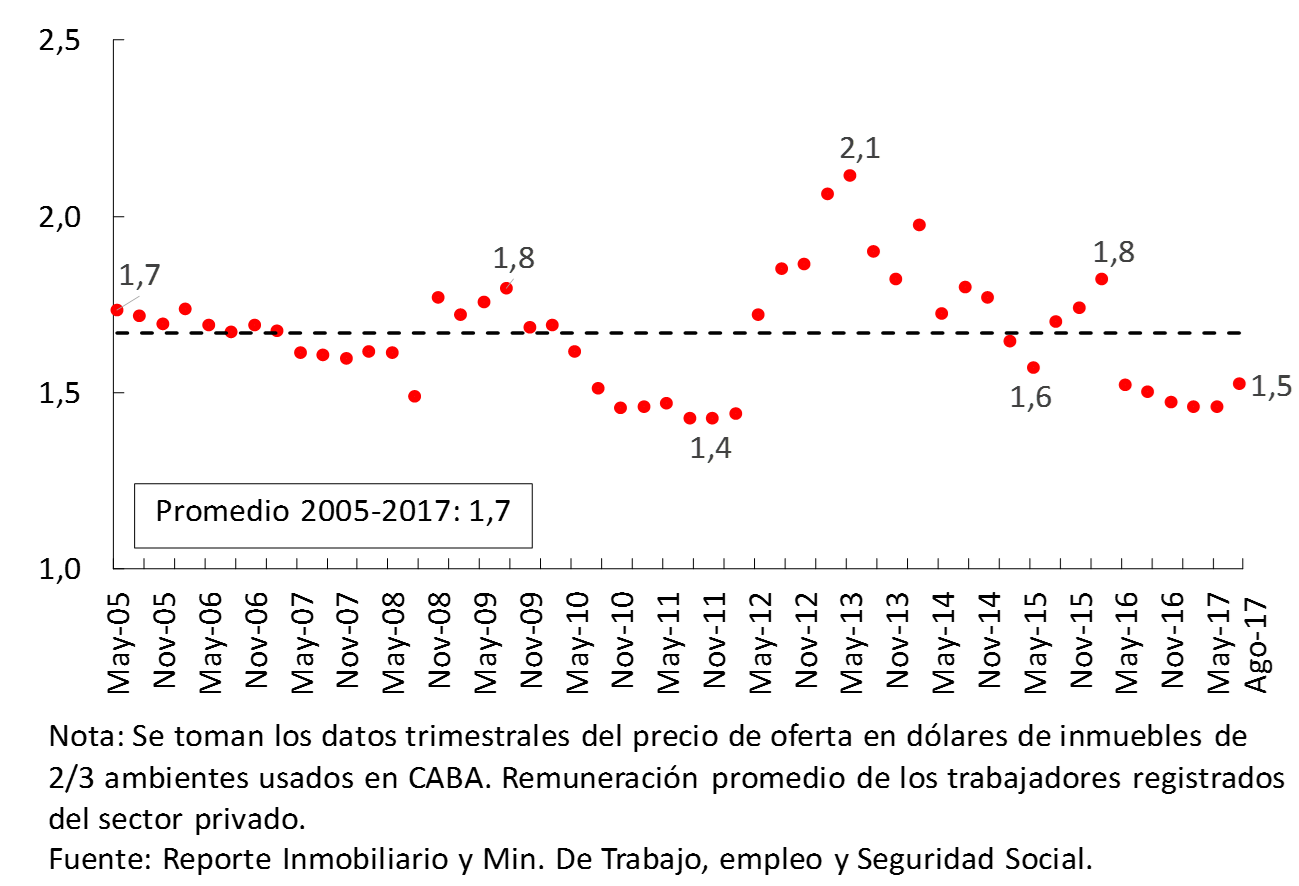
On the side of housing prices, if we take the case of the Autonomous City of Buenos Aires, for example, the different sources of information available – both public and private – indicate that in recent years the value of the square meter offered, measured in dollars, has increased. If these values are considered in terms of the average remuneration of registered workers in the private sector, i.e. an indicator of accessibility and valuation capacity, it is verified that this relationship remains relatively constant, even falling slightly in some periods (see Figure 3.3).
Figure 3.3 | Ratio of the M2 Offered Price and Remuneration M2 Offered Price in $ / Average Monthly Remuneration
The BCRA has micro and macroprudential tools to limit potential excessive risks originating in the housing and mortgage market. An example is the existence of differential weights in the minimum capital requirements for credit risk, which depend on the relationship between the amount of the loan and the value of the property, among other available tools. In the short and medium term, this institution will continue to monitor the potential systemic risks that are generated in this market.
Compared with the previous IEF, household indebtedness and financial burden increased slightly (see Figure 3.4), although these indicators remained relatively low. The level of corporate debt did not show significant changes compared to the last IEF, while it is estimated that in recent years the relative availability of operating income to meet the financial services of the debt contracted has increased (see Section 1).
Figure 3.4 | Indicator of the financial burden of families As a percentage of the wage bill
In relation to the estimation of the probability that a debtor will worsen its credit situation (MPIindicator 53), in the last quarter there was a marked reduction in both the case of households and companies (see Figure 3.5). This decrease in the MPI occurred after the increase evidenced since mid-201554. The MPI for households continued to be higher than that for the corporate sector. These indicators remained in line with the average of the last ten years. It is perceived that the reduction in the margin in the MPI of families was generalized among credit assistance.
Figure 3.5 | Quarterly frequency of worsening of the debt situation

A possible abrupt change in the external context, with consequences on the conditions of access to financing for Argentina, could have an impact on the counterparty risk of the local corporate sector. Those companies with a greater use of external financing (for example, those linked to the primary sector, services and industry, see Section 1), would see their financial positions deteriorate and their ability to repay local banks affected. It is expected, however, that potential scenarios of these characteristics (with a low probability of materialization) will have a limited effect on the Argentine financial system. This is so given that the system currently shows a diversified loan portfolio (partly as a result of prudential regulations), a situation that is consolidated by the currently very low levels of irregularity and high forecast ratios of the corporate portfolio in a framework of large solvency margins.
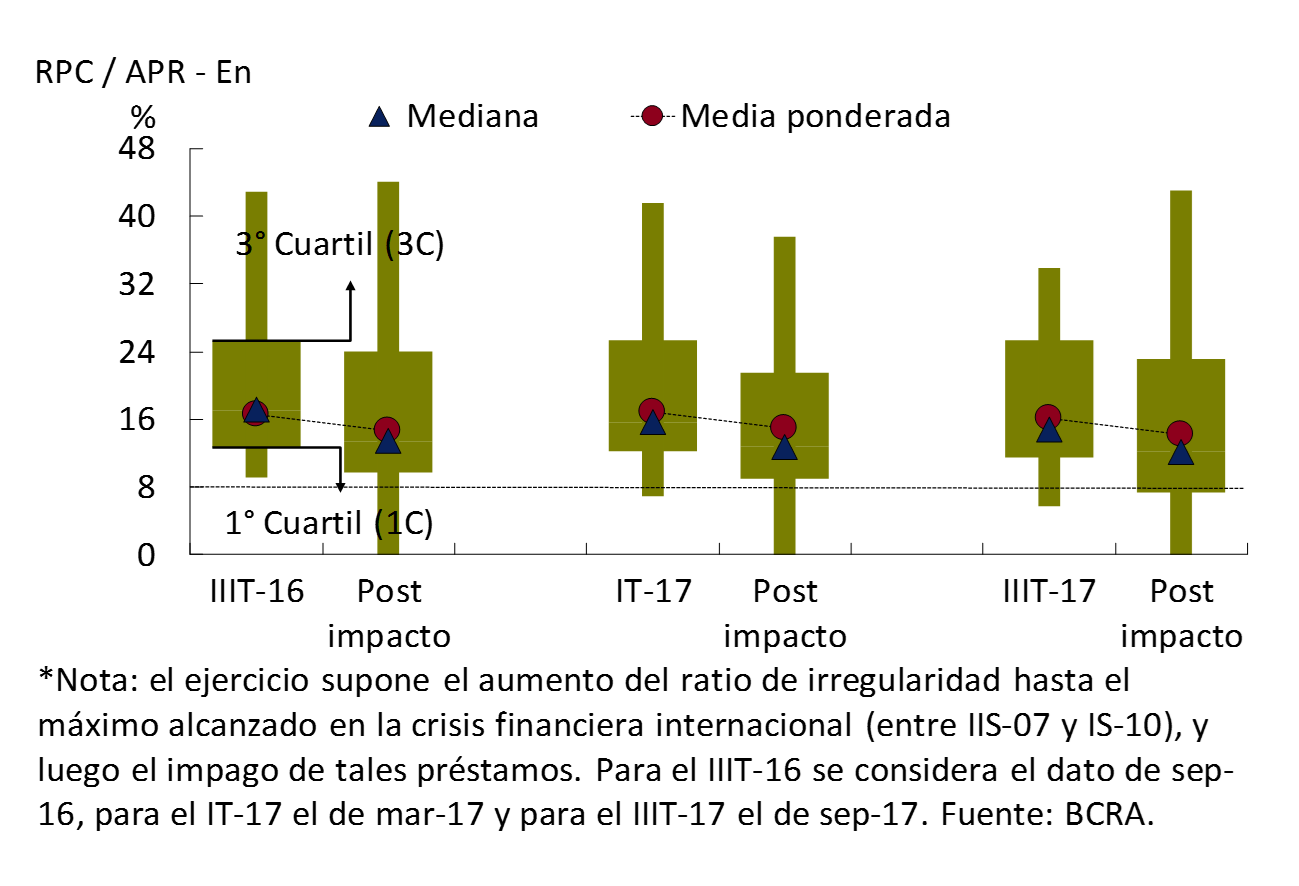
Resilience of the system to credit risk sensitivity exercises
The banks as a whole retain a significant position of resistance to hypotheticalscenarios 55 – of very low probability – of materialisation of credit risk, presenting at an aggregate level results similar to those of the previous edition of the IEF. In the case of “exercise B”56 presented in a timely manner, it is estimated that after the assumed impact, a total of 21 financial institutions would be left with a capital integration of less than 8% of the RWA. This number of banks is higher than those that crossed this threshold when carrying out the exercise in the first quarter of 2017 (18 banks) and in the third quarter of 2016 (16 banks). This result is mainly explained by the lower levels of capital that are currently evident in a greater number of entities compared to what was evidenced in previous IEFs (see Figure 3.6 and Chapter 2), although at the aggregate level the capital records are still high.
Figure 3.6 | Sensitivity of Capital Integration / RWA – Exercise B*
Readjustment of liquidity levels in a context of credit growth
Indicators of bank exposure to liquidity risk showed little change in recent months. Both the concentration of deposits and the relevance of shorter-term liabilities in total funding remained at levels similar to those evidenced in the previous IEF.
Deposit coverage with liquid assets – including LEBAC holdings – was above 42% at the end of the third quarter of 2017. Since the last edition of the IEF, credit to the private sector has gained significant dynamism. As a result, the broad liquidity ratio has been reduced by almost 10 p.p. since March 2017. This decrease was mainly explained by the lower balance of pass operations with the BCRA and by the decrease in foreign currency availability.
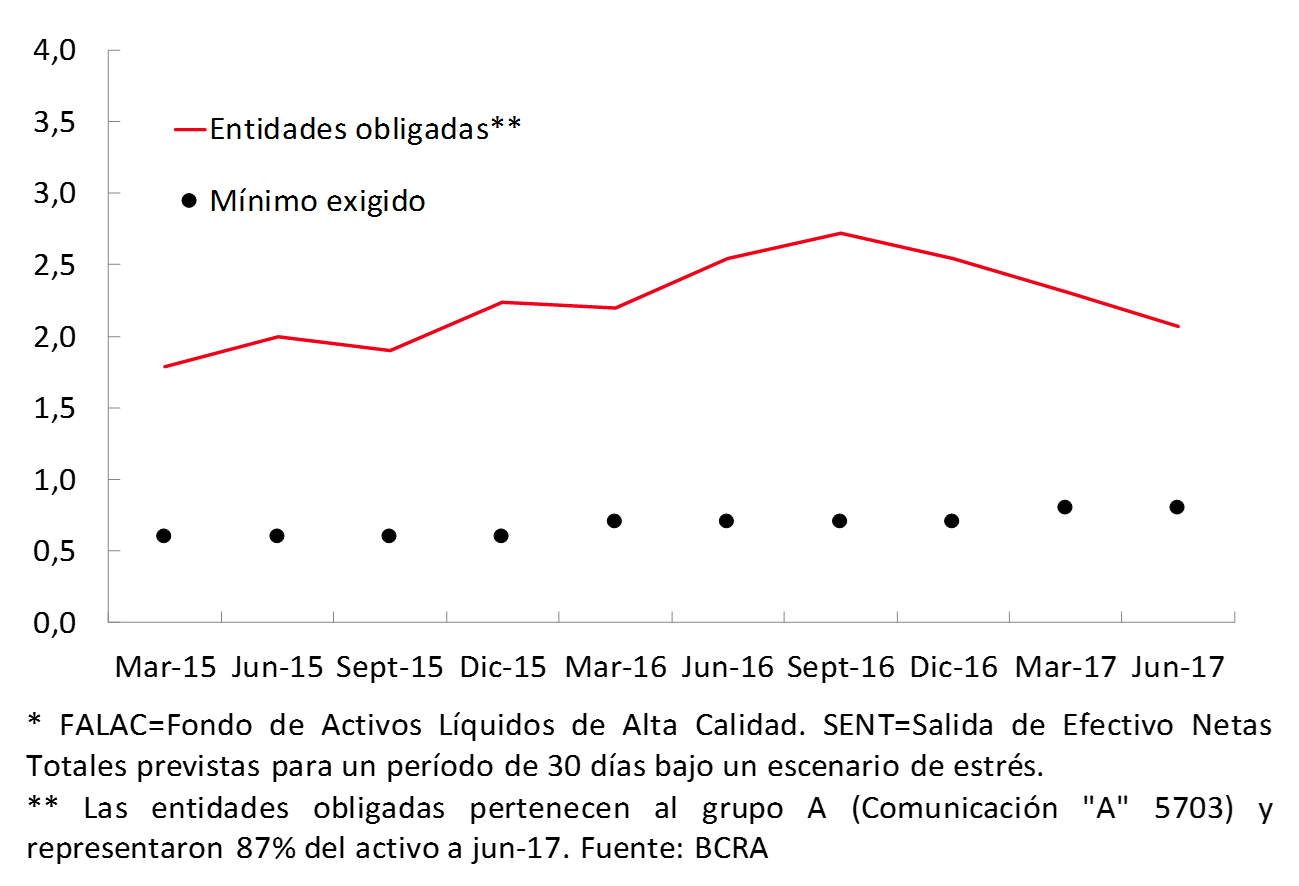
In this scenario, the financial system continues to exhibit levels well above the minimum recommended internationally in terms of the Liquidity Coverage Ratio (LCR) (see Figure 3.7). In this sense, in the middle of the year the largest entities – those classified within group A57 – registered a CSF level close to 2.1, being 0.5 p.p. lower than that observed for the last IEF with data from last December. However, this value exceeded the minimum regulatory requirement in force by 1.3 p.p. The half-yearly change was due to a reduction in the liquid assets that make up the High Quality Liquid Assets Fund (FALAC), mainly due to the performance of financing in domestic and foreign currency, added to the context of moderate increase in deposits.
Figure 3.7 | FALAC / SENT* liquidity coverage ratio
Reduced uncertainty in interfinancial liquidity markets has enabled banks to manage their over- and under-recourse more effectively. In this particular, since the introduction of the pass corridor as a policy rate, the reduction of volatility in these markets has been accentuated. In this context, the amounts negotiated for both the guaranteed and non-collateralized segments have increased since March.
If credit to the private sector continues to grow, it is expected that banks will continue to adjust their voluntary liquidity levels and be encouraged to improve the real returns they offer on their deposits (see Box 5). At the same time, within the framework of the Basel macroprudential recommendations on liquidity risk, since 2018 banks58 must comply with the Stable Net Funding Ratio (NFSR). The objective of this ratio is to enable banks to finance their longer-term assets with stable funds. At all times, the ratio between the amount of stable funding available must be greater than or equal to the amount of funding required59. In the current context of expansion of longer-term credit lines, compliance with this rule will help banks manage liquidity risk.
Low exposure to currency risk under a floating exchange rate regime
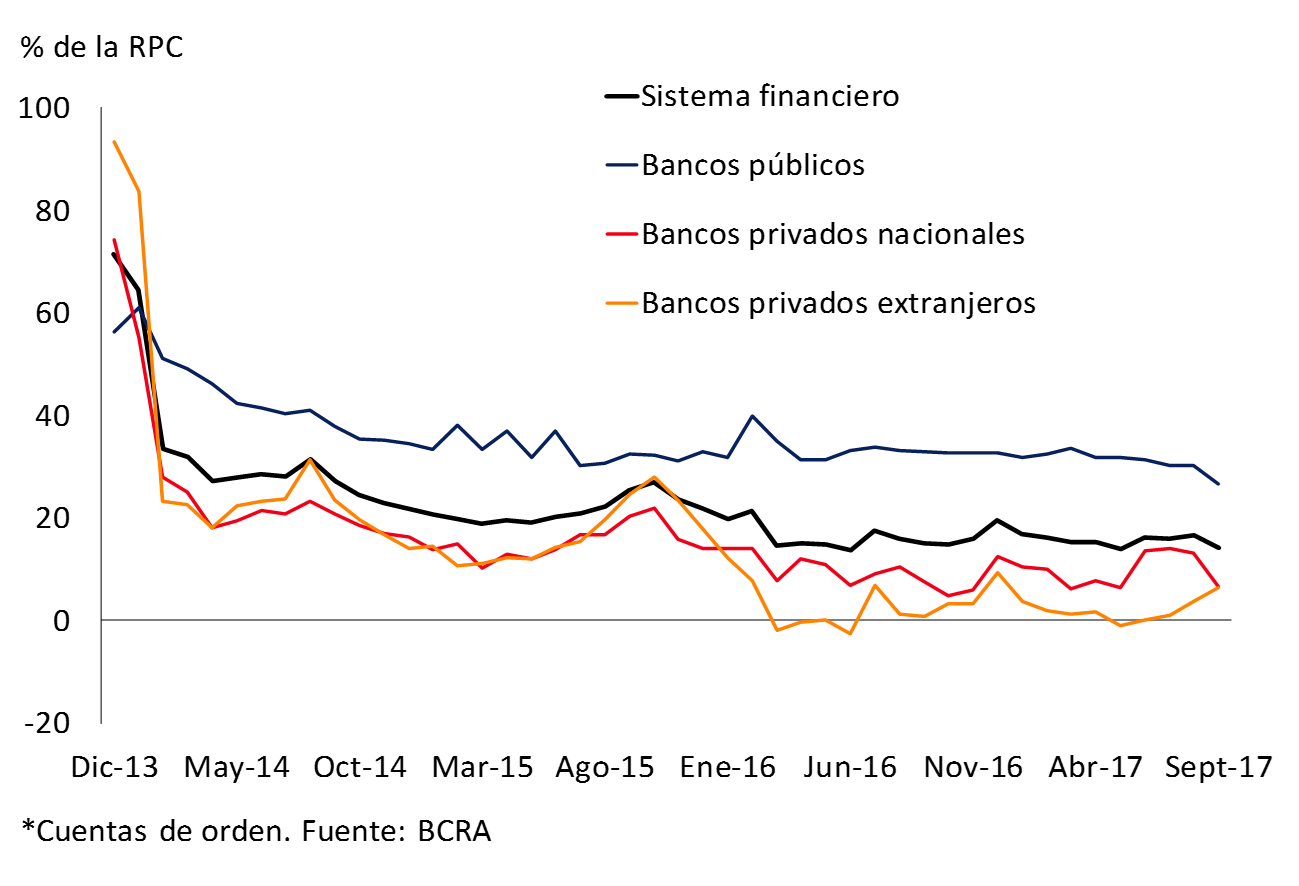
The foreign currency mismatch for banks as a whole has not changed in magnitude since the end of 2015, currently standing at around 14.2% of the PRC, slightly below the figure shown in the last IEF (Mar-17) (see Figure 3.8).
Figure 3.8 | Foreign currency mismatch by bank group EM assets – EM liabilities + Net forward purchases of EM without delivery of underlying*
Given the evolution in the peso-dollar exchange rate and the level of equity mismatch recorded so far this year, the regulatory capital requirement for this concept totaled only 3.5% of the total capital requirement (2% of the PRC) as of September, in line with what was observed in the last IEF. In this context, it should be considered that a floating exchange rate regime, such as the one in force in Argentina, avoids sudden variations such as those usually observed in fixed exchange rate regimes (in which it is common for pressures to accumulate over time that end in abrupt and considerable variations). Although volatility scenarios can be observed with a floating exchange rate (e.g. due to the materialization of tensions in the external context), in this case the modifications are usually more limited and may be temporary in nature. At the same time, it should be noted that in a floating exchange rate regime, agents incorporate the possibility of volatility into their decisions (generally by reducing open net positions, as has tended to be observed since 2016). On the other hand, the central bank can use international reserves to avoid changes of a disruptive nature not linked to changes in macroeconomic fundamentals.
The dynamism of credit in UVA and mismatch of inflation-adjustable items
As detailed in previous editions of the IEF, the risks banks face when operating in UVA can be separated into two. On the one hand, as it is a currency different from the peso, its future restatement will have an impact on the results measured in national currency. On the other hand, the fact that banks present an active mismatch with adjustable long-term financing and non-adjustable short-term funding, exposes entities to real interest rate risk. In the latter case, the risk could materialize, for example, if inflation is below the increase in the nominal interest rate.
Until September of this year, the amount of UVA loans that banks granted was much higher than the funding they obtained in that unit of account. While the loans that were given since April 2016 exceeded $39,000 million (95% so far in 2017), the balance of deposits and negotiable obligations totaled just over $1,400 million and $2,000 million as of September, respectively. As a result, the difference between assets and liabilities in UVA has grown so far this year to represent 11% of the PRC at the aggregate level as of September60 61, 9 p.p. more than in March 2017 (data as of the latest IEF). When considering public securities with CER, the mismatch of inflation-adjustable items totaled 15.6% of the PRC at the end of the third quarter of the year, 6.6 p.p. more than six months ago.
A possible change in the external context that adversely impacts the financial markets62 could lead to some materialization of the risk of UVA mismatch and thus be reflected in economic losses for banks. However, this potential impact would be small, given the incipient nature of the aforementioned mismatch63 and the sector’s solvency levels. In this regard, the BCRA will continue to closely monitor the evolution of this mismatch in order to prevent banks from assuming potentially risky exposures from a systemic point of view64.
Banks’ Greater Term Transformation Reflected in Growing Exposure to Interest Rate Risk
Banks increased their exposure to interest rate risk in recent months, although it remains at low levels. As of July – the latest information available – the duration of assets net of liabilities that do not have market value (banking book) increased by almost 16 months compared to the last edition of the IEF, to over 2 years, thus reaching the highest record in recent years. Although the financial system is still mostly focused on transactional activity, the incipient growth of more mature credit has resulted in a certain increase in the mismatch of terms.
Being mainly driven by UVA loans – both mortgage and personal – the assets with a longer residual term increased at a faster rate than those with shorter durations between February and July of this year – the latest information available. On the funding side, the relatively higher increase in demand deposits65 reduced the modified duration of liabilities in the period.
In terms of the potential materialization of this risk, the considerations made above on the mismatch in UVA are valid in this case. Although there is currently no local capital requirement due to the interest rate risk faced by institutions, the BCRA timely introduced a regulation that provides guidelines to institutions on how to effectively and prudently manage this risk66. One of the recommended criteria for measuring interest rate risk is to simulate a 200 bp increase in interest rates and quantify the equity impact67. When carrying out this hypothetical exercise to July, it was estimated that the economic value68 of this portfolio would have been reduced by only 4.4%.
4. Payment system
Throughout 2017, the BCRA continued to promote greater use of electronic payment instruments with the aim of reducing the use of cash in economic transactions. Electronic means of payment allow for safer, more efficient and cheaper transactions for the economy as a whole, contributing to a higher level of financial inclusion of the population. With this objective, the Immediate Debit (DEBIN) was recently launched, a new instrument for making instant electronic payments. Operations through immediate transfers continue to increase their depth in the population’s transactions, given the wide advantages in terms of security and efficiency that their operations provide. Transactions originating from the Instant Electronic Payments (PEI) platform are still very limited.
National Payment System
A payment system can be defined as a network of entities connected to each other in order to exchange the data necessary to process payments, efficiently and securely, of the economic transactions that are usually carried out by families and firms. There are different stages that make up its operation, including those involved in the initiation of an operation, its authorization, its clearing and settlement. These stages take on differential characteristics depending on the channel through which the operations are carried out, the instruments used and the actors involved. Figure 4.1 summarizes the current Argentine payment system, distinguishing its different stages.
Figure 4.1 | Outline of the Argentine payment system
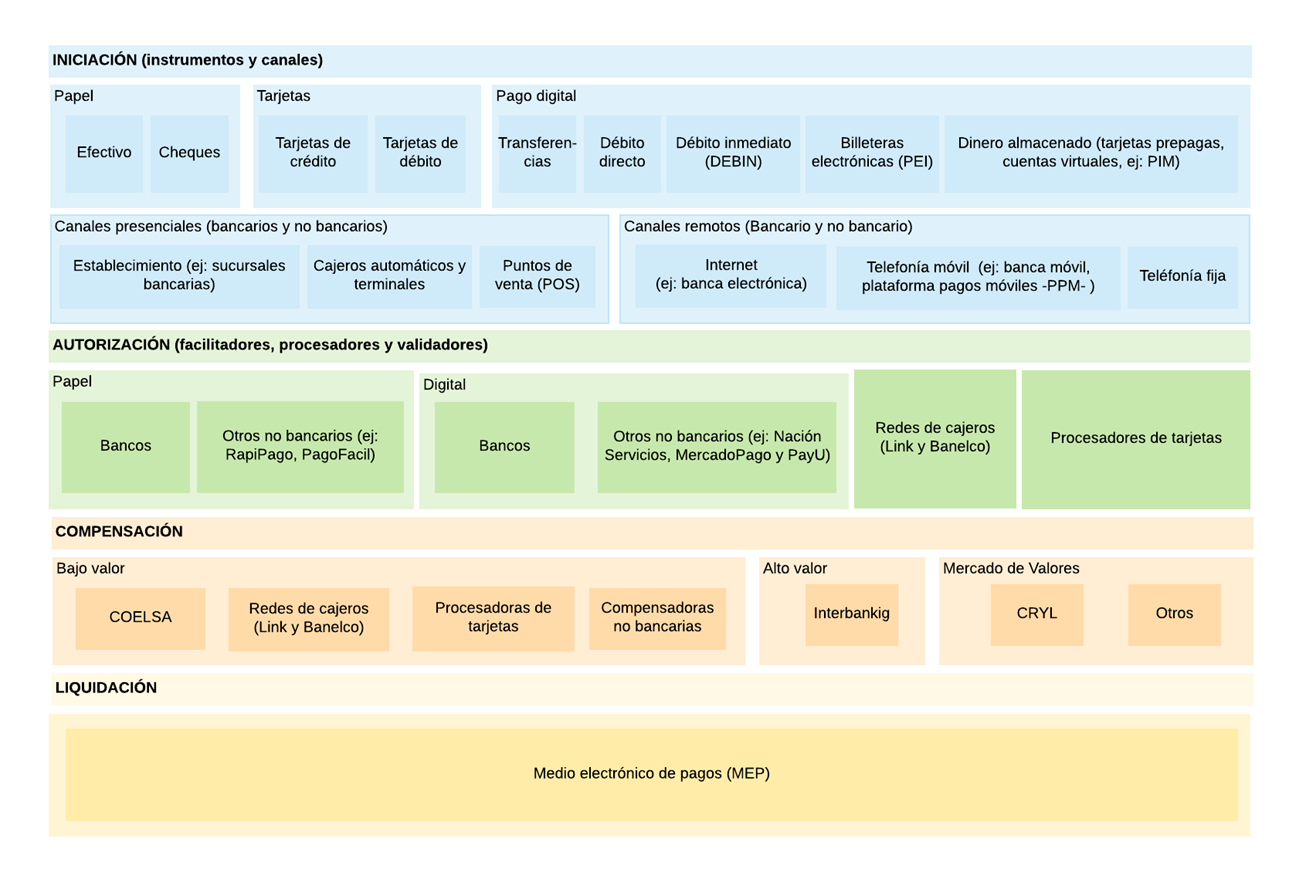
Initiation. A payment transaction is initiated when a customer selects an instrument and channel to place their payment order for a good or service they receive. The instruments adopt different formats, which have varied over time depending on technological developments, ranging from paper and cards, to new digital formats such as immediate transfer, Immediate Debit (DEBIN) (see Box 12), electronic wallets and money stored in different media (cell phones, cards or software) that operate a prepaid scheme. Local advances seek to ensure that retail payment instruments are real-time, i.e. that the beneficiary receives the funds at the same time that the payer generates the order (24 hours a day, 7 days a week)69. Among the latter are immediate transfers through traditional channels, immediate electronic payments (PEI) through the mobile payment platform (PPM) with its different modalities and the DEBIN. The customer will be able to select face-to-face or non-face-to-face (remote), banking or non-banking payment channels, depending on their preferences and access possibilities.
Authorization. The authorization process makes it possible for operations to be carried out, reducing their inherent risks. The sophistication of the authorisation process depends on the instrument and payment channel chosen: on the one hand, cash does not require prior validation for acceptance, while on the other hand, an instrument in digital format requires a validation process in which different banks, banking and non-banking, can participate. Thus, facilitators, processors and payment validators are involved in the authorization process. Payment facilitators make the operation possible by reducing the risks incurred by sellers and buyers (e.g., non-bank digital payment facilitators – Nación Servicios, MercadoPago and PayU). Processors are firms that offer interfaces so that the merchant can process a payment at its point of sale (e.g., credit card processors). The new technologies and measures adopted by the BCRA70 have allowed the development of new payment facilitators, generating greater competition in the sector (e.g., new devices that compete with traditional devices for reading the magnetic stripes of cards, such as “dongles”).
Compensation. In general, the clearing is carried out by a chamber, a place through which the instructions corresponding to the different means of payment are passed. The clearing process allows transactions to be carried out between customers who belong to different financial institutions. The clearing houses calculate the net positions of the member entities, information that they then send to the Central Bank for the final settlement of the operations carried out. Like the authorization process, the clearing of instruments depends on the payment modality71. There are a variety of forms of clearinghouses. For the national system, in general, the forms of compensation can be subdivided into:
• Low-value cameras. They are intended to process a large volume of transactions corresponding to payments that customers make on a daily basis, through a wide range of instruments (e.g. a point-of-sale (POS) payment, or a remote payment through electronic banking, among others);
• High-value cameras. They process a more limited set of transactions of larger amounts, such as those that financial institutions or companies carry out among themselves;
• Transactions with securities. This includes entities intended for the exchange of financial assets in the capital markets (e.g. the CRYL “Central Registry and Settlement of Public Debt Instruments”).
Liquidation. A payment system requires a specialized agent to provide the final settlement of funds between participants. There are mainly two types of settlement. On the one hand, gross settlement, in which transactions are settled one at a time. On the other hand, there is net settlement, in which a set of transactions (payment and collections) are accumulated over a period of time that will then be settled in an aggregated net manner.
Gross settlement has the advantage of its agility in the operation and the consequent reduction of the risks faced by the parties, since it occurs simultaneously with the payment. In this type of settlement, the transactions are irrevocable and are only effected if the payer has sufficient funds. On the other hand, deferred net settlement requires less immediate liquidity since the settlement of operations is carried out only once the value resulting from the difference between credits and debits has been obtained, thus resulting in a lower flow of funds between the entities
Instruments and channels of the National Payment System
Money continues to be one of the main means of payment in Argentina. Faced with this scenario, in the last two years the BCRA has implemented a set of measures aimed at promoting greater use of electronic payment instruments by the population. These tools are more efficient, effective and secure when carrying out economic transactions, while promoting greater banking of operations. These include free electronic transfers, the creation of immediate electronic payment mechanisms, the possibility for customers to extend the limits allowed to make immediate transfers through electronic channels72 and the implementation of DEBIN (see Box 11). However, there is still a long way to go to achieve a significant reduction in the use of cash, a process that also involves a change in the uses and customs of the population.
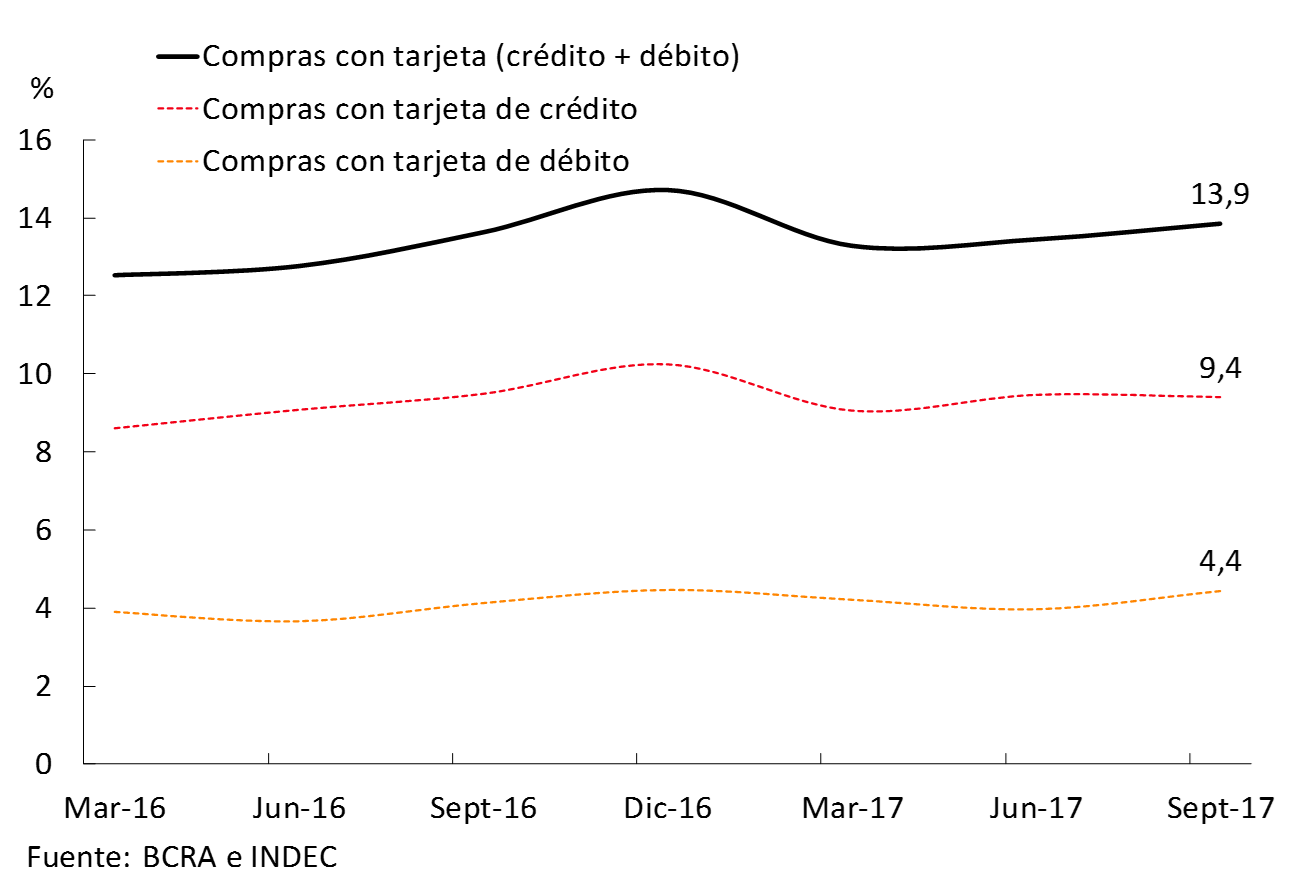
In Argentina, the cash-to-GDP ratio is high (around 5.5%), although it shows a certain downward trend at the margin. Faced with the progressive assimilation of technology, the population is gradually migrating towards a greater use of new means of payment, partly replacing traditional ones. The gradual reduction in the costs of these means of payment promoted by the BCRA73 , added to the economic recovery, gradually favors the use of credit and debit cards. Regarding transactions made with debit cards, in the third quarter of 2017 they totaled more than 63 million average monthly purchases (8.8% more than a year ago), which represented 4.4% of GDP (see Chart 4.2), 0.3 p.p. above the same period 12 months ago. Credit cards were used to make an average of 74 million monthly transactions in the third quarter of 2017 (7.6% more than in the same period of 2016), which totaled 9.4% of GDP in amounts (-0.1 p.p. in the year-on-year comparison). In both cases, higher growth is expected for the last quarter of the year, supported by the usual seasonality and greater economic activity.
Figure 4.2 | Card purchases as % of GDP – Annualized quarterly cumulative
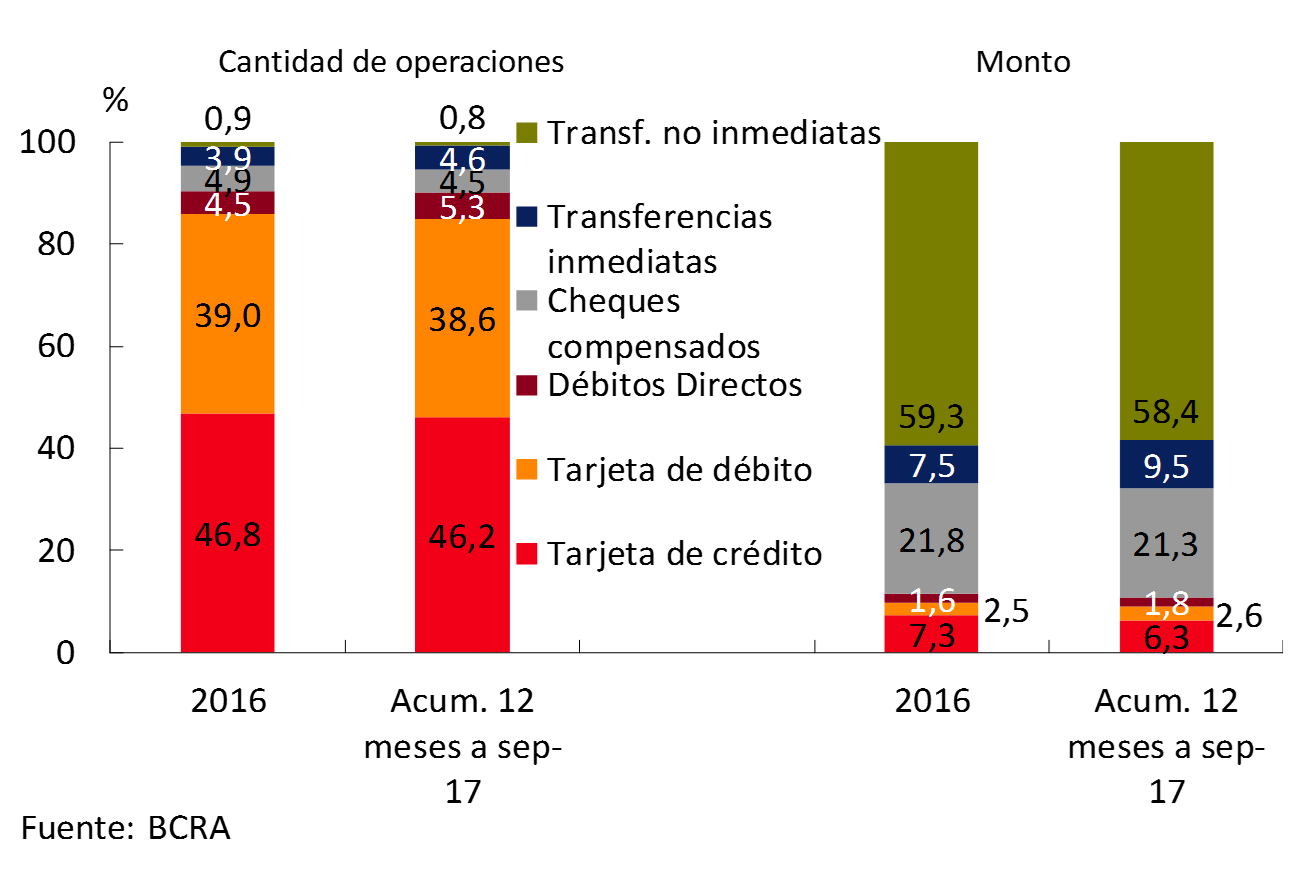
The incentive scheme promoted by the BCRA had a more marked effect on the performance of immediate transfers74, which increased their participation in the set of alternative means of payment to cash by 2 p.p. in amount and 0.7 p.p. in number of operations during the last 12 months compared to 2016 (see Figure 4.3). There was also a greater use of direct debits on a year-on-year basis (with a low weighting in the total), while the use of checks observed a certain reduction in the total, as well as the participation of cards in the total of alternative means of payment to cash.
Figure 4.3 | Use of different means of payment – Participation
In turn, given the widespread use of cell phones with internet access in the population, mobile banking has been growing significantly among all the channels from which immediate transfers can be made, doubling the number of transactions in the last 12 months.
The performance of the PEI (Immediate Electronic Payment) payment instruments implemented by the BCRA is still at very limited levels, probably requiring a longer time to mature. From its implementation until September 2017, more than 107,000 transactions had been made, corresponding to 67% to the Electronic Wallet, 32% to the mobile POS and 1% to the Payment Button75. 63% of the operations were carried out from banks belonging to the Link Network and 37% to the Banelco Network.
Risks associated with the payment system
A policy aimed at promoting financial stability cannot ignore the adequate monitoring of the different components of the infrastructure of a payment system, as well as their potential systemic impact on the economy. The proper functioning of these structures is essential, so their risks must be identified and mechanisms must be created to monitor and manage them. Payment systems present a set of risks intrinsic to their usual operations:
• Legal risk: operations must have a clear and well-founded legal basis, to avoid the emergence of possible litigation due to the existence of ambiguities in the interpretation of the rules. This could jeopardize the completion of transactions.
• Credit risk: risk that a counterparty (who must make the payment) will not be able to fully meet its financial obligations in due time or in the future.
• Liquidity risk: the risk that a counterparty (the payer) will not have sufficient funds to meet its financial obligations in the manner and at the time intended, even though it may do so in the future (e.g., by liquidating assets or through a loan).
• Operational risk: includes the occurrence of operational failures (errors or delays in message processing, communication failures, degradation or interruption of service, fraudulent activities) that may lead to delays, losses or liquidity problems for transaction participants. In general, operational risk management requires the definition of an acceptable level of tolerance and the implementation of controls and timely monitoring of these risks.
The BCRA adopted the Principles for Financial Market Infrastructures defined by the Bank for International Settlements (BIS)76 and, in this framework, defines in detail the requirements that systemically important infrastructures under its orbit must comply with in order to mitigate risks.
In the case of the Argentine payment system, given that the Electronic Payment Method (MEP) is a real-time gross settlement system that operates directly on the current accounts that banks have at the BCRA, credit and liquidity risks are ruled out. Moreover, the MEP does not provide queue management mechanisms or intraday liquidity facilities, which further limits the aforementioned risks. The transactions that are accepted by the BCRA are irrevocable, with an appropriate legal framework and a broad set of minimum computer security requirements and contingency plans and continuity mechanisms that mitigate the presence of legal and operational risks77.
For its part, the Low Value Electronic Clearing House – a central component of the local payment system – carries out a deferred net settlement, a situation that could give rise to credit risk between the entities that interact through it. To minimize this risk, the BCRA requires the constitution of guarantees in this institution, which can be used in the event of non-payment of the net debit balances by an entity. Like the MEP, this actor must comply with minimum requirements in terms of computer security and with the regulatory framework for its operation.
In line with what was developed in the first section of this Chapter, the BCRA currently maintains a policy of promoting immediate retail payments (online) through electronic channels (such as DEBIN and PEI), operations that are settled at the end of the day between participants. A set of measures were adopted to limit the emergence of risks:
• In order to mitigate the credit risk arising from the deferred settlement of these payments, banks are required to provide guarantees. As a result, the providers of the Instant Transfer Clearing Service accept these operations up to the amount covered by the guarantee.
• The operational risks of electronic channels are mitigated through the minimum IT security requirements required. The risks arising from the security of the DEBIN, in particular the possibility of fraud, have been reduced by establishing that the functionalities must have a level of security so that the customer is not exposed to the improper use of their account, the genuineness of the operations is guaranteed and the relevant record of the transactions is generated.
• In relation to legal risk, the rules that regulate DEBIN clearly and precisely define the role of each of the participants and their consequent responsibilities. The responsibility of generating entities (banks or non-banks) for all debit orders initiated by their customers within the framework of the “know your customer” policy and as a result of having been previously authorized to operate DEBIN was specifically defined. The legal framework also established precisely the role of the administrator and the different profiles of participants in which the responsibility for this task and their specific obligations are found.
• In the DEBIN there is no liquidity risk between the generating customer and the bank, since the entity verifies the existence of a sufficient balance before the debit to the account. For the recipients of the funds, liquidity problems are mitigated since these resources are immediately available.
Box 12. Immediate Debit (DEBIN). New collection and payment tool
What is it? It is a new electronic tool made available to the public by the BCRA78, through which payments for goods or services can be made instantly every day of the year, 24 hours a day. This tool allows companies or families to request authorization to collect for their sales and, once obtained, payment is made by instant bank transfer.
What are its objectives? To contribute to a more modern and efficient payment system, allowing both individuals and companies to manage their collections more simply. In other words, it provides an electronic alternative to the use of cash, promoting greater competition in the payment system by including non-bank payment service providers (such as fintechs).
Who are the participants?
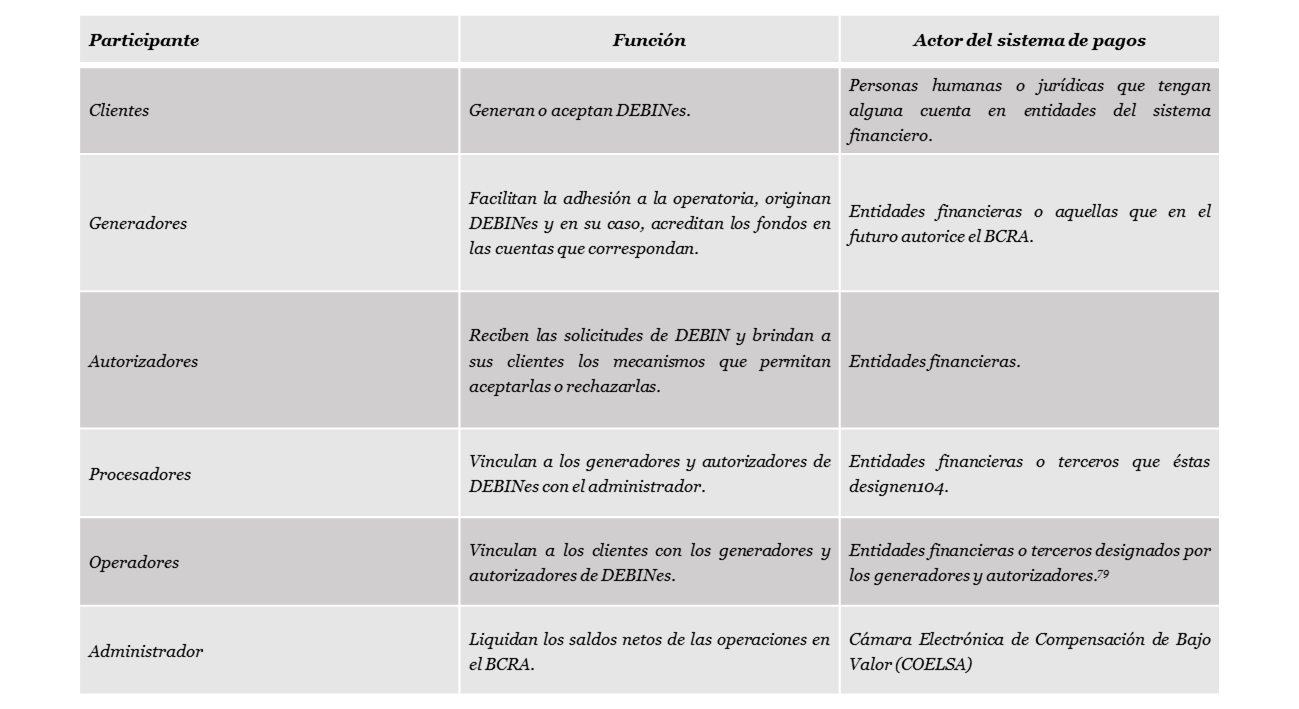
How to start trading? Customers who wish to use DEBINes must do so through the electronic channels made available to them. As a security measure in the operation, the generated debits have a life time of between 10 minutes and 3 days, a period of time in which the customer must authorize the debit in their account (otherwise the operation is canceled).
How does it work? There is a wide variety of operations that can be carried out through this means80. By way of example, the case of a collection by a company from a final consumer is presented (see Figure 4.4). To get paid, the company generates an electronic order for money. If your client accepts it on the PC or via a mobile app, the funds are credited to the applicant’s account instantly.
What are the costs? The authorizing client does not pay a commission, it will only have a cost for the initiating client of a DEBIN application.
What inherent risks do they present? How are they mitigated?
• Like any electronic operation, DEBIN is exposed to operational risks linked to a potential failure in computer systems. In addition, once the transaction has been carried out and the good or service has been delivered, there may be credit risks for the buyer (non-availability of funds) or for the entity that must make the payment (settle the transaction).
• To mitigate these risks, it is established that adherence to the DEBIN operation is framed in the “know your customer” policy and it is the financial institution that enables the customer to operate DEBIN applications, once the established requirements have been verified. As for the settlement of the operation, it has a coverage scheme with guarantees that guarantees its effective compliance. On the other hand, with regard to the security of functionalities, the BCRA requires participants to comply with the rules and requirements for the control of computer risks, in order to guarantee the genuineness of the operations.
Figure 4.4 | DEBIN Scheme
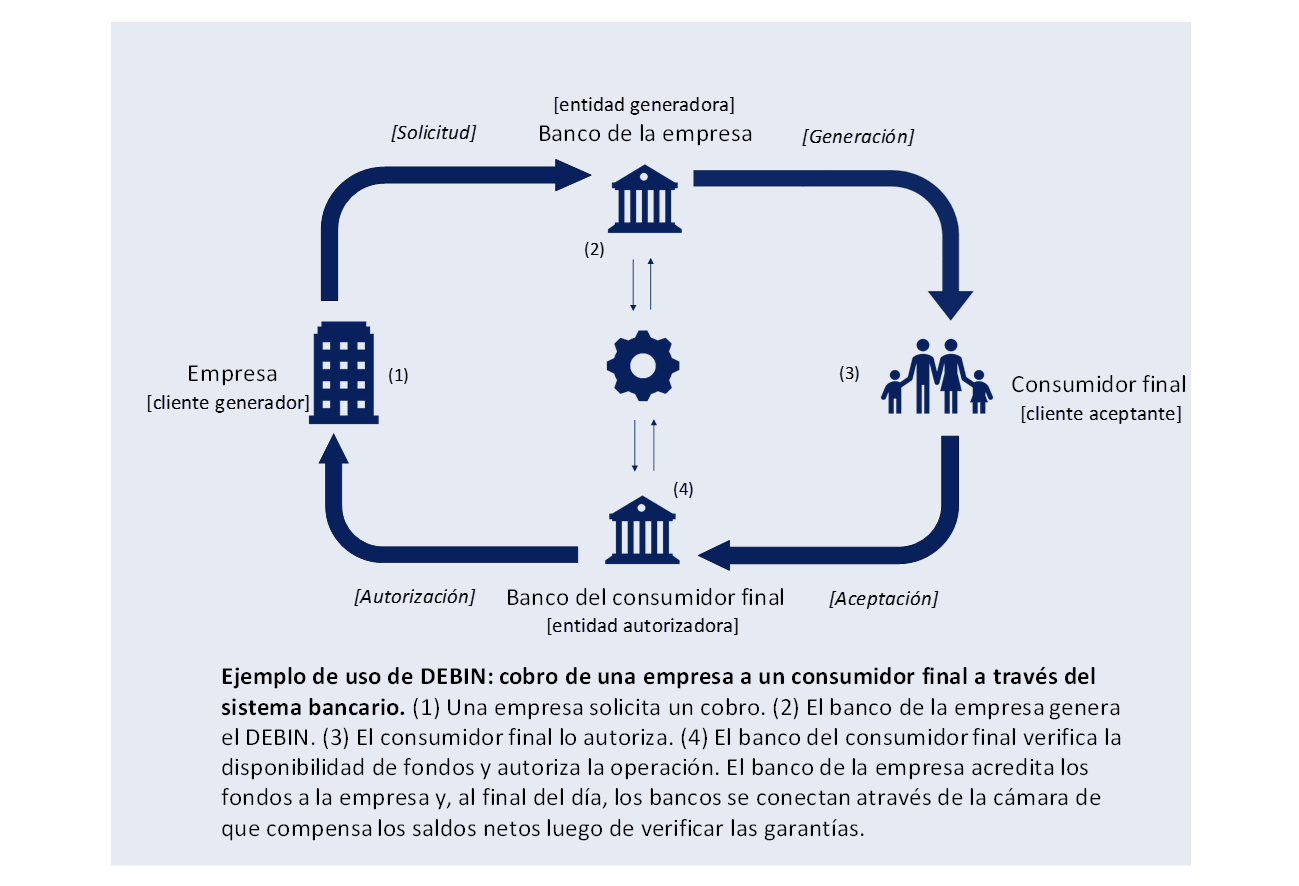
Paragraph 1 / Leverage and debt burden of companies with access to bank credit
The leverage of the Argentine non-financial corporate sector has remained relatively stable over the past three years, while the ability to repay financial debt with operating income has been improving over the past five years. Both estimates arise from a new balanced database with equity information on more than 300 relatively large Argentine companies that are indebted locally and internationally81 (see Graph 1).
This type of analysis is important in the assessment of systemic vulnerabilities, given expectations that the sector’s debt levels will deepen and in the face of the possibility of a (low-probability) scenario of sharp increases in financing costs (see International Situation). Given the local context of disinflation, greater economic predictability and improved conditions of access to credit, it is expected that companies will make their investment decisions more dynamic, having greater flexibility in choosing their capital structure.
Graph 1 | Corporate indebtedness
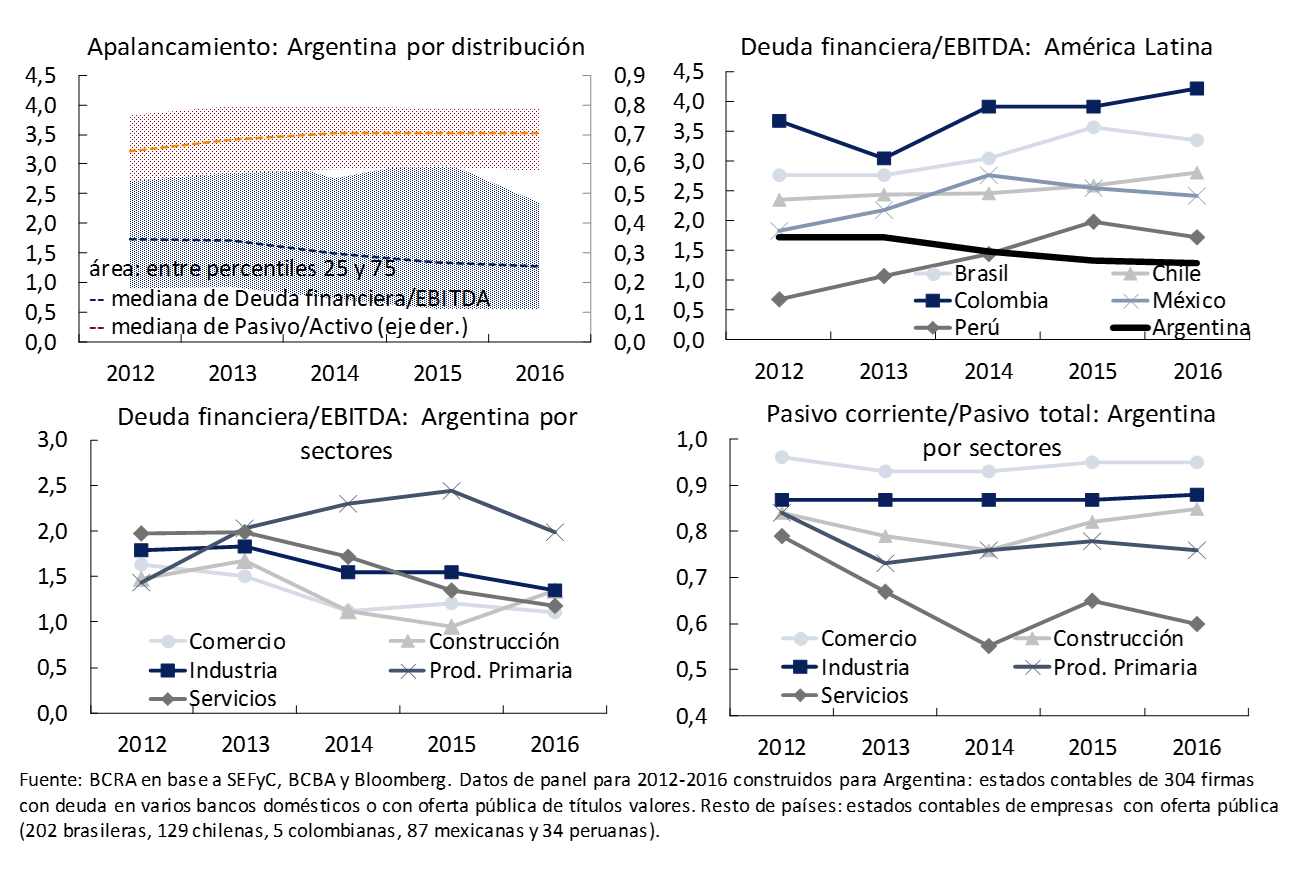
Likewise, based on the available information that emerges from the aforementioned sample, in the aggregate Argentine companies would show a relatively more comfortable capacity to pay their financial debt than their peers in the region82. That is, the time it takes for the median of Argentine companies to pay their financial debt with income is less than half compared to the value corresponding to the median of companies in Mexico, Chile or Peru. The low level of indebtedness of Argentine companies resulted from a greater use of equity, which in turn was caused by a variety of factors, including the persistence of a volatile macroeconomic environment and high inflation.
Only the primary sector shows financial debt to EBITDA ratiosof 83 close to the levels of companies in the region84. Within this particular sector, companies linked to agricultural activity and the production of food and beverages have the highest levels of financial indebtedness in relation to their operating income. On the other hand, among the other sectors, the electric power subsector stands out among those with the highest ratio of financial debt to EBITDA.
Argentine companies are relatively more exposed to refinancing risks than those in the rest of the region, especially those that are financed in the local market. The ratio of current liabilities to total liabilities for the median of Argentine companies is almost double that observed in Brazil, Colombia, Chile, Peru or Mexico. Primary sector companies, which show higher debt-to-EBITDA ratios, have, however, a lower concentration of their short-term liabilities among the sectors in the sample, due to the greater use of long-term debt instruments. At the other extreme are companies in the trade and industry sectors.
With regard to foreign currency indebtedness, working with a cross-sectional sample of almost 600 companies for 201685, the industry, primary production and services sectors are the ones with the highest ratio of foreign currency debt to total liabilities (see Graph 2). For the primary and service sectors, this debt is almost entirely explained by debt securities (70%) and financial loans (20%), while in industry pre-financing and debt from imports account for more than 70%. As mentioned in the previous IEF, companies that hold debt securities are companies of relative size and generally have income in dollars from some branch of their activities.
In summary, corporate borrowing is expected to rise amid more favorable conditions and improved economic prospects. In such a scenario, companies are relatively little indebted, with those in the primary sector, generally of tradable goods, having the greatest debt due to the use of long-term instruments and in foreign currency. The industrial sector, on the other hand, presents a manageable debt in terms of its operating income, looking comparatively a little less robust due to a greater concentration of short-term financing and from commercial lines in foreign currency.
Graph 2 | Indebtedness in foreign currency. Year 2016
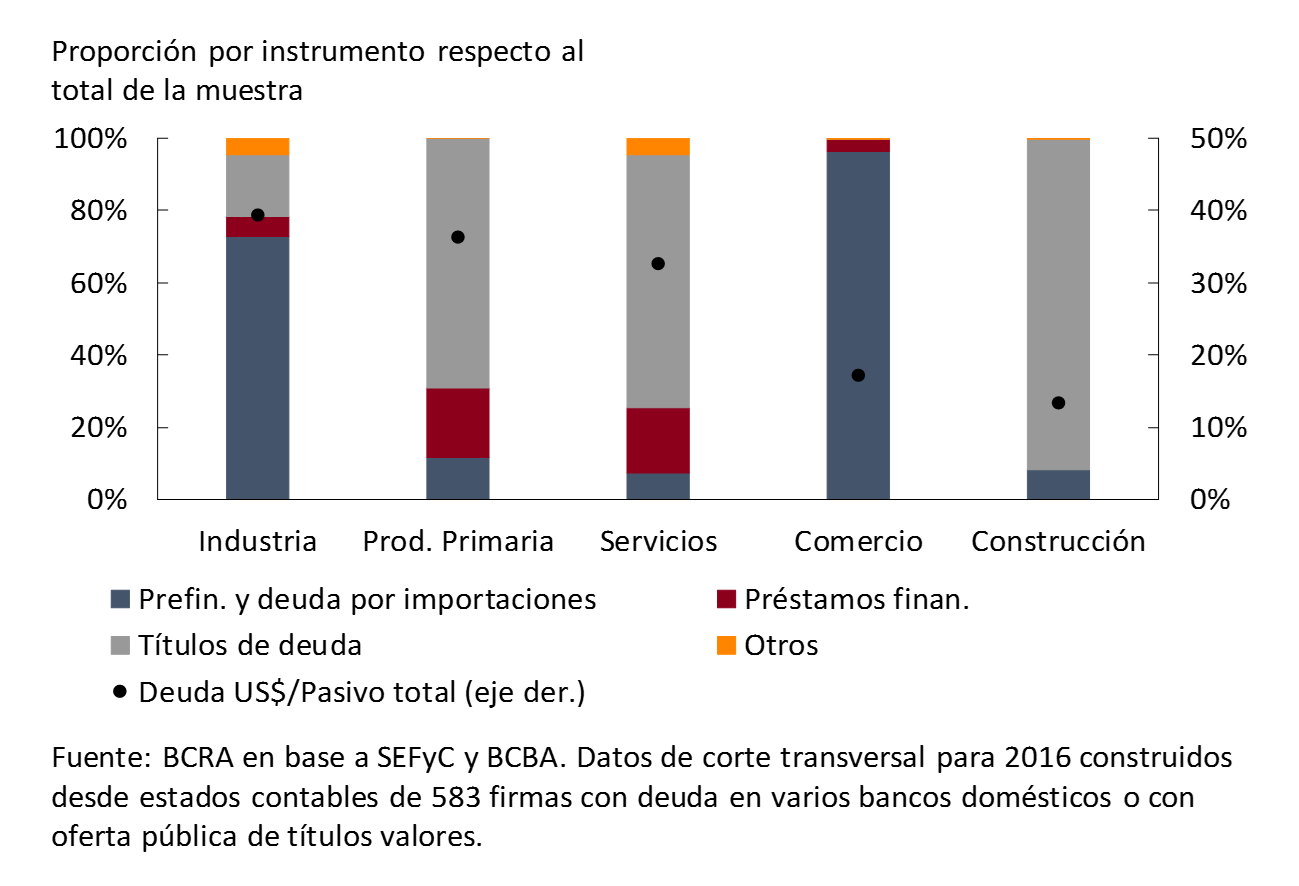
Section 2 / The tax on financial income in the world
Although in most countries there is no tax on financial income as such, it is almost without exception taxed. Income from financial operations is framed in traditional income tax schemes and, although there are differences between the concepts taxed in each country, they all have in common that they include as a taxable event some type of financial income without exception (bond income, stock dividends, interest on deposits, etc.).
For OECD member countries, the average maximum income tax rate on companies is around 24%, while for individuals it is 42%86. But, specifically, what would be called “financial income” is included in these impositions, contributing to the fairness of the tax system and encouraging the reinvestment of profits (the average rate applied to dividends distributed currently exceeds 40%, see Graph 1).
Graph 1 | The financial income tax in the world
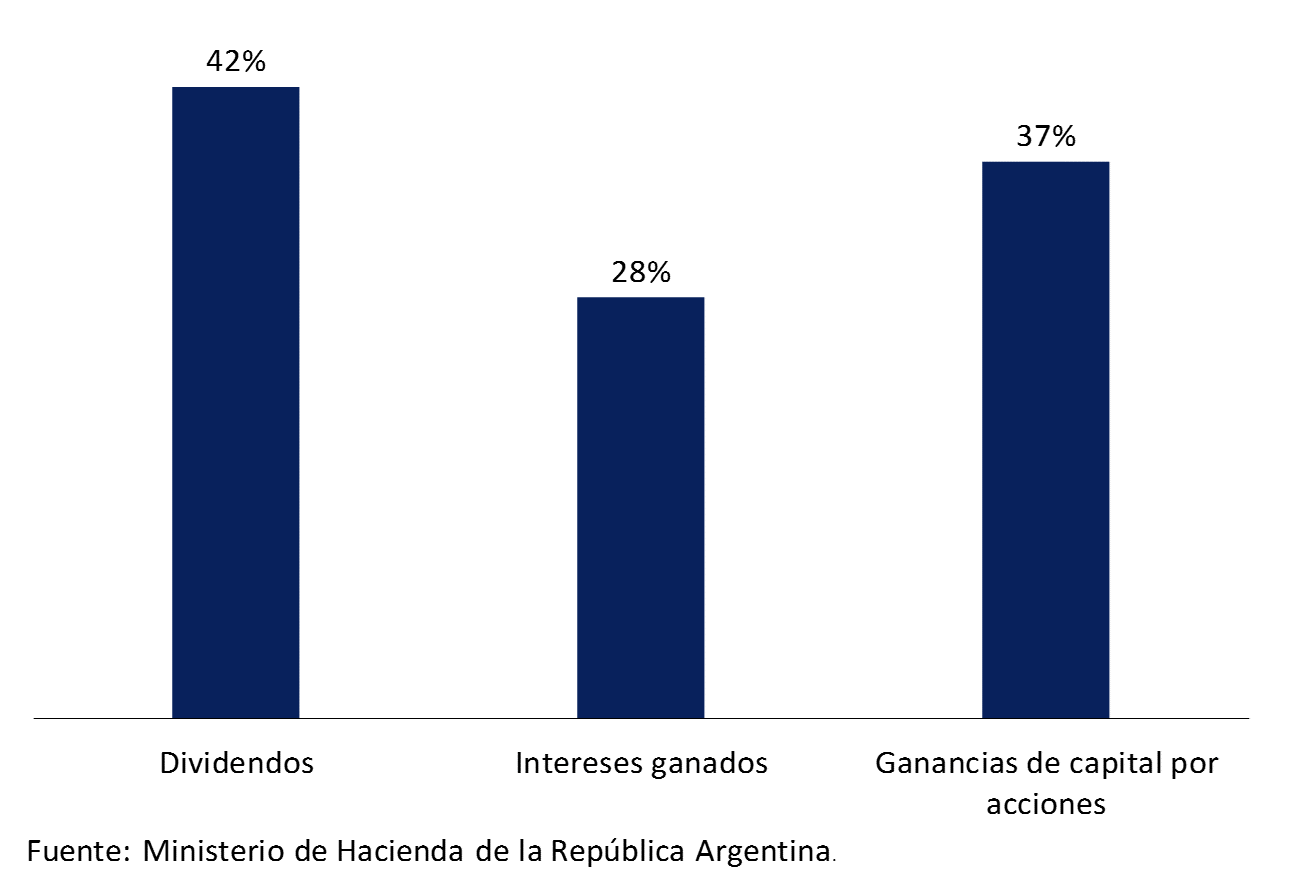
In most countries, interest and income on public securities are taxed as ordinary income at the general rate for individuals (see Table 1). In Chile and Colombia, only real interest, i.e. net of price increases, is taxed. In the United States, interest on state or municipal government securities is exempt. In Peru and Uruguay they are exempt.
In Canada, the United States, France, Switzerland and Chile, interest on bank deposits is taxed at the general income tax rate, while in Japan and Spain a differential rate of 20% and 27% is established, respectively. In Brazil, interest on savings banks is exempt, while in Peru all interest on bank deposits is exempt. As with public securities, in Chile and Colombia only real interest is taxed.
With regard to capital gains from the sale of shares, it is more common for there to be a different and generally lower rate than that of income tax. In particular, long-term capital gains tend to receive more favorable tax treatment, as in the case of the US, where a reduced rate of 20% is applied. In Latin America, the rates are 15%, 10%, 5% and 2.4% for the cases of Brazil, Colombia, Peru and Uruguay, respectively. In Chile and Mexico, this type of income is exempt.
Finally, in Germany, Belgium, Spain and the US, dividends are taxed in the same way as other income. In Peru and Uruguay, a withholding tax is applied that completes the taxation of corporate income when it is distributed to the shareholder, while in Australia, Canada, Great Britain, France and Mexico there are specific provisions that tend to alleviate the phenomenon of double taxation company / shareholder. In Brazil, Colombia and Venezuela, this income is not taxed.
Table 1 | Taxed financial income in the world
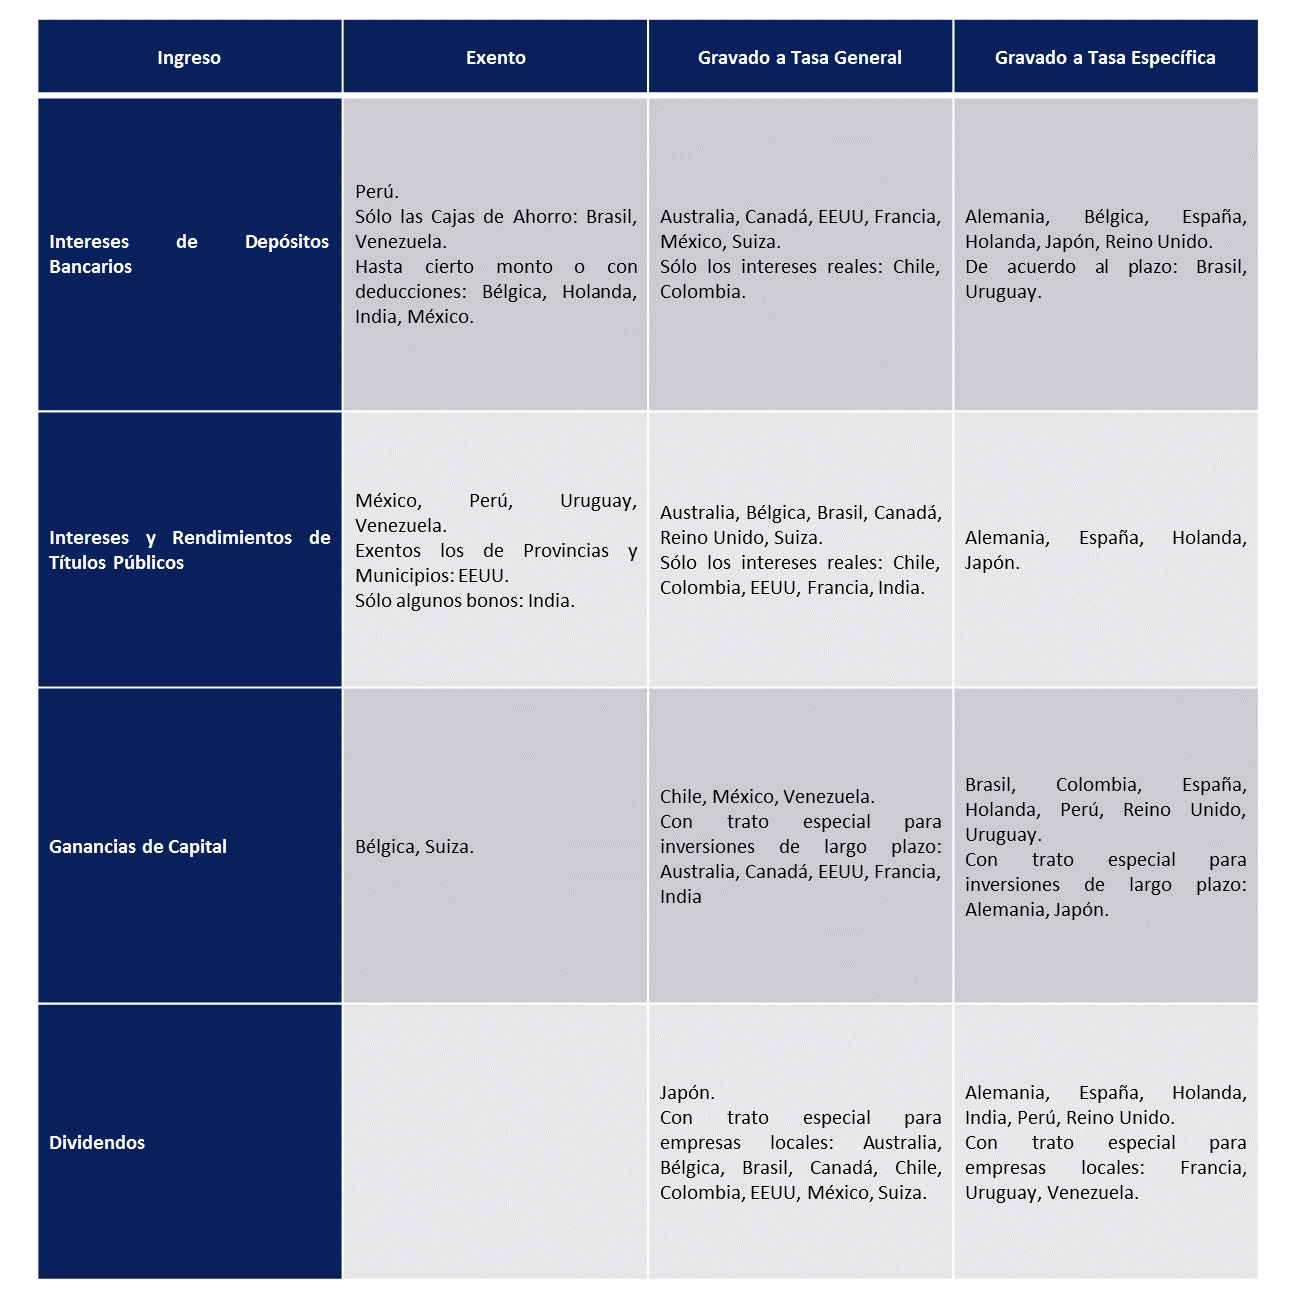
Section 3 / Fintech companies and the provision of financial services
Fintech companies are rethinking the offer of financial services. These companies take advantage of advances in the field of information technology and the improvement in communication infrastructure to provide services through electronic or digital channels87.
Although the application of technology in the financial industry is not something new, the greatest momentum and development of fintech companies was recorded from 2010 in the United States and the United Kingdom. However, this phenomenon currently involves economies with different levels of per capita income (with several successful cases, for example, in African countries). In the case of Latin America, fintechs are venturing into various lines of business, including payment solutions, alternative financing platforms, digital versions of pre-existing figures (banks, digital insurance companies, firms dedicated to asset trading and stock markets), technology companies for financial institutions (security and digital identification, fraud prevention, biometric data, etc.), alternative scoring platforms in credit assessments, personal finance management (financial services comparison and debt management platforms), enterprise finance management (electronic invoicing, digital accounting, financial management and business intelligence and collections) and wealth management, among others88. In the case of Argentina, the areas with the highest number of companies are payment solutions, alternative financing and enterprise financial management (see Graph 1).
Graph 1 | Survey of fintech companies in Argentina – Composition
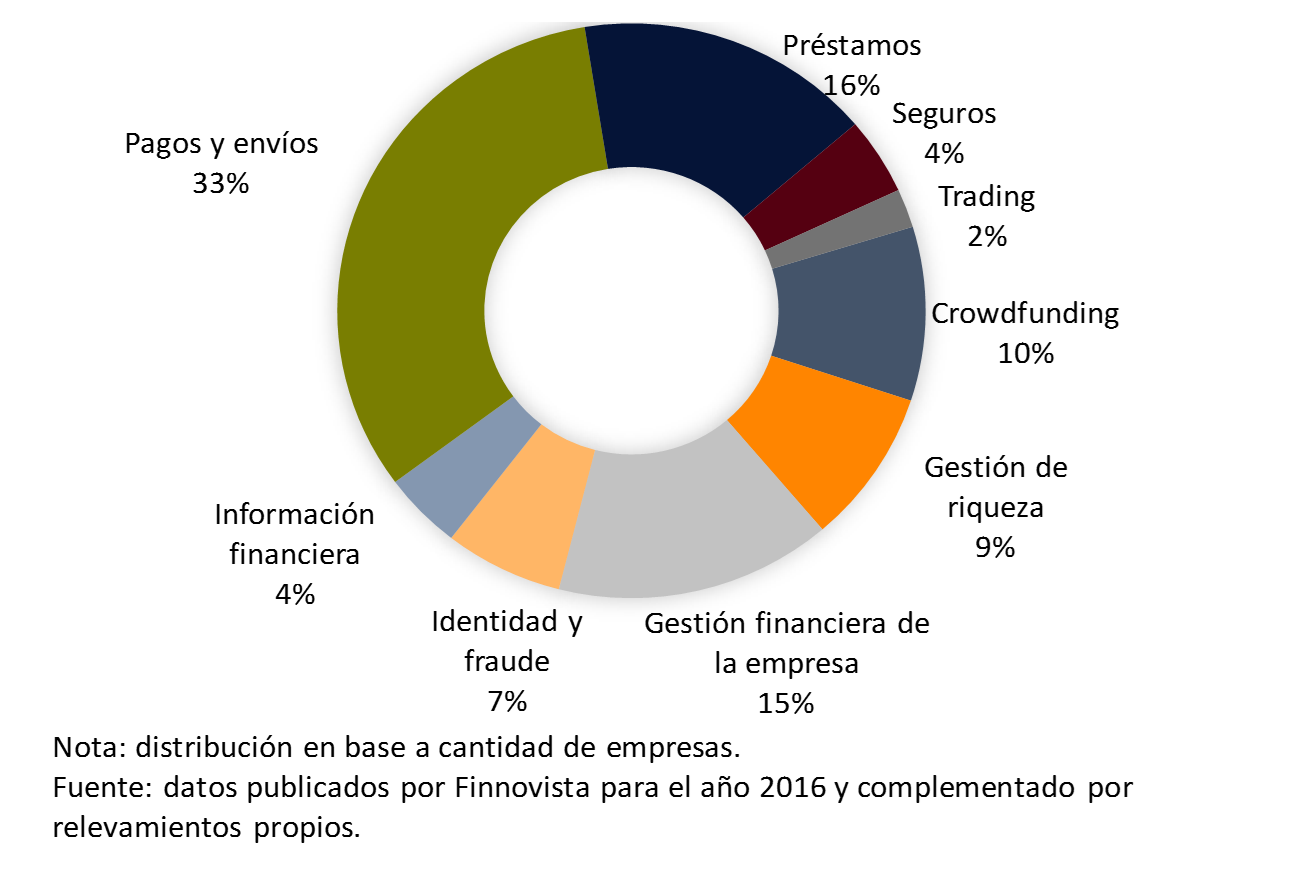
With respect to payment solutions, electronic wallets and the use of electronic money stored on cell phonesstand out in Argentina 89. The transformation of physical money into electronic money implied by these solutions allows the user greater security for the safeguarding of money, the possibility of transferring funds to geographically distant people (remittances) and the maintenance of a record of their transactions. The impact on well-being is most significant when it involves unbanked people. From the point of view of public policies, these electronic money accounts allow subsidies to be targeted or differentiated tax rates to be applied according to the type of consumer.
In terms of new financing alternatives, in Argentina there are two types of fintech: those that use their own capital to provide consumer financing or working capital and those that offer platforms to interconnect people who are looking for financing with others who want to invest their savings (crowdlending). In both cases, loan management is done through mobile apps or90 websites. This type of technology allows borrowers to connect with lenders, having as one of its main attributes the ability to process several applications without affecting the service offered. These new channels seek to reduce the physical presence of the parties as much as possible (for example, through the electronic signature of an adhesion contract). They also introduce innovations in the scoring or credit evaluation methods used, by using the behavior that the user registers on social networks, e-commerce platforms or electronic payment services.
At the moment, the financial conditions that have been observed among some fintech companies imply short terms and reduced amounts for consumer loans91. In the case of loans for working capital financing, the terms range from 2 months to 4 years, with amounts ranging from $30,000 to $1,500,000. Likewise, the cost of financing varies, tending to be high in consumer loans, with effective annual rates higher than those of financing through credit cards or those of a personal loan in a financial institution. The financial cost of working capital loans tends to be, in general, significantly lower than consumer loans and somewhat more in line with the interest rates of the financial system.
The emergence of fintechs has generated a series of debates, both internationally and locally. One of these refers to what will be the type of relationship that will end up prevailing between banks and fintech companies in the future: a situation of associativity-complementarity or one of competition-substitution. In this sense, international experience shows that although initially financial institutions did not respond immediately to the incursion of these new players, they later did so both through the development of their own fintechs, by complaining about the different regulatory burdens that fall on financial institutions and/or through cooperation strategies between them. At the local level, as of January 2017, the BCRA allowed banks to have stakes in fintech companies92.
Given that the presence of fintechs has potential effects on both financial inclusion and financial stability, there has also been a debate on the challenges they pose in regulatory terms (although there has not yet been specific progress in international regulation in this area93). This debate includes, for example, the question of which regulation should be applied: that which falls on financial institutions or a new regulatory regulatory framework adapted to the characteristics of the sector94. In the case of Argentina, in order not to inhibit innovation processes that could result in benefits for consumers, to the extent that these companies do not carry out financial intermediation, they are not subject to the regulation of the activity. Likewise, users who decide to make use of consumer loan services provided by fintechs enjoy the protection ordered by Law 24,240 (Consumer Defense Law) in Chapter VIII. On the other hand, the Entrepreneurs Law was recently passed, which in its title II, regulates the collective financing of shares (crowdfunding equity), leaving its regulation in the hands of the National Securities Commission.
Section 4 / Efficiency measures of the Argentine banking system
One of the ways to analyze the efficiency of financial institutions is by applying the Data Envelopment Analysis (DEA) technique. The application of this tool to the data of Argentine banks indicates that the potential gains from efficiency improvements would be significant for the different groups of entities. Eventual benefits are amplified if Latin American banks are added in the comparison.
Evaluating efficiency consists of comparing the observed relationship between the combinations of inputs and outputs with the optimum. Ideally, the optimal would be defined based on two elements: an assignment of value, according to preferences or priorities, and information about production possibilities. Neither of these two elements is usually available, so data are used to approximate the ideal ratio of inputs to outputs and to infer technology.
In the previous edition of the IEF, different methods for estimating an “efficient frontier” and the concept of Benchmarking95 were presented. This technique is intended to measure the efficiency of each entity in terms of those with the best performance throughout the period. DEA is a particular non-parametric and deterministic benchmarking technique, which calculates the efficient frontier using linear programming96. The DEA technique, graphically, is illustrated as the identification of an efficiency boundary in a space of inputs and outputs, and the measure of inefficiency for each unit is the distance from that boundary97.
Two DEA approaches for Argentine entities
Two approaches were used: a) the “intermediation” approach, where banks interact with the rest of the economy, using funds and producing financing, services and net results; b) the “cost” phase, where banks use equity and physical capital and incur administrative and other expenses to obtain margins for intermediation and services. In both approaches, outputs and inputs are valued by the implicit prices that emerge from financial information. In other words, the valuation of products and inputs is not social but monetary98.
Quarterly data were used for the period December 2004 to March 2017. Given that the methodology assesses management in a specific context, it is worth remembering that during the first part of the period (normalization phase after the 2001/02 crisis) the results reflected losses that had been activated, some banks were funded with the assistance of the BCRA, and there were exceptional prudential and valuation standards. In the middle of the period, minimums and maximums were set for some interest rates, a portion of credit was directed and flows in foreign currency were restricted, affecting the behavior of savers, credit seekers and banks. The nationalization of pension funds and the international crisis impacted the banking business in 2008/09. In the last stage, the banks have gone through a period of normalization of the foreign exchange market, disinflation and a significant income of foreign currency that was progressively channeled into credit99. In this framework, the inefficiency for each entity and quarter is measured by comparing it with the best observation within the sample of banks operating in the local market.
For the years, the entities were grouped into public banks (Group 1 or 2, depending on the bias towards the retail business), and into other regional financial institutions, universal banks, smaller entities oriented to retail credit and national wholesale banks (Groups 3 to 6)100. Input and output prices were estimated using the median of each group.
Results
After an initial stage with a tendency to improve (until 2007/2008), the levels of inefficiency of the system (1-efficiency) fluctuated in the period and showed at the beginning of 2017 average levels of around 35% in the intermediation approach and 20% in the expenditure approach (Graph 1)101.
Graph 1 | DEA analysis results
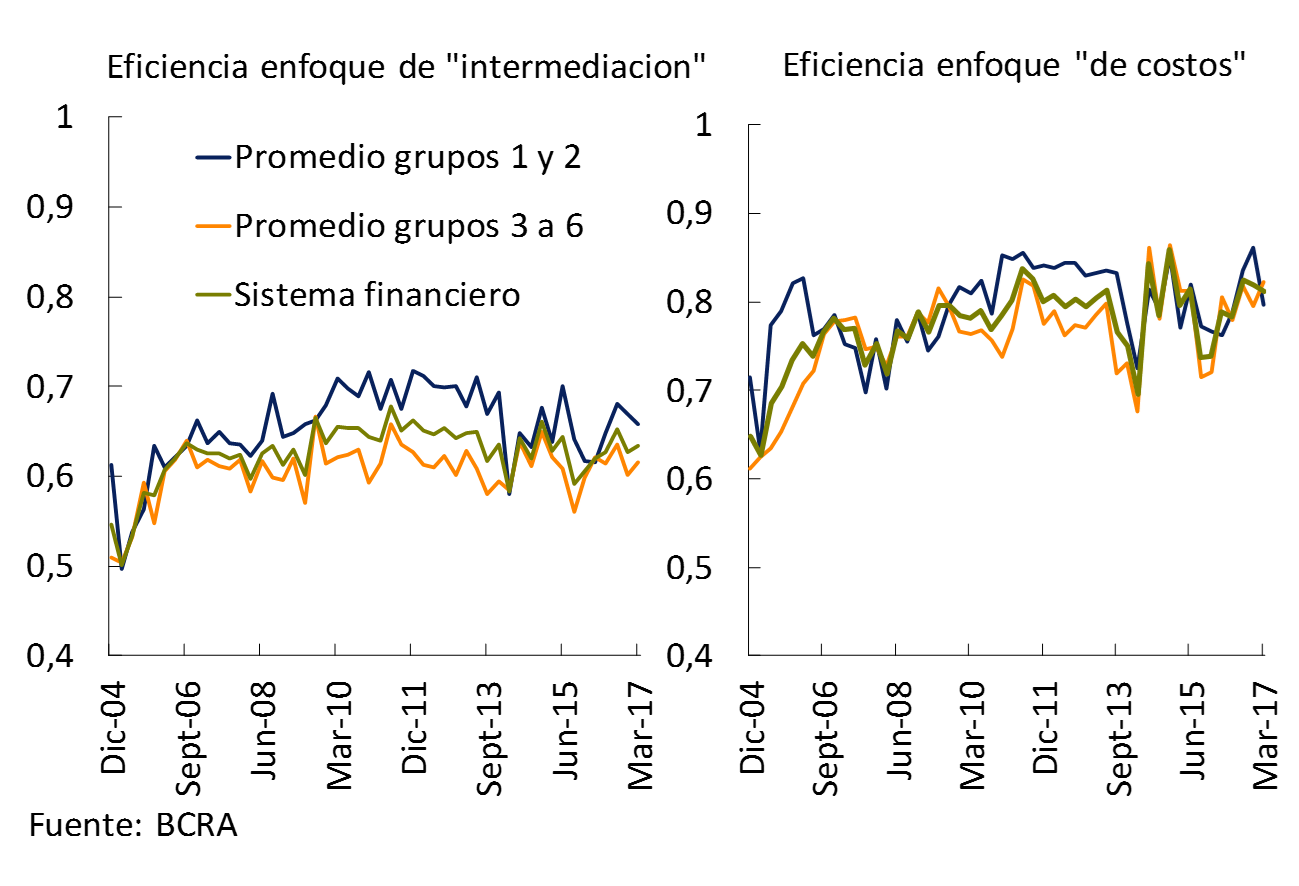
You can calculate how much output could increase without changing inputs (a way to improve efficiency partially). According to the cost approach, banks could together increase assets by intermediation by 20% without changing expenses (administrative, liquid capital or physical capital). Doing the same analysis with the intermediation approach, it is estimated that banks could increase their loans and services by about 10% without modifying their inputs. It is also possible to estimate the potential efficiency gains of a hypothetical merger of entities belonging to the same homogeneous group102. Theoretical mergers in this exercise would generate potential gains for all groups. Learning efficiency would correct almost all estimated inefficiencies, except in the group of entities very oriented to the retail business and local wholesalers, in which case they would have an additional gain for increasing the scale of operation. Gains from harmonization are not significant in any group103.
To complement the analysis, banks from Chile and Peruwere included 104. Applying the intermediation approach, greater inefficiency is measured for the Argentine system (55% vs. 35% with the local sample). In addition, it is estimated that about 40% (in terms of assets) of local entities would operate in the scale range with increasing returns, that is, they could gain efficiency if they increase the scale.
Section 5 / Housing credit in Chile’s financial system
In the context of the growth that UVA mortgage credit has been showing in Argentina, it is relevant to explore experiences from other countries to enrich the analysis. In particular, it is interesting to observe the Chilean case, since it was possible to achieve the highest penetration of bank loans for housing when compared to other Latin American economies. The dynamism of the mortgage market in the trans-Andean country gained relevance with the development and widespread use of the Unidad de Fomento105 (UF) and, subsequently, with the control of inflation since 1991. At the same time, the development of financial markets was also important, along with effective supervision and, in the particular case of credit for lower-income segments, the operation of public banks and the process of learning and modifying subsidy mechanisms were relevant. Below are some features of the process of increasing bank loans for housing.
Graph 1 | Total credit to the private sector, housing credit, and bank bonds As % of GDP – Chilean financial system
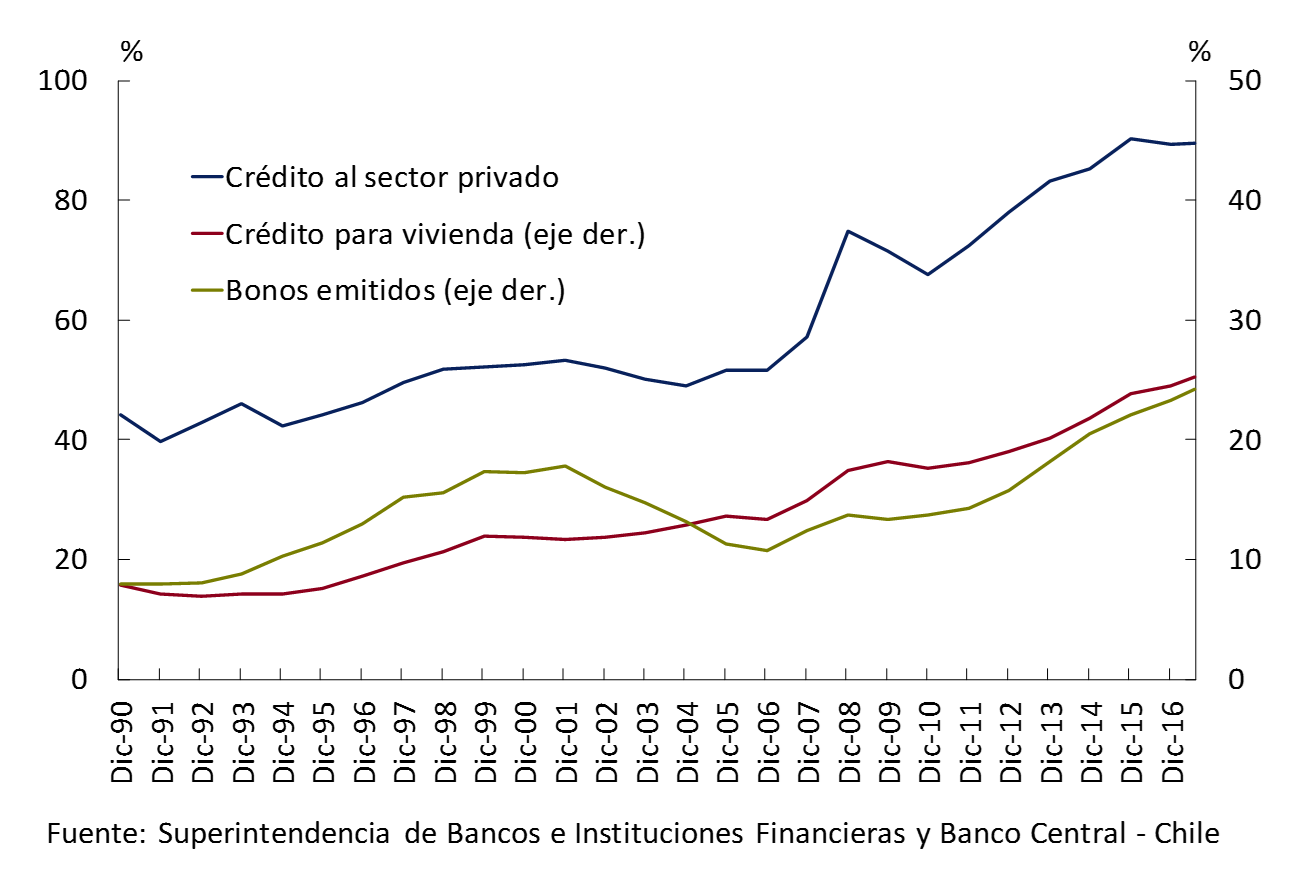
In the last 25 years, bank credit for housing went from 8% to 25% of GDP in Chile (see Graph 1) and, with this, this segment actively participated in the expansion of total credit to the private sector, which reached almost 90% of GDP in mid-2017. Housing loans have increased in importance, from 17% of total loans to the private sector in the early 1990s to 28% today. Housing loans were granted mainly in UF (currently representing 97% of the total balance). It should be considered that this process took place in a context in which inflation went from levels above 30% at the end of 1990 to less than 10% in 1995 and, thereafter, remained at low levels.
On the side of bank funding, since the end of 1990 there has been a sustained increase in the bonds issued by banks. About 80% of the total amount of these instruments was issued with a maturity of between 2 and 15 years (current or ordinary bonds), while the rest was placed with a maturity of between 10 and 30 years (subordinated bonds). It should be considered that currently almost three quarters of the bank bond portfolio is denominated at UF106.
In addition to housing loans, the Chilean financial system holds other assets denominated in UF: part of commercial loans (32%) and portfolio investments (14%) (see Chart 2). In total, about 35% of the assets of the group of banks are in UF. On the funding side, in addition to bonds, a small portion of deposits (9% of deposits) was captured in UF. Thus, 20% of the total funding corresponds to instruments in UF. In summary, in the Chilean financial system there is a differential between assets and funding in UF of the order of 180% of aggregate net worth, a value that has not changed much in recent years (see Graph 3).
Graph 2 | Composition of the Bank Balance Sheet Chilean Financial System – July 2017
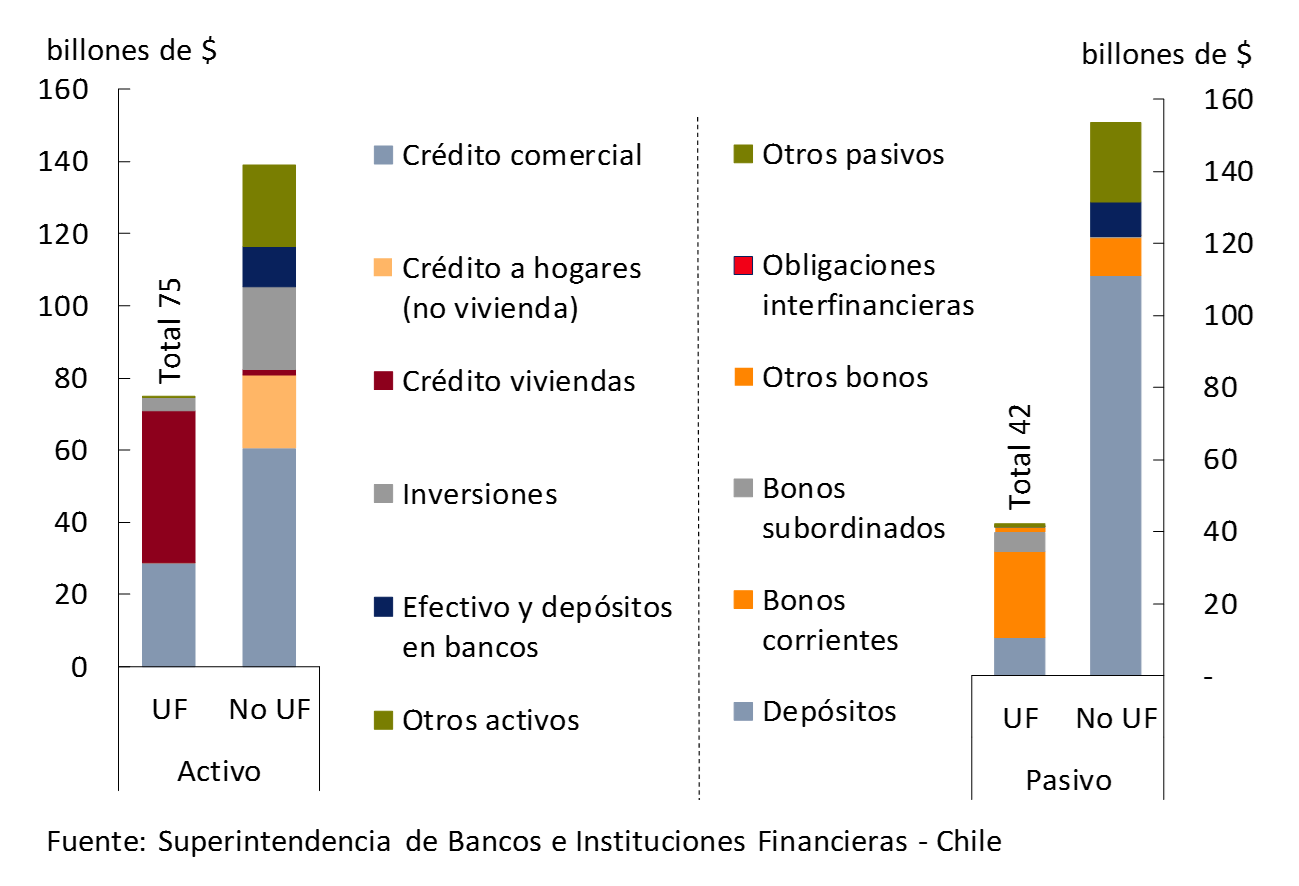
Figure 3 | Mismatch of items in UF – Chilean financial system
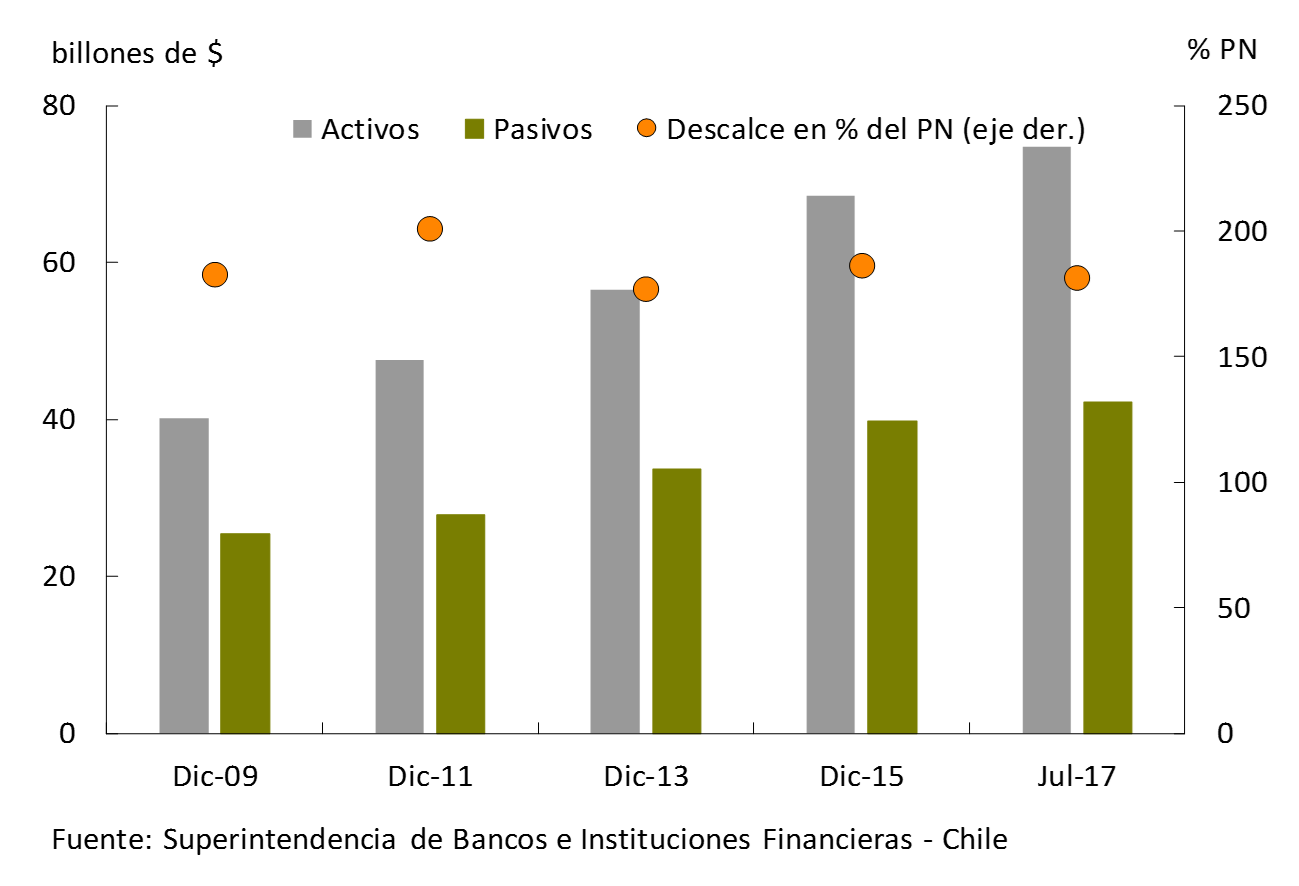
The characteristics of the bonds issued, in terms of term (long) and currency (UF), helped to temper the typical mismatches caused by mortgage credit. The issuance of these bonds reflects a case in which long-term savings for housing financing are channeled through banks without extensive use of asset securitization or second-tier banking107. It should be noted that pension funds played an important role as demanders of medium and long-term debt instruments. At the end of 2016, these institutional investors held most of the bank bonds issued in UF108.
References
1 According to the Central Bank of Brazil’s Market Expectations System, year-on-year economic growth is expected to be 0.7% for 2017 and 2.5% for 2018 (-3.6% and -3.8% in 2016 and 2015, respectively). For more information, see IPOM of October 2017.
2 In late October, S&P upgraded the rating of long-term foreign currency sovereign debt by one notch to B+ (the third rating upgrade since late 2015), citing increased confidence in the government’s political ability to continue advancing its economic agenda.
3 For example, for companies, the weighted average term of placement in dollars in international markets during January-October was 7.6 years, while for instruments in pesos in local currency in domestic markets it was almost 2.5 years.
4 See reports on “Evolution of the Single and Free Exchange Market and Exchange Balance”.
5 For more information, see IPOM of October 2017.
6 The other source of systemic financial risk, the one that operates through the trade channel, although with a lower relative impact, is given by a possible lower demand for export goods (if Argentina’s trading partners are affected). Eventually, this source could materialize the credit risk assumed by the financial system.
7 The Federal Reserve decided on two interest rate hikes in 2017. A new increase is anticipated by the end of this year and two increases in 2018. In September, it was announced that the Federal Reserve will gradually begin cutting its asset holdings by about 10% until the end of 2018. Expectations about the monetary policy of the United States were not altered so far after the announcement of the candidate for the presidency of the Federal Reserve. For its part, the European Central Bank announced a moderation in the pace of purchases in October, while signaling that it would keep interest rates unchanged for an extended time.
8 Based on the information available, an annual period of growth of around 4% would be completed by the third quarter. This trend would be sustained in the last quarter according to the ILA-BCRA Leading Indicator of Activity. See IPOM of October 2017.
9 Gross investment grew 11.4% s.e. in the first half of the year, exceeding the highest levels of 2015, while private consumption rose 6.2% s.e. According to leading indicators, these trends continued in the third quarter. See IPOM of October 2017.
10 In order for inflation to approach levels consistent with the target of 10% ± 2% for 2018, two increases in the monetary policy rate were implemented between the end of October and the beginning of November for a total of 250 basis points, to 28.75% (after the increase that had been made in April). .
11 Despite this, the increase in time deposits remains limited (see Chapter 3).
12 For example, lower taxes on corporate profits, accelerated refund of VAT balances for long-term investments, gradual implementation of a non-taxable minimum for employer contributions, the reduction of cascading taxes, elimination of the tax on the transfer of real estate, establishment of a tax on capital gains made with the sale of real estate not intended for housing, and changes in internal taxes.
13 The rate on yields on instruments in pesos without an adjustment clause may be increased according to the prevailing economic conditions (up to 15%).
14 Non-resident legal entities are already taxed (although public securities, LEBAC and ON are exempt). Non-resident individuals would be taxed for most transactions.
15 Since the publication of the last IEF, the government has made debt placements abroad for the equivalent of almost US$6,000 million, highlighting the lengthening of financing terms, the placement of bonds in different currencies (dollars and euros) and diversification in terms of the origin of investors. In the local market, a three-year peso bond with a coupon was placed following the monetary policy rate. On the other hand, dollar bills continued to be placed. New repo operations were also carried out with investment banks.
16 Negotiable obligations, financial trusts, deferred payment checks and stock market promissory notes.
17 Recently, the CNV included the authorization of new investment alternatives (FCI in different currencies) and financing (simple ON for SMEs), in addition to creating new figures (global investment advisory agent).
18 Since the issuance of negotiable bonds in UVA or UVI was allowed, there have been two bank placements.
19 In the second part of the year, the launch of LEBAC futures was highlighted.
20 More recently, some profit-taking was observed in the last rounds.
21 Estimates published by Reuters. The number of companies with earnings estimates reduces the sample size and could make it less representative.
22 If the holding of LEBAC held by the non-financial private sector is incorporated, this ratio would rise to 21% of GDP as of September 2017 (1.2 p.p. more than in March), with almost half corresponding to mutual funds.
23 In this exercise, the cycle is measured as the difference between the monthly value of the variable and its long-term trend, calculated using the Hodrick-Prescott filter with a lambda of 14400, since these are monthly series.
24 An indicator of the financial cycle is the gap between credit granted to the private sector (under all possible modalities, not just banking) in terms of GDP and its long-term trend. Within the macroprudential policy approach, this variable is one of the indicators used to assess systemic financial risk (see Chapter 3). For the credit cycle to the private sector, balances on the balance sheets of financial institutions are included plus balances in suspense accounts, financial trusts whose underlying assets are bank loans, and financing from companies that issue non-bank credit cards. The series used correspond to the logarithms of the deflated values. For the output cycle, the monthly EMAE is used as a proxy for GDP. More details on the economic cycle in IPOM of October 2017 – page 16.
25 The assets are presented net of accounting duplications for pass-through, forward and cash transactions to be settled.
26 Loans channeled by public and private national banks were the most dynamic, accounting for two-thirds of the year-on-year increase in financing to the private sector.
27 Variation in currency of origin.
28 As of September, total deposits in pesos of the private sector registered a slight real year-on-year drop of around 1%.
29 Meanwhile, between March and September, public sector deposits reduced their relative importance in total funding.
30 Credit in pesos to the private sector is considered. Trajectories are assumed with a constant real monthly growth rate ranging from 1% to 2.2% (from April to October 2017, the average rate was 2.2% real per month).
31 Deposits in pesos from the private sector are taken into account. This projection of deposits is consistent with the macroeconomic and monetary aggregate projections based on the BCRA’s econometric models. In addition, an additional set of simplifying assumptions is adopted on bank reserve requirements, results, evolution of the rest of the assets and liabilities that make up the balance sheet and the absence of capital contributions and dividend distributions.
32 An indicator is used: LEBAC (passes + holdings) / deposits in pesos from the private sector. For this indicator, a range of minimum values is also considered, ranging from 10 to 25%. With data as of September, this indicator stands at 28%.
33 In the last 15 years, two stages of sustained credit growth have been distinguished, with real monthly rates of around 1.1% (between the beginning of 2010 and the end of 2013) and 1.6% (between the end of 2003 and the end of 2007).
34 During periods of sustained credit growth, it was observed that the financial system reduced liquidity levels, reaching a minimum of around 20% at the end of 2013.
35 It may be considered that the analysis of the threshold at the level of an individual entity may present different situations.
36 For a review of the international empirical evidence on the short-term relationship between the decline in inflation levels and the variation in the level of economic activity, see the note published by the BCRA on Disinflation and Growth.
37World Development Indicators.
38 Events with initial annual inflation levels of more than 10% and less than 100% are considered.
39 This trend is also observed when considering all economies, not only those with a credit-to-output ratio of less than 25%.
40 For more details, see IEF for the first half of 2017.
41 It is of interest to explore the evolution of this rate differential in order to better interpret the results generated in the traditional financial intermediation process. In this sense, the implied lending rate is defined as the quotient between the annualized quarterly flow of accrued interest and the average loan balance for the period. The implicit funding cost for deposits is defined as the ratio between the annualized quarterly flow of interest paid and the average balance of deposits adjusted for reserve requirements. The data correspond to the non-financial sector. Implicit interest rates (ex post) are related to flows that originate in operations agreed in the past and incorporate information that was not known at the time of the transaction, such as the level of compliance of the debtors or possible cancellations of credits, among other dimensions. On the other hand, the interest rates operated (ex ante) reflect more efficiently the conditions of the environment at the time of the transaction, such as market competition, changes in macroeconomic variables, expectations, etc.
42 In fact, if an exercise is carried out keeping constant, between peaks of the period, both the composition of funding and the share of loans according to maturities, the spread would remain relatively constant in the year-on-year comparison.
43 See IEF I-16, IEF II-16, and IEF I-17 for more detail.
44 It should be considered that the value achieved by administrative expenses in 2017 as a whole could eventually increase as a result of the pending adjustments linked to the joint agreement in the banking sector, especially due to the contingent component linked to the evolution of inflation.
45 See Chapter 2 of IEF II-16.
46 Capital retention of 2.5% of RWA, which extends to 1% of RWAs for the 5 systemic banks. Margins do not constitute a regulatory minimum. Failure to comply with this imposes restrictions on the Distribution of Results (Consolidated Text on Distribution of Results).
47 The aforementioned 15 entities that are closest to meeting the margins (less than 2 p.p. of the RWAs to cover them) account for just over 24% of total assets. The remaining 3 entities (more than 2 p.p. of RWAs to cover margins) total approximately 9% of the assets of the financial system.
48 Ratio between capital with the greatest capacity to absorb losses and a broad measure of exposures.
49 For more detail on the methodology, see IEF I-16.
50 For more details on the determination of local systemically important entities (D-SIBs), see HERE. As of September, the 5 systemically important entities accounted for 52% of the sector’s total assets.
51 It is estimated that financing from the top 100 private sector debtors accounted for 15% of total financing to the private sector in mid-2017, 3.3 p.p. lower than in the same period in 2016.
52 Excluding the minimum forecasts – according to the regulations – for the regular portfolio, the forecast would be equivalent to 85% of irregular financing.
53 The MPI is estimated both in terms of the debt stock and credit assistance. For more details on the construction of the indicator, see page 38 of IEF I-17.
54 A similar behavior was evidenced in the indicator that considers the balance in an irregular situation in terms of the total balance of a year ago (expressed all in pesos of the same purchasing power).
55 On the basis of IEF I-16, three sensitivity exercises are developed, based on extreme assumptions: 1) “exercise A”: inability of debtors in an irregular situation to pay with the latest available information; (2) “exercise B”: an increase in the irregularity ratio in each institution to the maximum reached at the peaks of the international financial crisis (between IIS-07 and IS-10) and then default on such loans; and 3) “exercise C”: impossibility of repayment of the 10 companies that owe the most to the financial system.
56 See previous note.
58 Belonging to group A.
59 For more details, see the ordered text on the Stable Net Funding Ratio.
60 The UVA mismatch was located at 29% of the PRC for public ones, 10% for foreign private ones and 7% for national private ones.
61 In Chile, this mismatch reached about 180% of the regulatory capital (see Section 5).
62 For more detail, see Chapter 1 of the IPOM of October 2017.
63 This consideration is also valid in the case of interest rate mismatch.
64 At the same time, in order to mitigate the intrinsic risks in these operations and promote complementarity with the capital market, the BCRA continues to work so that this type of credit can be securitized in the future.
65 Demand deposits have a simplified treatment in the calculation of interest rate risk, where 50% of them can be considered as stable funding and, if necessary, they can cover mismatches in other time bands.
66 Guidelines for Risk Management in Financial Institutions, Section 5.
67 Another method used considers a rise in the interest rate equivalent to that evidenced in decile 99 of the year-on-year variations of the last 5 years. According to this calculation, the economic value would have decreased by 19.4%.
68 The economic value of the financial institution shall be determined by the present value of the entity’s expected cash flows, i.e. the expected cash flows of the net assets of liabilities plus net off-balance sheet positions.
69 Even if the final settlement between banks or authorised operators is deferred by clearing at the end of the day.
71 For example, in the case of non-bank instruments and channels, the clearing may be carried out by the authorizer himself.
72 Com. A6235. Entities must extend these limits at the request of customers for specific operations for higher amounts, which substantially facilitates real estate or automotive acquisition operations.
73 For more detail see IEF I-17.
74These are transfers with online accreditation made through the following channels: internet banking, ATMs and self-service terminals, electronic business banking, mobile banking.
75 The shares are similar in terms of amounts traded.
77 To have a dimension of the relative importance of the MEP, the amounts of operations accumulated in the last 12 months to September 2017 are equivalent to a little more than 4 times the average GDP for the same period.
79 The High Value Electronic Clearing House (Interbanking) may participate as an operator and/or processor of DEBINes.
80 For more details, see ordered text National Payment System. Immediate debit”.
81 This panel database for 2012-2016 was built based on data provided by the SEFyC, on companies surveyed for having several lines open in local banks, and data on companies with public offerings. The aggregate information of the database thus constructed shows, for variables of relevance (e.g., leverage), values very similar to those observed for databases of greater breadth (such as that of the AFIP, although the latter presents a greater lag in the availability of data).
82 Given the availability of information, data from companies admitted to public offering in each country collected by Bloomberg were used for the international comparison.
83 Earnings before interest, taxes and amortizations.
84 The construction sector shows an increase in 2016, depending on the behaviour of two specific companies.
85 This database is of the cross-section type for companies that closed their fiscal year within 2016 (which earns observations regarding the panel data), based on data provided by the SEFyC on companies surveyed for having several lines open in local banks, and data on companies with a public offering.
86 See KPGM https://home.kpmg.com/xx/en/home/services/tax/tax-tools-and-resources/tax-rates-online/individual-income-tax-rates-table.html https://home.kpmg.com/xx/en/home/services/tax/tax-tools-and-resources/tax-rates-online/corporate-tax-rates-table.html.
87 Such as mobile applications for cell phones and websites.
88 Inter-American Development Bank and Finnovista (2017). Fintech: Innovations you didn’t know were from Latin America and the Caribbean.
89 For more details on developments and innovations in the payment system, see Chapter 4.
90 In the first case, the platforms, after the user’s request for financing, inform within a short period of time the conditions under which the loan would be granted. In the second case, the user publishes his or her financing application, specifying the characteristics of the project that will be used for the loan and the financial conditions demanded. On the other hand, savers who use the same platform can make offers to contribute funds to projects seeking financing. The latter, called “investors”, can allocate the portion of their capital that they deem appropriate within the limits that the fintech company establishes for the purpose of diversifying risks.
91 In some cases, when the fintech has consumer loans available for higher amounts, it is simultaneously observed that the term of the financing is also extended, and can reach from 1 to 3 years.
92 Initially introduced by Communication A6154 in January 2017 which was later replaced by Communication A6277.
93 The Financial Stability Board has set out a work agenda (see “Financial Stability Implications from FinTech”). For its part, the BIS generated a document for discussion with observations and recommendations on the treatment of the fintech sector by banking supervisors (“Sound Practices: Implications of fintech developments for banks and bank supervisors”).
94 In Latin America, only in Mexico has progress been made in the development of a comprehensive fintech bill that compiles the experiences of countries such as England and Canada in this area.
95 See IEF I-17 for an introduction to the subject and references to the literature. See Balzarotti, V (forthcoming).
96 An advantage of DEA is that it does not require assumptions about the functional shape of the boundary or about randomness and only needs very general assumptions about technology (see Charnes et al. 1978). The trade-off is that the distance between an inefficient unit and an efficient one is interpreted entirely as inefficiency.
97 The most widely used measure of efficiency is the one suggested by Debreu and Farrell, which measures whether inputs can be reduced (proportionally) without changing the product, or set of products.
98 Handling two options allows you to propose different exercises depending on the different configurations. For example, the first approach allows us to evaluate the impact of a change in the relative price of investments versus loans. The second approach, on the other hand, makes it possible to measure how much assets could be increased through intermediation without modifying expenses.
99 Funds primarily associated with tax laundering that decrease efficiency as measured in these approaches.
100 Entities in a reorganization plan and others with particular business models (foreign wholesalers and specialized financial companies) were excluded. From the remaining group, the 1% of the most extreme results were excluded, to prevent particular issues from impacting the results since they are measured against the best in the sample.
101 If public sector deposits and judicial deposits are treated more acidly because they are considered “privileged” funding (in terms of the lower possibility of the depositor migrating or the lower return required), banks that have significant funding in them lose efficiency compared to the rest by a significant percentage.
102 Such gains can be broken down into learning (each unit adjusts to best practices among its “peers”), harmonization (measures the result of adjusting inputs and outputs to optimal combinations), and scale.
103 Considering the heterogeneity of inputs and products, mergers between homogeneous banks were proposed.
104 So far Chile and Peru. This exercise must be done without underestimating that it implies assuming that the rules, relative prices and the context in general are also equated.
105 The UF is a unit of account that is adjusted according to the monthly variation of the CPI of the previous month and was introduced in 1967 to stimulate the development of the mortgage market. Over time, its use was extended to other types of credits and contracts.
106 The rest, 18% in foreign currency and 8% in Chilean pesos.
107 The securitization of mortgages and funding through second-tier banks (Corporación de Fomento de la Producción) have not been relevant factors in the process of expansion of housing loans in Chile, as Alarcón, Demaestri and Piedrabuena point out. Housing financing in Chile. Inter-American Development Bank. 2014.
108 It is estimated that these bonds represented almost a quarter of the total pension fund portfolio at the end of 2016. This holding of bonds by pension funds would exceed 60% of the total outstanding of these bonds.
Glossary of abbreviations and acronyms
€: Euro
Acum.: Cumulative
AFIP: Federal Administration of Public Revenues
ANSeS: National Social Security Administration
RWA: risk-weighted assets
ATM: Automated Teller Machine
BADLAR: Buenos Aires Deposits of Large Amount Rate (interest rate paid for fixed-term deposits of 30 to 35 days, more than one million dollars, average of entities)
ECB: European Central Bank
BCBA: Buenos Aires Stock Exchange
BCBS: Basel Committee on Banking Supervision
BCRA: Central Bank of the Argentine Republic
IDB: Inter-American Development Bank
BIS: Bank for International Settlements
BoE: Bank of England
BONAD: Argentine Nation’s Dollar-Linked Bond
BONAR: Argentine Nation Bond
BONCER: Treasury Bonds in pesos adjusted for CER
BONTES: Treasury bonds in pesos at a fixed rate
CABA: Autonomous City of Buenos Aires
CAFCI: Argentine Chamber of FCI
Call: Interest rate on unsecured financial market operations
CCP: Central Counterparty (Contraparte Central)
CDS: Credit Default Swaps
CEMBI+: Corporate Emerging Market Bond Index Plus
CER: Reference Stabilization Coefficient
CNV: National Securities Commission
DEBIN: Immediate Debit Payment Method
DPN: National Public Debt
DSIB: Domestic Systemically Important Banks
ECAI: External Credit Assessment Institution
ECB: European Central Bank
ECC: Credit Conditions Survey
USA: United States
EFNB: Non-Banking Financial Institutions
EMAE: Monthly Estimator of Economic Activity
EMBI+: Emerging Markets Bond Index
EPH: Permanent Household Survey
FCI: Mutual Funds
Fed: US Federal Reserve
Fed Funds: US Federal Reserve Benchmark Interest Rate
FGS: Sustainability Guarantee Fund
IMF: International Monetary Fund
FSB: Financial Stability Board
GBA: Greater Buenos Aires (includes all 24 matches)
A.I.: Year-on-year
IAMC: Argentine Institute of Capital Markets
IBIF: Gross Domestic Fixed Investment
IEF: Financial Stability Report
INDEC: National Index of Statistics and Censuses
CPI: Consumer Price Index
IPIM: Internal Wholesale Price Index
MPPI: Commodity Price Index
IPOM: Monetary Policy Report
VAT: Value Added Tax
LCR: Liquidity Coverage Ratio
LEBAC: Central Bank Bills (Argentina)
LETES: U.S. dollar treasury bills
LFPIF: Financing Line for Production and Financial Inclusion
LR: Leverage Ratio
MAE: Electronic Open Market
MERCOSUR: Southern Common Market
Merval: Buenos Aires Stock Market (benchmark stock market index)
MF: Ministry of Finance
MH: Ministry of Finance
MSCI: Morgan Stanley Capital International
MULC: Single and Free Exchange Market
OECD: Organization for Cooperation and Development Ec.
ON: Negotiable Obligations
OPEC: Organization of the Petroleum Exporting Countries
bp: Basic points
p.p.: Percentage points
PEN: National Executive Branch
PGNME: Global Net Foreign Currency Position
GDP: Gross Domestic Product
PN: Net Worth
PPM: Mobile Payment Platform
SMEs: Small and Medium-sized Enterprises
REM: Market Expectations Survey
ROA: Return on Assets
ROE: Return in terms of equity
ROFEX: Rosario Futures Exchange (Rosario Term Market)
RPC: Computable Patrimonial Liability
S&P: Standard and Poor’s (Index of the top U.S. stocks by market capitalization)
s.e.: Series without seasonality
SEFyC: Superintendence of Financial and Exchange Entities
NFPS: National Non-Financial Public Sector
TCR: Real Exchange Rate
TN: National Treasury
APR: Annual Nominal Rate
Trim.: Quarterly / Quarter
ICU: Utilization of Installed Capacity
EU: European Union
US$: US Dollars
UVA: Unit of Purchasing Value
UVI: Housing Unit
UVP: Units Linked to GDP
Var.: Variation
VIX: S&P 500 volatility
WTI: West Texas Intermediate
Share on


