Executive summary
• Financial service access points (PDAs) registered an increase of 4.8% between December 2021 and December 2022 and maintained the percentage of the adult population living in localities with PDAs at 92.5%.
• Bank and/or payment account coverage reached almost the entire adult population (99.3%) at the end of 2022. The number of individuals (PH) who had at least one account stood at 35.1 million compared to 34.6 million in June 2022 (98.5%). With values above 95%, the NOA, Cuyo and Patagonia regions were at account holding levels close to full coverage while the Center and NEA have already reached it.
• Joint bank and payment account tenure reached record levels in several segments of the population. In December 2022, joint tenure marked maximum coverage values in the age range of 25 to 29 years, reaching 76%. However, the holding of both types of accounts is relatively low in the age ranges of 15 to 19 years old and 60 to 64 years old.
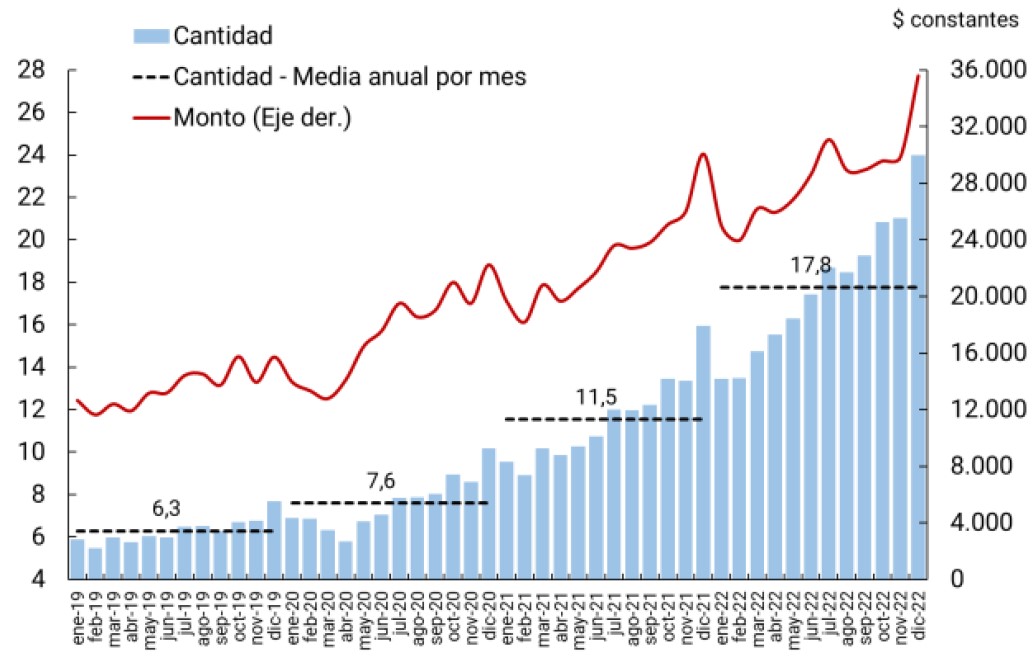
• Electronic means of payment (EMP) continued to set all-time highs. Each individual made an average of 17.8 monthly payments for MPE in 2022, a record value that practically triples the record prior to the COVID-19 pandemic. Those MPEs whose commissions are zero or reduced and the availability of the funds is immediate for the recipient (Transfers and Payments with Transfer) were highlighted.
• The use of mobile banking to carry out transactional operations in financial institutions (EEFF) grew significantly between 2019 and 2021. While around 10% of individuals with a bank account had carried out a transactional operation in the last quarter of 2019, the same indicator rose to 31% in the same period of 2021.
After the COVID-19 pandemic, a change in behavior is observed in the electronic channel chosen for transactions, with mobile banking gaining relevance over home banking.
• The average transaction with MPE fell for the second consecutive year (19% year-on-year in real terms in 2022). This performance, in a context where the real amounts operated by adults grew, indicates the advance of the use of electronic wallets and mobile banking in everyday payments since they involve payments for smaller amounts.
• Increases in returns had a positive impact on savings and investment products. In December 2022, the number of PH fixed terms in local currency was 6.9 fixed terms per 100 bank accounts in pesos, which represented a 53% year-on-year increase in this metric. Compared to 2021, there was a shift towards short- and medium-term products (mutual funds and fixed terms) and a contraction of account balances with immediate liquidity (account balances and money pools).
• As of December 2022, 54.5% of the adult population had financing from the expanded financial system (SFA). Consolidating two years of sustained growth, the number of PHs financed by the SFA had a net increase of 1.6 million during 2022 and reached 19.2 million in December. However, during the same period, the total PH financing balance in the SFA fell 13% in real terms, so the average balance per debtor continues on a downward path.
• The type of income significantly influences the level of the average debt balance of the PHs. As of December 2022, more than half of the PHs that registered credit products had a formal salary for their work in a dependent relationship or a retirement for having reached the corresponding age. PHs that have a salary register an average balance per debtor that doubles that of those debtors who would have an independent job.
• The number of MSMEs with SFA financing reached 1.04 million companies in December 2022, registering an increase of around 216,000 productive units compared to the same month in 2021. The financing balance registered a fall of 14% year-on-year at constant prices, due to the decrease in the average debt balance.
• The average balance of women’s MSMEs (MSMEs-M) is considerably lower than that of men’s MSMEs (MSMEs-H). As of December 2022, the average balance corresponding to PHs classified as MSMEs-M represented 47.6% of the average balance of an MSME-H, showing a gender gap in terms of the amount financed that remained at similar values during the last two years. The difference in average balance to the detriment of MSMEs-M is found in all sizes of companies (to a greater extent for the largest ones) and in all economic sectors.
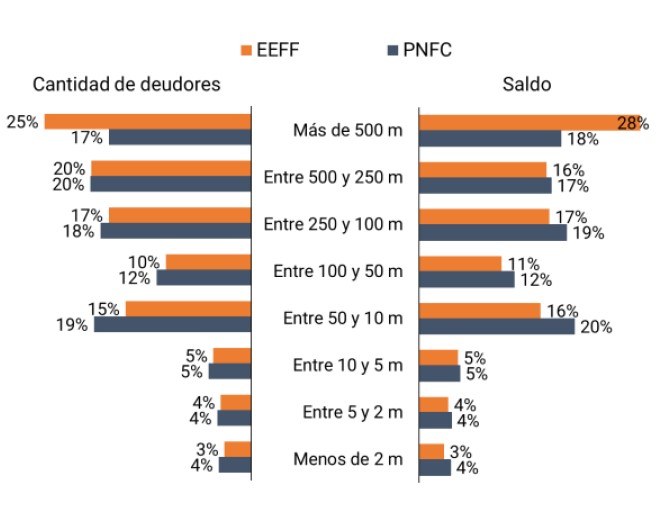
• Between 2019 and 2022, there was a deepening in the financial inclusion of young people (15 to 24 years old). The number of people with bank and/or payment accounts grew 27% between March 2019 and December 2022 (+7.6 million people). The age range of 15 to 24 years old was the one that contributed the most to this growth, accounting for 9.6 p.p. Information from the end of 2022 suggests that the number of young people opening their first account through an EEFF or a PSP is similar. In the case of access to financing, significant changes were observed between EEFF and PNFC. A greater inclusion of young age ranges is highlighted, mainly explained by the PNFCs.
Indicator Table | Financial inclusion in Argentina

Notes
(1) This includes access points for financial institutions (branches, mobile branches, ATMs, self-service terminals and complementary financial services agencies) and ATMs operated by non-financial institutions.
(2) Monthly average for each year.
Local context
In 2022, the financial inclusion process in Argentina was framed in a context of improved economic activity and the employment rate, a widespread use of mobile devices and, within the framework of the monetary policy implemented, a growing trend in reference interest rates.
Economic activity continued to improve during 2022 and reached levels higher than those of 2021. The Monthly Estimator of Economic Activity (EMAE) showed 5.2% annual growth for the year 2022 1 . Private consumption evolved along the same lines 2 , expanding by 9% in 2022 compared to the previous year.
In the labor market, the employment rate for the main urban agglomerations remained at historically high levels, reaching 44.6% in the fourth quarter of 2022. This mark is the highest since 2003, coinciding with the rate recorded in the second quarter of 2022. One of the features of this growth in the employment rate is that it is associated with the growth of the activity and employment rate of women to a greater extent than that of men3 . For its part, the income of salaried people showed a reduction of almost 3% in real terms in the second half of 2022 compared to the same period in 2021. However, differentiated behaviors were observed between those corresponding to registered and unregistered workers. Incomes in real terms contracted more for unregistered workers4.
For their part, the benchmark lending and passive interest rates showed an upward trend between June and September 2022, before stabilizing in the last quarter of the year. In the third quarter of 2022, the Central Bank of the Argentine Republic (BCRA) raised its monetary policy rate with the aim of preserving exchange rate and financial stability by bringing it to positive values in real terms. Between the end of June and September 2022, the monetary policy rate increased by 23 p.p., while the fixed-term rate increased by around 21 p.p. and the rate on signature document loans and personal loans rose by around 18 p.p. in the same period.
On the side of the perceived demand for financing, in the second half of 2022 financial institutions (FFSEs) continued to observe a reduction in the business segment (both small, medium and large)5. Regarding the demand for credit from households, the EEFF pointed to the support of the credit card segment and other consumer loans. Demand for collateral loans was relatively weak. At the same time, the BCRA maintained incentives for access to financing.
Access to digital infrastructure is essential to facilitate financial inclusion. Residential mobile internet accesses expanded by around 9% in the third quarter of 2022, reaching just over 32 million accesses6. In terms of cell phone subscriptions per 100 inhabitants, Argentina (130.5) was above the average for Latin America and the Caribbean (108) and for countries that share the same income category (upper middle, 123)7. The cost of fixed broadband services in Argentina, in terms of monthly gross national income per capita (GNI), was 14% above the average of a selection of Latin American countries and exceeds between 3 and 4 times the cost of developed countries such as Canada and the United States8. On the other hand, the cost of mobile broadband services in relation to the monthly GNI was 13% below the Latin American average and doubles the cost of developed countries such as Canada and the United States. For their part, users in Argentina spent an average of 3.9 hours per day on their cell phones, 8.3% more than the previous year9. In this sense, downloads of mobile banking applications and electronic payment wallets grew by 16% in 2022, reaching 42.8 million downloads10.
State of the situation. In this context, the state of financial inclusion stands out for an almost total coverage of the population in the holding of accounts, mainly bank accounts, and a greater participation of the population in electronic channels to carry out transactions (See Section 1). This increase is reflected in the dynamics of payments and transactions by electronic means, where the decrease in the average amount per transaction (in a context of an increase in the amounts operated per adult) indicates a greater penetration of digital payments in people’s daily lives. Likewise, in the last two years, the expansion of the PNFC as a source of financing for individuals (PH) was highlighted and, although to a lesser extent, contributions from public banks were also observed. Both providers explained the increase in PHs with financing, reaching the highest values in the series at the end of 2022. On the side of financing to MSMEs, the number of companies with financing experienced a significant increase in 2022, although credit balances fell in real terms.
During the second half of 2022, the BCRA and the National Government issued regulations that will contribute positively to financial inclusion. In the field of MSME financing, the extension of the Financing Line for Productive Investment of MSMEs was provided until September 2023. In connection with the initiatives to improve financing for MSMEs and with the aim of generating information on the use of digital products, the BCRA determined: (1) that unpaid MSME Electronic Credit Invoices (FCEM) be reflected in the Central Center for Electronic MSME Invoices Unpaid at Maturity (CenFIV), which seeks to provide information by generating a credit history in the use of this product11; and (2) the creation of the “Registry of platforms for MSME financing” in which all legal entities that offer tools, computer systems and platforms for carrying out operations with MSME electronic credit invoices must be registered12.
In terms of financing for households, the National Government included within the Ahora 12 Program, the purchase of nationally produced cell phones with financing of 10 installments and an APR of 48%. This measure has a positive impact on the use of digital financial services.
In order to protect depositors, the BCRA updated the upper limit of the coverage of the Deposit Guarantee Insurance System to $6 million per person, account and deposit in each EF. Fixed terms and balances in savings banks, among others, are covered by this coverage. In relation to savings, the Electronic Certificate for Time Deposits and Investments (CEDIP) was also created in order to expand the functionalities of time deposits and investments13. This new instrument will improve the liquidity of fixed terms since their ownership can be transferred by electronic means to cancel obligations, be traded on securities markets and be divided into amounts lower than the original amount. In this way, the average maturities of these placements could be extended, resulting in a greater availability of funds for longer-term loans by the EFSEs.
Finally, technological advances, the diversity of participants in the financial system and their interconnections, and the expansion of digital financial services, led the BCRA to update the standards on technology and information security risks with the aim of strengthening cybersecurity, fraud prevention and cyber resilience14, which are considered fundamental elements when it comes to adequately providing financial services to usersQuestion 15.
1. Financial infrastructure
The post-COVID-19 pandemic stage poses new challenges for the infrastructure for access to financial services. On the one hand, the growing adoption of digital channels transforms digital infrastructure into an indispensable element for access to financial services. In this context, the physical infrastructure works in a complementary way with digital channels to continue offering services in person, either due to the nature of the service or the population that demands it.
In relation to the adult population, the physical infrastructure at the global level registers a decrease in traditional financial service access points (PDAs). Branches experience notable declines in high- and upper-middle-income countries, while ATMs show the greatest reduction in high-income countries. In both cases, the reduction in costs by financial institutions (EFSE) and the greater progress of the digitalization of financial services, particularly in the area of payments, are some of the explanatory factors of this new scenario16 .
Graph 1 | Evolution of branches and ATMs
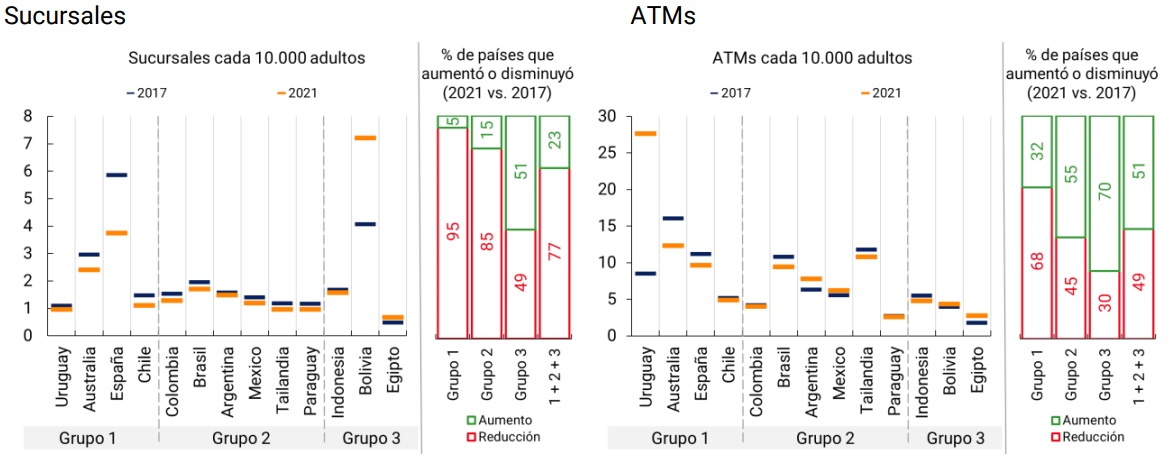
Note | Countries are grouped by their income level according to the World Bank’s classification. Argentina is among the group of upper-middle-income countries. Group 1: high-income countries; Group 2: medium-high and group 3: medium-low. “Increase” means that the metric per 10,000 adults increased between 2017 and 2021 and vice versa for reduction. For those countries that did not have records for the year 2021, the data corresponding to the year 2020 was taken.
Source | FAS, INDEC and BCRA.
Compared to the global trend and to upper-middle-income countries, branches in Argentina showed a very slight reduction and ATMs a significant increase (23% between December 2017 and 2021). In recent years, various regulations aimed to extend and modernize the ATM fleet17 and evaluate the impact on the coverage of branch closures prior to their implementation18.
On the other hand, cell phone ownership and internet use in Argentina are at levels very close to the average of high-income countries19, while mobile coverage20 almost reaches the entire population21. These values indicate that access to and use of information and communication technologies are widespread in our country, complying with one of the necessary conditions for access to and use of digital financial services. However, there are other factors, such as the quality of connection and the technological capabilities of the population, that must be considered to take advantage of and expand the potential of digital channels.
Graph 2 | Access to and use of information and communication technologies
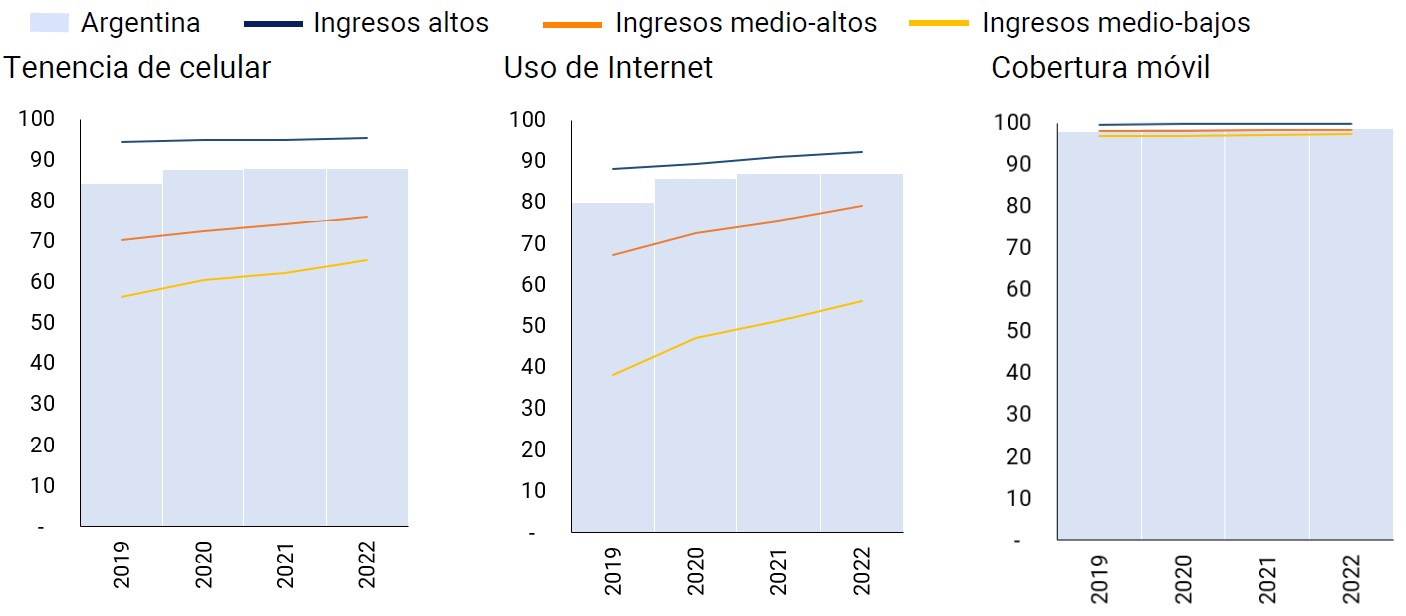
Note | In all graphs, the 2022 data for Argentina repeat the values of 2021. The cell phone ownership graph shows the use of cell phones in our country (because there is no possession data). Mobile coverage: percentage of inhabitants within range of a mobile phone signal, regardless of whether they are users or not.
Source | INDEC and ITU.
Physical infrastructure. Physical access points to financial services (PDAs) registered an increase of 4.8% compared to December 2021 and maintained at 92.5% the percentage of the adult population living in localities with PDAs. Likewise, the level of PDA per 10,000 adults is similar to values in high-income countries such as Japan and Spain, although in these countries ATMs predominate and the contribution of complementary financial services agencies (ACSFs) is marginal, while in Argentina the latter have greater relative weight, as in other Latin American countries.
However, the pace of growth of ADPs slowed compared to the previous two years (13% for 2021 and 45% for 2020) due to a decline in the growth of ACSFs and ATMs. This behavior could be explained by:
-
-
- (i) ACSF: these points rest mainly on existing extra-bank collection networks, where most of the service points are already enabled as ACSF. In 2022, the ACSF had a positive result with a 13% increase, although they registered a drop of 5.9% between June and December 202222.
(ii) ATMs: in general, the new equipment replaced existing units, generating a replacement of the device fleet, instead of an expansion. This replacement may have been prompted by the obligation for ATMs to offer biometric readers for user identification
-
- . ATMs slowed their growth from 4% in 2021 to 1% in 2022 in a context of greater use of electronic means of payment (EPM) and the expansion of alternative mechanisms for cash withdrawals.
Graph 3 | Financial Services Access Points
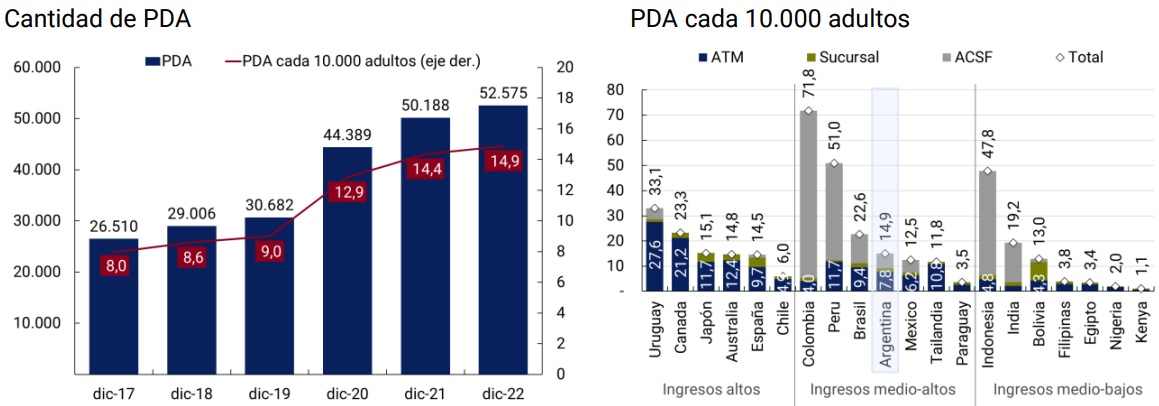
Note | Graph on the right: data to 2021 except Argentina to 2022.
Source | BCRA, FAS, networks and INDEC.
Likewise, the growth of payment accounts generated the need for an infrastructure that allows the holders of these accounts to make cash withdrawals and deposits. To do this, businesses that can be registered as ACSF and bank and non-bank ATMs are used. In this way, the physical infrastructure of financial services incorporates new use cases as interoperability between the different types of accounts and the application of technology is enhanced.
Finally, branches ended the year with a decrease of 1.5% compared to December 2021, cushioning the global trend 24. These closures occurred in localities where there was at least one other branch and other PDAs, so their inhabitants still have human service points and electronic devices to access financial services.
Availability of infrastructure by locality. The physical infrastructure of the financial system provides services for the different types of accounts: EEFF account holders can use all types of PDAs, while people with payment accounts mainly use ATMs, both bank and non-bank, as a cash withdrawal point 25. In this way, part of the physical infrastructure is shared by payment service provider (PSP) and EEFF customers, while another part is for the exclusive use of bank account holders. On the other hand, telecommunications infrastructure allows the use of digital financial services for both sets of users. In this context, the question arises as to whether the presence of infrastructure favors the possession and use of bank and payment accounts.
From the combination of availability of physical and telecommunications infrastructure, four subgroups of localities are obtained that present different configurations in terms of the possession of bank and payment accounts of their population. For the availability of physical infrastructure, those localities that have at least one branch and another type of PDA are counted, which implies that the locality has a full offer of face-to-face financial services26. In terms of availability of digital infrastructure, the localities that report both fixed and mobile Internet connectivity are counted, which allows the use of electronic channels from the computer and cell phone.
Localities with a full offer of face-to-face financial services and internet connectivity concentrate 87% of the country’s adults and show very high levels of bank and payment account ownership. The population that lives in these localities presents very favorable initial conditions for access to financial services both in terms of account ownership and infrastructure. Likewise, these conditions favor the acceptance of electronic means of payment by local businesses and the exchange of funds between its inhabitants (positive synergies). Also, it is expected that the possession of payment accounts will grow in these localities attentive to the availability of internet connection.
On the other side of the spectrum, localities without full offer of face-to-face financial services and that did not report the two types of connectivity group a significant number of localities, although with smaller populations that together account for 2% of the total adult population. This infrastructure configuration presents more localities with a smaller proportion of their population with bank accounts and payment accounts.
Another aspect shown in the graph is the association between the existence of PDA coverage in the localities, regardless of whether or not they have internet connectivity, and the percentage of the adult population with a bank account. While the point cloud tends to be distributed with variability within the entire range of bank accounts (0% to 100%) when localities do not have PDA, this same ratio becomes concentrated in higher percentages above 80%) when localities have PDA. With regard to connectivity, it is observed that localities with a fixed and mobile Internet connection tend to register a higher percentage of the population with a payment account.
Figure 4 | PDA & Internet Coverage & Account Holding
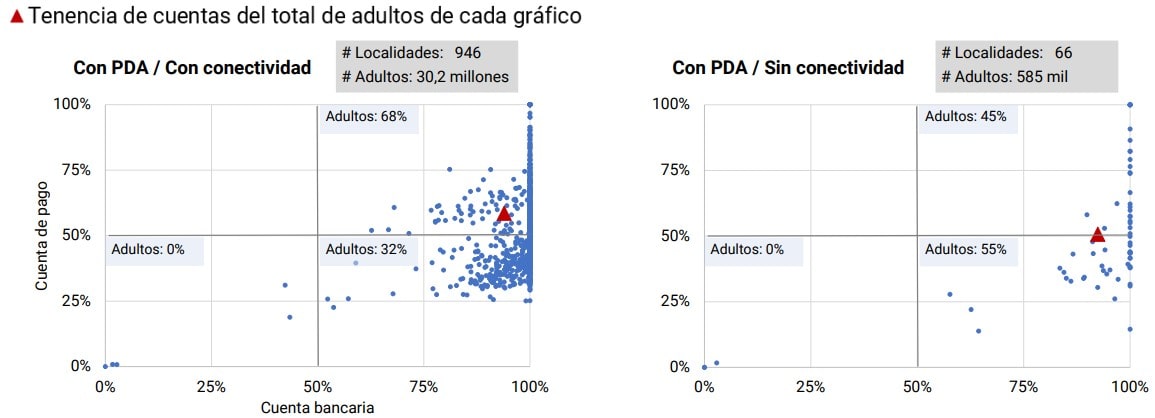
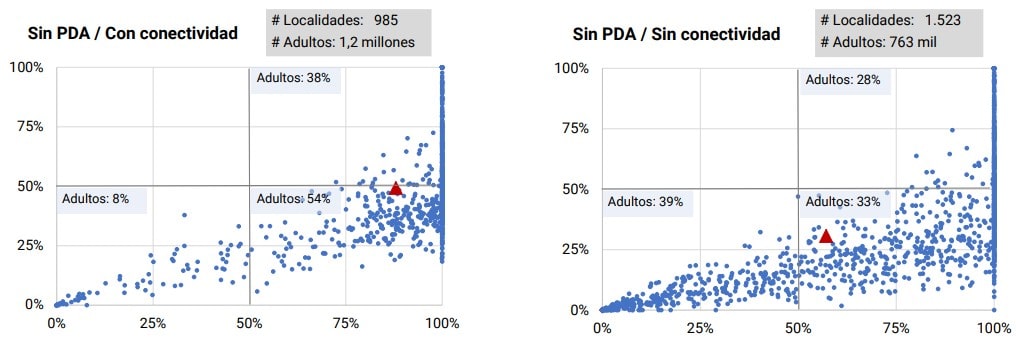
Note | PDA data as of Dec-22, accounts as of Sep-22 and connectivity as of Aug-22. With PDAs: at least one branch and another type of PDA. With connectivity: fixed and mobile connectivity. Bank account: percentage of the adult population with at least one bank account. Payment account: Percentage of the adult population with at least one payment account. The light blue boxes indicate the percentage of adults living in the localities of each quadrant (out of the total localities of the combination).
Source | BCRA, networks, ENACOM and INDEC.
Although there are several factors that can impact the holding of bank and payment accounts (such as the level of education and income, age, associated costs, among others), the availability of infrastructure is presented as a necessary condition for access to and use of financial services. Those localities that offer a more favorable physical and telecommunications infrastructure register greater account ownership.
2. Account Holding
Account holding levels are approaching the total coverage of the adult population. The number of human persons (PH) who had at least one account stood at 35.1 million as of December 2022, which represented 99.3% of the adult population. With values above 95%, the NOA, Cuyo and Patagonia regions were at account holding levels close to full coverage while the Center and NEA have already reached it. This shows that widespread access to accounts is a federal phenomenon.
Table 1 | Bank and payment account holding metrics
Data as of December 2022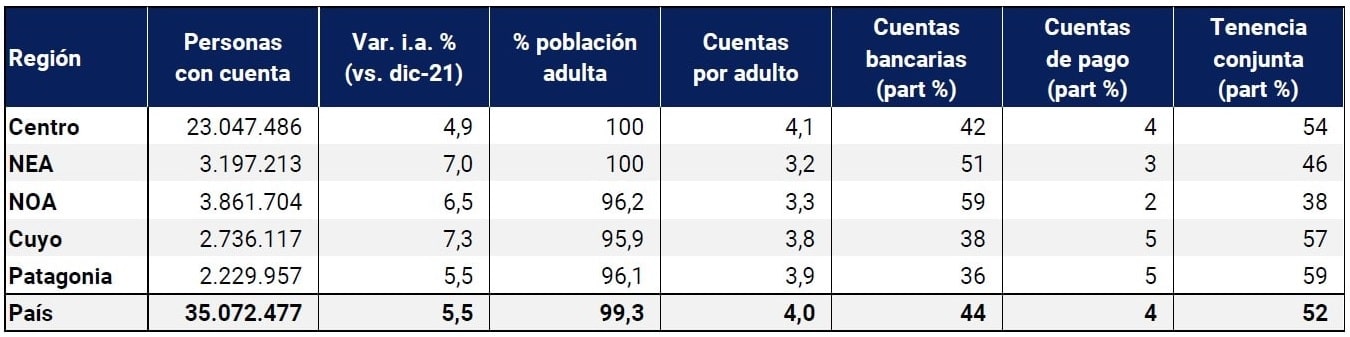
Note | Bank accounts: people who only have this type of account and do not have payment accounts; Payment accounts: people who only have payment accounts; Joint tenancy: people who have bank and payment accounts; Accounts per adult: considers accounts in Argentine pesos and foreign currency; % adult population: takes as a denominator the projections of the adult population made from the results of the 2010 National Census. Estimated growth rates may differ from actual rates and thus overestimate account holding levels.
Source | BCRA based on COELSA and INDEC.
In terms of the number of accounts per adult, a metric commonly used internationally to compare account ownership between countries, Argentina has recorded continuous growth over the past 15 years, exceeding the average levels of high-income countries in recent years27. A particular characteristic of the Argentine economy is the existence of bi-monetary savings banks (i.e., in pesos and in foreign currency), thus providing accounts in foreign currency with an additional margin (about 0.6 accounts per adult) in the explanation of the value achieved.
Since the beginning of the COVID-19 pandemic, bank accounts have grown significantly, although starting from a high level of coverage (2.4 accounts per adult28), while payment accounts, being a more innovative product at that time, experienced a significant adherence in the adult population. This is reflected in the fact that more than half of the adult population simultaneously owns payment accounts and bank accounts.
The motivation to add a payment account (to the possession of bank accounts) usually lies in the use of specific services of this type of product such as e-commerce, the use of electronic means of payment offered by these accounts in stores and a simpler user experience for both opening and operating. Likewise, the distinctive feature of payment accounts is that they are opened and operated 100% digitally, from a computer or mobile device29. This requires internet connectivity and certain technological capabilities of users, as it does not have its own physical service points.
Graph 5 | International comparison of the number of bank accounts per adult
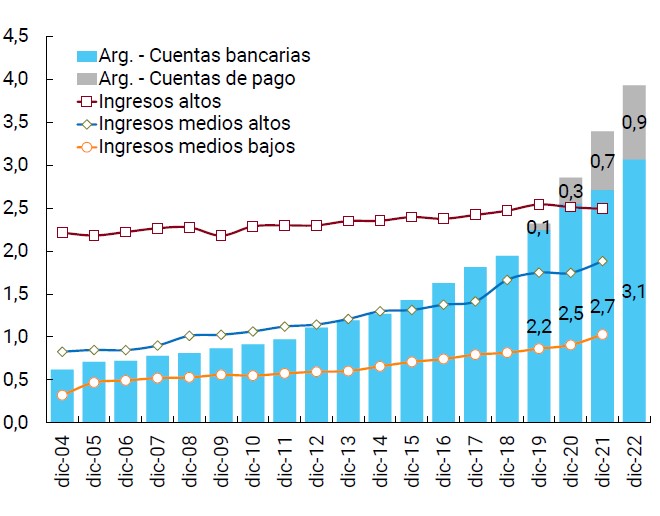
Note | Argentina: between 2019 and 2022, data from COELSA were used, while from 2004 to 2018, data from FAS (IMF) were used. Accounts in Argentine pesos and foreign currency are included. Other countries: Only bank accounts are considered.
Source | World Bank, BCRA and FAS (IMF).
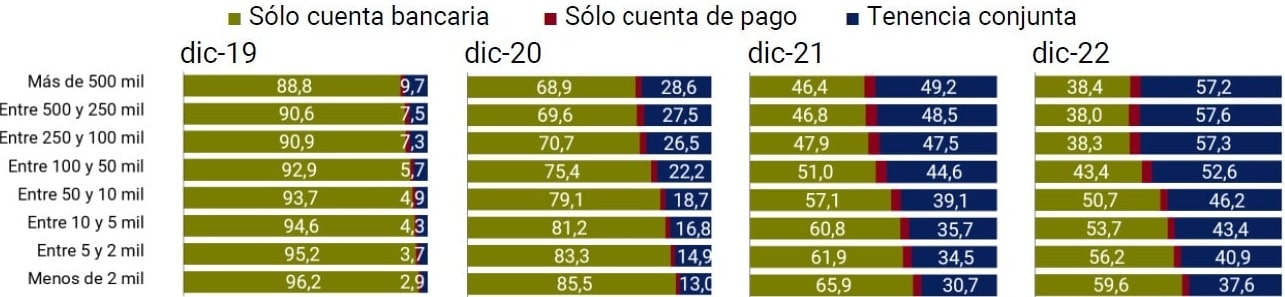
Characteristics of bank and payment account holders. Prior to the COVID19 pandemic, joint account holding comprised 8.5% of the adult population. Then, given the need to carry out transactions remotely, PHs with both accounts experienced significant growth and, currently, are at values greater than or close to 50% of the adult population, both nationally and regionally. Given the relevance of this phenomenon, it is interesting to know some attributes of the people who make it up.
Age profile. The proportion of young people aged 20-29 and middle-aged 30-54) with joint tenure exceeds the proportion of people with only bank accounts. Conversely, in the very young (15-19 years) and older age (55 years or older) age ranges, the proportion of people who own both types of accounts is lower. While the holding of both types of accounts decreases as age increases, the levels of tenure are now high. Older people probably prefer to carry out financial transactions in environments where they feel comfortable and that eventually have the possibility of carrying out operations in person, an aspect that only bank accounts provide.
The latter is similar to the use of cell phones, computers and the internet, which is at high levels in all age ranges, but decreases as age increases. It is estimated that more than 90% of young and middle-aged people use the internet and mobile phones, while among people over 64 years of age only 59% use the internet and 74% use cell phones30. Thus, the gap of elderly people who use their cell phones without connecting to the internet amounts to at least 15 p.p31. In this way, the technological factor plays a fundamental role in explaining the differences in account ownership between age groups since, in order to open a payment account and carry out operations, cell phones with an internet connection are required.
Table 2 | Persons with joint account holdings in relation to the adult population
Expressed as % of the population of each age range
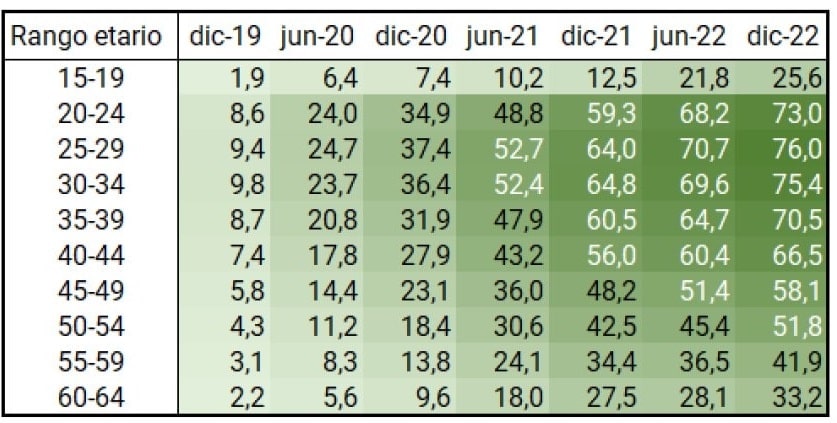
Note | The shades of green in the cells are determined by the minimum and maximum value in the table. The age range is expressed in years.
Source | BCRA, COELSA and INDEC.
When grouping the ages by five-year groups, three effects can be seen with respect to joint account keeping: (i) throughout the period of analysis, significant increases were recorded in all five-year groups. The changes experienced in the COVID-19 pandemic regarding interaction with financial services modified the habits of use of financial services of all population groups; (ii) people who are between 25 and 34 years of age have a clear preference for simultaneous possession of bank and payment accounts, as this would allow them to use the financial services of both accounts that are interoperable. Then, as age advances, the preference for joint account ownership is diluted and, from the age of 55, people prefer exclusive bank account ownership, although it is not as clear as it was years ago and iii) the evolution of the different age groups between December 2019 and the same month in 2022 was not uniform. The groups under 30 years of age grew in a similar way in 2020 and 2021; while the higher age groups tended to grow less during the first year of the pandemic and more in the following year32. Thus, the youngest were the ones who in relative terms adopted digital financial services the fastest.
Geographical profile. The growth of joint account tenure is a cross-cutting phenomenon for all localities, regardless of their population density. Although it became especially relevant in urban centers (greater than 50 thousand adult inhabitants), where the population with both accounts represented more than 50% of the PHs with accounts, localities with lower population density experienced significant increases, reaching participation levels between 30% and 40%. Thus, the percentage differences between urban centers and less populated localities narrowed over time.
Between December 2019 and 2022, the proportion of people with both accounts in localities with less than 10 thousand adults went from values close to 3.5% to values around 40%. Although the improvement in telecommunications infrastructure could have influenced this increase, this factor does not explain the differences between the localities with the highest and lowest population density, given that the availability of internet access in localities with less than 10 thousand adults is high33.
Likewise, as mentioned in the Financial Infrastructure section, cell phone ownership, internet use and mobile coverage in Argentina are at very high levels, close to the total coverage of the population. In this sense, access to technology would be covered in both localities with low population density and those with high population density.
Graph 6 | Distribution of people with accounts according to the size of the locality
Data expressed in %
Source | BCRA, COELSA and INDEC.
However, other factors associated with the locality, such as the quality of internet connection and the level of financial development, could influence the decision to open a payment account by its inhabitants. In the first case, localities with lower population density register average download speeds for fixed internet much lower than the most populated localities34. On the other hand, when analyzing the situation of the less populated localities in terms of their financial development, it is observed that as population density falls, the localities register weaker development indicators35. This could be linked to lower average incomes that make it difficult to pay for telecommunications services in line with digital financial services. Both aspects of localities discourage the use of digital financial services (and, therefore, the opening of a payment account), with people having as an alternative the use of financial services banking points such as branches or ATMs.
3. Electronic means of payment and savings and investment modalities
3.1. Electronic means of payment
The use of electronic means of payment (EMP) contributes to improving financial inclusion. MEPs make it possible to channel the different payment needs of the population and, indirectly, can make access to new financial services, such as savings or financing products, affordable for their users36. The BCRA, considering these aspects, has promoted through its regulation the creation of new means of payment, the adoption of technology, the reduction of commissions and the crediting times of funds for businesses.
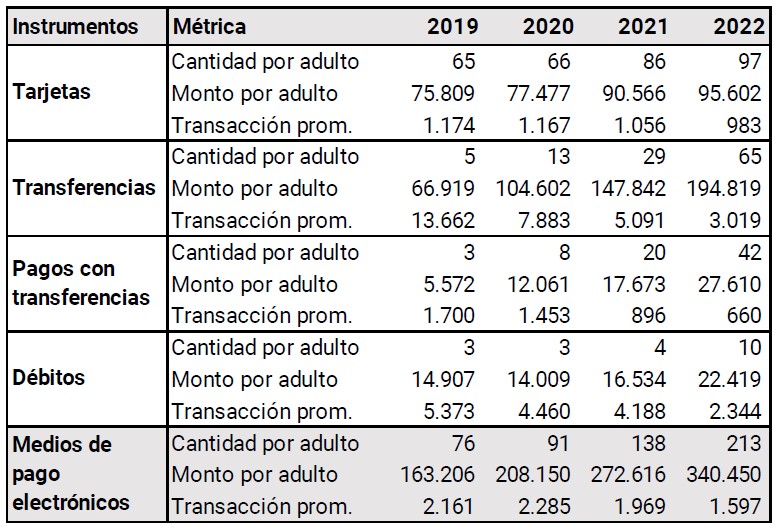
Volumes and amounts transacted. In this context, the amounts of operations carried out through MPE increased their participation in the Gross Domestic Product (GDP), from 54% in 2021 to 66% in 202237. Individuals (PH) continued to increase the use of MPE38 in the second half of 2022, particularly those whose commissions are zero or reduced and the availability of funds is immediate for the recipient (Transfers and Payments with Transfer -PCT-).
Figure 7 | Transactions with electronic
 Year-on-year rates of change (YoY)
Note | “Avg. Transaction” corresponds to the quotient between the amount and the number of transactions. The “Payments with Transfers” category includes transactions initiated with cards. Amounts at constant prices of January 2019 (CPI January 2019 = 100).
Source | BCRA, INDEC and networks.
In 2022, the number of transactions per adult grew by 54% while the amount transacted per adult increased by 25% in real terms. Each individual made an average of 17.8 monthly payments for PEMs, which is a new record value and almost triple the pre-COVID-19 pandemic record39. The downward trend in the average transaction, which fell by 19% in 2022, shows, in a context where the amounts operated per adult grew, the advance of digitalization in the daily payments of PHs since they usually involve relatively smaller amounts to face their daily transactions. This dynamism is also reflected in the growing relationship between PEMs and cash withdrawals. In 2022, $5.1 was recorded through MPE for every $1 of cash withdrawal, compared to a ratio of $3.5 to $1 in the previous year40.
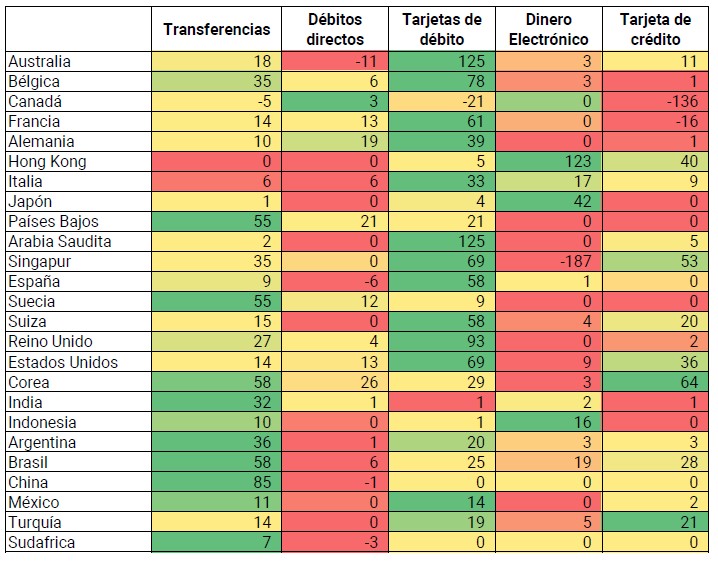
International comparison. At the international level, the global trend towards the digitization of payments, accelerated by the COVID-19 pandemic, is independent of the income level of countries, as both high- and middle-income economies increase their operations year after year in terms of population.
Figure 8 | International comparison of retail electronic payments
Var. of operations per inhabitant. (17 vs. 21)
Annual Payments and Account Holding (2021)
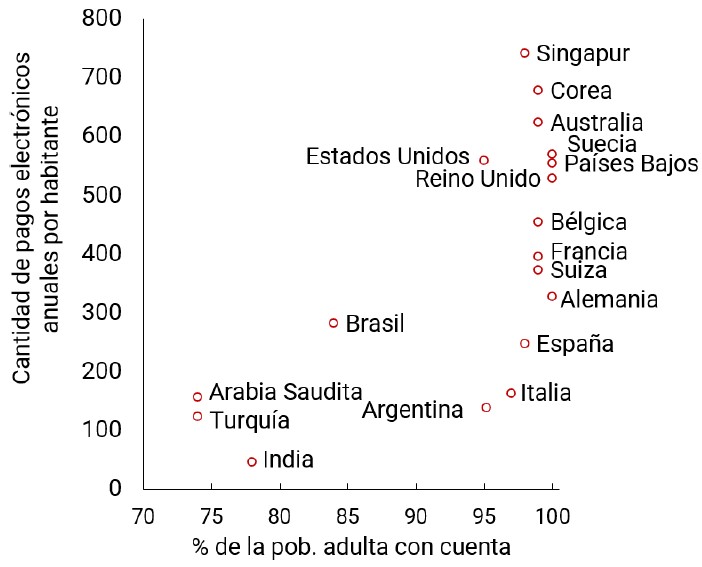
Note | The data for Argentina are sourced by the BCRA and correspond to the metric per adult. Data for the remaining countries are from BIS and Global Findex (graph left and right, respectively). Of the series published in BIS, the following are considered to make up the set of retail payments: transfers, direct debits, debit and credit cards, and electronic money payments (e-money payments). Table on the left: Colors are generated by each row based on the minimum and maximum value.
Source | BCRA, BIS (Committee on Payments and Market Infrastructures) and World Bank (Global Findex 2021).
Argentina, in terms of population coverage of accounts (bank and/or payment), registered a level of annual PEM operations per adult below that of countries with similar coverage. This fact indicates that MEPs have room to continue growing at the local level, although significant variability is observed between countries with a high percentage of their population with accounts. On the other hand, there is also an outstanding performance in the growth of the use of PEMs in Argentina between 2017 and 2021 from an international comparison41.
High-income countries (including Australia and Korea, in the table in Figure 8) tended to expand their use of debit cards between 2017 and 2021, while upper-middle-income and low-income countries expanded through the use of transfers. In the case of the former, the growth in their use would be associated with contactless payments, while the development of instant or fast payments contributed to the increase in transfers42. Contactless card payments do not require cardholders to sign a receipt or enter a personal identification code at point-of-sale (POS) terminals, as long as the transaction does not exceed a certain value. In this way, it tends to simplify the operation and speed up its use. Instant payment systems can be used at any time of the day, the funds are immediately available to the beneficiary43 and have lower costs than other means of payment.
Physical payment infrastructure. The expansion of the POS44 and mPOS (mobile POS) terminal park continued during 2022. mPOS devices reached around 4.4 million devices, an all-time high in the series, with a year-on-year growth of 17%. For their part, POS terminals registered a monthly average of around 840,000 units during 2022, 5,000 more than last year. Although the total number of POS remains without significant changes since 2019, the active terminals indicator exhibited improvements, reaching an average of 60% in 2022, compared to values of 57%, 53%45 and 58% in 2019, 2020 and 2021, respectively. The significant expansion of mPOS units could be explained by their low acquisition and maintenance costs as well as their ease of transport and use.
Card purchases show improvements in the intensity of use of POS terminals (both in amount and quantities per device). On the other hand, in mPOS operations, there is a small increase on the side of the number of operations per device and a reduction in the average amount46. A structural aspect to highlight in the historical series of payments made by both terminals is that the average purchase in an mPOS terminal is systematically lower than the average value of a transaction per POS47.
The devices in terms of the population, the number and the amount of operations channeled in each of them, allow us to infer the profile of the businesses or entrepreneurs that use each tool. mPOS, which have a greater relative reach, would be used by small merchants, arguably, less frequently than the use of a POS terminal. These merchants, given their smaller structure, could charge a substantial part of their sales in cash and channel some operations through these cheaper devices, which would explain the low rate of transactions per unit. Regardless, mPOS would meet the demand for electronic payments from users who previously might have operated entirely in cash at those merchants. On the other hand, the X-ray of operations in POS assumes that they would be larger businesses, which would channel a significant part of their sales through these devices.
Table 3 | Stock, quantity and amount of operations in POS and mPOS devices
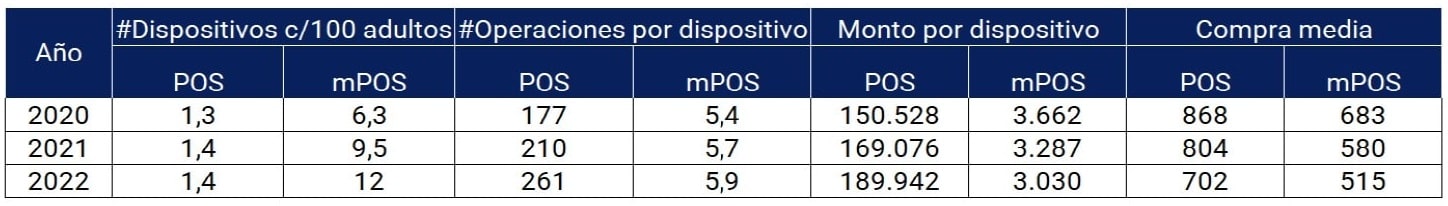
Note | Device operations: Monthly averages of operations per device for each year. Debit card payments at POS and payments with all cards at mPOS. Amount by device: Monthly averages of the amount in real terms per device for each year.
Source | BCRA and INDEC.
Wire transfers. In 2022, each adult made an average of 5.4 transfers per month, more than double those made in 202148. The contribution of transfers initiated on mobile devices (originating from a payment account and those made via mobile banking) to the year-on-year variation in total transfers was very significant49. Thus, 2 out of 3 total transfers per adult would have originated on mobile devices. This is reflected in the drop in transfers through ATMs in the last two years, a fact that suggests a replacement of this channel by the remaining50.
In all transfers between financial institutions (EEFF) (CBU to CBU), mobile banking continued for the sixth consecutive year to register the highest year-on-year rates (3 digits in the last 3 years51). There is an upward trend in the amounts channeled through mobile devices, although only 39% of the total transfer amounts per adult were processed through these means in the period. This phenomenon would reflect the growing habit of people to carry out more and more daily operations through a cell phone for relatively low amounts. This goes hand in hand with the more intensive use of cell phones (88.1%) by the population52 and the increase in mobile banking to carry out transactional operations (See Section 1).
Figure 9 | Transfers per adult
Total Quantities
CBU to CBU Transfers by Channel
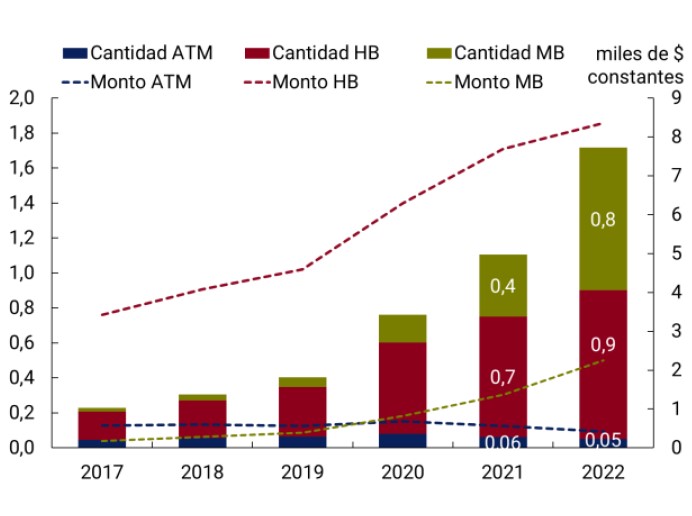
Note | Monthly averages for each year.
Source | BCRA and INDEC.
Transfers from CBU to CBU via home banking continued with the highest concentration of amounts. In this way, when it comes to trading larger sums, individuals continue to prefer home banking. Unlike cell phones, personal computers are used by 42.3%53 of the population. On the flip side, the reduced use of computers by individuals could pose a challenge in the face of the need to transfer larger sums.
On the other hand, the importance of having interoperable systems was reflected once again in the evolution of transfers between bank accounts and payment accounts. During 2022, the amounts per adult of “cross-transfers” practically tripled, a situation that was also verified in the amounts per adult, although in a more attenuated way.
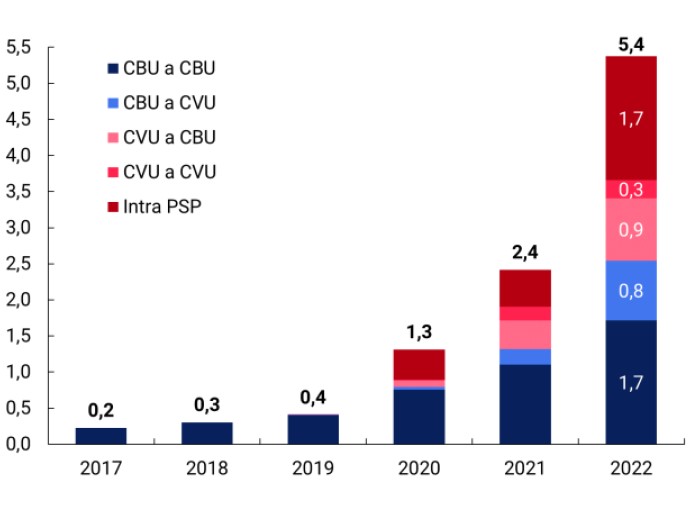
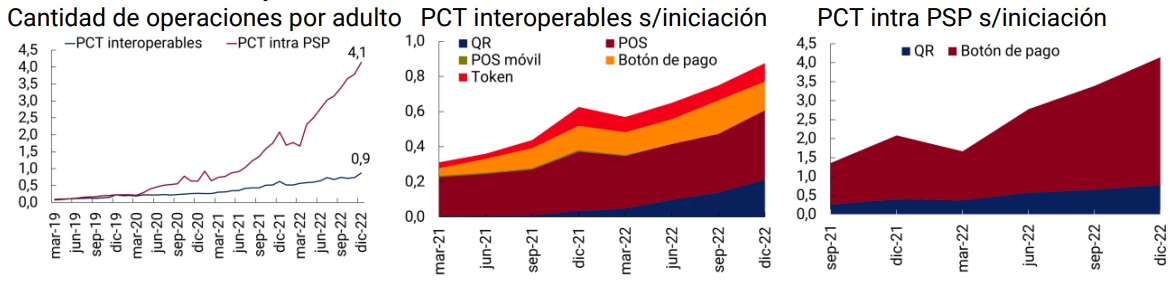
Payments with transfers (PCT)54. In 2022, each adult made an average of 3.5 monthly payments through PCT, registering an increase of 123% compared to the previous year, representing 2 out of 10 payments by electronic means per month. The amounts per adult grew by 63% at constant prices, while the greater intensity of use implied a reduction in the amount of the average operation at constant values (-27%). The evolution of these indicators suggests that the impetus for the increased use of PCT is explained by intra-PSP operations. These transactions are carried out between customers of the same payment service provider (PSP) with funds available in the payment accounts, initiated through the reading of a QR code or a payment button.
Table 4 | Transfer payments
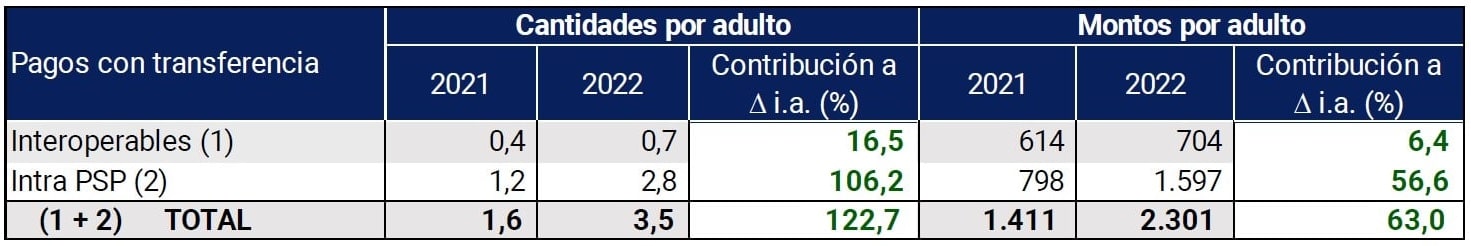
Note | The contribution of Interoperable PCTs to the a.i. variation is defined as the change between 2021 and 2022 of Interoperable PCTs, divided by the total value of PCTs in 2021. In the same sense, the contribution to variation is defined. i.a. of the PCT Intra PSP.
Source | BCRA.
The “interoperable PCTs”55 had a year-on-year growth of 64% in quantities per adult, mainly driven by operations initiated through the reading of QR codes, which accounted for 24 p.p. of the aforementioned variation. Transactions initiated via this technology registered a remarkable dynamic, multiplying by 10 and representing 16% of the total of “interoperable PCTs”. The amounts per adult via “interoperable PCTs” had a modest variation (+15%) and a drop in the average value of each transaction, thus showing their most widespread use for everyday transactions.
Intra-PSP PCTs continued to grow at high rates (a.i. rate 143%), although there is a slight slowdown. In this case, payments initiated through a payment button, associated with non-face-to-face e-commerce, accounted for 80% of the total. The amounts of PCTs within PSPs also registered a significant increase.
Figure 10 | Interoperable PCTs and intra PSPs
Note | “S/”: According to. Source | BCRA and INDEC.
Debit card. In 2022, debit card payments continued their uninterrupted growth in terms of amounts per adult (+21%). Of the total monthly electronic payments, on average each individual made 1 out of 4 debit card transactions. The variations in the amounts per adult were more modest (+8%) with the consequent further fall in the average value of each operation (-10%). This reduction is registered in most MPEs and, as noted in the last IIF, this would show a greater penetration of the debit card in the daily payments of the population. In this sense, the participation of debit cards in supermarket sales increased 2 p.p. in 2022 compared to 2021. While in sales in wholesale self-service stores it grew by 1 p.p. in the average of the year 202256.
The growth in debit card payments was driven by transactions made through POS. The year 2022 closed with an increase in these payments (27.5%) higher than those channeled through the rest of the channels (mPOS, QR codes and remotes; 3%). In the case of amounts per adult, this behavior was even more pronounced given that there was a reduction in the amount per adult via mPOS, QR codes, and remote operations.
Figure 11 | Number of debit card transactions per adult
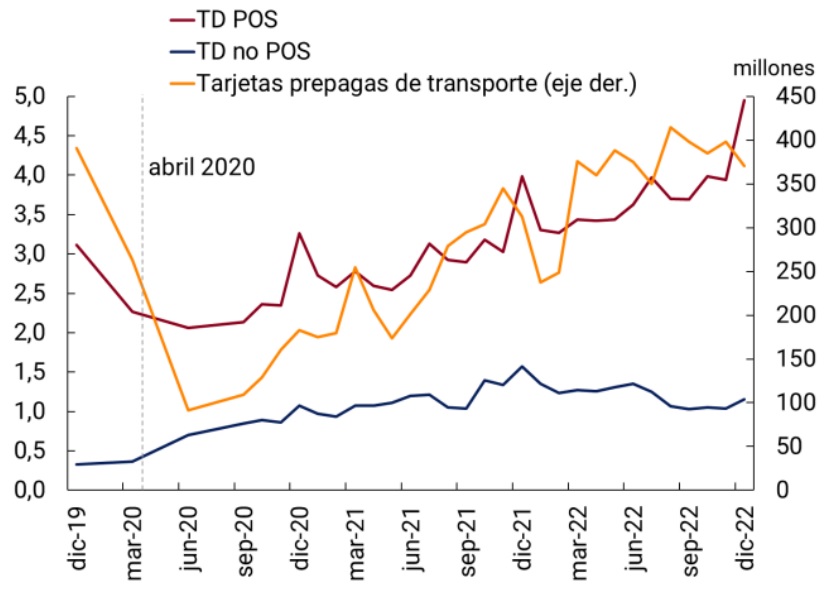
Note | TD: debit card. POS: Point of sale terminals. Non-POS: includes debit card transactions channeled by mPOS devices (mobile POS), QR code reading and remotely.
Source | BCRA and INDEC.
This breakdown, after two years of lower relative growth in payments made through POS compared to the remaining modalities, could be associated with the normalization of face-to-face activities. In particular, in general terms, there is a positive relationship between the evolution of operations with prepaid transport cards (proxy for the level of face-to-face activity) and payments with debit cards via POS devices. Thus, 76% of debit card payments were made in these units in 2022, 4 p.p. more than a year earlier. This behavior was not associated with a significant increase in the stock of POS devices since the variation in the average of the units that registered at least one operation in the month was equal to 4% during 2022 (see Physical payment infrastructure).
3.2. Savings and investment modalities
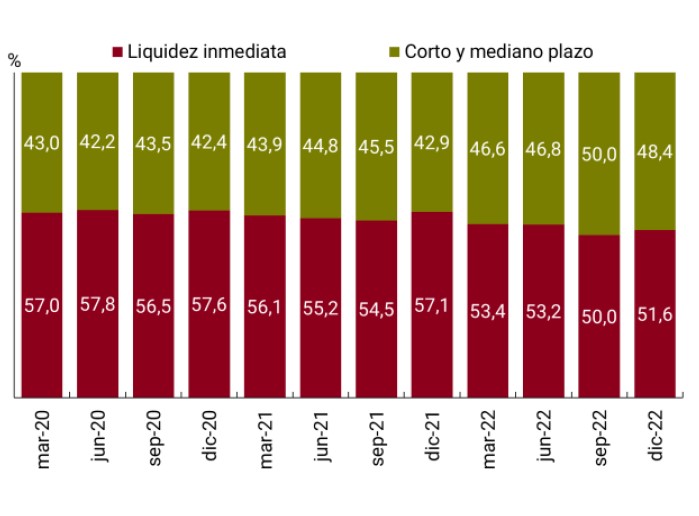
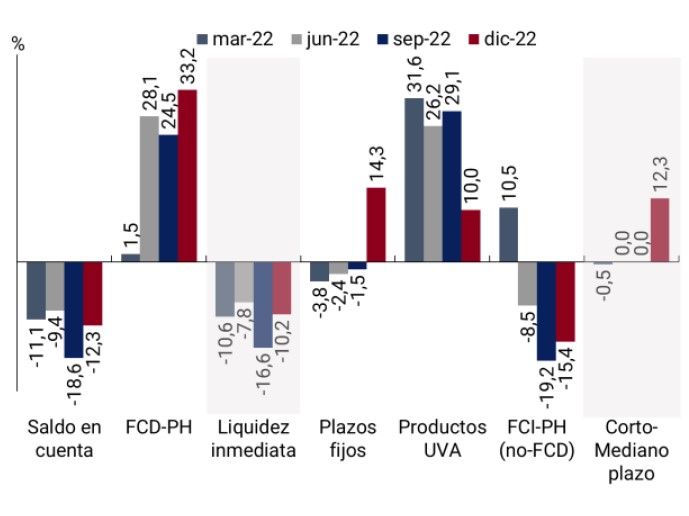
Individuals (PH) have the possibility of allocating their money among various savings and investment products, depending on their liquidity objectives, term and risk-return ratio57. As of December 2022, considering the products offered by financial institutions (EEFF) and Payment Service Providers (PSPs), the savings and investment balance of PHs represented 8.7% of the Gross Domestic Product (GDP) in 2022. Over the last three years, immediate liquidity products (account balances and in Mutual Funds (DCFs)) maintained a relevant (but decreasing) share of total savings and investment balances. For its part, in December 2022, short- and medium-term products registered a 48.4% share of total savings and investment balances. This share is the second highest value since the beginning of the COVID-19 pandemic, which could be related to the will to maintain the purchasing power of the capital saved and invested.
In the last year (Dec-21 vs. Dec-22), a 0.6% reduction was observed in the real savings and investment balances of PHs, partly explained by a 10.2% drop in immediate liquidity balances. This drop was partially offset by a 12.3% year-on-year increase in short- and medium-term products. The variations recorded in each instrument operated in different directions. Balances in traditional fixed terms and in Purchasing Value Units (UVA) increased by 14.3% and 10% respectively, while balances in Mutual Funds (non-CDF FCIs) registered falls of 15.4%.
Figure 12 | PH savings and investment product balances
Participation
Year-on-year rates of change
Note | The balances of the savings and investment products of the PHs in local currency and foreign currency are considered. Balances at constant prices in January 2019 (CPI January 2019 = 100).
Source | BCRA and CAFCI.
In terms of financial inclusion, it is relevant to investigate whether the increase in real balances in UVA, CDF, and traditional fixed-term products was accompanied by an increase in PHs’ use of savings and investment products. For this analysis, based on the statistical information available, traditional fixed terms and UVA without pre-cancellation option (hereinafter, “fixed terms”), and DCFs subscribed through payment accounts, are considered as a single set.
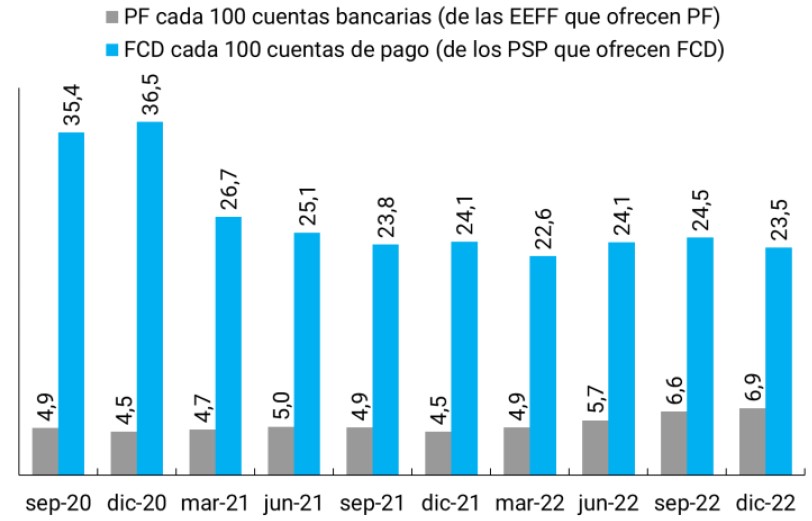
In December 2022, the number of PH fixed terms in force stood at 6.9 units per 100 bank accounts58, reaching the highest point in the last 4 years. During 2022, the metric in question grew 53% due to a significant increase in the number of fixed terms close to 70%. The increase in the real monthly interest rate on fixed-term deposits towards positive values during the last four months of 2022 could be associated with the increase in their amount. As can be seen in Graph 13, the evolution of the metric shows a greater use of this savings product in terms of bank accounts, which could indicate a greater participation of PH in this product.
For its part, PH accounts in PSP with balances in FCD went from 3.7 million in December 2021 to 5.6 million in December 2022 (+36%). This growing adherence is reflected in the fact that 23.5% of payment accounts registered balances in DCF in December 2022. It should be noted that as of December 2022, the number of PHs with payment accounts reached a figure of 19 million PH, registering a net increase of 3.4 million, compared to the same month of the previous year.
Figure 13 | Human persons. Evolution of the number of fixed terms and CDFs in PSPs with respect to the account park
Note | The number of fixed-term certificates includes fixed terms in ARS and UVA without the option of pre-cancellation. Bank accounts and payment accounts include those nominated in ARS belonging to PH and located in the EEFF and PSP that offer fixed terms and FCDs respectively.
Source | COELSA and BCRA.
Short and medium-term products. In 2022, the balances in DCFs and UVA products grew steadily at year-on-year rates close to 35% and 10%, respectively, although the balance of each of these products still represents a small portion of the volume of traditional fixed-term loans (DCFs by 8% and UVA products by 9% in December 2022). For its part, the balance in traditional fixed terms began to grow again in the fourth quarter of 2022.
The increases in the minimum interest rate for fixed-term deposits in pesos for PH during 2022 had a positive impact on retail savers, as they caused certain savings and investment alternatives to offer a more attractive return59. In particular, the growth in the balances of traditional fixed terms, FCDs in pesos and fixed terms in UVA with a pre-cancellation option could be due to the increase in the returns of these investment instruments.
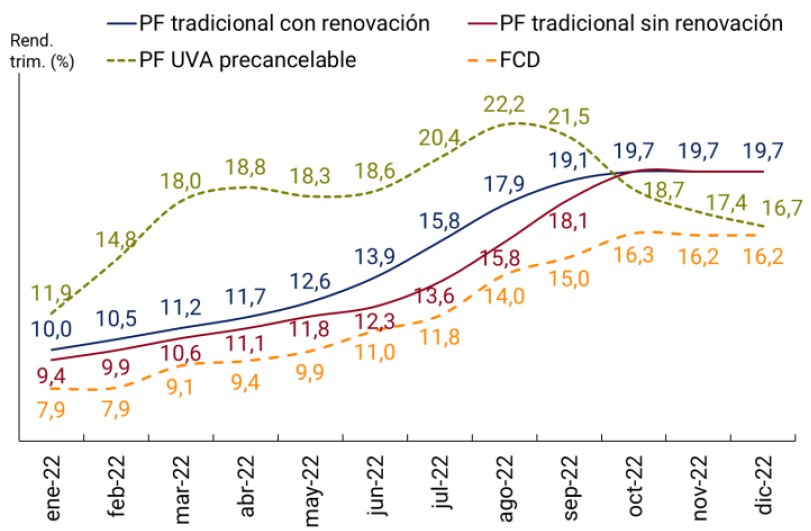
Under the assumption that the saver places or subscribes an amount of money on the first day of each month and withdraws or redeems it after 90 calendar days, the quarterly return of 4 savings alternatives to investment was calculated:
- (i) Traditional fixed terms in pesos with automatic renewal every 30 days, until the 90 days are completed;
- (ii) Traditional fixed terms in pesos for 90 days, without renewal;
- (iii) Fixed terms in UVA for 90 days, with pre-cancellation option,
- (iv) Mutual Funds (CDF).
Figure 14 | Quarterly returns on savings and investment products
Note | For the calculation of the yields of fixed terms in pesos, months of 30 days and years of 365 days60 were used. For more details on the calculation, see Methodological Note.
Source | BCRA, CAFCI and CNV.
Pre-cancelable UVA fixed terms were the most profitable products throughout the first three quarters of 2022, which is reflected in an increase in UVA product balances. In this way, the lower flexibility and liquidity of UVA fixed terms would be more than compensated for by their higher profitability, making this savings instrument more attractive. In second place, there are traditional fixed terms (with renewal): successive increases in the minimum interest rate made the prize for renewing this product every 30 days higher than depositing money for an equivalent period of time, without renewal.
However, as of October 2022, traditional fixed-term loans in pesos will become the most profitable products. Since there were no increases in interest rates in the last quarter of 2022, the rollover option does not affect the yield on these instruments. In addition, there was an increase in the profitability of DCFs, although their high liquidity61 implies that the yield is lower than that of fixed terms (both in pesos and UVA). This discourages the balances subscribed in DCFs from having a significant share within the portfolio of savings and investment products of individuals. Likewise, in the last quarter of 2022, a substitution of product balances in UVA was observed for traditional fixed-term balances (see chart 12 on the right).
4. Credit
4.1 Credit to individuals
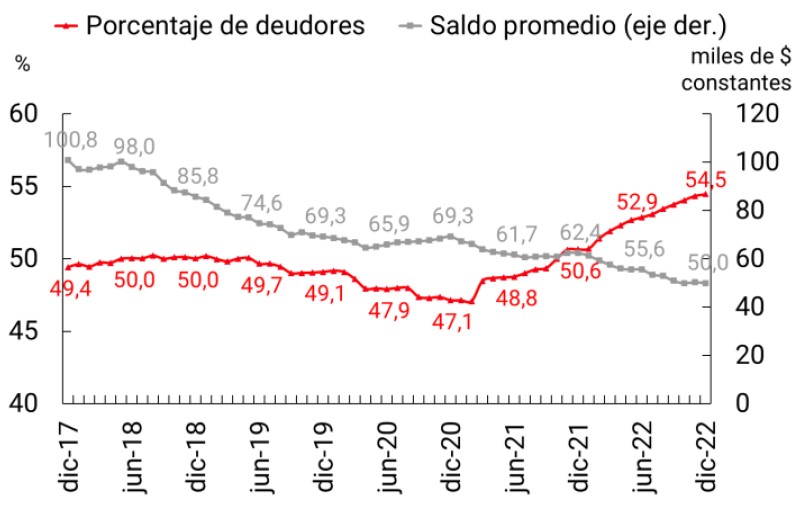
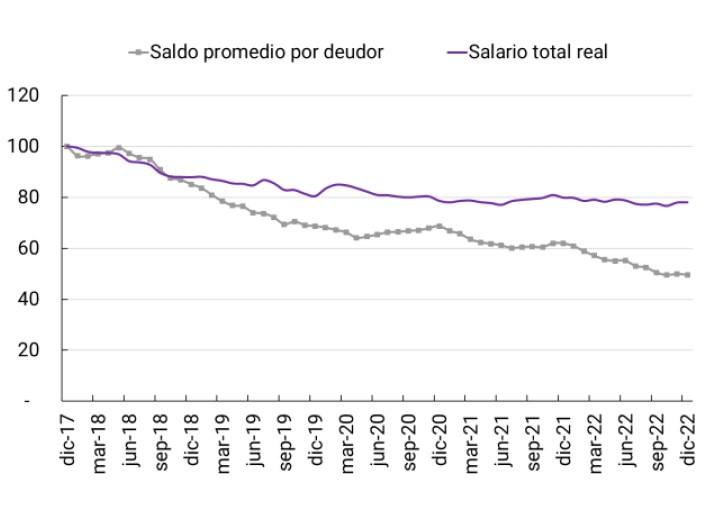
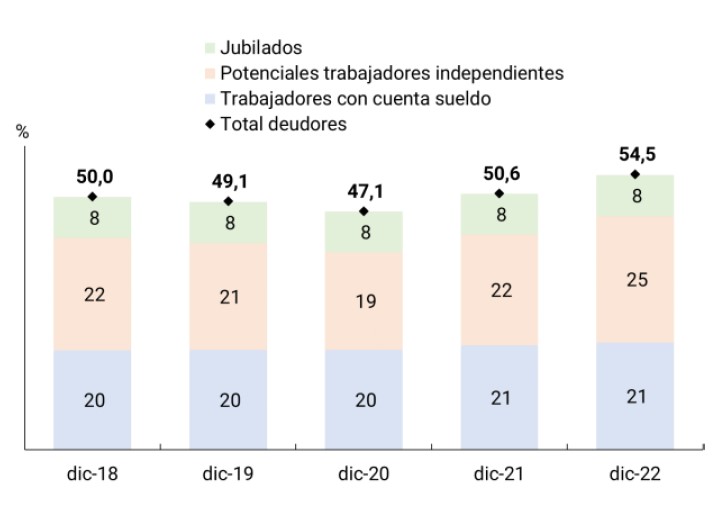
The number of individuals (PH) with financing in the expanded financial system (SFA) reached 19.3 million in December 2022, which implies that 54.5% of the adult population had at least one financing. In this way, this group registered a net increase of 1.6 million people compared to December 2021 (3.8 p.p.), consolidating two years of sustained growth. However, the total PH financing balance in the SFA decreased by 13% in real terms between December 2021 and December 202262. As a result, the average balance per debtor in real terms continues on a downward path.
Figure 15 | SFA Financing to Individuals
Note | Balances in thousands of constant pesos (base CPI 100 = Jan-19).
Source | BCRA and INDEC.
The holding of a growing number of PHs with financing in the SFA is influenced by new actors that take advantage of technology to offer credit63. Likewise, the number of PHs who receive income, whether a salary, a pension or payments for independent work, experienced an increase in the period under analysis. Having a registered income is a determining factor in the holding of credit products, which affects both the demand and supply of credit. Credit providers analyze a series of variables including income level, employment status, expense profile, and credit history to determine the granting of the loan, its amount, and interest rate. Holding a stable income allows users to meet the repayment of their debt and reduces the risk for financing providers.
The reduction in the average financing balance, although slightly interrupted during the COVID-19 pandemic due to countercyclical policies, is pronounced and accompanies the movement of the economy’s average remuneration and the increase in the cost of financing during the second half of 2022. Likewise, the incorporation of new users who were previously excluded, whose income is relatively lower, has an impact on the average amount financed.
Figure 16 | Evolution of SFA financing to PH and macroeconomic variables
Quantity variables
Balance and price variables
Note | Base 100 in December 2017. Amounts in constant pesos (base CPI 100 = Jan-19).
Source | BCRA, INDEC and Ministry of Labor.
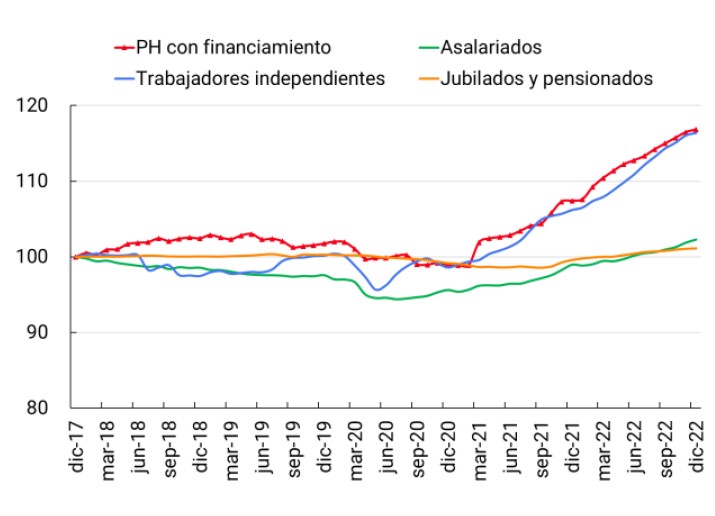
According to the information available, more than half of the PHs that registered credit products have a formal salary for their work in a relationship of dependency or with a retirement for having reached the corresponding age64. The remaining set of PHs with financing, which are mostly of working age, would have some type of income from independent work (for example, from commercial activities) to meet the repayment of their debt.
Figure 17 | Percentage of the adult population with financing and average balance per debtor
Percentage of adults with funding
Average balance per customer
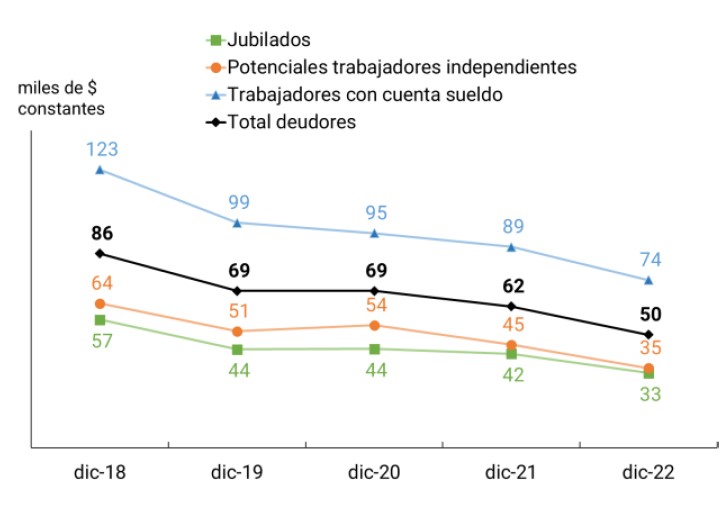
Note | Workers with a salary account includes all debtors who collect their salaries in a salary account. Potential independent workers correspond to debtors between 15 and 64 years of age who do not register a salary account. Retirees corresponds to debtors 65 years of age and older who do not have a salary account.
Source | BCRA and INDEC.
When looking at the financing balances, it can be seen that the type of income (and therefore its amount) significantly influences the level of the average debt balance. PHs that have a salary (salary account) register an average balance per debtor that is double that of those debtors who have an independent job (i.e., they do not register a salary account). In this way, although PHs that do not have registered work have access to financing, they do so for considerably lower amounts. Likewise, the evolution of the number of people with financing from the 3 groups shows that the reduction in the financing balance is explained by the contraction of the debt of all types of people who receive income and not by a particular type of person.
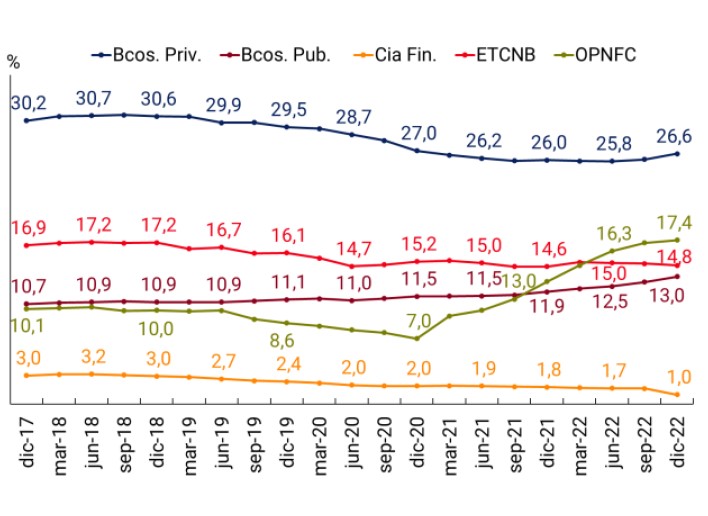
Credit providers. As of December 2022, 37 out of every 100 adults were financed with EEFF and 28 out of every 100 with non-financial credit providers (NFCPs). These values imply growth of 1.9% and 3.6%, respectively, compared to December 2021 and 1.6% and 8.1% compared to December 2020. Although both types of providers are under the orbit of the BCRA, the regulations applied to each of them have different implications for users. Documentation requirements, types of products, cost and amount of financing, ways of managing credit (face-to-face, mobile, or computer) and business models are among the variables that distinguish the EEFF from the PNFCs.
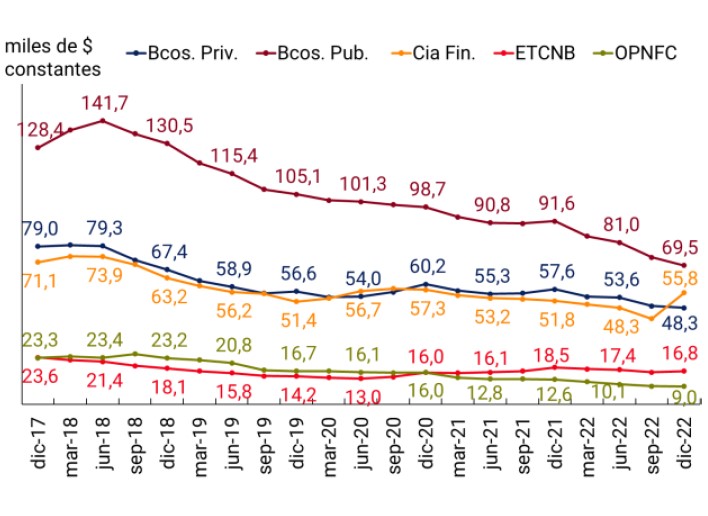
The average balance of the EEFF debtor is equivalent to 4.3 times the average balance of the PNFC debtor, indicating clear differences in the amounts financed by each group. In part, the balance gap between the two groups is explained by the type of financing offered. PNFCs offer their customers personal loans and credit card assistance, while the EEFF have a wider range of products that also includes current account advances and title and mortgage loans, among others. In particular, title and mortgage loans are characterized by their high amounts, which impacts the average balance per debtor. Likewise, characteristics of the people who receive the financing, such as age and the possession of a registered job in a relationship of dependency, affect the amount financed.
Within the EEFFs as a whole, private banks are the institutional group that finances the most people with 9.4 million debtors. During 2022, this group of banks registered an increase in the number of people they provide assistance to and ended with three consecutive years of decrease in the number of debtors. However, the total balance financed by this group fell by 13%, resulting in a 16% drop in the average amount per debtor (vs. 4% the previous year). Public banks, for their part, accelerated their incorporation of debtors, tripling the growth of the previous year and reaching a total of 4.8 million adults with financing. In terms of balances, the total financed by this group fell by 13% and the average balance per debtor fell by 24% (vs. 7% in 2021).
For their part, non-bank credit card issuers (ETCNBs) slightly increased the number of people with financing, which represents a change in the trend of reducing debtors of the last three years. However, during 2022 they reduced the total financed balance by 8% and the average balance per debtor by 10%. The other non-financial credit providers (NPPOs) continue to incorporate new debtors and reached 6.2 million adults financed, surpassing the ETCNBs (5.2 million). Driven mainly by providers that grant personal loans digitally and for small amounts, OPNFCs consolidate a clear trend towards the incorporation of people with financing. However, during 2022, this group registered a decrease in the total financed balance of 3%, which, together with the growth of the people assisted, generated a drop in the average balance per debtor of 28%.
Figure 18 | Percentage of the adult population with financing and average balance per debtor
Percentage of adults with funding
Average balance per customer
Source | BCRA and INDEC.
Throughout 2022, all institutional groups (except financial companies) recorded an increase in the number of PHs with financing, but reduced the average balance financed to each debtor. On the other hand, public banks and OPNFCs are the two institutional groups that sustain a PH portfolio with financing that exceeds that of the pre-COVID-19 pandemic periods.
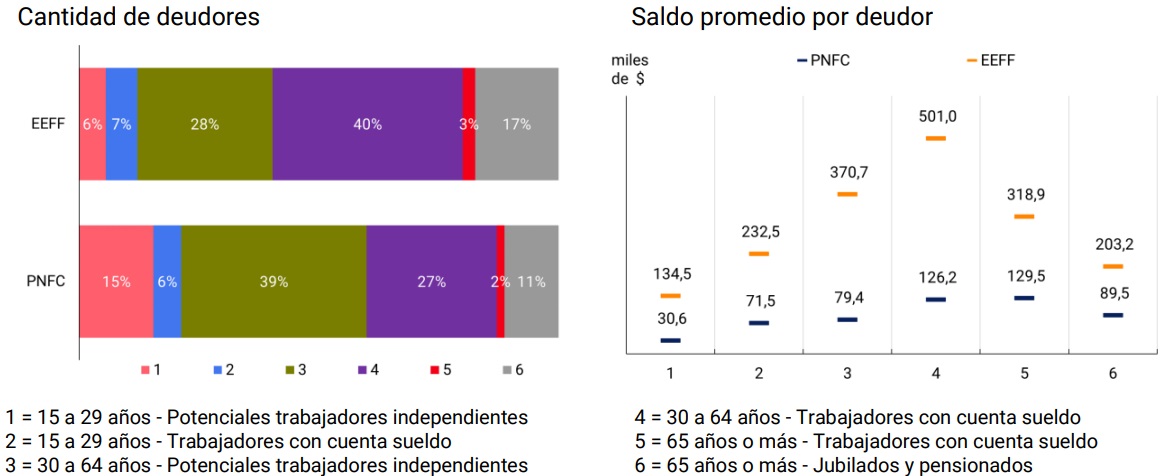
Characteristics of debtors by group. Within the PNFC group, young adults (15 to 29 years old) represent 21% of the total number of people with financing, while for the EEFF the same group reaches 12% of the total. The emergence of NFPPs that operate exclusively digitally may explain, at least partially, the higher proportion of young debtors in this group, by virtue of their greater propensity to operate in digital environments.
On the other hand, continuing with the distinction of the type of income of people with financing, it emerges that potential self-employed workers represent 54% of the total debtors for the PNFCs and 34% for the EEFFs. OPNFCs that combine the offer of credit together with activities such as payment services or e-commerce use alternative information to generate a profile of their users and a credit score. This makes it easier for people who do not have a job in a dependent relationship (but do have other income) to access formal financing, although for significantly lower amounts than those of people with a salary account and at higher interest rates.
In terms of age, the average balance per debtor replicates the inverted “U” behavior of the evolution of income, with lower average balances for young adults and older adults65. Likewise, the possession of a salary account (which indicates a registered job in a relationship of dependency) has a positive impact on the balance financed by both EEFF and PNFC. Combining both attributes, it emerges that people between 30 and 64 years of age who have a dependent salary receive the highest amounts of financing.
Figure 19 | PH with financing by institutional group
Note | Data as of December 2022. Graph on the right: balance in thousands of current pesos.
Source | BCRA.
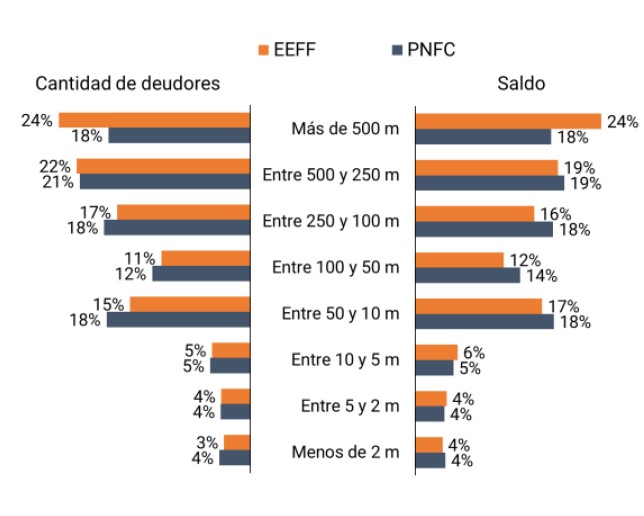
On the other hand, in relation to the PNFCs, the EEFF show a higher proportion of their debtors in localities with a greater number of inhabitants. This phenomenon is also replicated for the balance of financing, indicating a greater allocation of resources by the EEFF in larger localities66. These localities have a greater presence of physical infrastructure, with which users can contract credit products not only digitally but also in person. The PNFCs, on the other hand, register a higher proportion of people with financing and debt balance in intermediate-sized localities, especially in the range of between 10 thousand and 50 thousand adult inhabitants. For both types of providers, this behavior deepens over time, both in the number of people with financing and in their corresponding balance.
Figure 20 | Debtors by age range and salary account holdings
By age ranges
By possession of a salary account
Note | The Communes of the Autonomous City of Buenos Aires (CABA) are grouped into a single unit that totals more than 500 thousand adults.
Source | BCRA.
4.2. Credit to productive units
Micro, small and medium-sized enterprises (MSMEs) are a fundamental asset of a country’s productive scheme. Their relevance lies both in the number of companies in the economy and in their contribution to employment67 and, consequently, they are key actors in economic development. The availability of funds for these companies is, therefore, a transcendental factor in the purpose of financing production processes and investment in equipment68,69. In this sense, this section contributes to visualizing two external sources of the financing structure of MSMEs, the financing of financial institutions (EEFF) and non-financial credit providers (PNFC)70. The section inquires about the most used credit products and the age of MSMEs.
In recent years, the BCRA has implemented different regulatory initiatives aimed at improving MSMEs’ access to EEFF financing, both to respond to the transitory impact caused by the COVID-19 pandemic and also of a more permanent nature to help reduce barriers to access to financing71. These include:
a. Incentives for reducing the cost of financing MSMEs through minimum cash reduction:
i. Based on the share of financing to MSMEs with respect to total financing to the non-financial private sector (NFPS).
ii. For credit to MSMEs without EEFF financing.
b. Financing Line for Productive Investment of MSMEs (LFIP). As of 2020, the EEFF must maintain a balance of financing included that is at least equivalent to 7.5% of their NFPS deposits in pesos subject to fractional reserves, whose interest rate is subject to a maximum ceiling.
In this framework, the number of MSME companies with financing in the expanded financial system (SFA) reached a number of 1.04 million as of December 2022, close to 63% of companies with MSME72 certificate. In this way, this group of firms registered a net increase of 215,542 units compared to December 2021. Micro companies contributed almost all of the 26% year-on-year increase. On the other hand, the financing balance of MSMEs in the SFA amounted in current values to $3.8 trillion in December 2022. At constant values, this balance fell by 14% in year-on-year terms73, experiencing the same dynamics as credit to NFPS, which fell by 15% in that period74.
Figure 21 | MSMEs with financing and economic activity
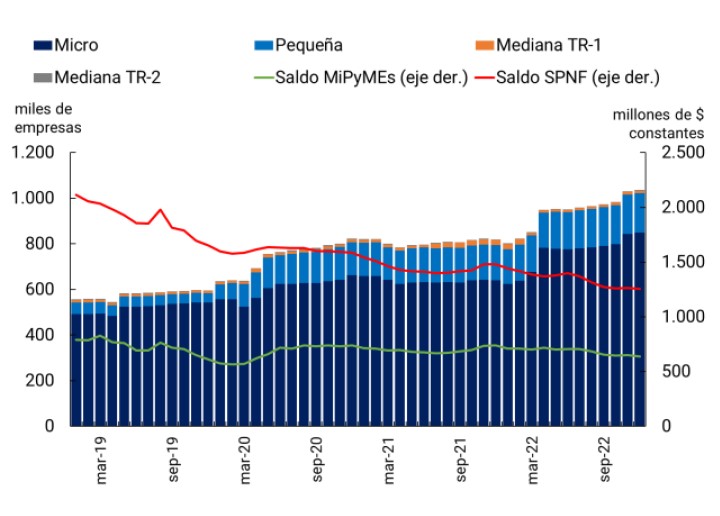
Note | Includes financing in domestic currency and foreign currency. Graph on the right: base 100= January 2020.
Source | BCRA.
As previously indicated, the Financing Line for Productive Investment of MSMEs (LFIP) and the minimum cash reduction incentives for credit to MSMEs collaborate in directing financing to this group of companies at a cost lower than the market average75. From its implementation in October 2020 to December 2022, the LFIP disbursed $4.2 billion, benefiting more than 371,280 companies76.
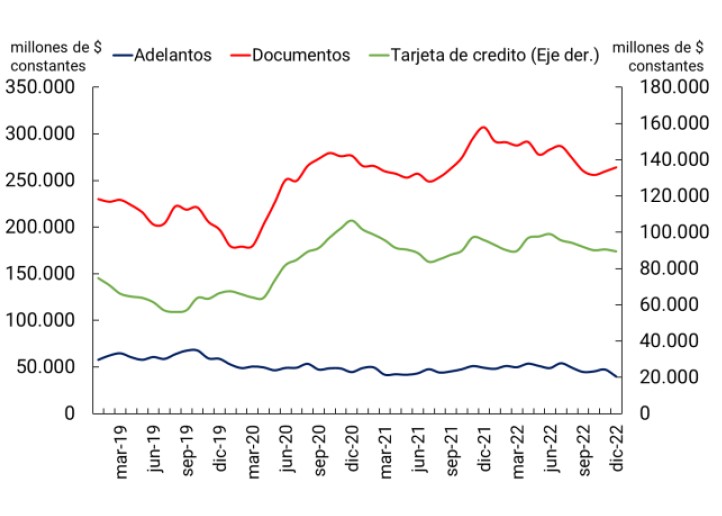
On the other hand, with respect to the types of assistance most used by MSMEs since the COVID-19 pandemic, documents stand out, which includes both single-signature documents and discounted and purchased documents (hereinafter “documents”). Credit card assistance and title loans appear in second place. On the other hand, assistance associated with foreign trade and advances had contractions.
Figure 22 | Balance and interest rates per financing line
Financing balance
Interest rates
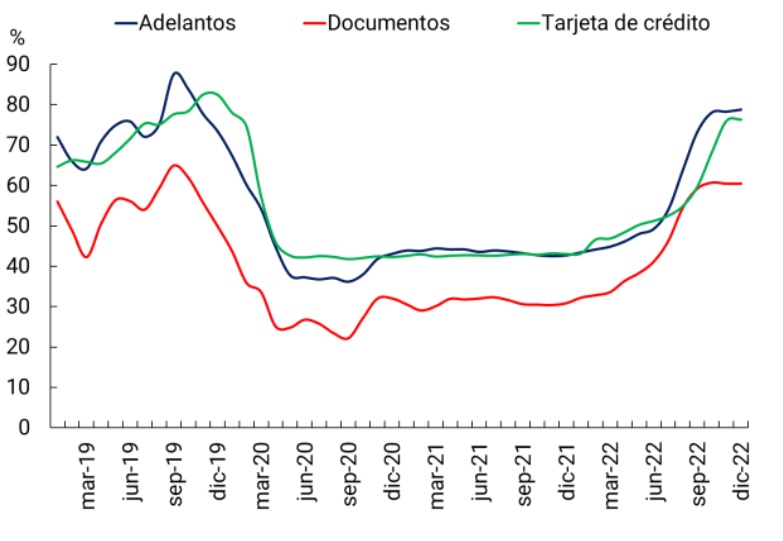
Note | Graph on the right: the interest rate on documents corresponds to the average of the interest rates on single-signature documents, discounted documents and purchased documents weighted by the amounts traded monthly in each type of assistance. These are interest rates and amounts operated by PJ PyMEs. The credit card rate applies for PH.
Source | BCRA.
Different factors are associated with the behaviour of different types of assistance. On the one hand, the LFIP created favorable conditions for the existence of supply of certain lines of credit, such as, for example, document discounts. Likewise, the lower interest rate associated with the assistance of documents with respect to current account advances may have induced a greater use of the former77. In the case of credit card financing, the abrupt reduction in the compensatory interest rate towards the first quarter of 2020, as well as the maximum limits to said rate based on a fixed rate78 and the characteristic of being revolving loans could be associated with its outstanding performance. In 2022, some reduction was observed towards the last months of the year, while the rate for financing through this instrument showed an increasing trend in the second half of the year.
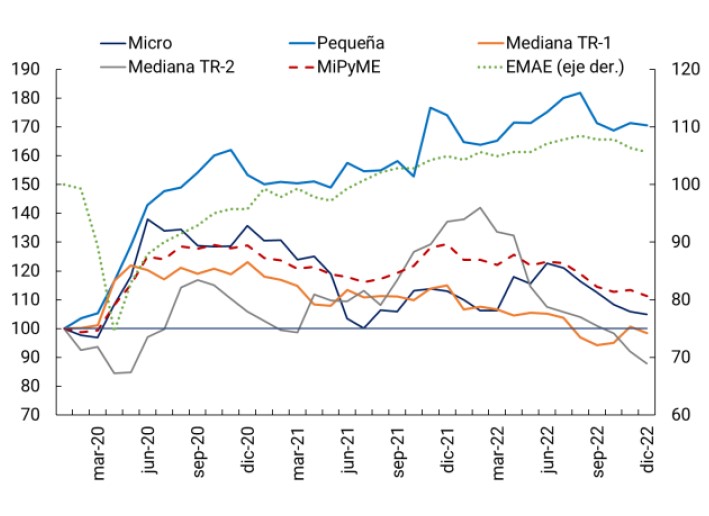
On the other hand, despite the consolidation of the recovery in economic activity, the financing levels of MSMEs registered in 2022, although they remained above pre-pandemic levels, are on a downward path. When disaggregated by company size, it can be seen that only small companies experienced a positive dynamic, more linked to the development of economic activity, while micro and medium-sized companies showed a reduction in the financing balance.
What SFA credit products do MSMEs use? The relevance of credit products, measured both in terms of balance and number of companies, varies depending on the size of MSME companies. The choice of the type of financing depends on a variety of factors, from the destination of the financing and the document requirements for the application to the interest rate, the amount of the financing and the repayment term. In terms of financial inclusion, the availability of a range of credit products that adapt to the diverse needs of MSMEs improves the growth possibilities of companies and facilitates the cycle of production of goods and/or provision of services.
In terms of balance, micro and small enterprises are financed mostly by credit cards and documents, while medium-sized enterprises are financed mainly by documents and advances79. Therefore, the use of documents is the main financing mechanism for MSMEs, which consists of the delivery of their own documents or those of third parties as consideration for the loan granted by the EEFF. In the last 24 months, this credit product concentrated between 37% and 41% of the financing balance of MSMEs and represented a significant portion of the funds obtained that can be assimilated to working capital of small and medium-sized enterprises (68% to 78%). It should be noted that, among the destinations provided for by the LFIP, the application of funds to working capital is included, whose financing is instrumented, among other alternatives, through the mechanism of documents with a single signature80.
In terms of the number of participating companies, credit cards maintain their relative share within each size, although their importance decreases as their size grows and, therefore, the participation of legal entities (PJs) increases. In addition, credit products such as advances, documents, and secured loans increase the share of firms as firms grow in size (i.e., PH share falls).
Table 5 | MSME Financing by Attendance Group and Size
Data as of December 2022
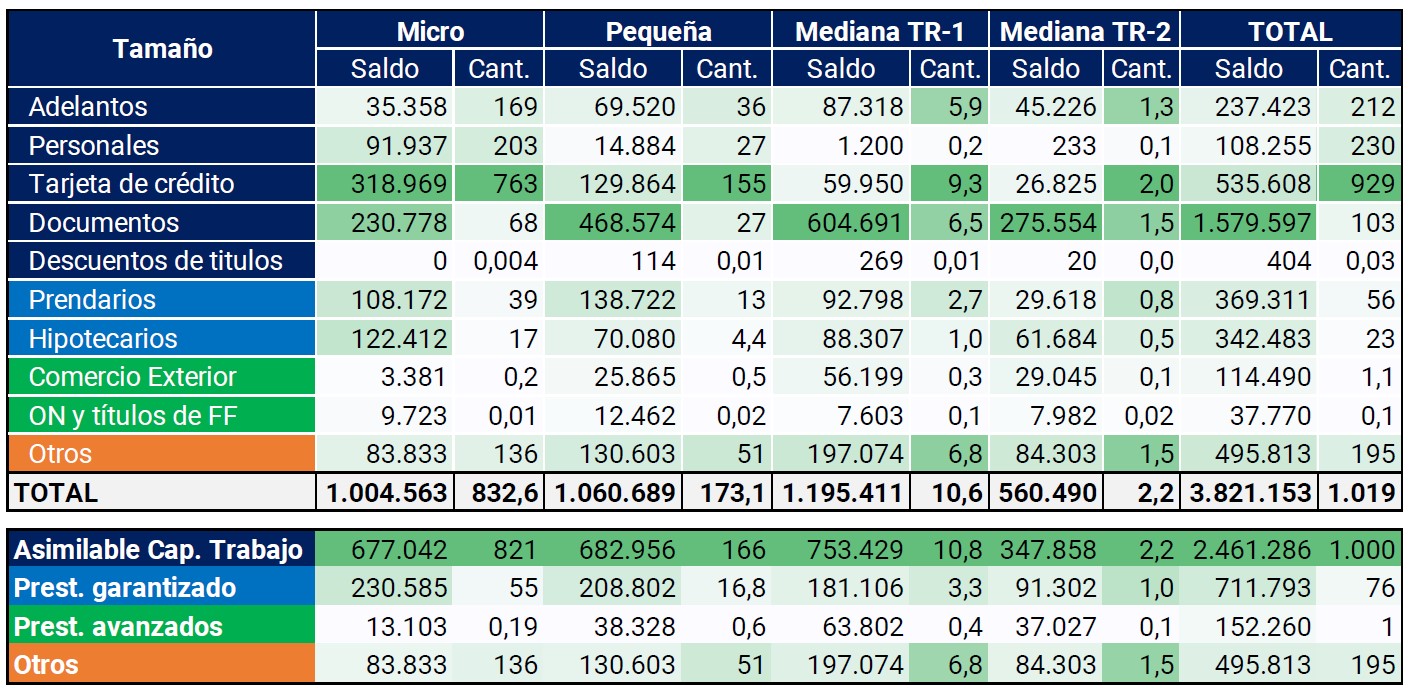
Note | “Balance” in millions of current pesos. Number of companies in the thousands. The green color of the cells is calculated based on the minimum and maximum value of each metric (balance and quantity) for each of the sizes.
Source | BCRA.
Regarding financing by type of supplier, i.e. EEFF and PNFC81, MSMEs are mainly financed by the former, regardless of the size of the company82. On the other hand, it is observed that these companies are increasing their exposure to PNFC financing, although at levels much lower than those recorded by the EEFF83. The emergence of new credit providers, leveraged on the use of technology for credit evaluation and management and on the use of equity and/or capital market financing, expanded the supply of credit for MSMEs.
In December 2019, the ratio of EEFF to PNFC financing was 50 to 1 (i.e., for every $1 of financing in PNFC, MSMEs had $50 in EEFF), while in December 2022, the ratio rose to 37 to 1. In this period, the balance of financing of MSME companies in PNFC increased by 50%84. Likewise, during the period in question, the financing granted by the PNFCs was concentrated in smaller companies, while in the case of the LFES it was distributed more equitably, with a certain predominance of small and medium-sized TR-1 companies.
Figure 23 | MSME Financing Balance by Vendor Group and Size
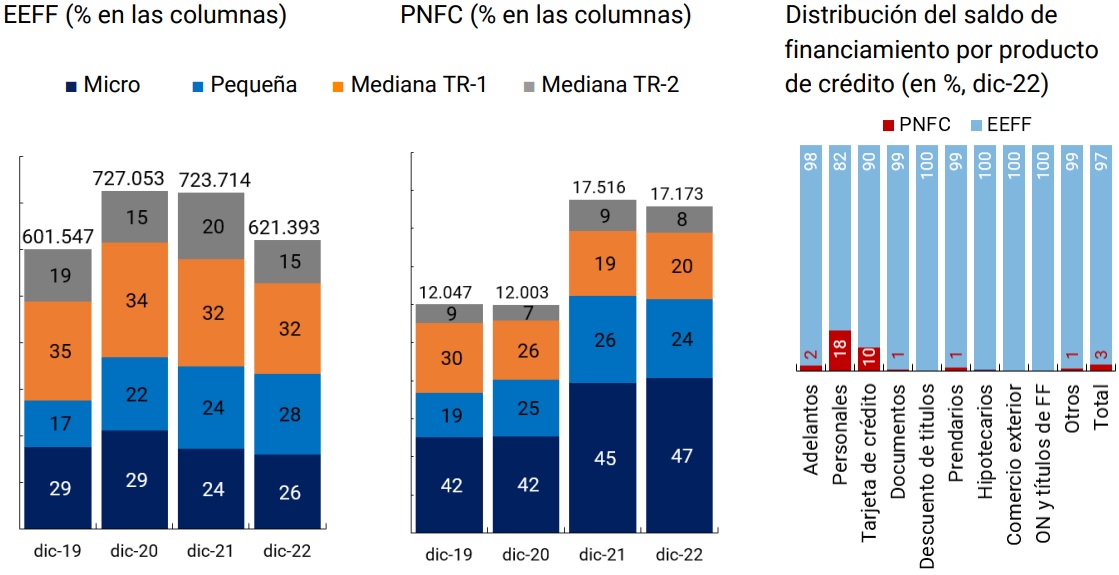
Note | Balance in millions of constant pesos (base CPI Jan-19=100).
Source | BCRA.
How long do MSMEs with financing have?85 The distribution of financing according to the life span of the productive unit is a relevant element for the financial inclusion of young MSMEs. On the one hand, young companies require an injection of resources in the early stages of development86, but, on the other hand, they have less economic history of their company, which makes it difficult to evaluate their credit. At the same time, smaller firms, to the extent that they generate positive results (profits), tend to finance themselves through the reinvestment of profits, implying that they could substitute external sources of financing for internal ones87.
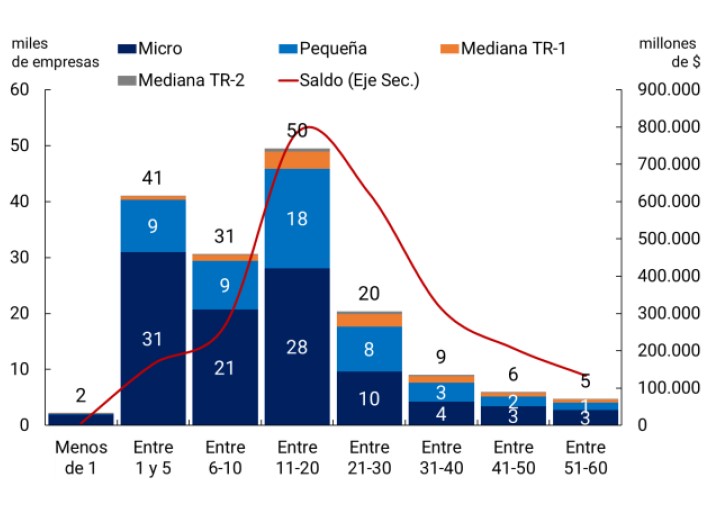
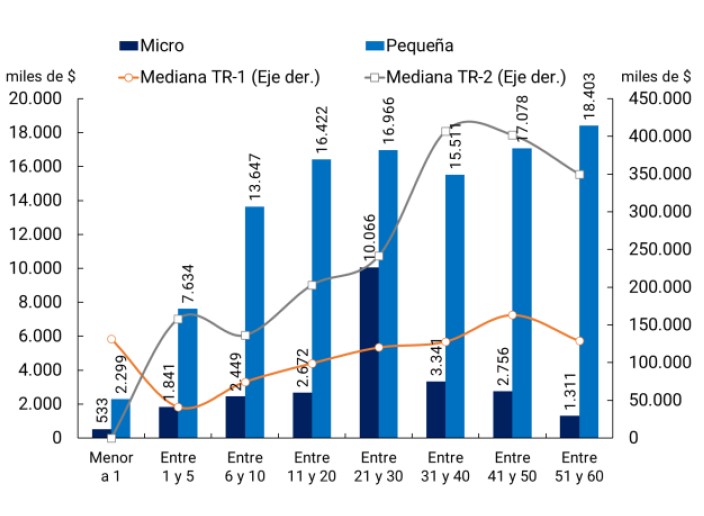
In the case of PJ MSMEs, three-quarters of the productive units are up to 20 years old, with a predominance of micro and small sizes, and they account for less than 50% of the financing balance. Although young companies have a significant portion of the financing balance, the average balance is very low, which could be an indication that small companies use other sources of financing. Likewise, the passage of time seemed to have an impact on the level of financing of companies of all sizes, although the effect tends to be partially reversed for the group of companies with the longest life.
Figure 24 | Amount and balance of financing by type of person and length of life
Data as of December 2022
Individuals
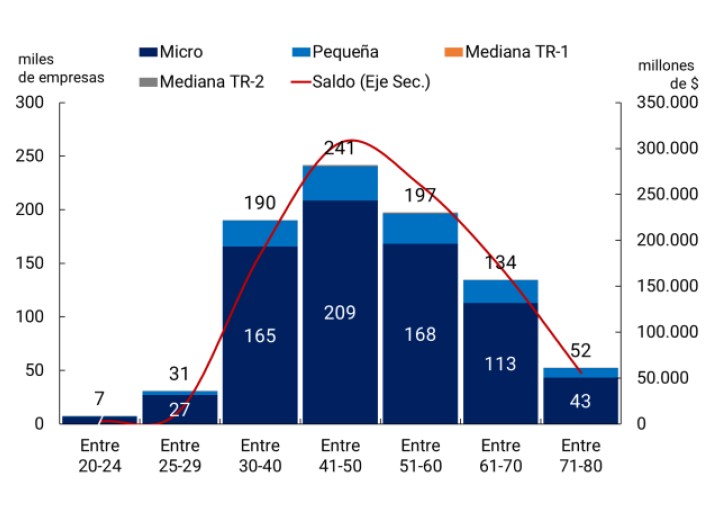
Legal persons
Note | Balance in current pesos. The X-axis shows strata of years.
Source | BCRA.
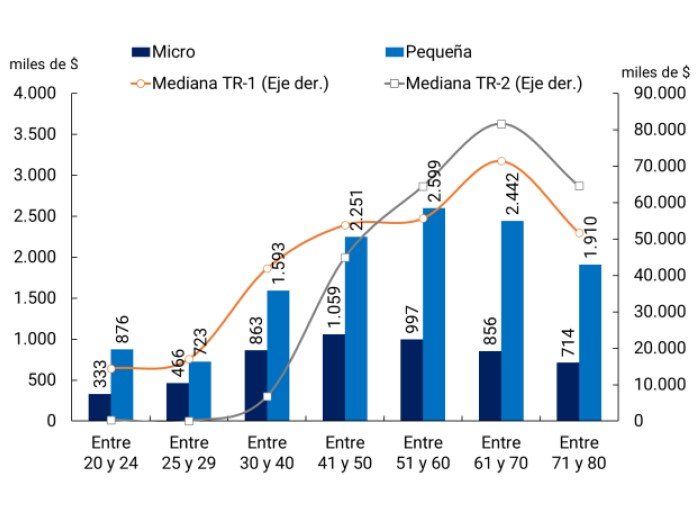
In the case of PH MSMEs, micro-sized companies predominate in all age groups. Also, as the age of the person increases, the participation of small companies grows, which could be linked to a certain trajectory of commercial activities. This can be seen in the fact that people over 50 years of age account for 50% of the financing balance and maintain average financing balances similar to or close to younger age groups.
Likewise, similar to what happens with PJ MSMEs, the growth in the age of people seems to affect the level of financing regardless of the size of the MSME. It should be noted that the number of medium-sized PH MSMEs is a very small portion of the total PH MSMEs (less than 1%), taking into account that the amount of turnover required for these sizes is very high for a commercial activity organized around a human person.
Figure 25 | Average current financing balance per lifetime
Data as of December 2022
Individuals
Legal persons
Note | Balance in current pesos. The X-axis shows strata of years.
Source | BCRA.
Section 1 / An approach to the use of electronic channels by financial institutions
In view of the significant progress made in digitalization, measuring the use of electronic channels is a crucial aspect of assessing the degree of (digital) financial inclusion. While aggregate variables such as electronic payments (see Section 3.1) show the growth of electronic channels, information is scarce on user behavior across electronic channels.
As a first approach to the subject, a survey was carried out on the use of electronic channels by individuals to carry out transactions that involve movements of funds. This survey consisted of a voluntary survey of all financial institutions (EEFF), which focused on collecting historical information on users and their activity in home banking (HB) and mobile banking or electronic banking wallet (MB or mobile banking)88. The analysis proposed in this section considers a sample of 10 FBSEs, which accounted for 49% of bank account holdings in December 202189.
Figure A.1.1 | Using HB and MB to perform a transactional operation
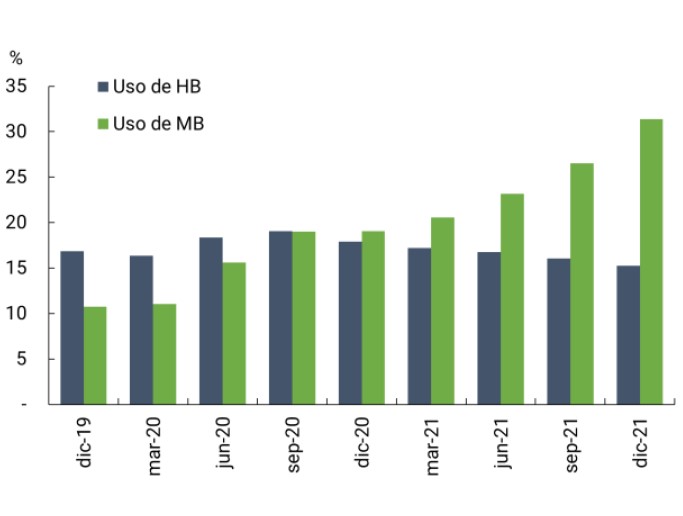
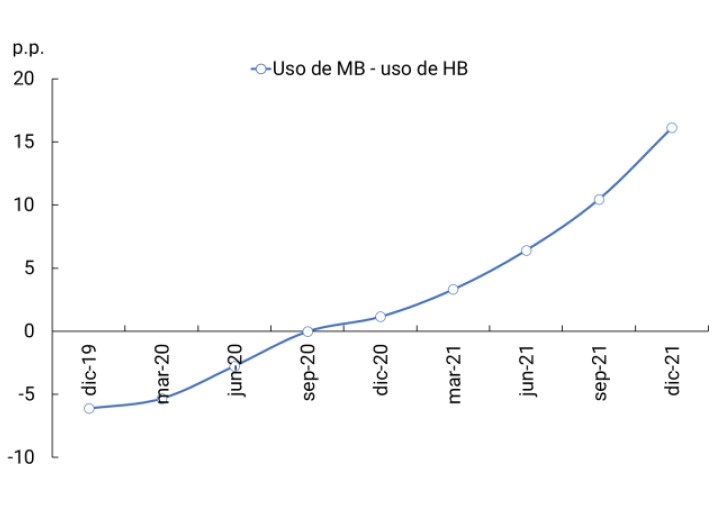
Note | “Usage” means the percentage of account holders with at least one transactional transaction in the quarter. In the same period, the number of times a person is counted is determined by the number of the 10 EEFF in the sample where he or she has an account registered. This applies both to the number of account holders and to those who register a transactional transaction.
Source | BCRA
In general terms, the use of mobile banking or electronic banking wallet to carry out transactional operations grew significantly. After the COVID-19 pandemic, a change in behavior is observed in the electronic channel chosen for transactions, losing home-banking relevance with respect to mobile banking.
The progressive inclination of account holders towards mobile banking is supported, among other factors, by a more intense use of mobile devices and the greater offer of banking applications with services and products that meet the different needs of individuals. Likewise, the cell phone has the potential to include new people in electronic channels, in particular population groups with a certain degree of vulnerability90.
Results at the level of financial institution. Practically all the EEFF in the sample (9 out of 10) registered an increase in account holders who used mobile banking to carry out at least one transactional transaction between the last quarter of 2019 and the same period in 2021. These 9 EEFF accounted for 48% of the accounts in pesos in the financial system as of the last quarter of 2021.
Figure A.1.2 | Use of electronic channels to perform a transactional operation
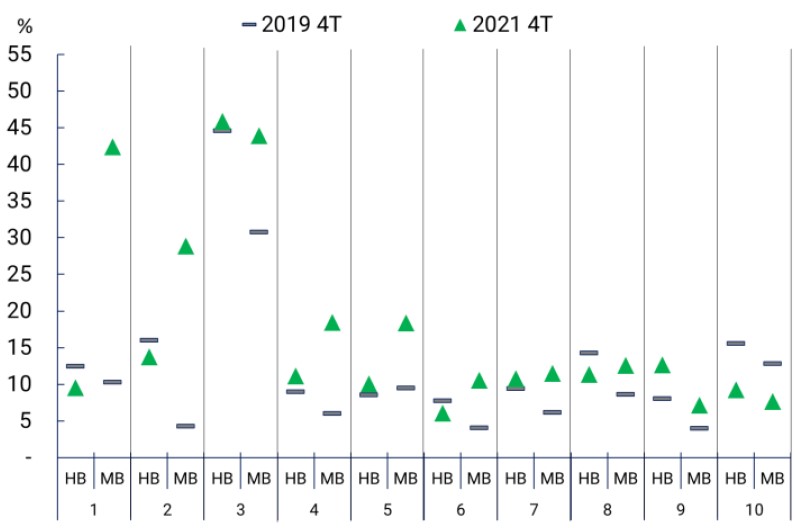
Note | “Usage” means the percentage of account holders with at least one transactional transaction in the quarter. The numbering of the “x” axis corresponds to the 10 EEFF that are part of the final sample. They are ordered in descending order based on the variation in MB channel usage between Q4 2019 and Q4 2021.
Source | BCRA.
Likewise, mobile banking became the main channel for a large part of the SEEs (7 out of 10 vs. 1 out of 10, in the last quarters of 2021 vs. 2019). On the user side, new digital behaviors are in line with a greater use of mobile banking: each person spent on average more than 3 hours per day on the cell phone during 2021 and it is estimated that downloads of mobile-banking applications and digital wallets and payments went from 5 million to 9.9 million in the period under analysis91.
For its part, the HB channel also recorded increases in its usage levels, but in a smaller amount of EEFF (5 out of 10) and with increases well below MB. In addition to what was previously mentioned about the increased use of mobile devices, the HB channel has certain characteristics that would limit the expansion of its use: (i) low ownership and use of computers, and (ii) the characteristics of the device that do not allow it to be used for certain operations (such as QR payments or other face-to-face electronic payments). On the other hand, certain behaviors of account holders would also limit the expansion of their use. The available information allows us to infer that account holders prefer to use the HB to make transfers of funds for higher amounts, which are made less frequently (See Section 3. Electronic means of payment).
Thus, the LFSE showed two behaviors: on the one hand, increases in MB use and simultaneously decreases in HB use (4 out of 10), and on the other hand, increases in the use of both channels (5 out of 10). This implies the incorporation of a significant number of new users to mobile banking, without this increase implying a significant loss of users in the HB.
Characteristics of the EEFF. As part of this process, certain attributes of the EFFS, such as the size of the EFFS and the age composition of account holders, could have boosted the adoption of mobile banking:
Figure A.1.3 | Account holding, MB use, and age structure
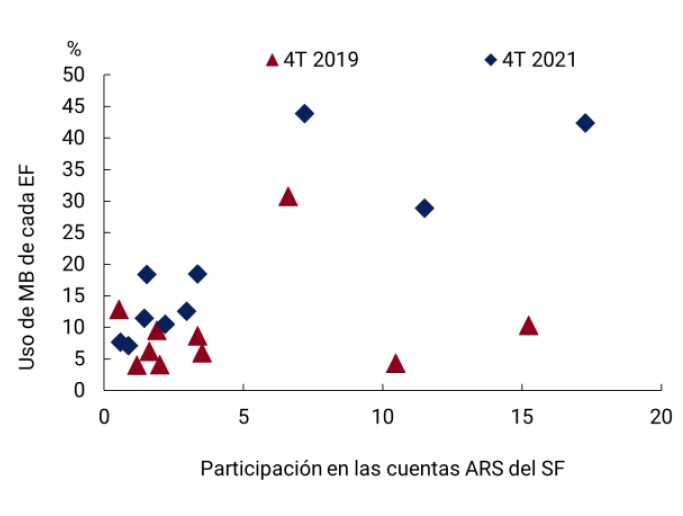
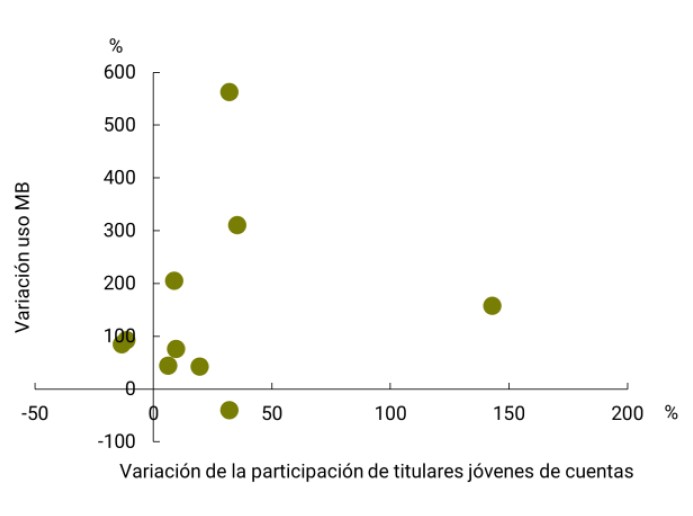
Note | Q4: 4th trimester. SF: Financial system. Variation in the use of the MB and Variation in the participation of young account holders: variation between the last quarters of 2019 and 2021. Youth: 15 to 29 years old.
Source | BCRA.
- Size of the EFS. This aspect, associated with the availability of resources, may have favored the creation or rapid adaptation of mobile banking applications and/or electronic banking wallets, which allowed the entry of new people to this channel in a short period of time. The 3 EEFF with the highest proportion of accounts in the financial system (SF) recorded the highest MB usage ratios in the last quarter of 2021.
- Age composition. Young people constitute the92nd age group with the highest use of cell phones (95.9% in the fourth quarter of 2019 and 97.2% in the same period of 2021). The average turnout is 21%. In this way, the use of MB would have a lower limit stipulated by the weight of young people in the total number of clients of each PE. In most of the LFSE (7 out of 10 cases), the increase in the use of MB was accompanied by a higher participation of young people among their account holders.
Despite the improvement, the use of mobile banking only exceeded the ratio of 1 in 5 account holders in 3 of the EEFF surveyed, which indicates that the number of users could continue to grow.
In conclusion, the digitalization process that deepened as a result of the COVID-19 pandemic was reflected in an increase in the use of the electronic channels of the EEFF with a marked inclination of account holders towards the cell phone. The high use of mobile devices in all population groups, the advance of banking applications and the generational turnover in EEFF customers would be some of the factors that explain this phenomenon.
However, the latest data show that there is still room for the expansion of both electronic channels.
Section 2 / Gender gaps in financing MSMEs
Micro, small and medium-sized enterprises (MSMEs) play a fundamental role in the growth of economies and the generation of employment. Globally, MSMEs represent 90% of companies and 50% of employment, while in emerging economies, they contribute 40% of GDP93. MSMEs led by women represent approximately one-third of the global total number of MSMEs and are subject to additional challenges compared to their male peers. One of the challenges faced by women who manage MSMEs around the world is access to financing94 . The financial constraints faced by women are associated with characteristics of the companies that operate, usually small, linked to the service sector or informal sectors. They may also face more expensive financing conditions since they are usually seen as less qualified than men95.
The study of gender gaps in financing MSMEs poses a first challenge in terms of data availability to determine the set of productive units corresponding to men and women and what is meant by it. MSMEs can be constituted by natural persons (PH), whose owner defines the gender of the company, or legal persons (PJ). In the latter case, in order to discern whether they are companies with female leadership, a definition must be appealed to that generally uses one or both of the following criteria: (a) a certain shareholding composition in the hands of women; (b) a percentage of female participation in the board of directors. The Central Debtors’ Office (CENDEU) of the BCRA provides information on the MSME status of PHs and PJs that access financing in the financial system, as well as the gender of MSMEs constituted by PHs on which the analysis is focused.
Argentina made progress in the mapping of MSMEs led by women, made up of both PHs and PJs and with at least one employee. By 2020, it was estimated that 33% (about 180,000) of all MSMEs (541,000) had women in their leadership spaces (31% in the case of those constituted as PHs)96. However, this set covers only MSMEs that had at least one registered employee. This condition prevents comparison with the information from CENDEU since the latter includes all productive units that report the status of MSMEs, whether they are employers or not97. In this sense, this section will focus on the gender analysis with respect to access to financing by PH MSMEs and in terms of the average balance per company98. The total number of women’s MSMEs PH with financing grew from 155 thousand in March 2019 to 323 thousand in December 2022, representing an increase of 108%. For its part, that of men went from 282 thousand to 542 thousand during the same period (92% increase).
From a first analysis, it emerges that the average balance of women’s MSMEs (MSMEs-M) is considerably lower than that of men’s MSMEs (MSMEs-H). As of December 2022, the average balance per MSME-M represented 47.6% of the average balance of an MSME-H, showing a gender gap in terms of the amount financed. This difference between companies of both genders remained at similar values during the last two years.
Size of the companies. A first explanation could be found in the size of the companies. The international literature indicates that financing is associated with the size of the firm and that firms led by women are, in general, smaller99. There are several explanations for this, one of which is based on the time available to devote to their professional activities due, for example, to the greater dedication to care tasks.
Figure A.2.1 | Financing of PH MSMEs by gender
Average balance per company
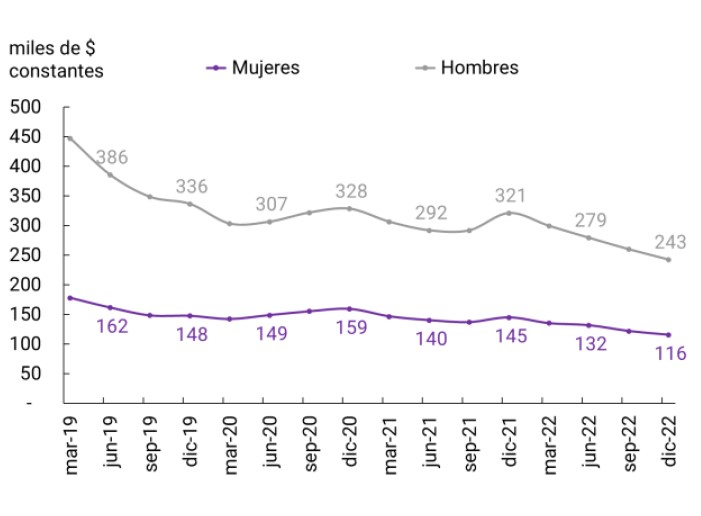
Average balance of MSME-M/MSME-H
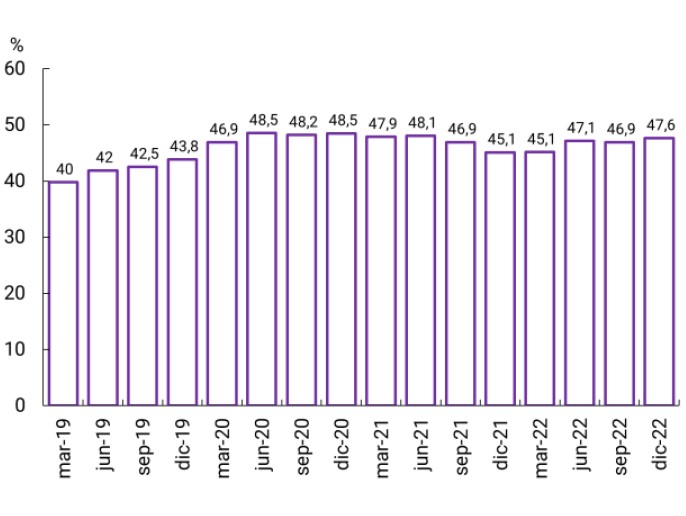
Source | BCRA
In the case of Argentina, in the last two years there has been a similar composition by size of MSMEs of men and women who access financing, with 86% of micro enterprises, around 13%/14% of small enterprises and less than 1% of medium-sized100. The difference in average balance to the detriment of MSMEs-M is found in all sizes of companies and to a greater extent for larger ones. For small businesses as a whole, the average balance of women-owned businesses is about one-third of the average balance of men-owned businesses. Likewise, it is observed that men’s micro enterprises have a higher average balance than women’s small enterprises101, even though the turnover amounts for small companies is between 3 and 7 times higher than for micro102.
Figure A.2.2 | Average Balance by Size
Microenterprises
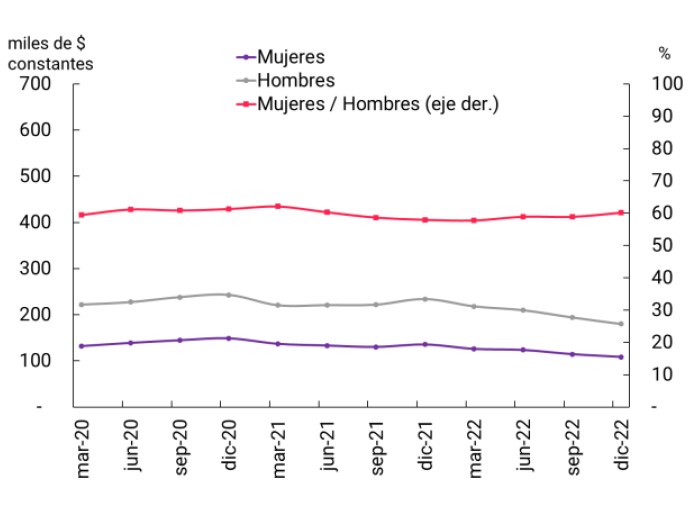
Small Businesses
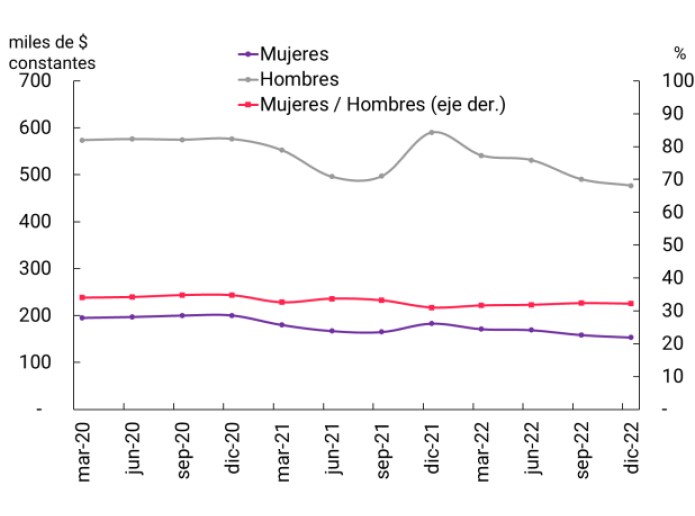
Source | BCRA
Economic sector. A second hypothesis about the differential in the average balance is based on the branches of activity where a greater proportion of women-owned companies are concentrated. The international literature indicates that companies led by women operate relatively more in the services and trade sector, while those led by men operate in the industrial or manufacturing sector.
Table A.2.1 | Number of PH MSMEs with financing by size, sector and gender
Data as of December 2022
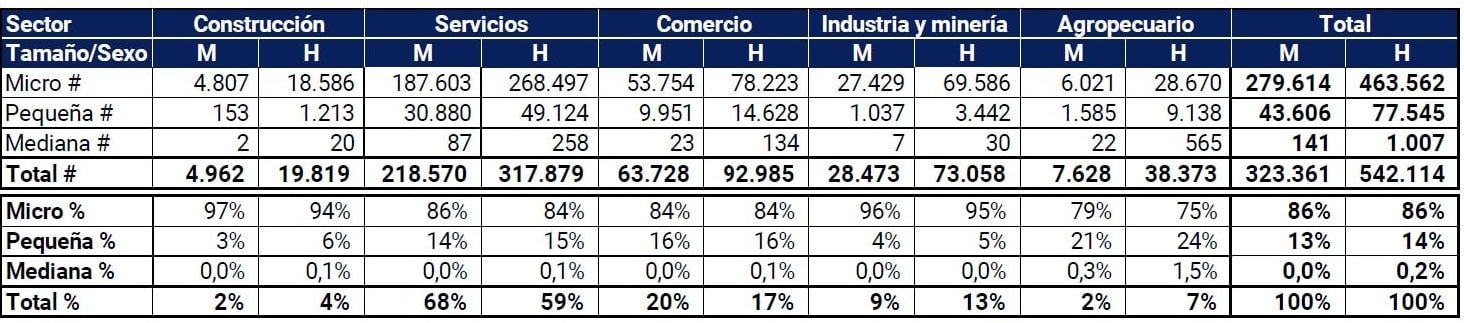
Note | Micro and small enterprise percentages are calculated on the total number of enterprises by gender and sector (total #). The percentages of the “total %” line are calculated on the totality of PH MSMEs by gender. M: women, H: men.
Source | BCRA.
Companies in the commercial or service sector tend to have fewer fixed assets that imply property titles (land, offices, production plants, etc.), which are the ones that financial institutions usually value positively when applying for guarantees. The guarantee is an important aspect to shape the risk profile of a company and evaluate the solvency of a loan, so it often also functions as a determining factor of access to credit or, at least, of the financing conditions.
Among PH MSMEs with financing, there is a greater concentration of women in the services and commerce sectors (88%) than men (76%), while in the industry and mining branch the opposite occurs (9% in the case of women and 13% for men), in line with what the literature suggests. And although differences persist in the average balance per company to the detriment of women, the gap in the case of industry and mining is smaller than that registered in the services sector (4 p.p. less) and commerce (8 p.p. less). This situation is replicated in each category by size of these sectors, although in different magnitudes, with the difference in the gap for micro enterprises being smaller.
Table A.2.2. | Average balance per women’s business / average balance per men’s business
Data as of December 2022
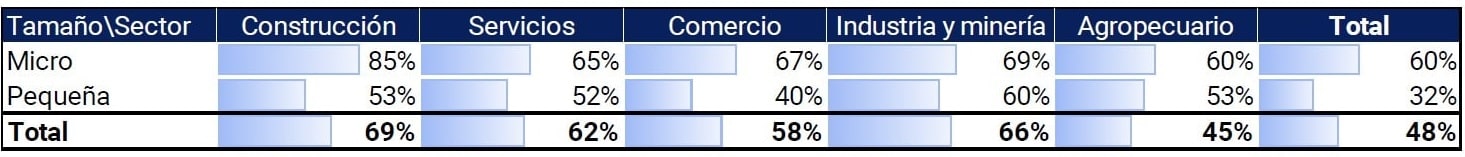
Note | The total line includes medium-sized companies. For more detail, see footnote 100.
Source | BCRA.
The difference in financing balance between men’s and women’s companies could also respond to characteristics of MSMEs-M such as greater risk aversion. Evidence suggests, in general, that women are on average more risk-averse in their relationship with the financial system and that this is replicated in the business sphere103. Greater risk aversion among women would reduce the demand for bank loans for women-led firms, since they opt for lower debt-to-equity ratios and thus use external financing to a lesser degree. Studies show that firms led by women have lower leverage than those of their male peers104.
Although demand-side factors could explain the differences found in terms of average financing, there is room for supply to adapt to the differential characteristics of women’s MSMEs.
Section 3 / Young people and financial inclusion: exploring the evidence of the impact of technology
The financial inclusion of young people contributes to their well-being. It gives them tools to manage their resources independently, allowing them to control their finances according to their needs and life stages (OECD, 2020105). The objective of this section is to explore recent evidence on the financial inclusion of young people, focusing on two financial products, account ownership (bank and payment) and access to credit from both financial institutions (EEFF) and Non-Financial Credit Providers (NFCPs)106.
A first aspect to consider is what is meant by young people. According to the United Nations definition, young people are those between the ages of 15 and 24107. For its part, the Financial Inclusion Reports (FIRs) adopt a broader criterion and consider young people to be between 15 and 29 years of age. In any case, this section divides the adult population into 5-year-old age groups, allowing for a more flexible analysis of their financial inclusion. Young people represent a little more than 30% of the adult population108, which shows their relevance in terms of the demand for financial services109.
Technology plays a fundamental role in this process, given the conjunction of two trends. On the one hand, today’s young generations from an early age have experimented with electronic devices in a playful way. On the other hand, the financial services offering made significant progress facilitating its transactional operations through electronic devices, such as mobile banking and electronic wallets. For this reason, it is the younger age groups who gather the basic skills needed to adopt these services more quickly110.
The regulation, recognizing the benefits of financial inclusion for young people, contemplated the possibility that authorized minors can make use of the services of a savings bank111. In recent years, the integration of new actors in the regulation of the financial system, mainly those providers of technology-based financial services, has made it possible to delve into its impact on financial inclusion112.
Account holding. The number of people with bank and/or payment accounts went from 27.8 million in March 2019 to 35.4 million in December 2022, which represented a growth of 27%. The age group that contributed the most to this increase was 15 to 19 years old, with 6 p.p., while the next age group (20 to 24 years old) did so with almost 4 p.p. On the other hand, the age groups of 25 to 29 years old and 30 to 34 years old did so with contributions close to 3 p.p. each. Likewise, between 2019 and 2022, it was observed that the number of people who have both types of accounts (bank and payment) grew in almost all age groups, although for the first age range (15-19 years old) the three cases coexist in a more or less proportional way. Therefore, this fact could be indicating that in more recent periods the financial inclusion of very young people begins with one or the other account indistinctly.
Figure A.3.1 | Number of individuals based on their account holdings
March 2019 December 2022
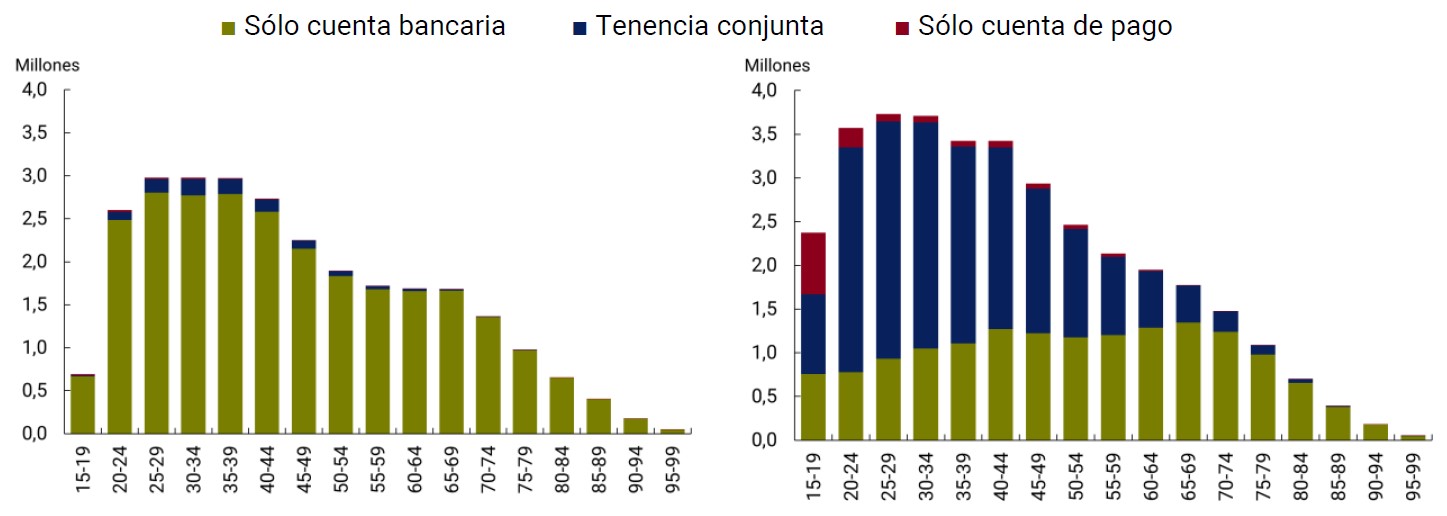
Source | BCRA based on COELSA.
In terms of age distribution within each type of provider, the customer portfolio of EEFF and PSP presents significant differences. In the case of the EEFFs, the distribution of their clients is relatively uniform in the age ranges between 20 and 44 years old and showed some bias towards the age group of young people in their growth between the beginning of 2019 and the end of 2022. For their part, PSPs currently have a more concentrated customer portfolio, especially in the 20 to 34 age ranges. In relative terms, in the case of PSPs, a younger age customer portfolio predominates compared to the case of EEFF (note that for the purpose of facilitating comparisons, the graphs maintain the same minimum and maximum values on the coordinate axis).
Likewise, empirical evidence suggests that the adoption by young people (15 to 24 years old) of PSP services was a later phenomenon in time compared to those between 25 and 39 years old. This point is observed in the change in the composition of payment account users between 2019 and 2022. In 2019, the 25 to 39 age groups outnumbered the 15 to 24 age groups. However, by the end of 2022, the two youngest age groups gained participation in relation to those aged 25 to 39.
Figure A.3.2 | Account distribution by age range
At least one bank account At least one payment account
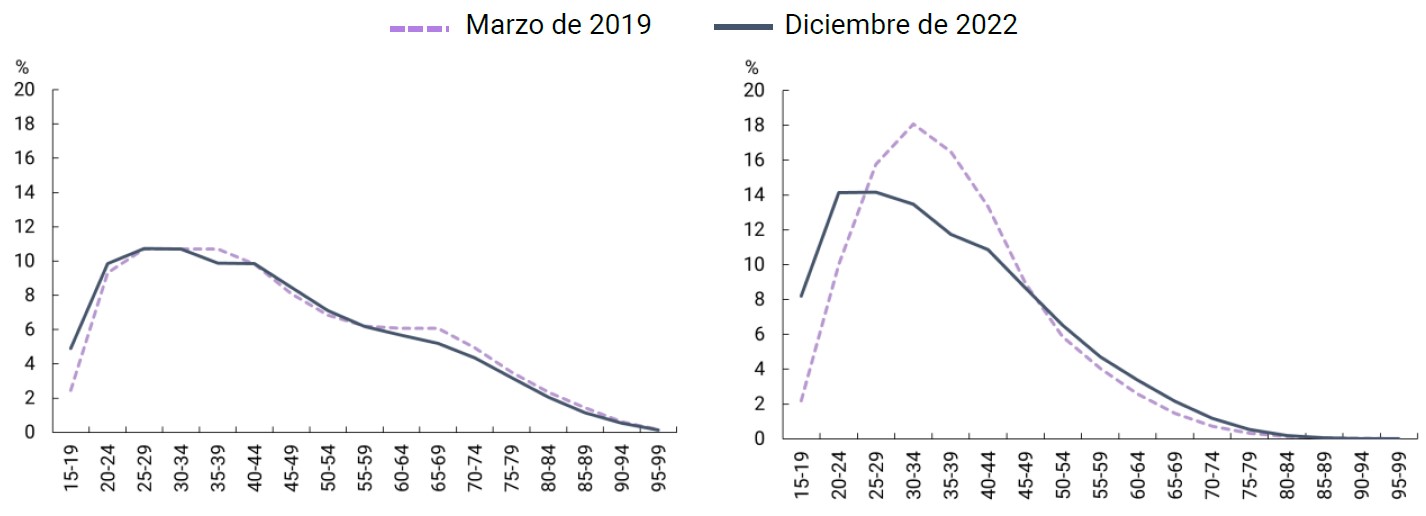
Note | Amount of PH with bank accounts March 2019: 27.7 million and December 2022: 34 million / Amount of PH with payment accounts March 2019: 1.1 million, December 2022: 19.8 million.
Source | BCRA.
Access to financing. The comparison of the distributions of EEFF and PNFC customers between 2019 and 2022 shows that the differences between the user profiles of both groups were accentuated. While at the beginning of 2019 the NFPPs had, in relative terms of the FFS, a portfolio of users more oriented to the age groups active in terms of work113, the FFSPs showed a bias towards the older age groups.
Figure A.3.3 | Age distribution of PH with funding within each institutional group
March 2019 banking December 2022
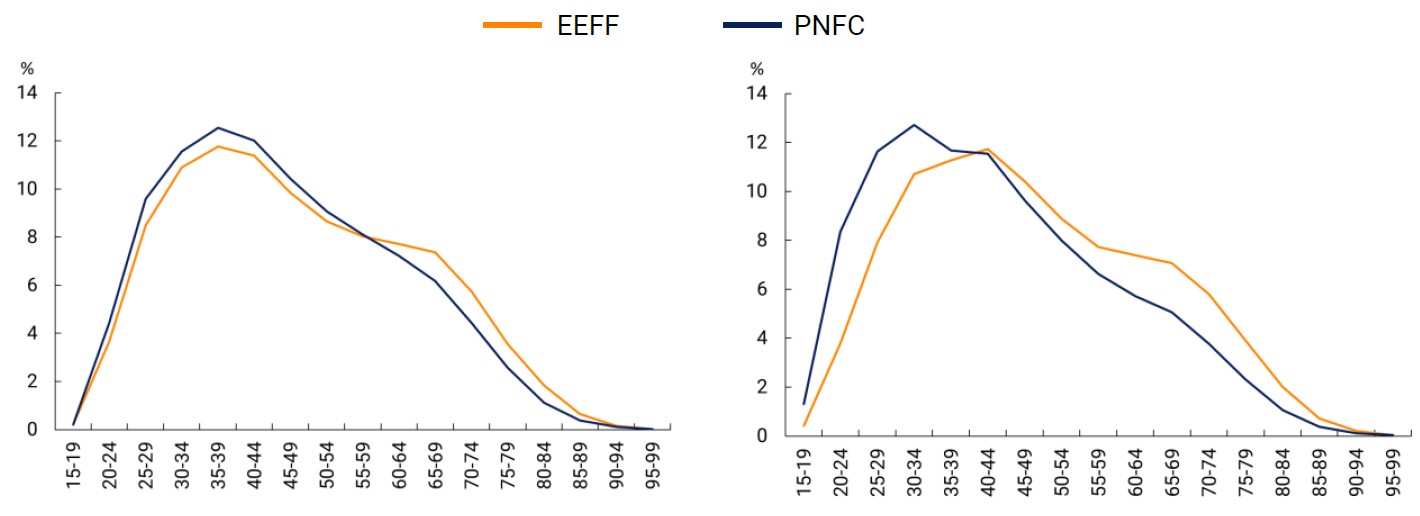
Note | Number of PHs with financing in March 19: EEFF 12.7 million and PNFC 7.8 million. Number of PHs with financing in December 2022: EEFF 13 million and PNFC 9.9 million.
Source | BCRA.
In 2022, the curve representing the distribution of PNFC users showed gains in the participation of younger age groups to the detriment of older age groups. Among the factors that could explain this behavior are technology-based financial service providers (fintechs), in particular, those that offer payment and financing services. Access to a payment account usually functions as a gateway to other financial services114, such as access to investment products, credit, or insurance.
By way of summary, it is highlighted that between 2019 and 2022 there was a deepening in the financial inclusion of young people (15 to 24 years old). In terms of accounts, the available information suggests that the number of young people who open their first account through an EEFF or a PSP is similar. In the case of access to financing, significant changes were observed between EEFF and PNFC. A greater inclusion of young age ranges is noteworthy, mainly explained by the PNFCs (with the exception of the 15 to 19 age range, which includes people under the age required to take out a loan).
Methodological note
Population data
This IIF presents indicators that are disaggregated by different demographic and geographical variables. As of the date of publication of this edition, the final results of the 2022 National Census of Population, Households and Housing (CNPHV) have not been disseminated, so population data based on the 2010 CNPHV were used.
Given that the National Institute of Statistics and Census of the Argentine Republic (INDEC) does not publish a series that simultaneously contains all the disaggregations used throughout this IIF (gender, age group and geographical location at the provincial, departmental and locality levels), it was necessary to take different series according to the definition of each indicator:
– For the indicators at the national and provincial levels, the series entitled “Population by sex and five-year age groups for the country and provinces as a whole. Years 2010-2040”;
– For the departmental indicators, the series “Estimated population on 1 July of each calendar year by sex, by department” was used;
– finally, given that INDEC does not publish a projection of the evolution over time of the number of inhabitants of each locality, it was necessary to construct the series for the indicators at that level, for which the results of the CNPHV of 2010 were used.
Considering that there are differences between the provisional results of the CNPHV 2022 and those of 2010, the indicators developed in this IIF in relation to the adult population should be taken as provisional until updated information from the last census is available.
Finally, for the purposes of this IIF, an “adult” is considered to be a person 15 years of age or older, following the standard used by the World Bank for its financial inclusion indicators.
Regionalization
For the purpose of developing regional indicators, the regionalization criterion proposed by the Ministry of Economy and Public Finance (currently the Ministry of Economy) was used, which establishes five regions, namely:
– NOA (Northwest Argentina): Salta, Jujuy, Tucumán, Catamarca and Santiago del Estero.
– NEA (Northeast Argentina): Formosa, Chaco, Misiones and Corrientes.
– Nuevo Cuyo: Mendoza, San Juan, San Luis and La Rioja.
– Patagonia: La Pampa, Neuquén, Río Negro, Chubut, Santa Cruz and Tierra del Fuego.
– Centro and Buenos Aires: Córdoba, Santa Fe, Entre Ríos, Buenos Aires and the Autonomous City of Buenos Aires.
In this IIF, Nuevo Cuyo is mentioned as Cuyo and Centro and Buenos Aires as Centro.
Analysis of accounts by locality
To analyze the distribution of account and credit tenure of adults throughout the Argentine territory, each person was assigned a locality code according to the name of the locality, the postal code and the province reported in the AFIP Registry. This assignment coded the localities with 8 digits, while a 10-digit code was used for the population database. The 15 communes of CABA make up a single agglomerate, while 6 localities are agglomerated into 2. In this way, in this exercise a total of 3,520 localities are obtained, instead of the 3,538 that are used for the rest of the analyses.
The use of the projection of the adult population by locality as indicated in the Population Data section of this Methodological Note may generate a deviation in the estimation of the levels of account and credit tenure because the population projection by locality was made on the results of the 2010 National Census and the estimated growth rates may register differences with the actual rates.
Payment accounts at payment service providers
Among the Payment Service Providers (PSPs) that operate in COELSA, there are providers that are registered in the BCRA’s Registry of Payment Service Providers (PSP) and other providers that are not registered115. For the purposes of this report, only payment accounts for vendors that are registered as PSPs that offer payment accounts are counted.
MSME Business Credit
The MSME criterion proposed by the Ministry of Industry and Productive Development116 was used, in which an MSME is a micro, small or medium-sized enterprise, whose economic activity in the country is grouped in one of these sectors: services, commercial, industrial, agricultural, construction or mining. The size of the MSME is determined based on the economic activity and the amount of total annual sales (in some particular cases the number of employees or the level of assets is used). When the BCRA regulations so provide, the EEFF report in the Central Bank of Debtors of the Financial System (CENDEU) the field “código_pyme”117, which is composed of 2 digits, one indicating the size and the other the economic sector. Given that there are cases where the same company has different “código_pyme” assigned for the same period, the “código_pyme” corresponding to the credit assistance with the highest balance in each of the periods studied was used. There is a possibility that the first balance is identical to the second, in this case the highest possible “codigo_pyme” is taken.
For the assignment of the province to MSME companies, the tax domicile declared in the AFIP Registry was used.
Balances of savings and investment products of individuals (PH)
The savings and investment balances of the (PH) are classified as follows:
1. Immediate liquidity balances: include: (i) balances in current accounts and savings accounts denominated in local and foreign currency; (ii) balances in payment accounts and (iii) value of the net worth (PN) of the Mutual Funds (CDF) subscribed by PH (estimate).
2. Balances in short- and medium-term products: include: (i) balances in fixed terms in pesos and in foreign currency, (ii) balances of products in UVA and (iii) value of the NP of Mutual Funds that are not Mutual Funds (FCI non-CDF) subscribed by PH (estimate).
To estimate the PN of the DCFs subscribed by PH, the sum of the DCFs subscribed through PSPs, the exclusive DCFs of PHs in EEFF and, for those DCFs that may be constituted by both PH and PJ in EEFF, those corresponding to PH were estimated on the basis of weights. The weights were obtained through the calculation of the share of the PH FCIs in the Total FCIs (PH+PJ). Exclusivity was consulted through a survey of the websites and management regulations of the DCFs.
On the other hand, to estimate the NP of non-DCF CRFs, the difference between the NP value of the CRFs subscribed by PH (using the series called “FCIs opened by PH” published monthly by CAFCI) and the NP value of the DCF subscribed by PH was calculated.
Returns on savings and investment products
The following interest rates were used to calculate the returns:
– Fixed terms in pesos: minimum annual nominal interest rate (APR) defined by the BCRA (Website). The TNA was converted to its equivalent quarterly effective rate.
– Fixed terms in UVA with pre-cancellation option: variation in the value of the UVA 1 day prior to the expiration of the fixed term with respect to the value of the UVA 1 day prior to the constitution of the fixed term. A period of 90 days was taken in which the first day of the reference month corresponds to the date of constitution of the fixed term. To this rate was added the quarterly effective rate equivalent to the APR of 1%.
– DCF: monthly variation in the value of the shares of each DCF. With these values, a weighted average of the shares of all active DCFs was made. In this way, the average monthly yield of the CDF industry was obtained. The quarterly return for each period was estimated as the product of the compound monthly compounding of $1 during the 90 days following its incorporation and, from the value obtained, 1 was subtracted. Mathematically, the quarterly return on a 90-day investment in month “t” is equal to (1+Rt) x (1+Rt+1) x (1+Rt+2) – 1, where Rt is the return between month “t” and month “t+1”.
Use of financial institutions’ electronic channels
In July 2022, the BCRA conducted a voluntary survey of all financial institutions (EEFF), distributed through the associations that bring them together. The survey focused on collecting information on users of the channels: home banking (HB), mobile banking or electronic banking wallet (MB) and both channels (CE). Information was requested for the period between the last quarters of 2019 and 2021.
The survey was structured in three sections for each channel: (a) customer registration, (b) customer access, and (c) customer transactional operations. In the latter case, the metric contemplates the number of PH holders -unique- of any type of bank account in Argentine pesos who used this electronic channel to initiate at least one transactional operation in the quarter. Transactional transactions are those that involve the movement of funds originated by one of the account holders (e.g., paying for a service, sending money, etc.).
Responses were obtained from 16 EFSEs. The final sample was reduced to 10 EEFF (6 private and 4 public banks) for two reasons: (i) lack of some data and (ii) difficulty in disaggregating the metrics requested by different channels. Thus, the information used for the section includes: (1) 10 EEFFs, (2) transactional transactions and (3) the HB and MB channels individually. Finally, the HB and MB usage ratios were constructed from the data on transactional transactions and the number of PH account holders in each EF.
Glossary of abbreviations and acronyms
ACSF Complementary Financial Services Agency
AFI Alliance for Financial Inclusion
AFIP Federal Administration of Public Revenues
ARS Argentine Peso
ATM ATM
BCRA Central Bank of the Argentine Republic
BIS Bank for International Settlements
CABA Autonomous City of Buenos Aires
CAFCI Argentine Chamber of Mutual Funds
CBU Uniform Bank Code
CEDIP Electronic Certificate for Time Deposits and Investments
CENDEU Central Bank of Debtors of the Financial System
CenFIV MSME Electronic Invoices Center
NVC National Securities Commission
COELSA Electronic Clearing House
CPMI Committee on Payments and Market Infrastructures
EEFF Financial Institutions
EF Financial Institution
EMAE Monthly Estimator of Economic Activity
ENACOM National Communications Entity
EPH Permanent Household Survey
ETCNB Non-Bank Credit Card Issuers
FAS Financial Access Survey
CDF Direct Pool Fund
FCD-PH Pool of Money of Human Persons
FCEM Electronic Credit Invoices for MSMEs
FCI Mutual Fund
FCI-PH Common Investment Fund for Individuals
FF Financial Trust
IMF International Monetary Fund
FSB Financial Stability Board
HB Home banking
INBpc Gross national income per capita
INDEC National Institute of Statistics and Censuses
CPI Consumer Price Index
ITU International Telecommunication Union
LFIP Financing Line for Productive Investment
MB Mobile Banking
Billion Millions
MSMEs Micro, Small and Medium Enterprises.
MSME-H Micro, small and medium-sized enterprises owned by men
MSME-M Micro, small and medium-sized enterprises of women
MSMEs PH Micro, small and medium-sized enterprises of individuals
MSMEs PJ Micro, small and medium-sized enterprises of legal entities
MPE Electronic Payment Methods
MPOS Mobile Device at Point of Sale
NEA Northeast Argentina
NOA Northwest Argentina
ON Negotiable obligation
OPNFC Other Non-Financial Credit Providers
PCT Transfer payments
PDA Access Points
FAQ Fixed Term
PH Human Person
GDP Gross Domestic Product
PJ Legal Entity
PN Net Worth
PNFC Non-Financial Credit Providers
POB Population
POS Point of Sale Device
PSP Payment Service Providers
QR Quick Response code
RI-DSF Information Regime for Debtors of the Financial System
SEPyME Secretariat for Small and Medium Enterprises and Entrepreneurs
Shadow Fiend Financial system
SFA Expanded Financial System
SIPA Argentine Integrated Pension System
SISCEN Centralized Information Requirements System
NFPS Non-Financial Private Sector
T Trimester
TAS Self-service terminal
TD Debit Card
ICT Information and Communication Technology
TNA Annual Nominal Rate
UVA Purchasing Value Units
References
1 EMAE, seasonally adjusted variation.
2 INDEC, Quarterly series of global supply and demand. Years 2004-2022.
3 INDEC, Labor Market. Socioeconomic rates and indicators (EPH). First quarter 2017 to fourth quarter of 2022 and Ministry of Labor, Labor Statistics Bulletin, Labor Market.
4 Indec. Wage index.
5 BCRA, Credit Conditions Survey (third and fourth quarters of 2022).
6 INDEC. Internet access. Third quarter of 2022.
7 World Bank. International Telecommunication Union, World Telecommunication/ICT Development Report and database.
8 UTI. ICT prices. The prices of “Fixed-broadband basket (5GB)” and “Data-only mobile-broadband basket (2GB)” for the year 2021 were taken with respect to the gross national income (GNI) per capita (Year 2021, latest available information). While for Bolivia the cost of fixed broadband represented 8.9% of the GNI, in Argentina, 4.8% and in the United States 1%. In the case of mobile broadband, costs fell by 1.4% in Argentina, 1.9% in Colombia and 0.7% in the United States. It should be clarified that the results presented for the year 2021 are maintained in qualitative terms for the years 2019 and 2020. The sample of Latin American countries is made up of Bolivia, Paraguay, Ecuador, Colombia, Peru, Mexico, Uruguay, Brazil and Chile.
13 News. Communication A 7672.
14 According to the Financial Stability Board (FSB), cyber resilience is defined as “The ability of an organization to continue to carry out its mission by anticipating and adapting to cyber threats and other relevant changes in the environment and by resisting, containing, and recovering quickly from cyber incidents” (Cyber Lexicon, FSB, 2018).
15 BCRA, news of 09.03.2023 and Communication A 7724.
16 Financial Access Survey, 2022 Trends and Developments.
17 Communication A 7208 established the requirement for biometric readers for ATMs. Communication A 7254 established incentives for the improvement of the distribution and operability of EEFF ATMs.
18 T.O. of Expansion of financial institutions. Section 11, transitional provisions. Since October 2020, the EEFF must require the prior approval of the BCRA to proceed with the closure of branches.
19 A 2022, Argentina: 88% cell phone ownership and 87% internet use; High-income countries: 95% and 92%, respectively
20 The definition of “Mobile Coverage” can be found in the note in Graph 2.
21 Data from EPH, INDEC and the United Nations International Telecommunication Union.
22 Communication A 7566 limited the operations that financial institutions may delegate to ACSFs to cash deposits and withdrawals; payments and collections; and the payment of social security benefits. This change in delegated operations took effect as of November 2022, which may have affected the number of ACSFs enabled.
23 Communication A 7208 established the requirement for biometric readers for ATMs.
24 Between 2017 and 2021, Argentina registered a 5.5% reduction in its number of branches per 10,000 adults. 77% of high-, upper-middle-income and lower-middle-income countries that report in FAS have a drop in branches, reaching an average reduction of 16% for the same period. For upper-middle-income countries, the reduction occurs in 85% of the group and reaches an average value of -12%.
25 PSPs offer their customers several types of points and different schemes for withdrawing and depositing cash that may involve costs for users. Among the options offered, there is the use of bank and non-bank ATMs, extra-bank collection networks (which share infrastructure with ACSFs) and other affiliated businesses.
26 See Table 2, Financial Inclusion Report, first half of 2022.
27 Two clarifications: (i) Among high-income countries, there is significant variability in the indicator of account tenure in the adult population. While Sweden had around 4.6 accounts per adult in 2021, the same indicator was 0.8 for Italy; (ii) A greater number of financial institutions in the country compared to those existing in high-income countries could be associated with an increase in this indicator above that observed in high-income countries. Taking advantage of different credit conditions or investments in one or another financial institution could induce people to open accounts in more than one financial institution. However, countries such as Spain, France, the United Kingdom or the United States have a higher list of commercial banks than Argentina (see IMF, Financial Access Survey for the year 2021).
28 Value as of March 2020.
29 As mentioned in the Financial Infrastructure section, payment accounts allow cash to be withdrawn and deposited at shops and non-bank withdrawal points, although it is also possible to do so by card at any ATM (bank or non-bank).
30 In the fourth quarter of 2021, the use of the internet and cell phones for people between 18 and 29 years of age reached 95% and 97.2% respectively, for people between 30 and 64 years of age these values were 91.8% and 96.2%. On the other hand, for people over 64 years of age, the use of the internet and cell phones was 59.1% and 74.7%. See Report on Access and Use of Information and Communication Technologies. EPH. Fourth quarter of 2021. INDEC.
31 People can connect to the internet not only through cell phones, but also from their computers, laptops and tablets, so this gap could be greater than 15 p.p.
32 The analysis of the temporal evolution of a complete set of age ranges implies the existence of a certain dependence between the indicators of two sets of contiguous age ranges. For example, individuals who in a particular year belong to an age group (e.g., “n”) in the following years may become part of the next age group (“n+1”), with the older age ranges tending to reflect what happened in the lower age ranges.
33 Table 1 | PDA and connectivity by province. Financial Inclusion Report, first half of 2022 and Graph 3 | PDA coverage and connectivity in localities of less than 10 thousand adults. Financial Inclusion Report, first half of 2021.
34 Fixed Internet accesses by download speed and location, ENACOM.
35 Each of these categories is associated with specific economic and financial development indices, ordered in descending order. Category 1 includes those localities with the best economic and financial indices in the country and category 6 includes the localities with the lowest relative values. Categorisation of localities for financial institutions. See methodological note for more details.
36 See, for example, “Payment aspects of financial inclusion in the fintech era” (BIS and World Bank, 2020)
37 The ratio is calculated as the sum of the current amounts of monthly operations with MPE during the year 2022 over GDP at current prices for that year.
38 The amounts mentioned in the section are expressed at constant prices of January 2019 (INDEC CPI January 2019 = 100).
39 The progress made in data collection in recent months made it possible to incorporate the following operations: (1) intra-PSP transfers: immediate transfers where the payer’s payment account and the receiving payment account are located within the same PSP; (2) Payments with transfers (PCT) intra PSP (within the heading “PCT”): payments that are made between customers of the same PSP with funds available in the payment accounts, initiated via the web or through the reading of a QR code; (3) Direct debits: Businesses can collect their invoices through debit transactions on their customers’ bank accounts; (4) Immediate debit (DEBIN): it is an online transfer mechanism in which the person who collects initiates the process and the person who pays only has to accept it.
40 According to Khiaonarong and Humphrey (2022), the value of cash withdrawals is an approximate indicator of the use of cash as a means of payment.
41 For this exercise, 19 countries were taken that, between 2017 and 2021, reported the average number of operations with MPE per inhabitant (BIS, Payments and financial market infrastructures). In general, all countries exhibited annual growth in the use of PEM, with the exception of 5 countries during the pandemic year (2020). Argentina ranks third in terms of growth in the use of MPE between 2017 and 2021, below Saudi Arabia and India.
42 BIS (2023). Digital payments make gains but cash remains, CPMI Brief No 1.
43 Ibid.
44 They correspond to those reported by Prisma and Fiserv.
45 As a result of the restrictions on mobility during the months of April and May 2020.
46 Debit card payments at POS and all card payments at mPOS.
47 In 2022, the average value of a POS transaction was on average 40% higher than that of mPOS.
48 This value incorporates the transfers within each PSP to the series analyzed in the previous IIFs and, depending on the availability of data, does not include those made within each financial institution, so the total value is underestimated.
49 90.6 p.p. of 122.2%. This number may be underestimated by the lack of disaggregated information on the channels used in transfers from a bank account to a payment account.
50 The addition of new accounts to send a transfer requires relatively strong security measures in order to minimize fraud. ATMs, by complying with these measures, were historically the appropriate channels to initiate a first transfer. More recently, with the application of two-factor authentication (such as tokens) and e-wallets, the use of ATMs could have been replaced by mobile banking (MB) or home banking (HB).
51 2020: 178%, 2021: 123% and 2022: 131%.
52 Population aged 4 years and over, total 31 urban agglomerations. INDEC. Access to and use of information and communication technologies. EPH. Fourth quarter of 2021.
54 PCTs are instant transfers used to make a payment for the acquisition of a good and/or service with the participation of an acceptor. The acceptor offers merchants the tools to charge with this means of payment. PCTs have different commercial rules from the rest of the immediate transfers (Retail Payments Report, BCRA).
55 Interoperable PCTs are carried out between different PSPs/EEFF and include those initiated in interoperable QRs, in POS with card credentials, with random keys and payment button.
56 INDEC, National Survey of Purchasing Centers and Survey of Supermarkets and Wholesale Self-Services.
57 The amounts mentioned throughout the section are expressed at constant prices of January 2019 (Indec CPI January 2019 = 100).
58 Only accounts in pesos are considered.
59 The APR (nominal annual interest rate) went from 37% at the beginning of the year to 75% at the end of the year. See Regulatory Annexes of the Financial Inclusion Report, second half of 2021 and the Financial Inclusion Report, first half of 2022.
60 The yield on fixed-term deposits in pesos is determined by the Quarterly Effective Rate.
61 DCFs can be rescued immediately or within 24 hours, depending on the fund.
62 The amounts mentioned in the section are expressed at constant prices of January 2019 (CPI INDEC January 2019 = 100). The amounts mentioned in the section are expressed at constant prices of January 2019 (IPC INDEC January 2019 = 100).
63 Financial Inclusion Report, first half of 2022.
64 It is assumed that people aged 65 and over receive retirement benefits.
65 People 65 years of age or older.
66 The size of the locality is considered based on its number of inhabitants.
67 According to the Social Security Report (AFIP, 2022), between January and November 2022, the average number of employers reached around 526,000 companies. Of this total, 98% of employers had between 1 and 100 employees. On the other hand, the number of employees working in companies with up to 100 employees represented 41% of the average of just over 8 million employees reported in the Argentine Integrated Pension System (SIPA). Although these numbers refer to a subset of the total number of people employed in the country, due to their magnitude and because they correspond to formal employment, they allow us to visualize the relevance of this set of companies.
68 Various studies have investigated the financing structure that companies choose to finance themselves, depending on whether it is for working capital or fixed assets, the economic sector or size of the company (see, for example, Villar, L. (2020) Financing Structure of Companies in Argentina: Influence of the Size of the Firm and the Sector to which it Belongs, LV Meeting of the AAEP). Among the conclusions of this work (carried out based on a sample of 991 cases for Argentina from the World Bank’s Enterprise Surveys (2017-18) it is pointed out that undistributed profits constitute the main source of financing for companies (including those of large size), while to finance working capital are loans from suppliers and/or advances from customers and, on the other hand, the financing of fixed assets is through EEFF credits.
69 In general terms, the sources of financing are divided into: (i) internal: undistributed profits; and (ii) external: supplier loans, customer advances, bond and equity issuance, debt with EEFF and PNFC.
70 MSMEs that have exclusive financing from non-financial credit providers (PNFCs) are not included. In other words, MSME companies with financing in the SFA are composed of those that have financing exclusively from financial institutions (EEFF) and those that have financing from both EEFF and PNFC.
71 In Argentina, 21% of small companies (5 to 19 employees) and 43% of medium-sized companies (20 to 99) used bank credit to finance working capital, while the indicator rose to 54% in the case of large companies (+100). As for bank credit in general, 35%, 53% and 64% of small, medium and large companies, respectively, used it. Despite these indicators, a striking aspect of the responses is that 47% of small firms stated that they did not need loans, compared to 31% of medium-sized firms and 28% of large firms. Enterprise Surveys, World Bank, 2017 (991 companies surveyed).
72 Latest available data: December 2021, 1,633,341 MSME companies. Secretariat of Small and Medium Enterprises and Entrepreneurs (SEPYME), Argentina.gob.ar. The jumps in the total number of MSMEs in May 2020 and 2022 could be linked, among other reasons, to: (i) the process of assigning new certificates and/or (ii) the timing of MSMEs requesting MSMEs from MSMEs information about their MSME status.
73 The amounts mentioned in the section are expressed at constant prices of January 2019 (INDEC CPI January 2019 = 100).
74 BCRA – NFPS Loans and Deposits. Consider NFPS financing with EEFF.
75 T.O. Financing Line for Productive Investment of MSMEs and Minimum Cash T.O. (Point 1.5.4).
76 Report on banks. December 2022.
77 The lower interest rate on documents compared to current account advances could be due to at least two factors. On the one hand, the average terms operated by document discounts are lower than those of current account advances (61 days vs. 95 days). On the other hand, while in current account advances the policyholder is the MSME itself, in the case of discounted documents it may belong to a larger company, with a better credit rating, thus reducing the risk of uncollectibility and, consequently, its discount is at a lower rate than what could be obtained for a current account advance.
78 Prior to 2020, compensatory interest also had a maximum limit but based on the interest rates that the FI applied to personal loans without collateral. As of February 2020, the interest rate begins to be regulated from a fixed nominal value (see latest versions of the T.O. on Interest Rates in Credit Operations, point 2.1.1).
79 Micro and small companies have a majority participation in PH, which is why it contains financing associated with the personal consumption of entrepreneurs that cannot be distinguished from productive financing. For this reason, “Credit Card” assistance is of significant importance.
80 Taking the average quarterly balances of the years 2020 and 2022, the largest increase in absolute values and at constant prices corresponds to this type of assistance, followed by collateral loans. The growth of both lines occurred in a context where the total average balances in 2022 are lower than those of 2020 and 2021.
81 The PNFCs offer MSMEs mainly personal loans and credit card assistance, while the EEFF have a wider range of credit products. PNFC assistance is characterized by short deadlines and relatively low amounts.
82 PNFCs mainly offer MSMEs personal loans and credit card assistance, while EEFFs have a wider range of credit products. PNFC assistance is characterized by short deadlines and relatively low amounts.
83 Between December 2019 and December 2022, PNFC financing represented between 1.6% and 2.7% of the total balance of financing to MSMEs.
84 See Footnotes 68 and 69.
85 For MSMEs incorporated as PJs, the life span is determined by the beginning of the commercial activity (date of incorporation of the company), while in the case of PHs, it is determined by the date of birth of the person. In the latter case, the analysis is linked to the age of the person and not to the length of time they have been engaged in the commercial activity.
86 Companies with the MSME category must comply with certain administrative formalities, which indicates that the projects have a certain path prior to obtaining financing from the SFA.
87 Villar, L. (2020) points out that undistributed profits are the main source of financing for companies (including large ones), while to finance working capital are supplier loans and/or customer advances and for fixed assets EEFF credits.
88 The survey was sent in mid-2022 and requested information for the period between the last quarter of 2019 and 2021. Responses were received from 16 EEFF (Banco Itaú Argentina, Banco de la Provincia de Buenos Aires, Banco de Corrientes, Banco Santander Río, Banco de Formosa, Banco Patagonia, Industrial and Commercial Bank of China, Banco de la Ciudad de Buenos Aires, Banco de la Nación Argentina, Banco Credicoop, Banco Macro, Banco Industrial, Banco de la Provincia de Córdoba, Banco Hipotecario, Banco Comafi and Banco Galicia). The final sample was reduced to 10 EEFF (6 private and 4 public banks) for two reasons: (i) lack of some data and (ii) difficulty in disaggregating the metrics requested by different channels.
89 For more details of the survey and its methodology, see the Methodological Note.
90 Only 42.3% of the population used the computer in the fourth quarter of 2021 compared to 88.1% who used a cell phone. This difference of 45.8 p.p., somewhat lower in 2019, deepens to the detriment of older people (65 years and older) and those who, aged 18 and over, reached an educational level equal to or less than incomplete secondary school – including people without education (INDEC. Information and communication technologies).
91 Data.ia Intelligence. State of Mobile 2023.
92 The definition of young people used by INDEC (18 to 29 years old) differs slightly from that used by the BCRA: 15 to 29 years old.
93 Small and Medium Enterprises (SMEs) Finance, World Bank.
94 According to the Enterprise Surveys (World Bank, 2017), for those companies whose senior managers were women, about 15% of these companies had bank financing for working capital, compared to 31% of cases of companies led by men. Likewise, in the case of those led by women, 76% of the cases used internal sources of financing to finance the investment compared to 60% of cases of companies led by men.
95 AFI, 2022. Policy catalogue: women-led MSME access to financing and International Finance Corporation, 2014. Woman Owned SMEs: A Business Opportunity for Financial Institutions.
96 Rojo, S.; Benítez, N.; Schteingart, D.; and Laham, S. (March 2022). MSMEs led by women. Network Research Series, document N° 3. Center for Studies for Production XXI, Secretariat of Small and Medium Enterprises and Entrepreneurs, Gender Cabinet – Ministry of Productive Development of the Nation.
97 As of December 2022, 1 million MSMEs with financing were reported, of which 865 thousand were constituted as PHs and, of this last amount, 323 thousand were owned by a woman.
98 The amounts mentioned throughout this section are expressed at constant prices of January 2019 (INDEC CPI January 2019 = 100).
99 Klapper, L. F. and S. Parker. 2010. Gender and the business environment for new firm creation. Bardasi, E., S. Sabarwal and K. Terrell. 2009. How do female entrepreneurs perform? Evidence from three developing regions .
100 For medium-sized enterprises, the low number of firms with financing could compromise the representativeness of the average balance per firm. Consequently, they are not shown in gap analyses by size and economic sector.
101 As of December 2022, the balance of financing for women’s small businesses amounted to 919 thousand current pesos vs. 1.1 million pesos for men’s micro enterprises.
102 Resolution 220/2019 and Resolution 23/2022 and Resolution 121/2023. The size of MSMEs is determined based on economic activity and the amount of total annual sales and, in some particular cases, the number of employed personnel or the level of assets expressed in pesos is used.
103 Breuer, W., M. Riesener and A. J. Salzmann. 2014. Risk Aversion vs. Individualism: What Drives Risk Taking in Household Finance?
104 Faccio M., M. T. Marchica, R. Mura. 2016. CEO gender, corporate risk-taking, and the efficiency of capital allocation.
105 OECD (2020), Advancing the Digital Financial Inclusion of Youth.
106 The study focuses on these two products because they are those where information is available to quantify their access by young people.
107 See United Nations.
108 Population aged 15 years or older.
109 National Census of Population, Households and Housing 2010, INDEC.
110 An analysis of young people’s adoption of digital financial services can be found in OECD (2020), Advancing the Digital Financial Inclusion of Youth.
112 In March 2020, the Information Regime for Payment Service Providers (Com. A 6929) was established, while in October of that year the scope of the regulation of Other Non-Financial Credit Providers was extended, implying, among other aspects, the obligation to register and report their portfolio of debtors, whether the offer of credit is made in person and/or through means electronic or remote.
113 According to labor statistics, while the employment rate was between 75% and 83% for people aged 25 to 59, it drops to 24% for those aged 59 and over and 42% for those aged 18 to 24 (Ministry of Labor, BEL, data for the third quarter of 2022).
114 See, for example, BIS (2020). Payment aspects of financial inclusion in the fintech era.
115 TO Payment Service Providers.
117 Determination of the conditions of MSMEs. Point 1, BCRA.
Share on


