Executive summary
• The coverage of localities with access points to financial services (PDA) continued to grow in 2021 / The localities covered with PDA went from 48.3% in December 2020 to 52.3% in December 2021 (4 p.p.) and the population living in these localities increased 0.4% to reach 92.5% of adults. Localities with vulnerable populations continue to be the greatest challenge.
• The financial system and payment service providers continued with the inclusion of new account holders / In 2021, 1.2 million individuals were added to the ownership of bank and/or payment accounts. This implied that 95.3% of the adult population or 33.3 million people access an account to make payments, send and receive money and channel savings and investments.
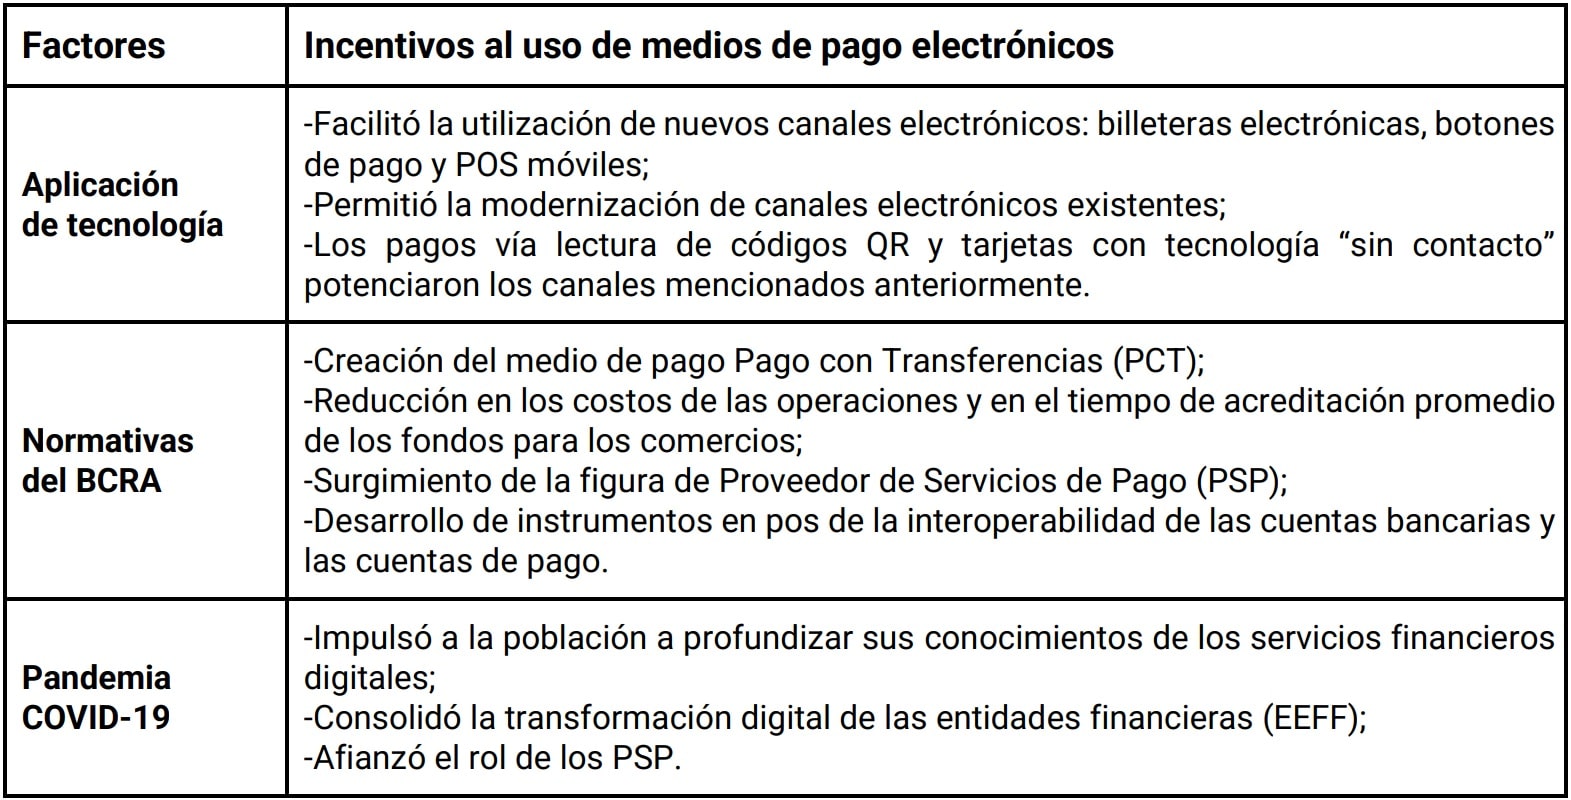
• Electronic means of payment (EPM) gained share as a means of payment chosen by households / Their greater growth, as a result of the combination of the application of technology, regulatory incentives provided by the BCRA and the effects of the pandemic, increased the proportion of the amounts traded by the MPE over the Gross Domestic Product. Likewise, in 2021, each adult carried out an average of 9.2 monthly operations with MPE, with a year-on-year increase rate equivalent to 43%, tripling those registered in each of the last 4 years.
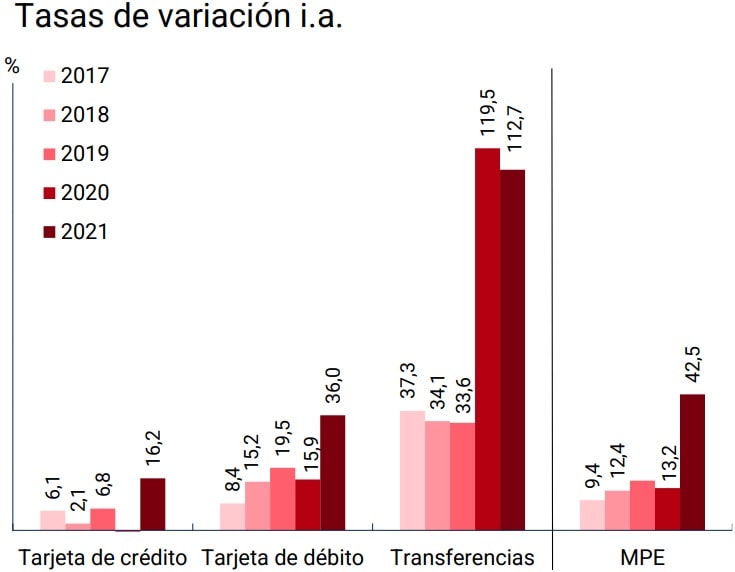
• Transfers continued to lead the growth of the main MPEs / For the fifth consecutive year, the rates of change of electronic transfers exceeded those registered by debit and credit cards. Likewise, electronic wallets and mobile banking continued their consolidation as the chosen means of channeling them. During the last twelve months, 1 in 2 transfers, both bank and non-bank, were made via these devices. Together with debit cards, the performance observed during 2021, with rates that exceeded those reached before 2020, points to the lasting change caused by the COVID-19 pandemic in the habits of use of MPEs.
• The percentage of the adult population with financing began to recover in the second half of 2021 / Financial institutions registered an increase of 0.3 p.p., driven by public banks, which were the ones that promoted the inclusion of individuals with financing during the most critical periods.
• The measures adopted by the BCRA to counteract the impact of the pandemic had a countercyclical effect on financing balances / The set of credit instruments with favorable financial conditions for individuals and MSMEs provided by the Central Bank throughout 2020 and 2021 had a positive result on the dynamics of the balances granted by financial institutions during this period.
• Education, a key investment in taking care of financial health / Since the acquisition of education is an end in itself, financial training is, for its part, a key element in promoting people’s financial inclusion, enabling better living conditions for those who participate in this process and their environment.
Indicator Table | Financial inclusion in Argentina
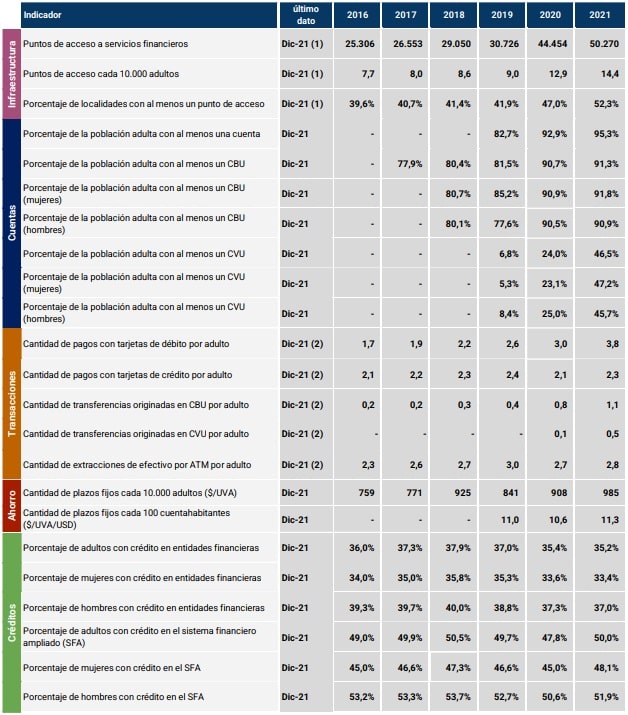
Notes:
(1) This includes access points for financial institutions (branches, mobile branches, ATMs, self-service terminals and complementary financial services agencies) and ATMs operated by non-financial institutions.
(2) Monthly average for each year.
Local context
The economic and health context of the second half of 2021 was conducive to greater financial inclusion. On the one hand, economic activity continued to improve during this period and operated at levels higher than pre-pandemic levels. The Gross Domestic Product (GDP), in its seasonally adjusted measurement, grew 4.6% in the second half of 2021 compared to the first half of the same year1. Along the same lines, private consumption expanded in that period, while the employment rate continued to recover until reaching the highest value since 2003 in the last quarter of 2021. For its part, real wages grew in the second half of 2021 compared to the immediately previous semester2. Likewise, the recovery of economic activity took place in a context of broad coverage of the population with complete vaccination schedules and progressive progress in the application of booster doses.
In this framework, the National Government continued to implement policies aimed at sustainable and inclusive economic growth. In terms of financing to households, the validity of the AHORA 12 program was extended until 31.01.22 3 while the BCRA increased incentives to maintain favorable credit conditions for consumers and merchants4. Both initiatives aimed to facilitate the purchase of durable goods and services, while extending financing terms5 . For its part, at the end of 2021, the BCRA provided that financial institutions (EEFFs) may hold up to a prudent percentage of the total issuance of MSME mutual funds to help promote the productive development of these companies 6.
The Productive Investment Financing Line (LFIP) continued to be the main vehicle for channeling productive credit to MSMEs under favorable financial conditions 7. The Zero-Rate Credits (CT0) for people adhered to the Simplified Regime for Small Taxpayers (RS), a line that was re-launched in August 2021, had a significant impact on credit to the self-employed sector8 . From its implementation until 31.12.21, the accumulated disbursements by the LFIP and TC0 represented 32.6% and 1.4% of the balance of financing to the non-financial private sector (NFPS) as of December 2021, respectively9.
In terms of electronic means of payment used by MSMEs, the BCRA promoted regulatory modifications so that the period for crediting sales made through debit cards was reduced from 2 business days to 1 business day in July 202110 . It should be recalled that in June of last year, the deadline for crediting sales made with credit cards had been reduced to 8 business days for micro, small and individual companies 11.
Last November, the implementation of the Payment by Transfer (PCT) scheme was completed. This payment alternative uses immediate transfers to perfect payments for transactions involving the purchase and sale of goods and services and operates mainly through: (i) bank or virtual wallets by reading QR codes, and (ii) debit and prepaid cards in fixed and mobile POS. From the point of view of commerce, the PCTs have certain benefits designed by the BCRA with respect to other electronic means of payment, given by the immediate crediting of the funds and a commission regulated by the BCRA that does not exceed 8 per thousand. Likewise, PCTs are interoperable since they allow users to use the same wallet (bank or virtual) to pay in stores by reading QR codes from different suppliers and businesses to receive payments from customers with different wallets having a single QR code. In the second half of 2021, card payments per adult grew by 37% in the number of transactions, mainly driven by debit cards.
Technology and connectivity play key roles, mainly in the young population, to facilitate financial inclusion, since they allow the remote opening of accounts, make electronic payments, use electronic channels of financial institutions (home-banking and mobile banking) and electronic wallets. Thus, the development of digital infrastructure is crucial to promote the use of electronic means of payment. In this sense, residential access to mobile internet expanded by around 7% in 2021, reaching just over 31 million accesses. On the other hand, residential fixed internet access grew by about 4% during 2021, reaching around 7.4 million private customers12 . On the other hand, in terms of access to devices, it is estimated that in 2021 the proportion of smartphone users reached 73% of the population13.
However, the increased use of digital environments by financial institutions (EFSPs) and Payment Service Providers (PSPs) meant that users are exposed to greater cyber risks and cyberattacks, fraud and scams resulting from the increase in criminal activity. In this way, with the aim of contributing to the mitigation of fraud, the BCRA reinforced the regulations on guidelines for response and recovery to cyber incidents 14 establishing that the EEFF and PSPs that offer digital wallets must adopt mechanisms to detect suspicious or unusual activities of users aimed at mitigating the risk of fraud. Likewise, users must have the possibility to: (i) give their consent immediately at the time of enrolling a bank or payment account in a digital wallet; and (ii) establish parameters for the use of digital wallet services, such as limits on amounts per period and number of operations15.
1. Financial infrastructure
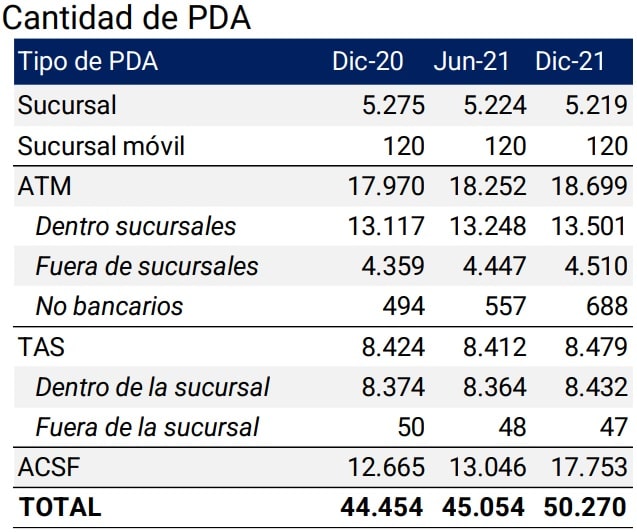
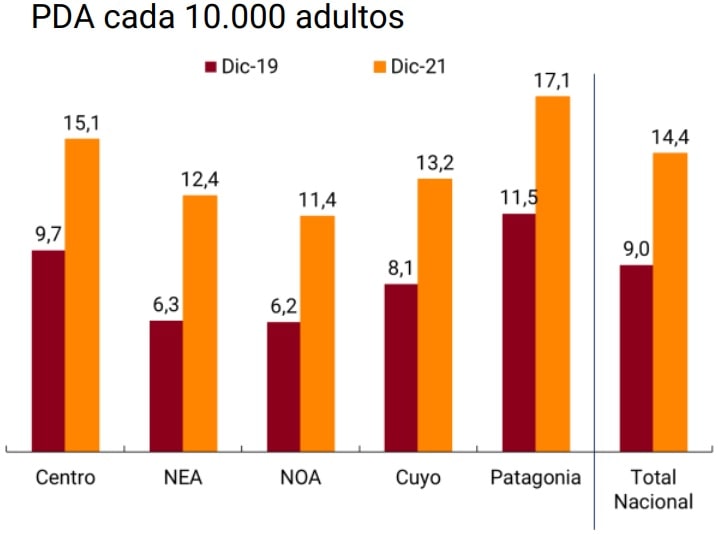
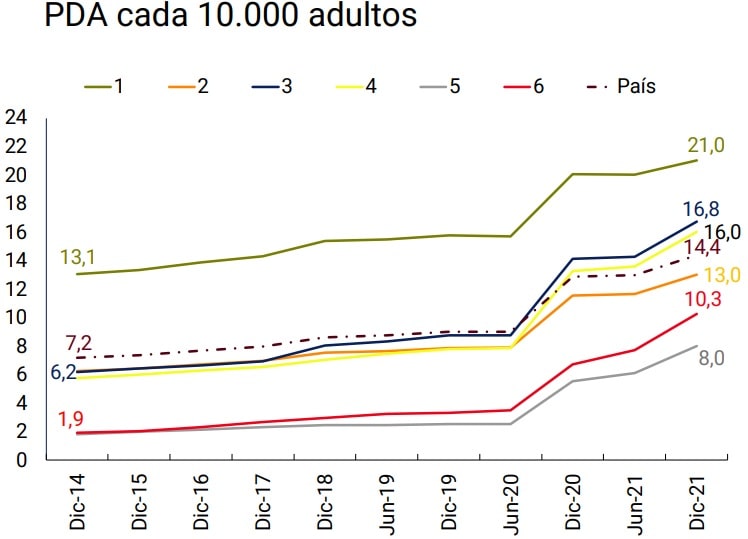
During the second half of 2021, the financial system added 5,216 points of access to financial services (PDAs), which represent a 13.1% increase since December 2020, although not all PDAs assist the population by offering the same quantity and/or quality of services. The number of FLWs per 10,000 adults reached 14.4 units in December 2021, a value that is 11.8% and 60% above the records of December 2020 and 2019, respectively.
Over the past two years, the number of FLW per 10,000 adults experienced positive monthly variations in 79% of the months. Likewise, all regions of the country achieved significant growth in this metric. The challenge continues to be the deployment of ADPs in less developed localities and where vulnerable populations reside.
Graph 1 | Financial Services Access Points
Note | Human Care: Branch and ACSF; electronic devices: ATM and TAS.
Source | BCRA, networks and INDEC.
Geographical coverage continues to improve with 141 new localities with at least one PDA. In this way, the localities with FLW went from 48.3% in December 2020 to 52.3% in December 2021 (4 p.p.) and the population living in covered localities increased 0.4% to reach 92.5% of adults.
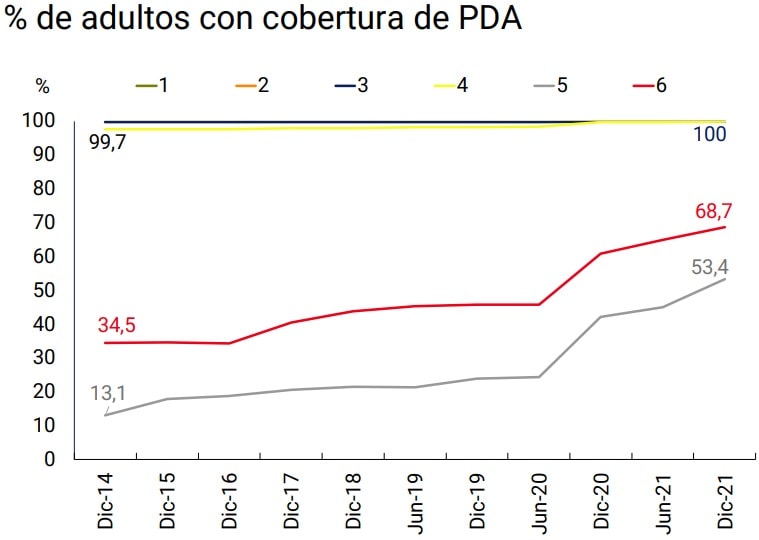
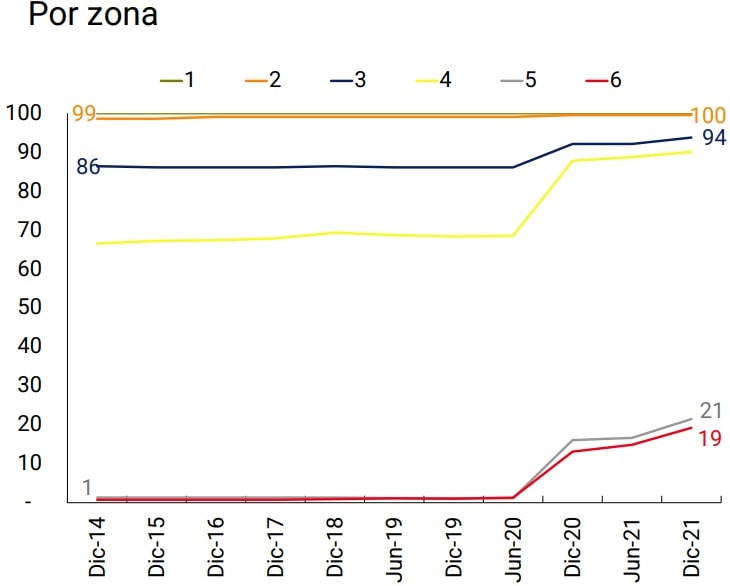
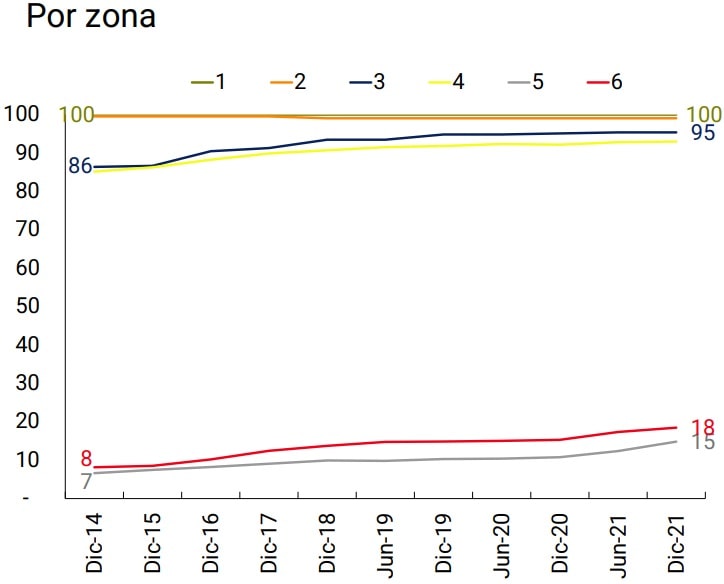
When analyzing the situation of less developed populations, the BCRA’s regulation on the categorization of localities in the country is considered, which assigns them among six possible categories or zones (1, 2, 3, 4, 5 and 6)16 . Each of these categories is associated with specific economic and financial development indices, ordered in descending order. Category 1 includes those localities with the best economic and financial indices in the country and category 6 includes the localities with the lowest relative values. When this classification was developed in 2012, the localities that belonged to categories 5 and 6 did not have any type of FLW. As of December 2021, zones 1 and 2 concentrate 7% of the localities and 75% of the country’s adult population, while, at the opposite extreme, the last two zones comprised 60% of the localities and 4% of the adult population.
If this initial classification of localities is considered, it can be seen that the percentage of the population covered by the financial system in the least developed areas (5 and 6) is at relatively low levels compared to the first four zones, but has shown an upward trend in recent years. Likewise, when comparing the number of FLW per 10,000 adults, these areas perform worse, with the role of public banks pursuing a social and not strictly economic purpose being of vital importance when addressing the territorial deployment of ADP17.
While households traditionally underserved or excluded from financial services moved closer to digital channels, mainly during the COVID-19 pandemic, physical infrastructure is still relevant for the most vulnerable groups. Operations in the digital environment require certain initial conditions, such as digital and financial knowledge and skills, possession of electronic devices, and internet connectivity, which presents barriers to access and use of financial services, especially for less favored populations (such as the elderly).
Graph 2 | Coverage of localities by area
Source | BCRA, networks and INDEC
PDA with human attention. In the second half of 2021, the financial system continued with a slight trend of reduction in the number of branches observed since 202018. As mentioned in the previous Financial Inclusion Report (FIR), globally there is a trend towards a progressive reduction in the number of branches as a result of the growth of digital financial services and a strategy by financial institutions (FFS) to reduce costs19. Despite the drop in the net number of branches, the territorial coverage of this type of PDA showed a slight improvement, with three new localities of less than 10 thousand adult inhabitants each and categorized in zones 4 and 5, which added their first branch during 2021 with a predominant role of public banking20.
Although they offer a limited number of services and the conditions of their provision are far from comparable to those offered by branches, as of December 2021 there was an increase of 5,088 complementary financial services agencies (ACSFs) compared to the same month in 2020, representing a year-on-year variation of 40.2%. However, a very small proportion was located in localities that lacked PDA21. These new points generated an improvement in the coverage indicator that went from 38.6% of the localities with at least one ACSF in December 2020 to 43.7% in the same month of 2021.
As of December 2021, 7.9% of the country’s localities were covered exclusively by ACSF, an aspect that was reflected in the increase in the percentage of the most vulnerable localities with at least one PDA of this type. However, challenges persist as ACSF networks are largely based on pre-existing non-bank collection firms, making it more complex to determine their impact, as the services actually provided by ACSFs often overlap with those provided by collection firms22 . In addition, its role in terms of channeling savings and credit is reduced compared to the other channels of the financial system.
If the categorization of localities is considered, zones 4, 5 and 6 showed progress in the indicator of the percentage of localities covered by at least one PDA with human attention. As with the population, as the categorization of localities decreases, so does their level of coverage of FLW with human care.
Even with the limitations they present, the ACSF allowed zones 5 and 6 to have about 20% of their localities covered. In any case, it should be clarified that only 2% of the ACSF were enabled in localities in less favored areas that the financial system did not reach with the other types of PDAs. On the contrary, 98% of the ACSFs were enabled in localities that had other types of PDAs. However, as noted above, the operations offered by the EEFF through the ACSF are more limited than that of the branches – where the staff is particularly trained to assist in the channeling of savings, investment and credit – and is mainly concentrated on cash withdrawals and the payment of services and loans. so the population of these localities must still move to another locality where there is a branch to carry out other financial operations.
Graph 3 | Percentage of localities covered by PDAs with human care
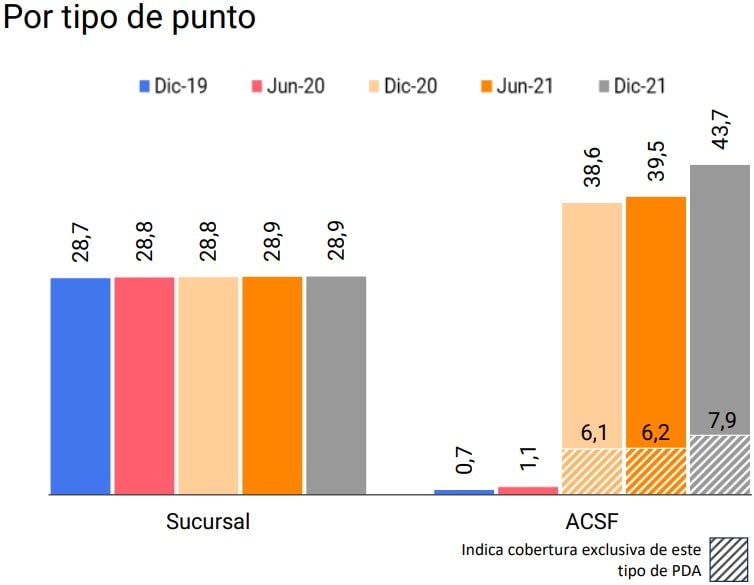
Note | In the graph on the left, exclusive coverage refers to the fact that this percentage of localities do not register any other type of PDA.
Source | BCRA, networks and INDEC.
Self-managed electronic devices. Within the set of electronic devices, ATMs registered an increase during 2021 that almost doubled that of 2020 (4.1% vs 2.1% respectively). With these new devices, the level of locality coverage increased by 1.1 p.p. and reached 43.3% of the national total in December 2021, of which 6.4 p.p. has an ATM as the only PDA. This implies that the inhabitants of these localities can carry out operations such as withdrawing cash, checking balances and making transfers, but they must move to another jurisdiction for other types of transactions that require human attention.
In terms of availability of services at ATMs, there are limitations to be able to carry out all operations on devices that do not belong to the ATM network operated by the EEFF that issued the debit card. It should be remembered that each EEFF is affiliated to an ATM network management company and its customers can carry out a wide range of transactions at any ATM in the adhered network (regardless of which EEFF the device belongs to)23. In recent years, digital financial services have tended towards interoperability, i.e. allowing users to transact outside the network created by their own financial services provider24. However, in the case of ATMs, when a person uses an ATM from another network, the available operations are limited to withdrawing cash and checking balances.
Figure 4 | Percentage of seats covered by electronic devices
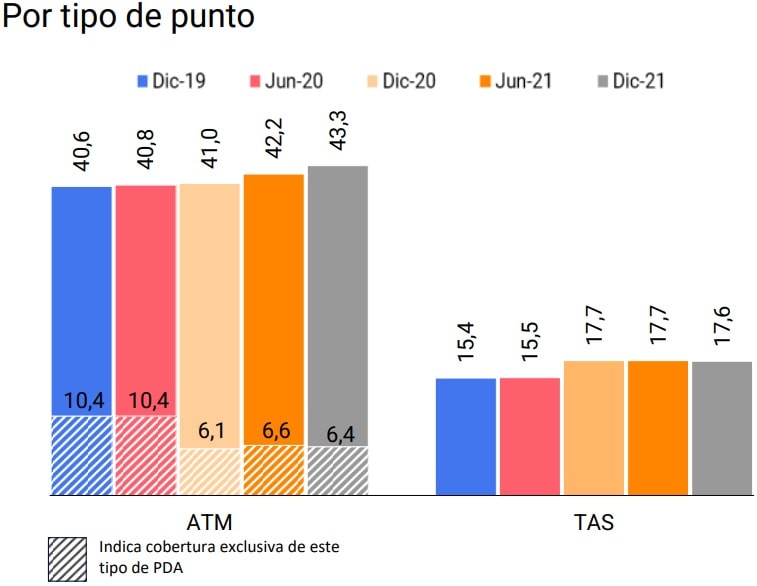
Note | In the graph on the left, exclusive coverage refers to the fact that this percentage of localities do not register any other type of PDA.
Source | BCRA, networks and INDEC.
In this context, the availability of devices in each network at the locality level is analyzed, taking into account that if a jurisdiction is covered by ATMs of a single network, EEFF account holders attached to other networks have a limited supply of services. As of December 2021, only 27% of the 1,533 localities in the country that had ATMs registered the presence of more than one network, while the other 73% had one or more devices attached to the same network25. In this way, the population of this second set of localities is in less favorable conditions, since not all operations are available to all account holders.
With respect to self-service terminals (TAS), during 2021 there was an increase of 0.8% in the total number of enabled devices. Bearing in mind that 99% of these devices are located within branches, their level of coverage of the territory depends on the latter and is lower than for other types of PDAs.
If the characterization of the localities is taken into account, a more progressive evolution of the coverage of electronic devices (both ATM and TAS) is observed in the less developed areas than for the PDAs of human care. This performance is associated with the fact that the ACSFs are supported by pre-existing collection networks, while in the case of ATMs and TAS, the investment of the EEFFs themselves is mostly necessary.
Electronic devices can be located both inside and outside branches. As of December 2021, 72.2% of the ATM fleet (both bank and non-bank) was located inside branches, while 27.8% is located outside them, in places such as supermarkets, service stations and shopping malls. In the case of TAS, the location within banking establishments is almost total (99.4%). This concentration of electronic devices within bank branches means that the population must travel to these establishments to access financial services. At the same time, this situation encourages the use of other electronic channels, such as home-banking, mobile-banking and electronic wallets (banking and non-banking), to carry out operations other than cash withdrawals.
Within the branches, the devices can be located in a lobby whose access is available 24 hours a day or in the customer service room with restricted accessibility to banking hours. On the other hand, devices located outside banking establishments can be in places with no time limit for access (such as those on public roads, hospitals or police stations) or with restricted hours (such as in supermarkets and shopping malls). Taking into account this distinction, as of December 2021, 63.9% of ATMs (located both inside and outside the branches) were available 24 hours a day, while the remaining 36.1% had limited hours. For TAS, 49.5% were available 24 hours a day and 50.5% had limits on their schedule.
Graph 5 | Location and time availability of electronic devices
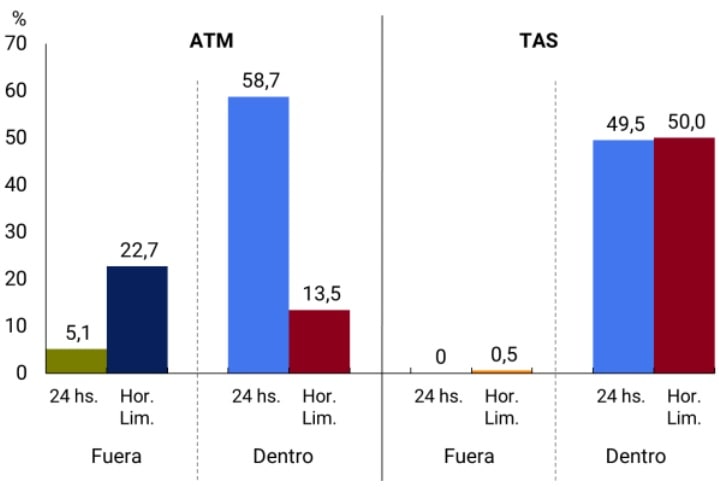
Note | Data as of December 2021. Inside and Outside refers to the location with respect to the branches. As there is no information about the time availability of non-bank ATMs, these devices are considered to have limited hours. The “outside/24-hour” devices are located in hospitals, police stations and public roads, for example.
Source | BCRA and networks.
Operation and geographical distribution of ATMs. As presented in Section 1 of the previous Financial Inclusion Report, the BCRA issued a policy of incentives, via a reduction in minimum cash requirements, to (1) reduce the time that ATMs are out of service and (2) extend the ATM network in areas with worse indicators of relative service and those outside branches27. The main results from the implementation of the regulation in April 2021 to December of the same year are presented below:
(1) More than half of the ATM fleet of the EEFF registered an operating rate equal to or greater than the threshold of 99.5% each of these months. This means that more than 50% of ATMs worked without failures or were out of service due to lack of paper or for not having bills for less than 24 hours in each month. This allows for better use of physical infrastructure and favors access to and use of financial services. In December 2021, these ATMs with high levels of operability were distributed in 918 localities where 85.2% of the adult population lives.
Between April and December, some 92 localities were added (+11%), 42 of them with less than 2,000 adults, which implied a slight increase in the adult population living in these localities of 1.3 p.p. (83.9% vs 85.2%). The expansion of localities with well-functioning ATMs had a notable impact on the incorporation of smaller localities where the relative presence of financial infrastructure is usually lower and therefore the proper functioning of ATMs becomes even more important.
(2) The amounts of cash withdrawals at ATMs located outside the operating houses of the EEFF showed an increase between April and December 2021 that was higher than the amounts of withdrawals in devices within the branches (43% vs 30%). Although there was an increase in ATMs both inside and outside the branches, the variation within the operating houses was higher (2.2% vs. 0.8%). Despite the location of these devices, where almost 8 out of 10 devices are located inside branches, the share of ATM withdrawals outside branches grew slightly in line with the spirit of the regulation.
On the other hand, the amounts of extraction through ATMs showed growth in all areas, with increasing rates of variation depending on the degree of vulnerability. Between April and December 2021, the group of the most disadvantaged areas (4, 5 and 6) registered a 54% increase in their withdrawn amounts while the most developed area (1) did so by 8%. Likewise, the highest growth rate in the number of devices was recorded in the set of less developed areas (zones 4, 5 and 6), while zone 1 obtained the least variation (3.8% vs. 0.7%). This last behaviour is in line with the objective of the regulations to promote a beneficial distribution for the most vulnerable areas.
2. Account Holding
Financial institutions (EFSAs) and payment service providers (PSPs) continued to include new bank and payment account holders in a context where the digitalisation of financial services continued its expansion process. As of December 2021, the set of account holders presented an increase of 1.2 million individuals compared to December 2020. This figure, added to the 3.8 million people who were included during the previous year, meant that 95.3% of the adult population or 33.3 million people accessed an account to make payments, send and receive funds and channel savings. These records show an increase of 3.8% compared to the number of account holders registered in December 2020 and 1.8% compared to June 2021.
Among the notable events of 2021 is the dynamics exhibited by the number of people with joint bank and payment account holding, which almost doubled during the period from 7.6 million people in December 2020 to 14.9 million at the end of 202128. Consequently, joint ownership comprised 42.6% of the adult population, which exposes the importance of having an interoperable financial system in line with the measures implemented by the BCRA, such as the Payment by Transfer scheme (PCT, See Section 3.1). At the end of 2021, the 14.9 million people who owned both types of accounts represented 92% of the population with payment accounts and about 47% of people with bank accounts.
Graph 6 | Holding bank and payment accounts
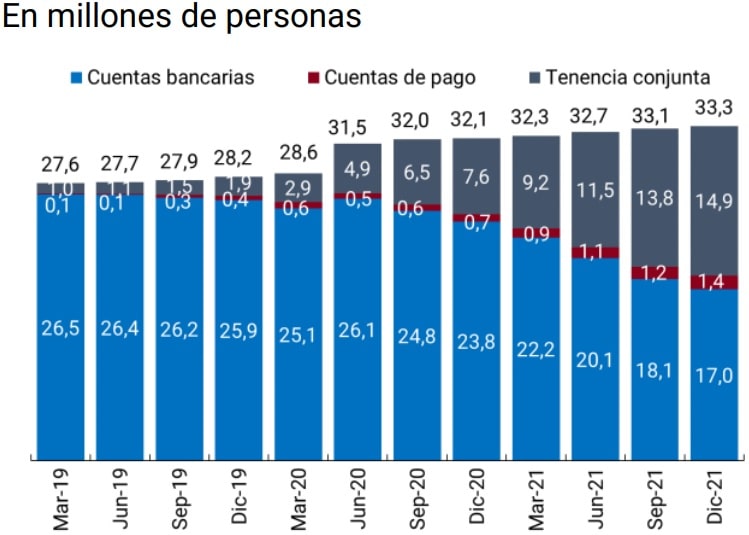
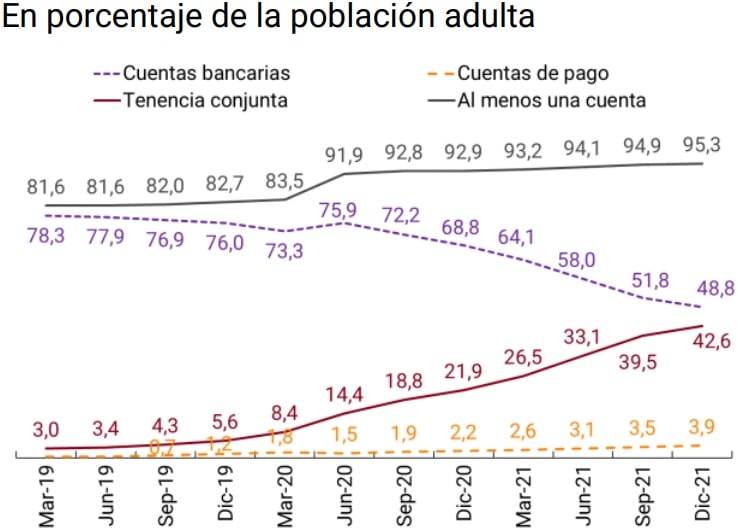
Note | Bank accounts: people who only have this type of account and do not have payment accounts; Payment accounts: people who only have payment accounts; Joint tenancy: people who have bank and payment accounts; At least one account: people who have at least one bank and/or payment account.
Source | COELSA and INDEC.
Gender gaps. Historically, women’s ownership of bank accounts was significant as a result of their high participation in the collection schemes of social assistance programs and retirement and pensions29.
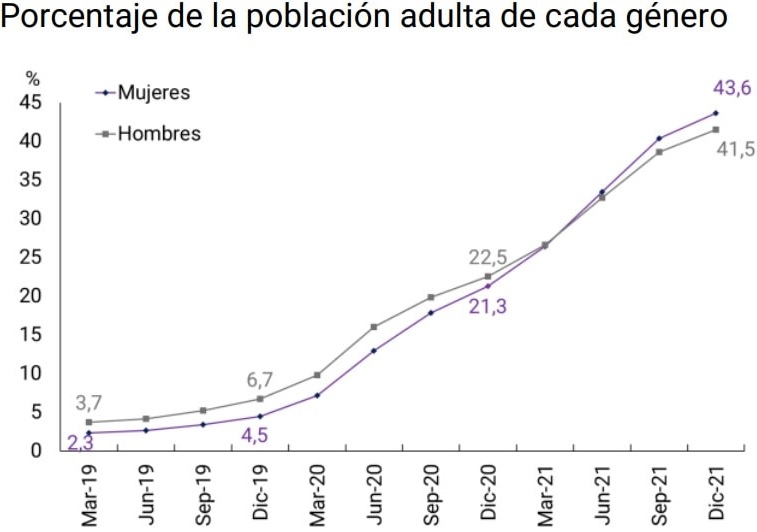
Figure 7 | Joint account holdings disaggregated by gender of the account holder

Source | COELSA and INDEC.
In terms of the holding of payment accounts, the gender gap was in favour of men, a situation that was replicated in the joint holding of both types of accounts. However, as of June 2020, the gender gap in the latter group began to decline until it became negative in June 2021. This phenomenon could respond to the behavior in the labor market that showed a decrease in the gaps in favor of women during the same period, in a context where women’s employment rate levels reached their highest values since at least 200730 . In this way, a little less than half of adult women as of December 2021 have both types of accounts, which means progress in terms of access to the formal comprehensive financial system.
Age group. The age profile of people who have both types of accounts was mostly concentrated in the middle-aged group. As of December 2021, one in two people between the ages of 30 and 64 owned both accounts, while almost all had bank account coverage. Young people continued to have the highest concentration of payment accounts (54.2%), while older adults had the lowest (13.2%). This divergence reflects, in part, that for the former it is more natural to operate in digital environments, while the latter require changes in habits and the incorporation of new knowledge.
However, older adults presented the highest growth in joint tenure in the last 6 quarters. In the fourth quarter of 2021, this age group registered a quarterly growth of 18%, which doubled the increase observed in middle-aged individuals and tripled that recorded by young people. Given that people of this age already had full coverage of bank accounts, the progress in joint ownership is explained by the incorporation of payment accounts that could be due to a process of greater learning in a context of increasing digitalization.
Figure 8 | Joint account tenure by age group
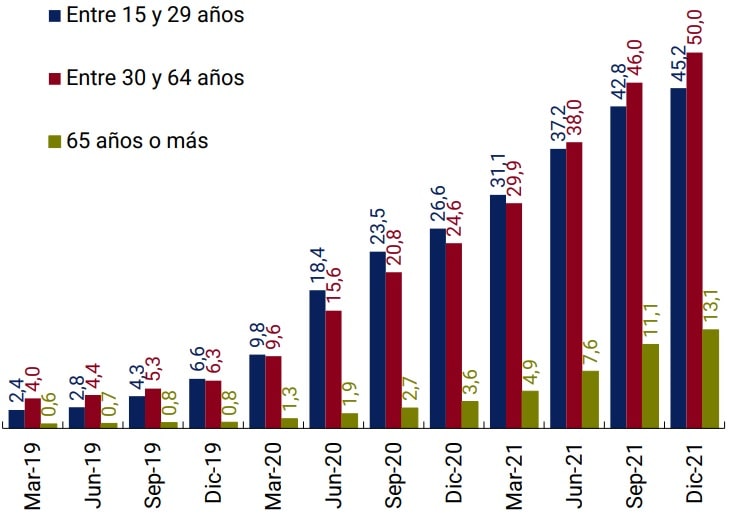
Note | Proportion of the population of each age group.
Source | COELSA and INDEC.
Human persons without an account. The COVID-19 pandemic generated the need to carry out basic transactions remotely, which resulted in the massive opening of bank and payment accounts. In this way, there was a sharp drop in the population without bank and/or payment accounts. In March 2020, the percentage of the adult population that did not have any type of account was 16.5%. This proportion halved over the next three months (to 8.1%) and, at the end of 2021, only 4.7% of the adult population did not have any type of account.
The increasing digitalization of financial services, the actions of the BCRA encouraging their use, and the consequent reduction of cash in household payment transactions (See Section 3.1) lead to a closer examination of this group of people in order to contribute to policies that promote their inclusion in the financial system.
The distinction by sex does not pose a significant difference between people who do not have access to the financial system. As of December 2021, the percentage of adult men without accounts was slightly higher than that of women (4.9% vs. 4.6%).
On the other hand, the COVID-19 pandemic had a strong impact on the percentage of the population without accounts within the five regions. Thus, the Argentine Northeast (NEA) was the region that presented the largest drop in its population without accounts, with a decrease of 60% between March 2020 and December 2021. Centro and NOA reduced the proportion of the population without accounts by half, while Cuyo and Patagonia by 40%. Throughout this period, NOA and NEA were the regions with the highest increase in bank account holding, with 20% and 13%, respectively. This fact is probably related to the opening of bank accounts in the second and third semesters of 2020 as a result of the income transfers provided through the Emergency Family Income (IFE)31.
Figure 9 | Population without a bank account or payment account by region
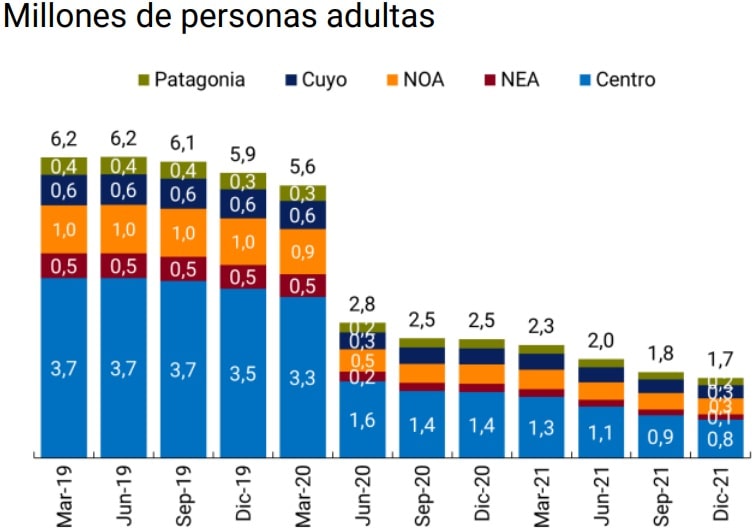
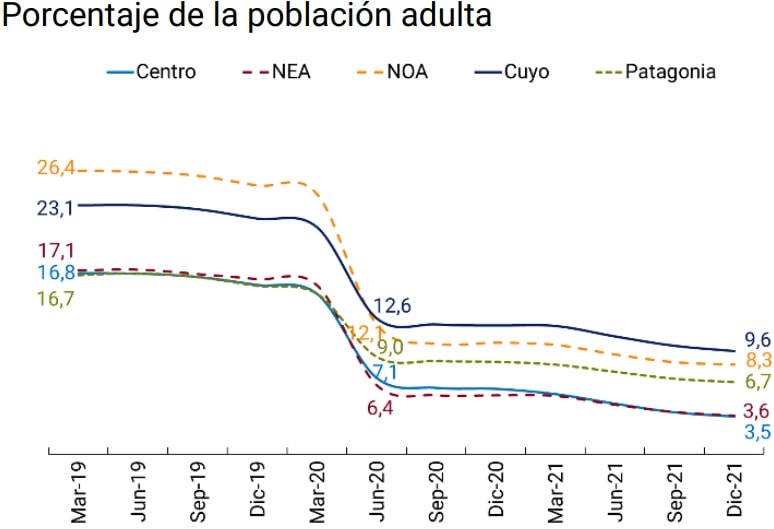
Note | Graph on the left: considers the number of adults by region and total who do not have an account; Graph on the right: percentage of adult population without an account.
Source | COELSA and INDEC.
In December 2021, the Central and NEA regions registered the lowest percentages of adult population without an account (3.5% and 3.6%, respectively). However, the reasons that explain these performances are different: (i) the NEA area registered the highest percentage of adult population with a bank account, driven largely by accounts derived from social assistance programs; (ii) on the other hand, Centro was the region with the highest proportion of adults with a payment account and with joint tenancy.
Another explanatory factor in the fall in the percentage of the population without accounts is the opening of payment accounts throughout 2020 and 2021, given the need to operate remotely. In all regions, the holding of payment accounts increased more than three times between March 2020 and December 2021. Given that in the first quarter of 2020 there was already a high holding of bank accounts, but a low holding of payment accounts, the predominant effect was the opening of payment accounts.
The age profile of the uncounted people indicates that young people constitute the largest group. In December 2021, 19.6% of the population between 15 and 29 years of age still did not have an account in the financial system. This could be explained, in principle, by the composition of the labor market, which shows a lower employment rate for this age group32 . In any case, there was a slight improvement in account ownership compared to last year, with an increase of 4.5 p.p., and a significant growth of 20.3 p.p. compared to the value reached in December 2019. These values would indicate a certain relative autonomy of the labor market, given that although there have been improvements during the last two years, these have not been of the same magnitude33.
Table 1 | Holding accounts in relation to the young population of each age range and region34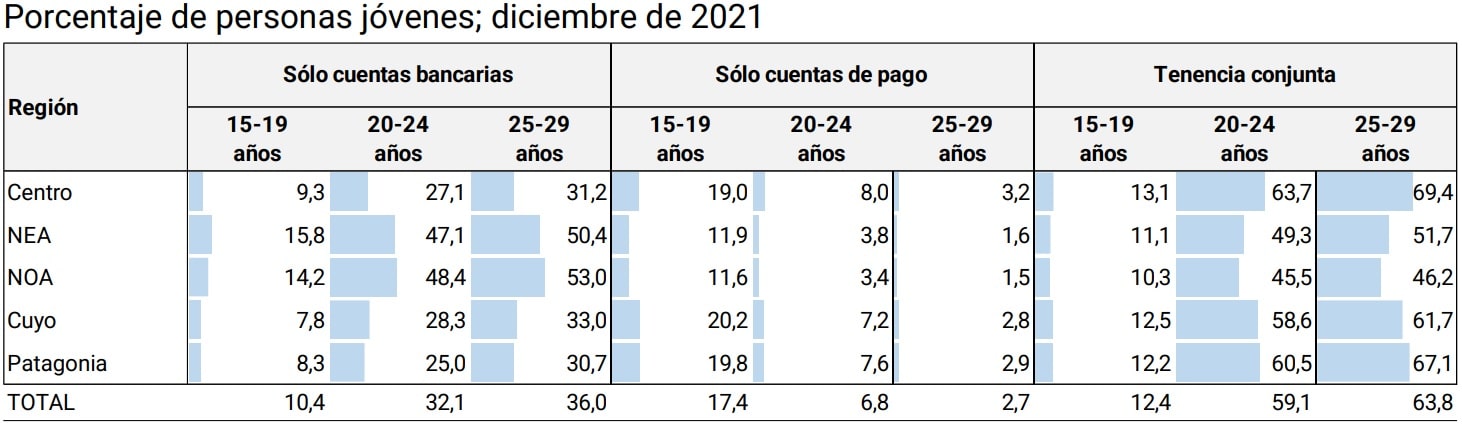
Source | COELSA and INDEC.
Within the segment of the adult population under 30 years of age, a large majority belongs to the population segment between 15 and 19 years of age. As of December 2021, 59.8% of people between 15 and 19 years of age did not have any type of account. This percentage fell to 2% for the population range between 20 and 24 years old, while the range between 25 and 29 years old presented full coverage in almost all regions.
In most regions, a significant percentage of adolescents (15-19 years) were without accounts. These results should be considered with caution, considering that they may reflect that in the early stages of the life cycle people focus on studying and do not actively participate in the labor market as is the case with older age groups. On the other hand, adolescents may not need to participate in the financial system but through the products and services used by their parents.
3. Electronic means of payment and savings and investment modalities
3.1. Electronic means of payment
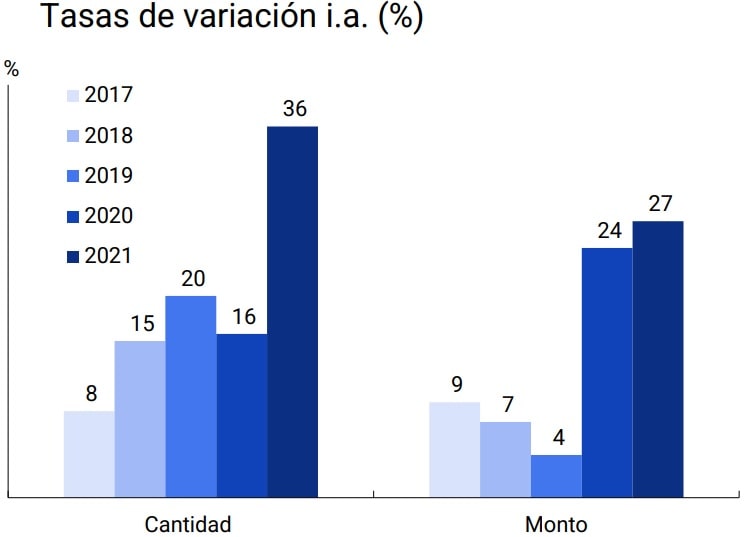
In the last 6 years, individuals have substantially increased the use of electronic means of payment (EPM), whose operations more than doubled in relation to the adult population. For its part, the amount transacted per adult through MPE increased 130% during this period35.
This growth, added to the fall in the total amount of cash withdrawals, implied that the MPEs gained participation as a means of payment. The proportion of the amounts traded from MPE used by households over the Gross Domestic Product (GDP) went from 29% in the first quarter of 2019 to 59% in the last quarter of 2021. This transformation was driven by different factors:
Digital payments play an important role in financial inclusion as they serve as a gateway to other services such as savings, investment, and credit. Based on the analysis of transactional patterns, the EEFF and/or PSPs can offer savings, investment and credit products that meet the needs of their customers36.
In 2021, the use of MPE registered the highest year-on-year rate of change in recent years measured in number of operations per adult (43%). Individually, the three main MPEs, debit cards, credit cards, and transfers, continued to have higher year-on-year (YoY) rates of change than those observed prior to the COVID-19 pandemic, which indicates the lasting change that this event caused in the habits of use of the MPEs.
Figure 10 | Electronic payment transactions per adult
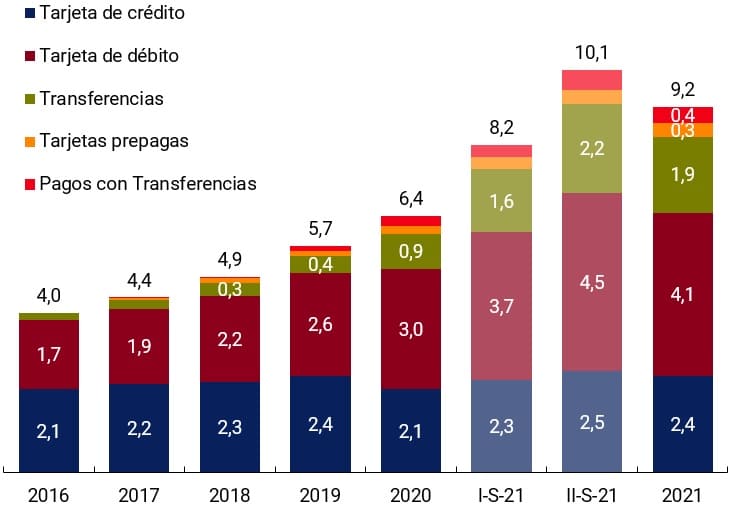
Note | Graph on the left: monthly average of operations within each period.
Source | BCRA and networks.
In this sense, the share of cash payments in supermarket sales fell by 5 p.p. in the last five years (31% in 2021 vs. 36% in 2017) while payments with debit and credit cards increased by the same amount (64% vs. 59%)37. The evolution of sales of wholesale self-service companies follows a similar trajectory38 . For its part, the growth of e-commerce also helps to explain the advance of MPEs. During 2021, almost 90% of sales were made through an MPE, while purchases increased by 20% and turnover grew by 14% in constant terms compared to the previous year39.40.
This behavior is not unrelated to what is happening globally, where the process of digitizing payments has accelerated since the COVID-19 pandemic. Transfers registered higher growth rates in developing economies than in developed countries. In the case of debit card payments, with the exception of Brazil, growth was in orders of magnitude similar to those of developed economies. The massive opening of bank accounts in developing countries for income transfers had a positive impact on the use of MSPs. As an immediate consequence, it caused new people to use the various MEPs for their day-to-day operations. In the case of Argentina, remarkable results are observed in relation to other countries, both developed and developing, as in 2020 it obtained a much higher growth rate in transfers and registered one of the highest rates in debit card payments.
Figure 11 | International comparison of transactions by electronic means of payment
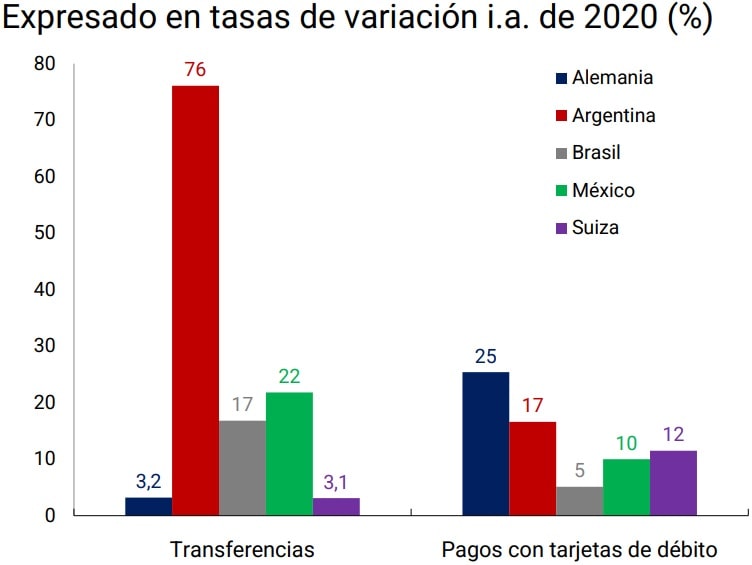
Note | In the term “Transfers”, the BIS includes transfers sent within and outside the territory, made individually and in batches, among other concepts. This definition of transfer is more comprehensive than the one used in the rest of the section. To make the sample comparable, BIS values were taken for Argentina and other countries.
Source | BIS.
Wire transfers. Originating in both bank accounts and payment accounts, in 2021 this means of payment reached the highest year-on-year rate of change of all MPEs in number of transactions per adult (113%) and the second highest in amounts transacted per adult (41%). This translates into almost 2 transfers per month per adult and in an amount transacted that represents 61% of the total operated by MPE.
The share of transfers between bank accounts and payment accounts with respect to the total expanded significantly41: (i) in number of transactions, it represented 32% of total transfers in 2021 against 13% recorded in 2020; (ii) in amount, it reached 18% in 2021 in contrast to 9% in 2020. The BCRA’s regulations, which have as a principle to take advantage of network effects from the interoperability between bank and payment accounts, is one of the factors that explain this result (See Section 2).
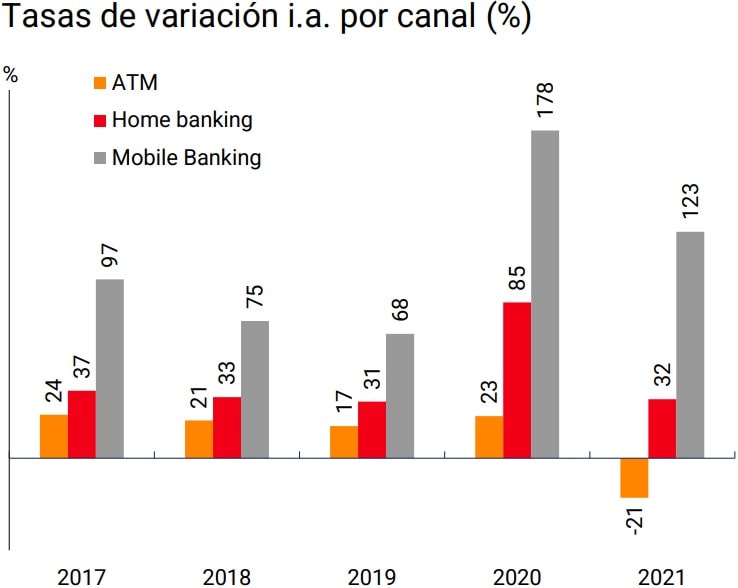
On the other hand, in the set of transfers between bank accounts of different banks, the growth in mobile banking (MB) operations stands out. The considerable penetration of smartphones, which in the last five years is estimated to have increased from 57% to 73% 42, together with the offer of mobile applications by the EEFF focused on improving the user experience, could explain the significant growth rates of the MB channel for making transfers. In 2021, each adult made, on average, 1 in 3 transfers between bank accounts through MB, while twelve months earlier that ratio was equivalent to 1 in 5 and before the pandemic it was 1 in 7.
Figure 12 | Transfers per adult
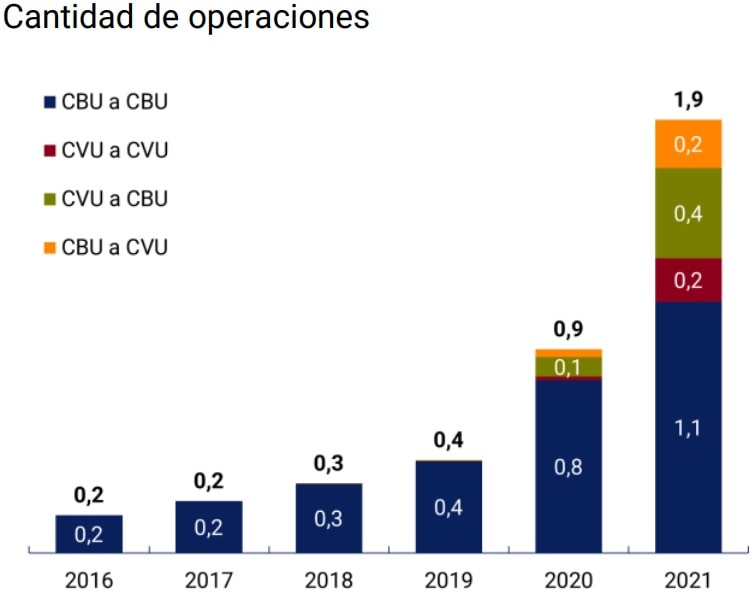
Note | Graph on the left: monthly average of operations within each period. Graph on the right: Considers CBU-to-CBU transfers from different financial institutions.
Source | BCRA and INDEC.
Similarly, transfers between payment accounts reached rates of change i.a. above 4 and 3 digits in the number of transactions and amounts transacted per adult, respectively. These growths are supported by the high availability of smartphones together with the significant ownership of payment accounts by the population. If we consider all transfers initiated through a mobile phone, both bank and non-bank, during the last twelve months 1 in 2 transfers were channeled via these devices while during 2020 almost 1 in 3 were made.
Payments by Transfer (PCT)44. This payment alternative uses immediate transfers to perfect payments for transactions involving the purchase and sale of goods and services and operates mainly through: (i) bank or virtual wallets by reading QR codes, and (ii) debit and prepaid cards at point-of-sale terminals (fixed and mobile POS).
In the first case, given that as of November 2021 the PCTs are interoperable, users can use the same wallet (bank or virtual) to pay in stores by reading QR codes from different suppliers and businesses can receive payments from customers with different wallets having a single QR code. Both types of wallets are associated with a bank account (CBU45) or payment account (CVU46 ) of the holder that allows funds to be transferred from users to merchants immediately and irrevocably.
From the point of view of trade, PCTs have benefits over other MPEs given by the immediate crediting of the funds and by a commission that does not exceed 8 per thousand, while outside this scheme the commission can exceed 6%.
The high proportion of smartphone users, the significant holding of bank and payment accounts among the adult population (which in most cases involve the possession of an electronic wallet) and the high penetration of QR code acquisition at the national level, configures a favorable scenario for the development of this payment alternative.
Cards. Since 2019, the debit card has been the most chosen instrument when it comes to carrying out operations with MPE. The positive dynamics of this instrument are supported by the fact that most of the adult population has at least one debit card (9 out of 10 adults) and the growing availability of digital wallets that allow debit cards to be attached as a means of payment.
In addition, the BCRA provided various regulatory incentives that contributed to the consolidation of this growing trend, in particular: (i) the reduction of the period for crediting payments made with debit cards from 2 to 1 business day47 , and (ii) the reduction of minimum cash requirements based on the use of MPEs associated with demand accounts in pesos of individuals.
During 2021, on average, each adult made 4.1 debit card payments per month, which is equivalent to almost half (45%) of MPE transactions. The a.y. growth rate reached its highest value (36%) since data became available, which more than doubled that obtained in 2020 (16%), affected by the health crisis. In terms of amounts per adult, the y.a. rate of change for 2021 was also a record for its series (27%).
Debit card payments made through QR codes, mPOS and remotely grew above face-to-face payments through POS devices, which is explained by the clear advance of digitalization48. In 2021, payments grouped into QR codes, mPOS and remote channels registered 4 operations for every 10 face-to-face payments, while 12 months ago this ratio was 3 for every 10. Despite this, the face-to-face component of debit card payments represented, in amount and quantity, 72% of the total, while active POS increased from 56% to 60% of the available stock in the last twelve months49.
Figure 13| Number and amount of debit card transactions per adult
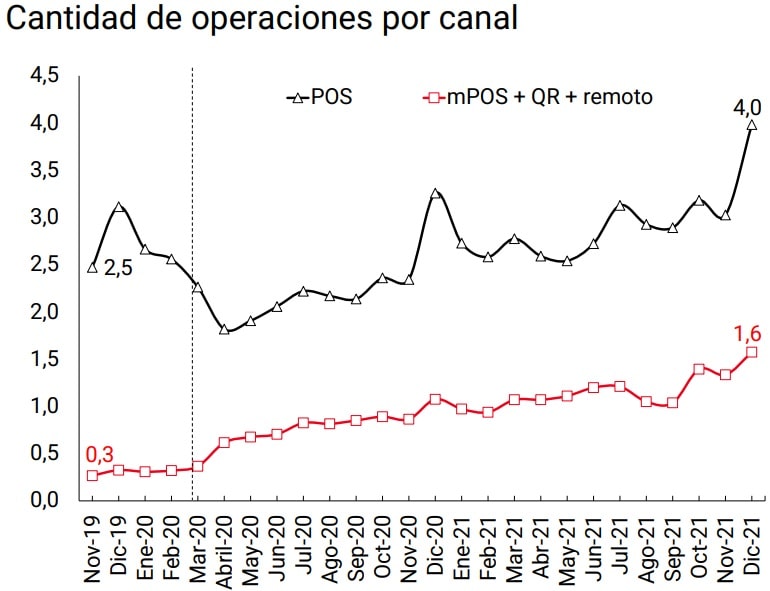
Note | POS: Point of sale device, mPOS: Point of sale mobile device, QR code: Quick response code.
Source | BCRA and INDEC.
For some months in 2021, the number of active POS terminals reached pre-pandemic levels, even in a context of increased digitalization. The increased activity in the POS park could be associated with the gradual regularization of economic activities, which stood at 844,295 units as of December 2021. For their part, mPOS devices continued to rise, with an increase of 38% compared to December 2020, standing at 3,771,648 units at the end of 202150. However, the (partial) substitution effect between remote and face-to-face payments observed in the first months of the pandemic was replaced by a rather complementary trend that is reflected in the simultaneous growth of both.
On the other hand, credit card payments have managed to recover during the last year, both in number of operations and in amounts per adult (16% and 9% y.a. variation, respectively). Given that the number of people with financing through credit cards has remained unchanged in the same period (See Section 4), the increase in the use of this instrument would be explained by existing holders. Likewise, as mentioned in the previous Financial Inclusion Report, the 2021 Zero Rate Credit and AHORA 12 programs collaborated in the recovery of credit card operations51. Likewise, the BCRA ordered the reduction of deadlines for the settlement of credit card sales52. This measure for the benefit of micro and small businesses decreased the term for the settlement of payments made by banks to businesses for sales within the framework of the Credit Card Law53.
The credit card is the only MPE that has behaved differently from the rest. In the period between 2017 and 2020, both the balance of financing per credit card debtor and the amount per adult of payments for this instrument were reduced. As a result of this dynamic and the advance of other MEPs, their share of the total MPEs has decreased for the fifth consecutive year both in terms of quantities and amounts per adult.
Finally, during 2021, payments with prepaid cards again registered double-digit a.y. variation rates, both in amount and amount per adult (68% and 51%, respectively). However, the share of prepaid cards in the number and amount of operations with MPE remained practically unchanged (4% in quantity and 1% in amount).
Likewise, the variation in payments with prepaid cards has not followed the same evolution as observed in the expansion of payment account holders54. This could indicate that it is a payment instrument that has less acceptance than other MEPs that have emerged in recent years and that are channeled via cell phone, such as transfers from a payment account.
Debits in demand accounts of individuals. As presented in Section 1 of the previous Financial Inclusion Report, the BCRA established a policy of incentives to encourage the use of MPEs associated with demand accounts in pesos of individuals (PH) 55. The incentive is applied when the growth rate of debits with respect to the average of the last 12 months, without considering cash withdrawals, exceeds 3%, 4% or 5%56.
From the implementation of the regulation in April 2021 to December of the same year, a monthly average of 19 EEFF increased the aforementioned debits above the limits set forth in the regulations. For these EEFFs, the amounts at constant prices debited grew between a minimum of 4% and a maximum of 12%, with an average of 8% between April and December 2021. The total amount of debits from these LFES represented 92% of the debits in private sector savings banks in December 2021, a proportion that increased by 7 p.p. since April 202157.
The positive results under this incentive policy contributed to the favorable dynamics of electronic means of payment managed by financial institutions during the last year. Although other factors beyond the norm had an impact, the evolution of payments with debit and credit cards and transfers between bank accounts shows higher year-on-year rates than those observed prior to the pandemic.
3.2. Savings and investment modalities
In the previous Financial Inclusion Report, three of the main forms of savings and investment of individuals were analyzed: balances in deposit accounts, fixed terms, and mutual funds. On this occasion, payment accounts are included in the analysis of the allocation of resources between liquid account balance (passive savings) and savings products that require action by PHs, transferring account balances to other financial products (active savings).
Active savings involve the choice of a specific savings/investment product with the aim of obtaining a higher return, while passive savings is associated with leaving balances deposited in a deposit and/or payment account. The passive and active savings modalities are channeled by the population through different instruments of financial institutions (EEFF) and Payment Service Providers (PSPs).
In this way, individuals have the possibility of allocating their money between different savings and investment products offered by EEFF and PSP, depending on their liquidity, term and risk-return ratio objectives. The interoperability between bank accounts and payment accounts favors savings and investment mechanisms in each scheme given the possibility of making immediate transfers between the different types of accounts. As mentioned in Section 3.1, most individuals who hold a payment account also own bank accounts.
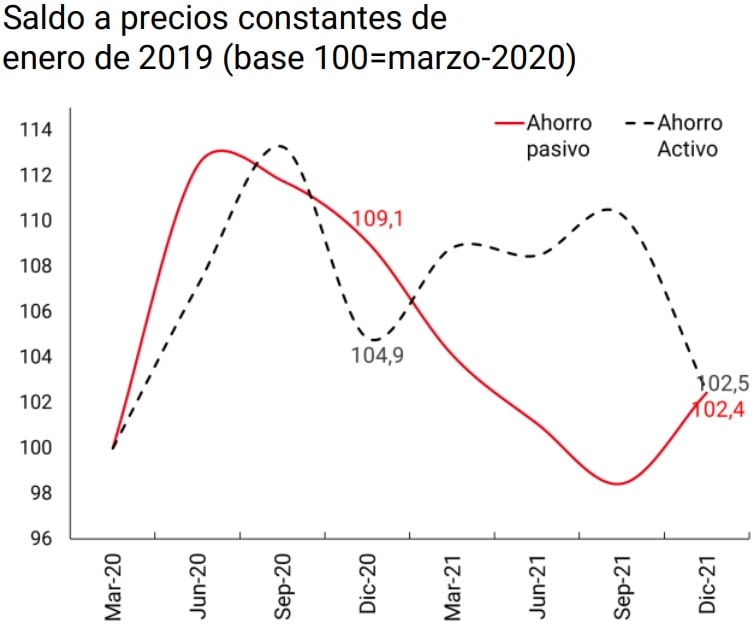
First, there is a tendency for individuals to allocate slightly more resources to maintaining liquid balances in their deposit and payment accounts, than to establishing savings/investment products such as fixed-term loans (FPs) and mutual funds (FCIs)58. After the onset of the COVID-19 pandemic, the balance in active savings products at constant prices was always above that initial value and in most months its growth was higher than that recorded by liquid balances.
Figure 14 | Balances of individuals in different savings and investment products
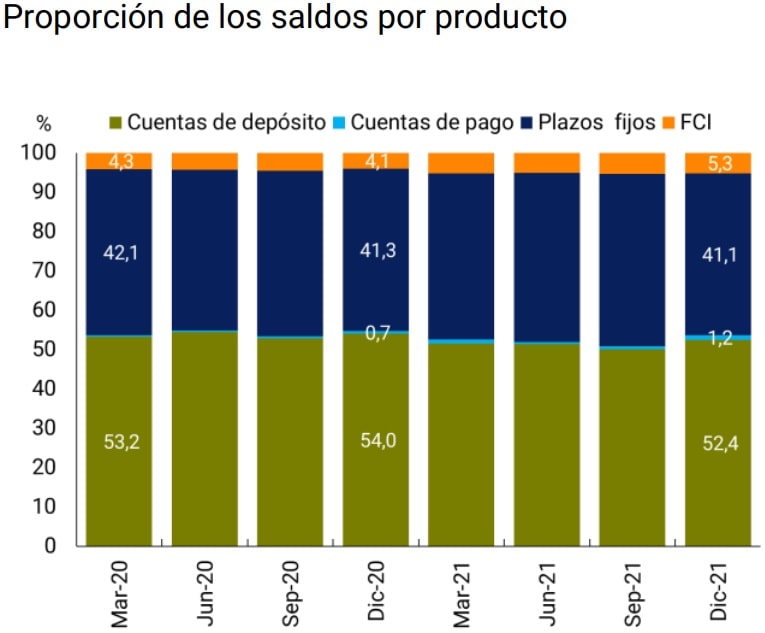
Note | It considers denominated placements in both domestic and foreign currency. FCI: see Footnote No. 58; Payment accounts: balance of accounts in PSPs registered with the BCRA / Fixed terms: capital balances at the end of the month corresponding to PH; Deposit accounts: monthly average of daily savings bank balances in the last month of the quarter corresponding to PH. / Passive savings = deposit accounts + payment accounts; Active savings = FCI + fixed terms.
Source | BCRA and CAFCI.
In particular, in addition to the alternatives that the EFSAs already had available to actively channel their savings (PFs and mutual funds (DCFs), payment account holders can apply balances, in whole or in part, to DCFs in the event that the PSP offers this investment product59. DCFs, which are part of the FCI pool, are characterized by their immediate liquidity and low volatility. These funds invest in very short-term assets within the financial system60 . Since the minimum subscription amount is very low, small investors can access this instrument.
Figure 15 | FCI, CDF through PSPs and fixed terms of individuals
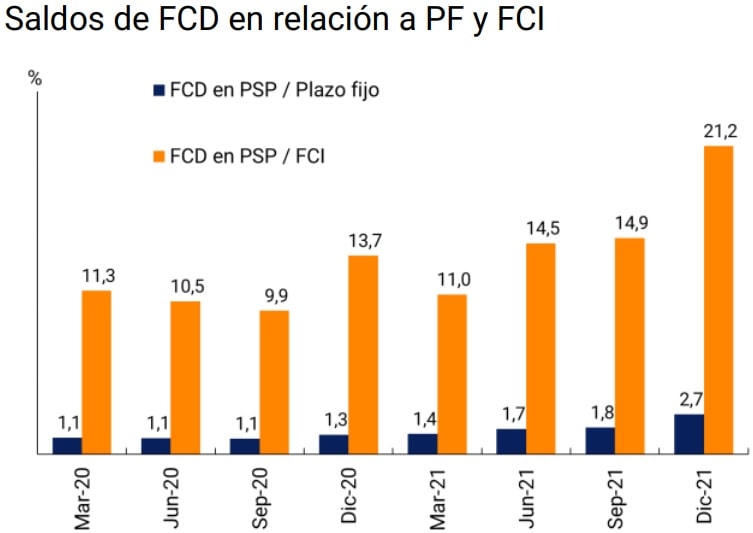
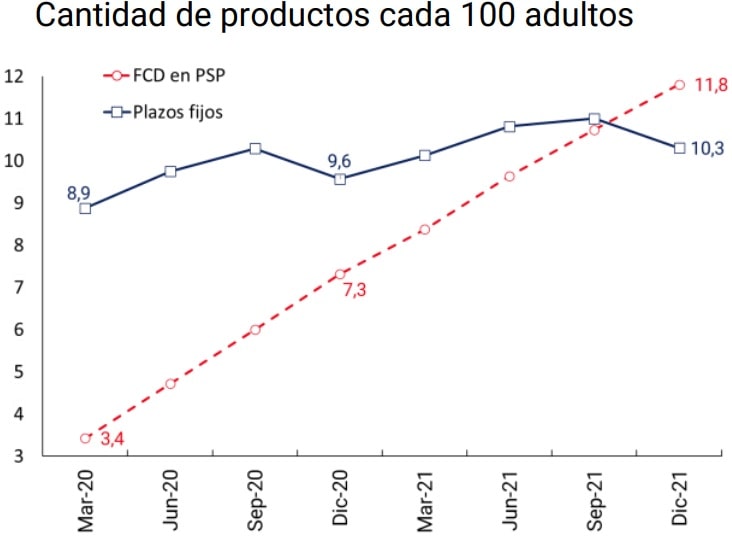
Note | CDF on PSP: payment accounts with investments in DCF.
Sources | BCRA and COELSA.
In December 2021, the balance invested in CDFs through PSPs by individuals reached 21.2% of the balance invested in FCI and 2.7% of fixed terms by individuals. Likewise, the number of payment accounts that make investments in CDFs more than tripled after the start of the COVID-19 pandemic. While fixed-term loans provided by the EFFS continue to dominate preferences in terms of savings allocation, PSP-based DCFs achieved significant adoption rates relative to the adult population.
When comparing the average balances of the aforementioned savings products, a significant difference is observed between the two values, which exposes the nature of the use of each type of product. DCFs would be linked to the use of transactional funds in a very short period of time, while fixed-term would be associated with longer-term objectives and larger amounts. In this way, the average fixed-term balance per product ranged between 34 and 60 times the average balance of CDF. On the other hand, the yield on fixed-term loans has exceeded that obtained through DCF over the last two years61.
The investment tools provided by payment accounts complement those offered by the EEFFs. In general, the DCFs offered by payment accounts are subscribed and redeemed in a simpler way and, in some cases, allow the funds to be used at any time. This provides a wider range of operations for exclusive users of payment accounts, since those who had bank accounts already had such a possibility.
4. Credit to individuals
To face the economic impact of the COVID-19 pandemic, the BCRA provided, throughout 2020 and 2021, a set of credit instruments with favorable financial conditions for individuals and MSMEs. These measures had a clear countercyclical effect during that period with respect to the financing balances granted by financial institutions (EFSAs) to individuals62. However, when the number of individuals with EEFF financing is analyzed, a reduction in number stands out, a variable that only reverses its trend towards the end of 2021.
Figure 16 | Financing of EEFF to individuals and gross domestic product (GDP)
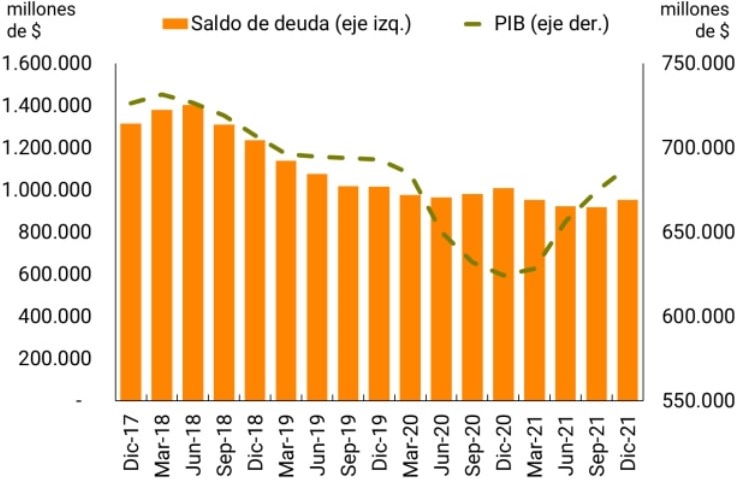
Note | Debt balance at constant values of January 2019 and moving average GDP of the last 4 quarters seasonally adjusted at constant values of 2004.
Source | BCRA and INDEC.
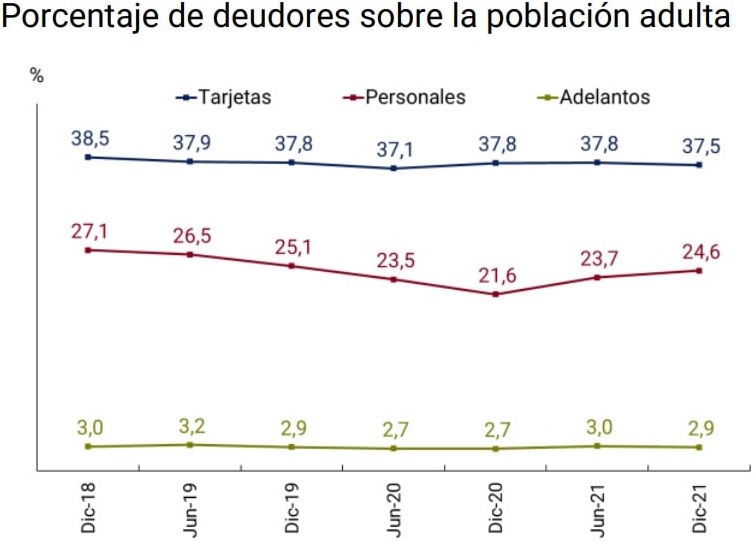
On the other hand, when expanding the analysis to the expanded financial system (SFA63 ), an increase in the number of individuals with financing during 2021 is also highlighted. In the second half of 2021, the percentage of the adult population with SFA financing registered an increase of 0.6 p.p., with an increase of 0.3 p.p. for the EEFF and 2 p.p. for non-financial credit providers (PNFCs).
The incorporation of new people into the EFFS would be associated with the improvement in activity and employment indicators, while for the PNFCs this increase was mainly driven by a regulatory change that provided for the mandatory registration of the PNFCs with the BCRA and the consequent obligation to report the financing granted to the Central Bank of Debtors of the Financial System (CENDEU)64. Throughout 2021, these reporters contributed a significant number of new individuals with funding to the different institutional groups, almost 1.6 million to the PNFCs and approximately 900 thousand to the SFA.
Figure 17 | Percentage of individuals with financing over the adult population
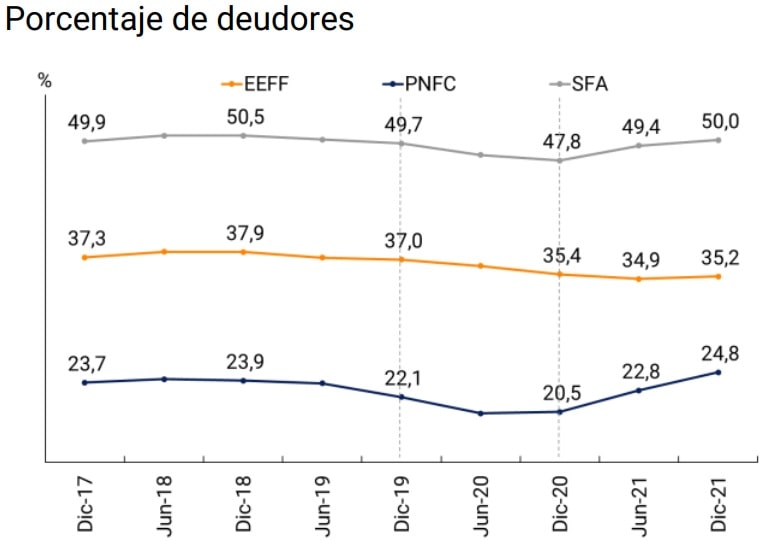
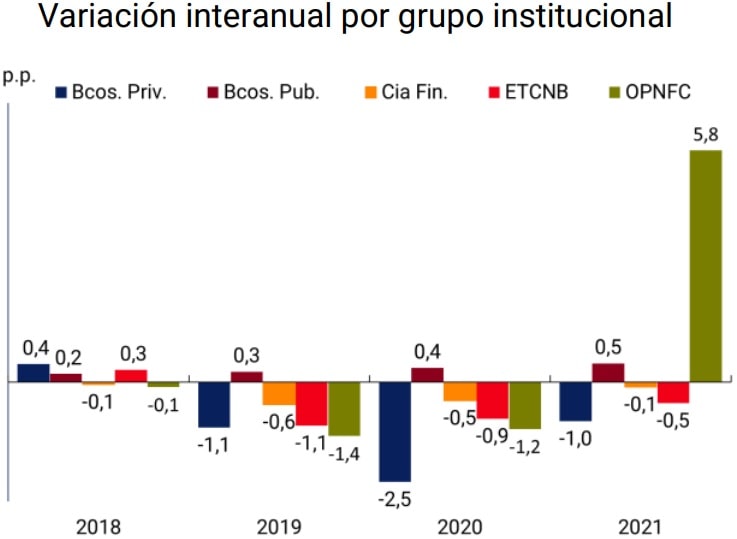
Note | The month of December is considered for the calculation of the year-on-year variation by institutional group. ETCNB: Non-bank credit card issuers. OPNFC: other non-financial credit providers.
Source | BCRA and INDEC.
Credit providers. As initially noted, the COVID-19 pandemic affected the number of individuals with funding. The impact exhibited some persistence over time, with reductions in the number of individuals with EEFF funding from March 2020 to June 2021. However, this period exhibited certain particularities on the side of the EEFFs, since it was the public banks that drove the greater inclusion of individuals with financing during the most critical periods. For their part, private banks and financial companies recorded a reduction in the number of people assisted.
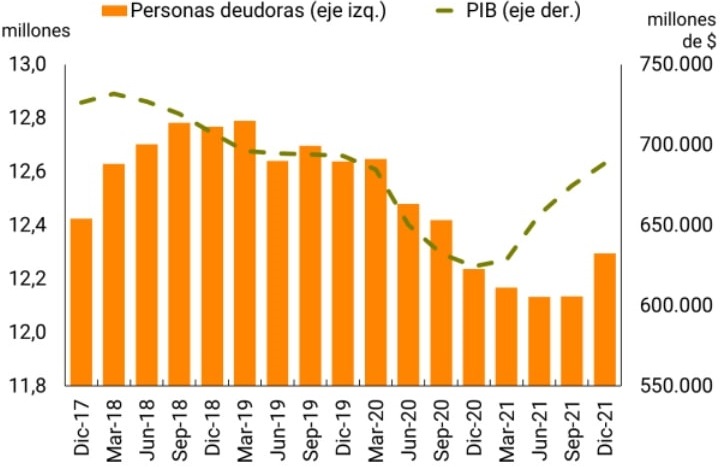
Figure 18 | Evolution of the number of individuals with debt and GDP

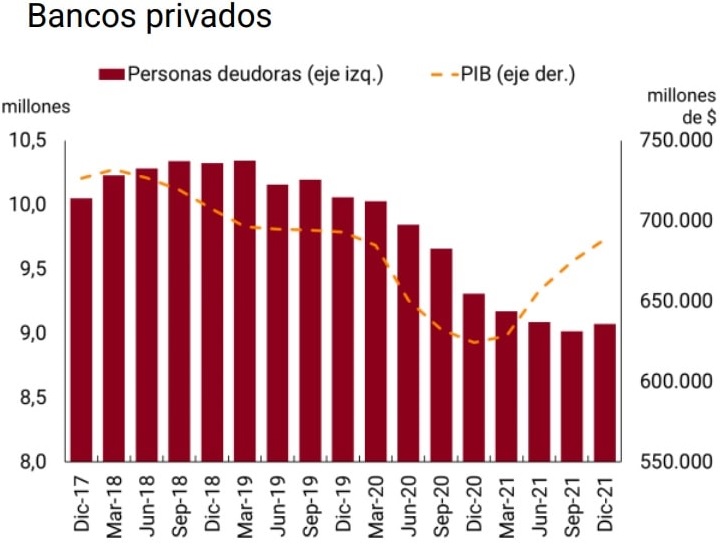
Note | Moving average GDP of the last 4 quarters seasonally adjusted to constant values of 2004.
Source | BCRA and INDEC.
In terms of the adult population, public banks increased their number of debtors from 11.5% in December 2020 to 11.9% in December 2021. This behavior stood out compared to the other institutional groups since it consolidated a slow but sustained trend towards the incorporation of individuals with financing. Likewise, the gap between the number of debtors in relation to the adult population of public and private banks continues to decrease, with the former increasing financing to individuals and the latter decreasing it (with a reduction of 1 p.p. during 2021 in the percentage of the adult population with financing). This opposite behavior between the two groups deepened during the COVID-19 pandemic, a period in which countercyclical policies through credit to individuals (Zero Rate and MSME Lines65 ) may have found a more active channel in public banks than in private ones, reinforcing the social function of public banks.
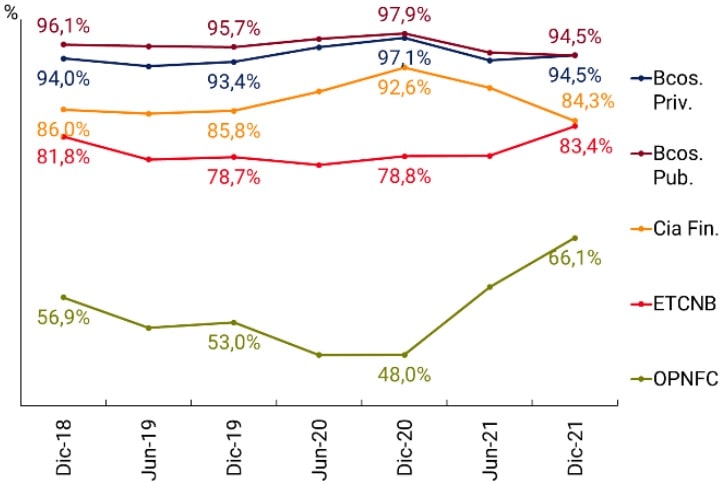
On the other hand, in terms of absolute amounts of debtors, as of December 2021, private banks concentrated most of the individuals with financing: (i) 65.5% of bank debtors had financing exclusively from private banks; (ii) 24.9% obtained it only from public banks, and (iii) only 9.7% registered credit from both groups simultaneously. In this regard, two issues must be considered: (i) the number of respondents to CENDEU: 13 public banks and 42 private banks, and (ii) territorial coverage and target population: most public banks tend to concentrate their actions mainly in specific jurisdictions (whether provincial or municipal banks), while private banks operate mostly at the national level. These two factors contribute to lower penetration of public banks and explain, at least partially, the proportion of debtors that obtain financing only from private banks. However, when observing the evolution of the series, the progressive increase in the proportion of individuals who obtain financing only from public banks was highlighted.
Figure 19 | Sources of funding
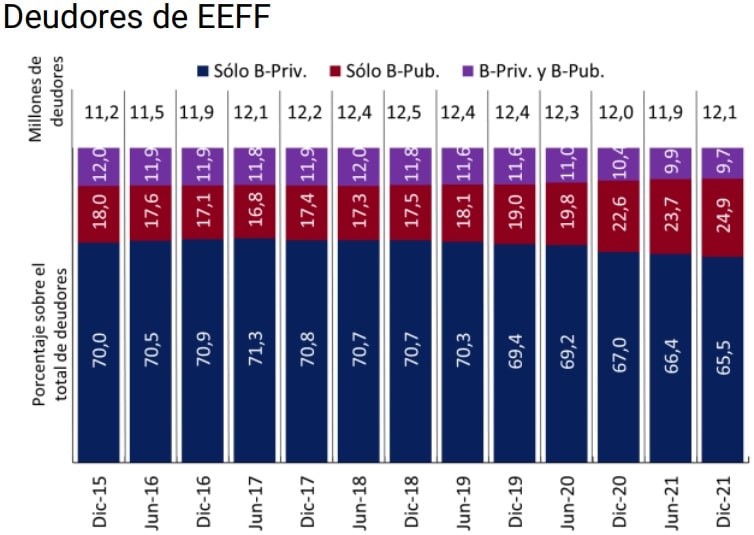
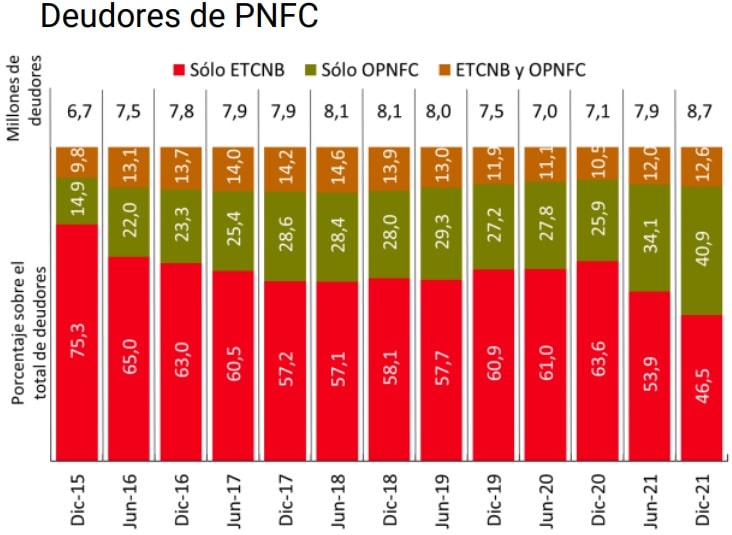
Note | EEFF debtors can register debt in PNFC and vice versa.
Source | BCRA.
At the regional level, and in line with what has been stated above about the coverage of the territory by public banks, a clear difference was observed in the proportion of debtors that obtain financing exclusively from a single institutional group. Regions whose jurisdictions have provincial banks registered a higher penetration of public banks and therefore a lower proportion of debtors with financing only from private banks. Thus, the Northwest region of Argentina (which does not have any provincial public bank) registered as of December 2021 the highest proportion of its debtors with financing only from private banks (87.9%), while the regions that have the largest number of provincial banks (Northeast Argentina, Patagonia and Centro) have more financing from public banks and therefore a lower proportion of their debtors with exclusively private financing (55.3%, 51.8% and 64.6% respectively).
Non-bank credit card issuers (TNCCs) continued during 2021 with the reduction in the number of their debtors (-0.5 p.p.), although at a slower pace than in 2020 (-0.9 p.p.), while other non-financial credit providers (NPPOs) showed a sharp increase in their debtor reports (5.8 p.p.) by virtue of the regulatory change mentioned above. From the incorporation of new reporters, the OPNFCs achieved a significant improvement in the number of individuals with financing, exceeding the values of public banks and approaching the values of the ETCNB.
However, within the PNFC group, as of December 2021, OPNFCs exclusively financed 40.9% of debtors, while ETCNBs registered a higher proportion of exclusive debtors with 46.5%. Although the number of reporting OPNFCs far exceeded that of ETCNB (234 and 89, respectively, as of December 2021), the predominance of ETCNB financing can be explained by the type of financing they provide, given that credit cards are the most used financing by the Argentine population.
The evolution of the series of debtors by groups of banks suggests that displacements of debtors occurred among them and that the economic conditions resulting from the COVID-19 pandemic would have led people to reduce the types of entities with which they take financing. Between December 2019 and the same month of 2021, the group of public banks gained 5.9 p.p. of participation in all debtors, a variation that was offset by the loss of debtors exclusive to private banks (-3.9 p.p.) and the group that brings together shared customers (-1.9 p.p.).
Second, it is observed that, outside of these short-term issues, only a small proportion of the debtors, both of EEFF and PNFC, obtain financing from more than one type of provider within each institutional group. This raises the question of whether this behavior responds to a choice of people or whether there are costs and rigidities for users to contract services in one or another type of provider (for example, determined by the type of bank in which their assets are credited). In the latter case, there is a challenge in that access to various sources of financing allows the selection of the best credit conditions according to people’s needs.
In terms of debt balance, the EEFF have average balances per debtor that are four times higher than those of PNFC. During 2021, private and public banks and financial companies reduced their average balance per debtor in real terms (between a 5% and 10% drop), while, within the PNFCs as a whole, the ETCNB balance registered a 16% increase and the OPNFCs a 16% decrease. The significant reduction observed for OPNFCs may be associated with new reporters. The total balance financed by this group did not accompany the growth observed in the number of debtors, which resulted in a drop in the average balance per debtor from $16.4 thousand in December 2020 to $13.8 thousand a year later. Bearing in mind that the OPNFCs are characterized by granting mainly personal loans, the behavior of this institutional group generated a 13% drop in the balance of personal loans between December 2020 and December 2021.
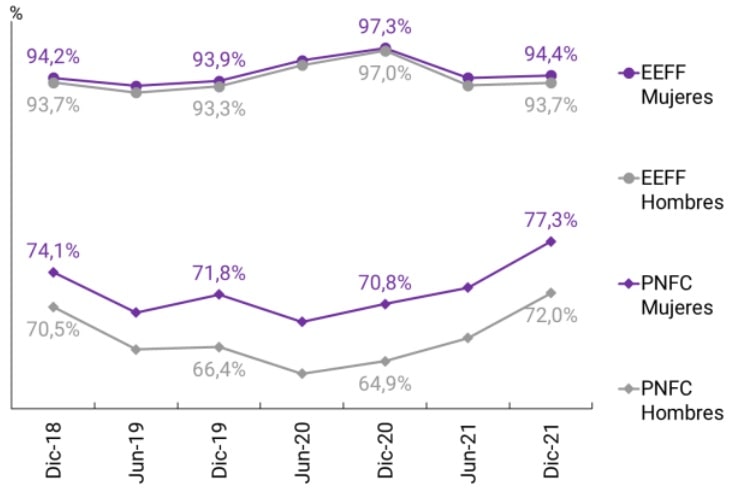
Gender of debtors. During 2021, the variation in the percentage of men and women with EEFF financing was similar to that of 2020. Within this group, public banks added more female debtors than male debtors, while the reduction in private banks was similar for both genders. In terms of balances, throughout 2021 the average per debtor of the EEFF fell more for women, deepening the important gender gap as men have a considerably higher average balance than women.
In the case of the PNFCs, the increase in the number of people with financing derived from the change in regulation was greater for women than for men, which made it possible to reverse the gender gap for this institutional group.
Table 2 | Access to financing by gender
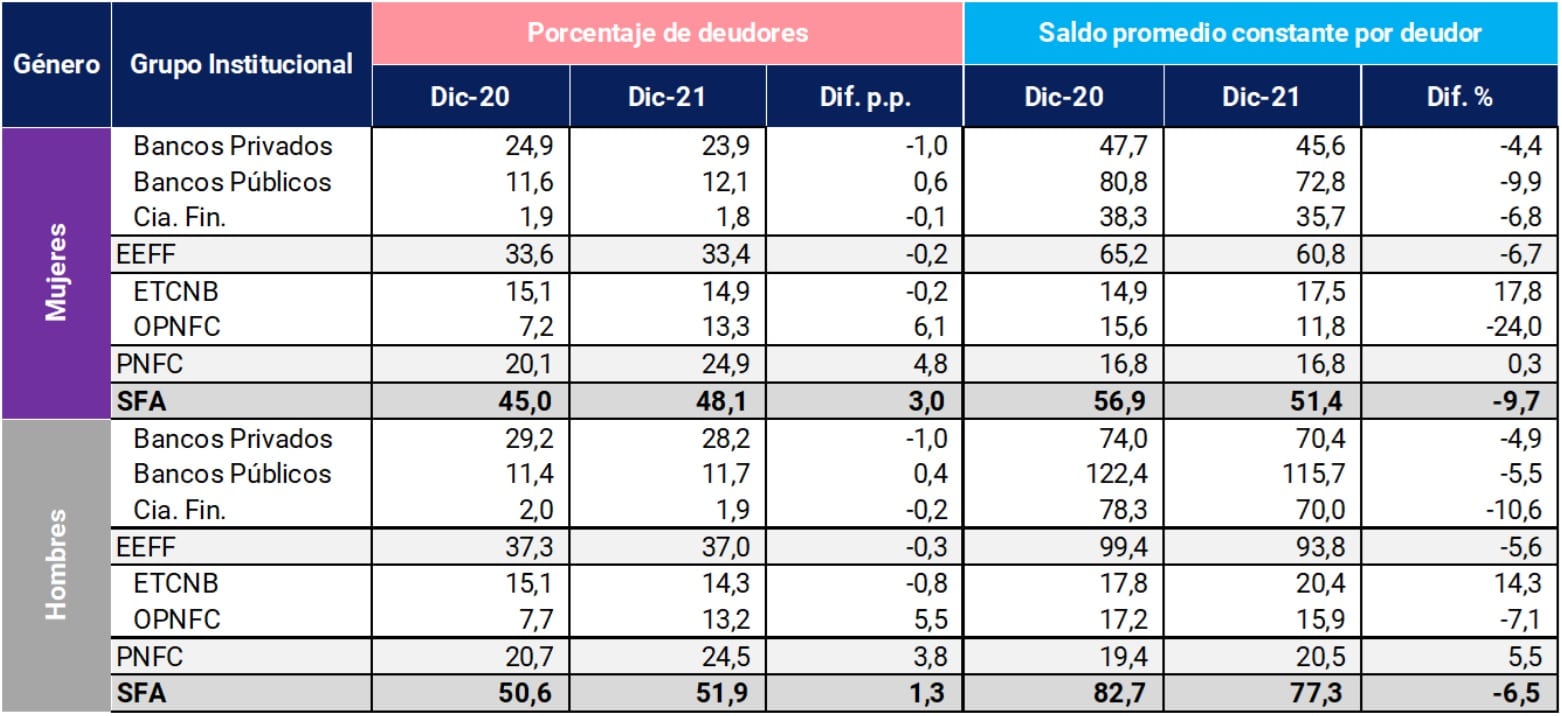
Note | Balances in thousands of pesos.
Source | BCRA and INDEC.
Type of assistance. During 2021, credit cards remained at values similar to those of the previous year and continued to be the type of credit assistance most used by individuals. The Zero-Rate Credits for self-employed workers and single-payers were promoted by the National Government in response to the health crisis66 . This line of financing, in force until December 2021, was made effective through the deposit in credit cards and accompanied small taxpayers in the economic recovery stage. On the other hand, as a result of the report of a significant number of debtors by OPNFC, the percentage of the adult population with at least one personal loan registered an increase of 0.9 p.p. during the last half of 2021.
Debt balances, on the other hand, registered decreases during 2021 for the three types of assistance (credit cards, personal loans, and current account advances). The average balance of credit card assistance showed a decrease of 7% (vs. an increase of 11% during 2020), while personal loans accelerated the reduction of their balances (13% during 2021 compared to 4% during the previous year).
Figure 20 | SFA funding by type of assistance
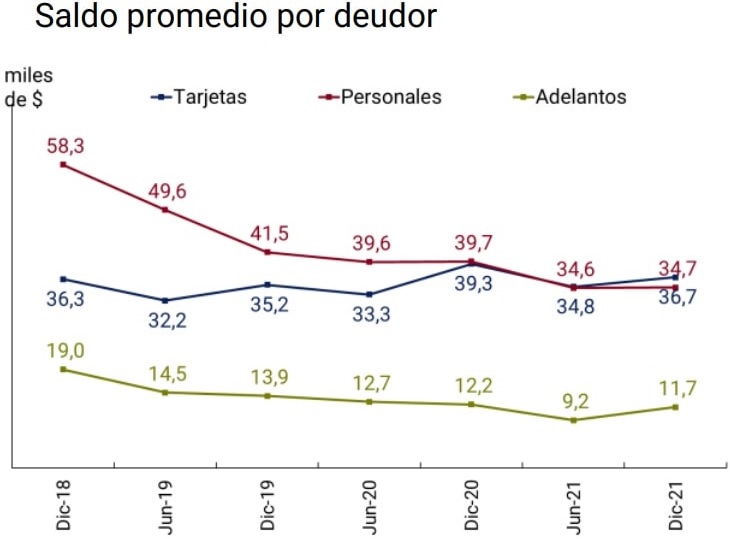
Source | BCRA.
Among the assistance that can be granted by the EEFF and the OPNFC are loans to microentrepreneurs. This type of credit assistance contributes to the financial inclusion of the most vulnerable population by bringing financing to low-income small entrepreneurs, usually excluded from the financial system, allowing them to sustain (and eventually increase) their productive and/or commercial activities. Microcredits are characterized by being of small amounts, having repayment terms according to the productive activity carried out and a lower requirement of requirements such as guarantees or guarantees.
In our country, and continuing with what is stated in Section 1 of the Financial Inclusion Report for the second half of 2019, microcredits are a little widespread instrument that in December 2021 reached 56 thousand individuals. These people received financing mainly from two public banks (89% of debtors) and two microcredit institutions (11%) registered as OPNFC. The total balance of these loans amounted to $7,000 million, which represents 0.2% of the total balance of financing granted by the SFA in the same period. In this way, 0.3% of the total number of people with SFA financing registered this type of credit assistance with an average balance equivalent to 4 Minimum Living and Mobile Wages (SMVM) for the same period.
Situation of debtors. Between March 2021 and June 2021, the BCRA provided a scheme to relax the criteria applicable to the classification of debtors. The addition of days to the periods of arrears admitted in each situation had a clear impact on the percentage of EEFF debtors in a regular situation, while for OPNFC debtors the effect was not as noticeable.
Once the validity of this measure ended, there was a drop in the percentage of EEFF debtors in a regular situation that brought the indicator back to values similar to those of the pre-pandemic. For the PNFCs, there was a reduction during the first nine months of 2020 of 3.3 p.p. in the proportion of debtors who fulfilled their financial commitments, probably associated with the greater impact of the pandemic on unregistered workers who represent a significant part of the PNFC67 debtors. Subsequently, the indicator began an upward trend that accompanied the recovery of economic activity and was consolidated with the incorporation of the 2 million debtors reported by an OPNFC who register an adequate capacity to meet the payment of their financing. In terms of gender, better repayment behavior continues to be observed among women, both for EEFF and PNFC.
Figure 21 | Percentage of debtors in a regular situation
Source | BCRA.
New financing. As presented in Section 1 of the previous Financial Inclusion Report, the BCRA issued a stimulus policy to expand credit to individuals and MSMEs that did not have EEFF financing in December 202068. This incentive is applied according to the financing agreed at an interest rate below a maximum limit determined in the regulations on interest rates in credit operations.
As of December 2021, this group of people registered a financing balance with the EEFF of $43,605 million. Two EEFFs, one private and one public, accounted for two-fifths of this balance since the implementation of the regulation in April 2021.
The December balance represented 1.5% of the total balance of financing of the LEFs and 9% of the total balance of financing of the PNFCs, in both cases granted to individuals. As of June 2021, the entities participating in the franchise concentrated 85% of the accounts in national currency of the financial system, which shows the potential of this policy. It should be recalled that individuals without EEFF financing as of December 2020 amounted to 22.3 million, which was equivalent to 65% of the adult population, and of which, 7 million had PNFC financing.
Section 1 / Priorities of the global financial inclusion agenda
The international financial inclusion agenda 69 is affected by the impact of the COVID-19 pandemic and the consequent acceleration in the digitalization of financial services. At the global level, the onset of the pandemic and the isolation provisions established to reduce the circulation of the virus restricted economic activities, modifying the behavior of societies, affecting the most vulnerable segments to a greater extent, such as micro, small and medium-sized enterprises (MSMEs), low-income people, women and the elderly. This situation accelerated the adoption of digital tools that would allow the usual performance of essential activities for the functioning of the economy to continue.
The G20 global forum noted that in the context of the health crisis, digital financial inclusion, defined as the use of digital financial services to promote financial inclusion70, reaffirmed its relevance. It also made it possible to maintain the provision of basic financial services and sustain critical areas such as retail payments, income transfers to the most vulnerable sectors and financing to the most affected segments, contributing to the economic recovery of individuals and MSMEs.
Thus, according to the G20/OECD-INFE report, access to digital financial services proved to be a key tool to support financial resilience71, a concept that focuses on the ability of people 72 to resist, cope with, and recover from negative financial impacts. Financial inclusion could be a facilitator of financial resilience, as it allows people to manage financial resources in a more secure way compared to informal and unregulated financial channels, and to adopt prudent savings behaviors and access to credit and insurance products.
Prior to the COVID-19 pandemic, digital financial inclusion was already considered a priority by the global community along with the finances of MSMEs. MSMEs make up the majority of the world’s existing enterprises (around 90%) and play a crucial role in employment (more than 50%), investment, innovation and economic growth globally73. In this way, it is essential to ensure that MSMEs have access to responsible financial services, including digital ones.
Therefore, the focus of study in the international sphere was on the analysis of the impact of the pandemic on the financial inclusion of MSMEs and the role of digital financial services and financial education in mitigating the negative effects.
Regarding the role of financial inclusion and education, it was found that the financial capabilities of the management levels of MSMEs (a role usually played by the same people who own the companies) may have played a role in mitigating the impact of the COVID-19 crisis74 . In some countries, an association was observed between financial education and the probability of being negatively affected during the pandemic, as well as resorting to the relief measures implemented by governments. For example, the likelihood of an MSME suffering liquidity problems during the pandemic decreases as the financial knowledge of the person running the company increased. Likewise, MSME owners with high levels of financial education were more likely to receive a positive response in their loan application than those MSME owners with low levels of financial education, after controlling for characteristics of people and company activity.
Table A.1.1 | Policy options to promote digital financial inclusion
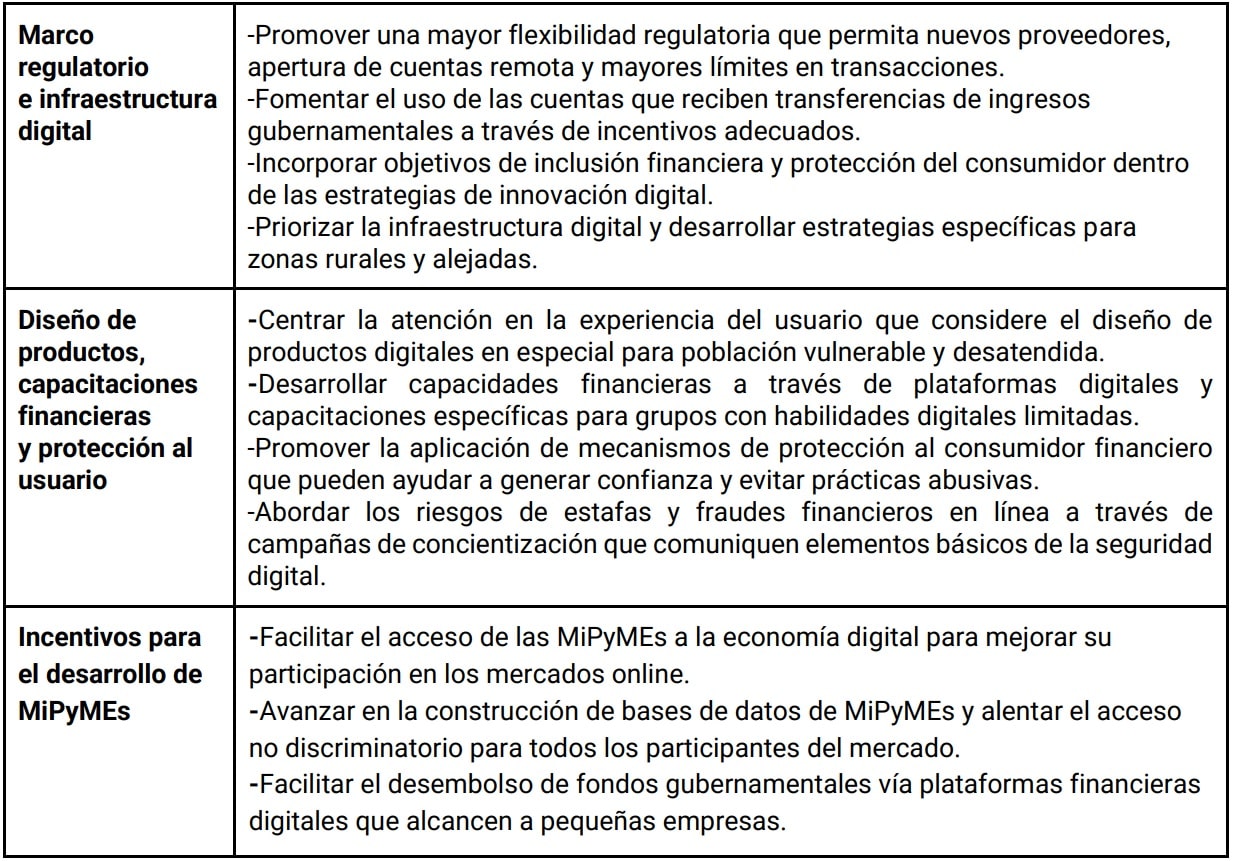
To support the financial resilience of both individuals and MSMEs, lessons learned and the most effective policy options to promote greater financial inclusion through the use of responsible digital financial services in the current context have been identified during the last period.
Based on best efforts, each of the countries will evaluate policy options according to their characteristics, the level of development of financial systems, the needs of people -with a focus on the most vulnerable-, their level of education, the expansion of technological developments and the capacities to use them. Some countries, as is the case of Argentina, will require an extra effort from the State to promote, encourage, generate incentives -including economic-, train and align themselves with these policies.
Section 2 / Electronic Credit Invoice, a new financing tool for MSMEs
Micro, small and medium-sized enterprises (MSMEs) are a fundamental component of a country’s productive scheme and represent key actors for the growth of the economy. In Argentina, about 83% of the more than 600,000 private employing companies are micro-sized, while 16.8% are small and medium-sized and 0.2% are large75. Access to financing is one of the challenges faced by MSMEs globally.
To address this, financial regulation has tended, on the one hand, to create specific lines of credit for these segments of companies and, on the other hand, to introduce new financing instruments based on the opportunities offered by the application of technology in the dematerialization of credit or securities securities. While in the first case the Financing Lines for the Productive Investment of MSMEs can be found as examples, in the second case there are the Electronic Check and, more recently, the Electronic Credit Invoice for MSMEs (FCEM).
The FCEM is an innovative instrument, focused on boosting the financing capacity of MSMEs by sending it to electronic platforms that allow, depending on the needs of the issuer, to discount it (advancing access to the funds originated in the sales of goods or services), assign, endorse or deposit it and wait for its collection76. In turn, the BCRA has established incentives for the development of this instrument, through franchises that reduce the minimum cash requirements of financial institutions (EEFF) that acquire FCEM77.
Operating schemes. The regime for the issuance of FCEM is mandatory or optional depending on who the parties involved in the commercial operation are. Whenever an MSME is obliged to issue original electronic receipts (invoice or receipt) to a large company, FCEM78 must be issued. On the other hand, when the operation is carried out only among MSMEs, the issuance of FCEM will be optional. The regime contemplates two initial schemes for the management of the FCEM, through its transfer to:
i. Collective Depository Agent (ADC): allows access to the securities markets authorized by the National Securities Commission (CNV) for trading.
ii. Open Circulation System (SCA): allows access to the financial system for endorsement, assignment, discount or receipt of payment from home-banking. If the MSME chooses this option, it may also take the FCEM later to the capital market for trading.
All the functionalities described give the FCEM advantageous characteristics for obtaining immediate liquidity, competing with the other financing instruments in terms of interest rates. Through their negotiation in these markets, it is also expected that MSMEs can also reduce the collection risks derived from these operations. On the other hand, the FCEM must meet requirements related to the payment term, the parties involved in the operation with their tax identification, the CBU or Alias of the account corresponding to the debtor company, among other formal requirements79.
Incentive mechanisms for compliance by the parties. The schemes for the use of the FCEM as a financing instrument were accompanied by regulations that tend to encourage the debtor to comply with obligations. Its registration within the SCA complies with the registration requirement necessary to legitimize the judicial process with respect to a possible claimfor collection 80. In this way, the FCEM can be considered as an enforceable title, a feature that improves the incentives for each of the parties and contributes to reducing the risks of uncollectibility of the operation81 .
In addition, the BCRA created the “Central Bank of Electronic Credit Invoices for MSMEs Unpaid at Maturity”82. It collects information on the FCEM entered into the SCA, which must be reported by the EEFF where the collection account that was reported by the creditor of the invoice is located. The EEFF are required to report data on invoices cleared in pesos or dollars and unpaid invoices for any of the following reasons: a) lack of sufficient funds available in the payment account; (b) lack of payment account information; c) Other reasons, such as disqualified account holder, closed account, bankruptcy and judicial seizure. Through this dissemination service created by the BCRA, investors can verify whether or not they comply with the payment obligations that debtor companies have contracted through these securities. In this way, more information is provided to the public, which facilitates decision-making by agents who want to invest in these instruments.
Operations in cipher. Since the implementation of the FCEM in 2018, a number of 215,000 MSMEs have issued this type of instrument to a large company (totaling around 1,300 companies), of which 50% correspond to employing MSMEs. During 2021, the amount of FCEM traded in the stock market reached around $4,200 million, while the FCEM entered into the SCA in pesos and foreign currency reached the equivalent of $740,000 million between May and December 2021. The average nominal annual rate at which the FCEM were traded was around 38% and the average term was 33 days. By way of comparison, the average nominal annual rate of direct checks discounted in the stock market reached a higher average value (41%), although the average maturity period was extended to 90 days83.
Section 3 / Education, a key investment to take care of financial health
The BCRA and the promotion of financial education. Article 42 of the BCRA’s Charter establishes that “(…) The bank may conduct research and promote financial education and activities on topics of interest related to the purpose assigned to it by this Organic Charter.” Under this mandate, the BCRA designs and develops educational activities with different audiences, seeking to contribute to the construction of an informed citizenry prepared to make financial decisions that improve individual and collective well-being84.
By encouraging the development of financial capabilities and habits that improve money management and decision-making, the BCRA contributes to forging a more inclusive, more equitable society with better development opportunities for the vast majority and, fundamentally, for the most vulnerable sectors. It also seeks to facilitate understanding and strengthen the dissemination and exercise of the rights that assist users of financial products and services.
Training in financial planning and understanding of the financial environment where a person develops are the starting point for the acquisition of habits and customs that improve quality of life. Therefore, among the functions that the BCRA carries out through the Financial Education Management, the following stand out:
-Propose guidelines on economic and financial knowledge and skills.
-Implement educational and community activities -with special emphasis on the most vulnerable sectors- contemplating the institutional gender perspective and the protection of users of financial services.
– To promote the analysis and research of economic and financial education programs, as well as the conduct of surveys, in collaboration with national or international organizations.
Financial education programs developed by the BCRA. Financial education is a pillar among the policies to promote greater financial inclusion implemented by the BCRA. Thus, during 2020 and 2021, the BCRA implemented three specific programs aimed at promoting them85. The first of these, “Financial Education in the Classroom”, has a federal vocation and has already been successfully applied in the provinces of Catamarca, Chaco, San Juan, San Luis, Santa Fe and Neuquén, where it reached 2,240 teachers who teach classes annually to more than 150,000 secondary school students and who additionally impacted more than 65,000 people in their family environment and their community86. Through the second program, “Finanzas Cerca”, in 2021 the BCRA trained representatives of organizations that group and/or assist various vulnerable audiences, reaching 814 trainers registered in the provinces of Santa Fe, San Juan and Neuquén. The third, “An approach to financial tools for State workers”, consists of a training cycle in financial education that particularly incorporates a gender perspective in which 729 people have already participated.
Monitoring and evaluation of the actions carried out. These programs include the optional completion of a “Financial Capability Survey” at the time of registration and whose answers allow both to assess the financial capabilities and to infer the state of financial health of those who participate in the training87.
When financial capabilities are measured, an attempt is made to capture information referring to knowledge, attitudes and financial behaviors of people that are the product of the education and socialization process in which they have participated. Thus, these measurements result, according to internationally applied methodologies88, in the construction of 3 partial indicators89 and one aggregate of financial capacities90.
Although the acquisition of education is an end in itself91, financial training is, for its part, a key element in promoting people’s financial inclusion, enabling better living conditions for those who participate in this process and their environment. In this way, it is evident that the link between financial education and people’s financial health should be explored.
In the international comparison92 , there is evidence of a relatively low level of financial capacity of adults in Argentina in relation to other economies that conducted similar surveys. In the measurement carried out in 2017, the score stood at 11.49 points, below the average of G20 members (12.7), as well as the average of OECD countries (13), and other Latin American economies such as Chile (13.3), Colombia (12.47), Peru (12.42), Mexico (12.1) and Brazil (12.1)93.
The concept of “financial health” is geared towards exploring the extent to which individuals, families, and societies can smoothly manage their current financial activities and feel confident about their future. Although there is still no consensus on its definition, conceptual scope and measurement94, it is generally agreed that a healthy financial state should consider: 1) the possibility of controlling daily finances, 2) the ability to absorb financial shocks, 3) the self-perception of a state of confidence about one’s own financial situation and 4) having a management and financial awareness consistent with the planning of the desired future.
Results obtained. A look at Graph A.3.1 shows how the financial capacity index is distributed among the different groups trained by the BCRA at the beginning of the training. While for the group of people trained the average index reaches 14.68 points95, there are differences with respect to the values achieved by the different training groups. Teachers, with an average of 15.16 points, are the ones who present the highest average value, followed by the group of trained State workers96 and by the people who were trained as trainers of the Finanzas Cerca97 program with values of 14.75 and 12.86 points, respectively.
The graph also shows the result of the simplified financial health indices observed98. In this case, the average value of the set is 49.29 points99. It is again the teachers, with an average of 51.58 points, who lead the ranking, followed by State workers and the trainers of the finance program close with average values of 49.82 and 39.48 points, respectively.
The people trained differ not only because of the training programs they were part of, but also because of a series of characteristics that can be used through statistical methods to see how the possession of these attributes impacts the results obtained in both the indices of skills and financial health. The results of this exercise are presented in Table A.3.1 which shows a synthesis of the main estimates obtained100.
Figure A.3.1 | Capability and Financial Health Indices
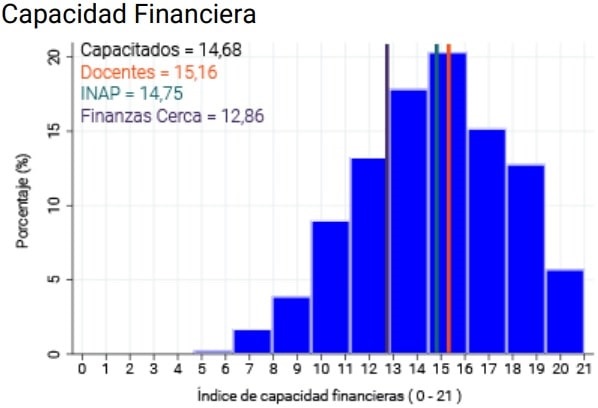
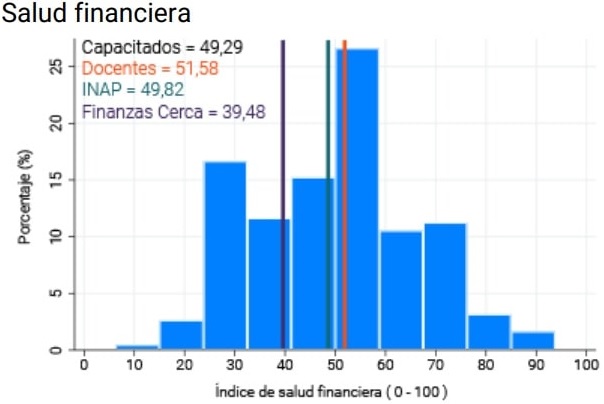
The results in Table A.3.1 must be considered as relative to the “base group” chosen in the regressions, which consists of a female person who participated in the teacher program, who has completed tertiary education, resides in the province of Santa Fe, and who lives in a household with a total family income that places him or her in the third quintile of income distribution.
Since partial indices and the aggregate of financial capabilities are originally measured with different ranges, we have proceeded to standardize them so that all of them are spread over a potential range with a maximum value of 100 points. In this way, the interpretation of the table is also simplified, since the estimated values for the variables presented add or subtract the value exhibited depending on the sign of the same and the possession or not of the characteristic.
As an example, if we look at column 1 that takes the standardized index of financial capacity and the male category (Gender) as the variable to be explained, we see that it has an estimate of 3.44 and that it is accompanied by three asterisks101. This indicates that, out of a maximum possible value for the index of 100 points, people who responded that they perceived themselves as male presented 3.44 points more in terms of financial capacity than if compared to those who responded that they perceived themselves as female; allowing quantifying through the impact of this particular variable a gap between the reported genders102.
Table A.3.1 | Financial Capacity and Health, regressions
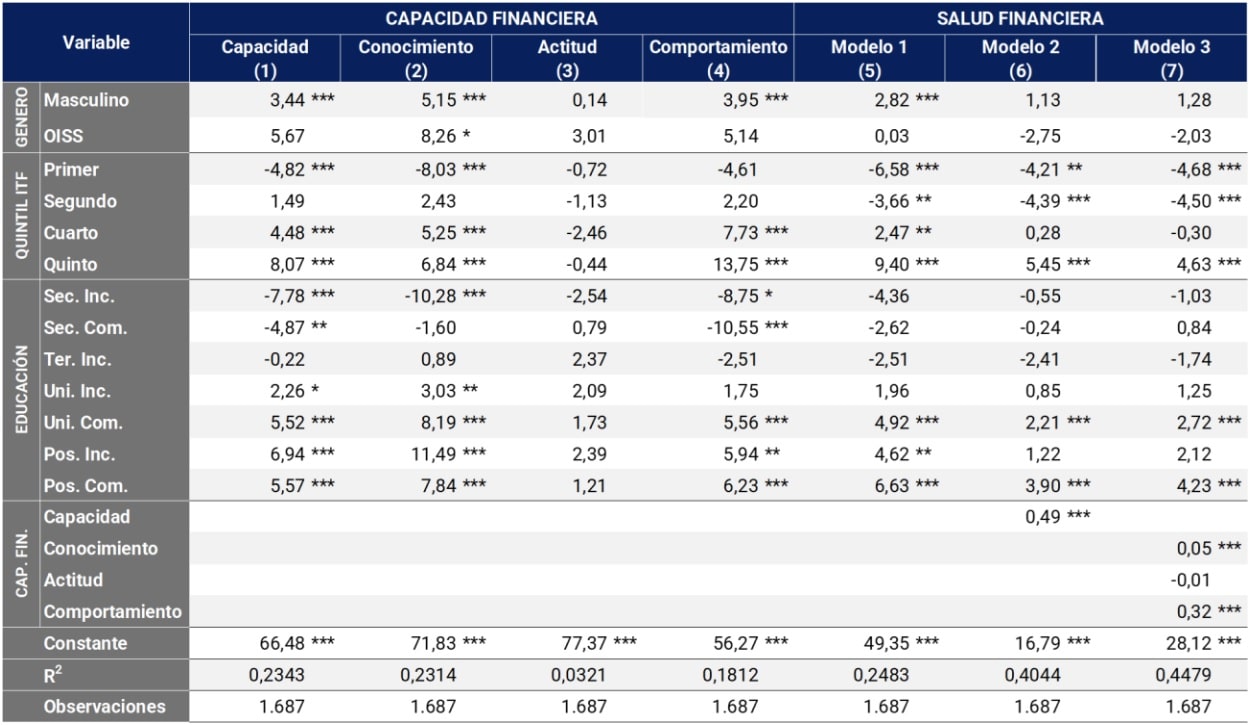
Note | OISS: Other socio-sexual identities.
Financial capabilities. Looking at the first block of the table (columns 1 to 4), we see that the set of variables associated with gender, total family income, and level of formal education are highly significant both in statistical terms and in terms of impact on indicators of financial capacity, knowledge, and behavior103.
We can also observe some stylized facts. Firstly, and as we previously introduced, there is a gender gap between men and women except with regard to the attitude indicator; the widest gap being that referred to financial knowledge. Second, we see that the higher the level of total family income104 , the greater the overall impact on the aggregate index and on the knowledge and behavior indices. When considering the aggregate index of financial capacity, a person who lives in a household that belongs to the first quintile reaches 4.82 points less than one who lives in one of the third quintile and one who lives in one of the fifth quintile has 8.07 points more. Thirdly, it can be noted that the higher the level of formal education, the value of the indicators also increases. Again, in the case of the financial capabilities index, a person with an incomplete secondary level has 7.78 points less than a person with a completed tertiary level and one with a completed university degree shows 5.52 points more.
These results reinforce the need to work with a perspective that includes gender aspects, focusing on the most economically vulnerable households, and incorporating financial education in pre-tertiary/university stages of formal education to develop essential financial skills as an input for financial well-being. They also show that the priority should be to work on people’s financial knowledge and behaviors.
The statement in the previous paragraph still needs to be validated by exploring the link between financial capabilities and financial health. To this end, we present in columns 5 to 7 of Table A.3.1 the results of a series of statistical exercises carried out to report on this aspect.
Financial health. In column 5 you can see how the different characteristics of people affect the value obtained for the financial health index105. In it we can see that, in general, the stylized facts discussed for the variables related to financial capabilities are repeated, with the exception of the variables of formal education where the impacts are less significant in statistical terms106. However, it is particularly interesting to consider the estimated values of columns 6 and 7 since they include as additional explanatory variables the different indices of financial capabilities contemplated in the first part of Table A.3.1; it is possible, in this way, to infer the impact that the financial capabilities exhibited have on financial health at the time of enrollment.
Again, an enumeration of stylized facts facilitates the exposition. In the first place, it should be noted that the impact of the variables associated with abilities, with the exception of the one that measures attitudes, are highly significant in statistical and positive terms. Second, R2 increases considerably, indicating that financial capabilities contribute to explaining a significant portion of people’s financial health. Third, the observed gender gap for financial health107 is reduced by more than half and, to be statistically precise, becomes non-significant. Fourth, the gaps corresponding to the different income quintiles tend to narrow. Fifth, the same is true of the gaps in the different levels of formal education. Sixth and finally, once again, knowledge and behaviors have a greater statistical impact than people’s financial attitudes.
Learning based on this evidence. The results obtained show that financial education matters to improve people’s self-perceived living conditions. That from a social perspective, financial education is particularly important to reduce, and potentially eliminate, the differences and inequities associated with issues of gender, income distribution, and access to formal education. The exercise also shows that, since education in general is a transcendental vehicle to improve people’s living conditions, there are also certain specific contributions that can only be obtained through financial education, which makes it a key investment to improve people’s financial health.
Methodological note
Population data
This IIF presents indicators that are disaggregated by different demographic and geographical variables. For the elaboration of these indicators, population data were used based on the population projection made by the National Institute of Statistics and Censuses of the Argentine Republic (INDEC). Considering that this agency does not publish a series that simultaneously contains all the disaggregations used throughout this IIF (gender, age group and geographical location at the provincial, departmental and locality levels), it was necessary to take different series according to the definition of each indicator.
For the indicators at the national and provincial levels, the series called “Population by sex and five-year age groups for the country and provinces as a whole” was used. Years 2010-2040″, while for the indicators at the departmental level, the series “Estimated population on July 1 of each calendar year by sex, by department” was taken as a basis. Finally, since INDEC does not publish a projection of the evolution over time of the number of inhabitants of each locality, it was necessary to construct the series for the indicators at that level, for which the results of the 2010 National Census were taken as a basis.
For the purposes of this IIF, an “adult” is considered to be a person 15 years of age or older, following the standard used by the World Bank for its financial inclusion indicators.
Zoning criteria
In 2012, the BCRA developed a zoning criterion for the Argentine territory. This methodology divided the universe of localities identified in the 2010 National Census of Population, Households and Housing into two groups, one that brings together localities that had at least one FLW and the other that includes localities without ADP.
For each group, a series of relative indicators of economic potential, users, enabled infrastructure, competition and market were designed, which consider variables such as: i) the existence of companies, exporters and jobs in a relationship of dependency; (ii) population density, (iii) the number of social benefit payments; (iv) loans, deposits, debits and credits; v) distances from each locality without infrastructure to the nearest locality with infrastructure. Based on these indicators, an index was calculated for each locality and the first 3% of the localities with infrastructure were assigned to zone 1 (which then includes the localities with the best indicators) and the following 17%, 30% and 50% to zones 2, 3 and 4, respectively. In the case of the group of localities without infrastructure, using the corresponding global index, the first 50% was assigned to zone 5 and the last 50% to zone 6, the latter bringing together those localities with the lowest indicators.
Regionalization
For the purpose of developing regional indicators, the regionalization criterion proposed by the Ministry of Economy and Public Finance (now the Ministry of Economy) was used, which establishes five regions, namely:
– NOA (Northwest Argentina): Salta, Jujuy, Tucumán, Catamarca and Santiago del Estero.
– NEA (Northeast Argentina): Formosa, Chaco, Misiones and Corrientes.
– Nuevo Cuyo: Mendoza, San Juan, San Luis and La Rioja.
– Patagonia: La Pampa, Neuquén, Río Negro, Chubut, Santa Cruz and Tierra del Fuego.
– Centro and Buenos Aires: Córdoba, Santa Fe, Entre Ríos, Buenos Aires and the Autonomous City of Buenos Aires.
In the text of this IIF, Nuevo Cuyo is mentioned as Cuyo and Center and Buenos Aires as Center.
Regularity of debtors
Financial institutions and non-financial credit providers classify their debtors according to the ability to pay their debt. BCRA regulations 108 provide for the existence of levels of grouping (“situations”) of debtors in decreasing order of quality. Situation 1 is one in which debtors are able to adequately meet all their financial commitments (even if they are late in payment), while Situations 5 and 6 are those in which the debt is considered uncollectible.
To calculate the percentage of debtors in a regular situation, the number of CUITS classified in Situations 1 and 2 is grouped, i.e., those that can meet all their financial commitments. All other debtors are considered to be under the category of irregular situation. The indicator counts each person as many times as entities in which they have active debts, both financial and non-financial institutions. According to the BCRA regulation, each debtor registers one situation per creditor.
Payment accounts at payment service providers
Within the Payment Service Providers (PSPs) that operate in COELSA, there are providers that are registered in the BCRA’s Registry of Payment Service Providers Offering Payment Accounts (PSPOCP) and other providers that are not registered109. For the purposes of this report, only payment accounts for vendors that are registered as PSPOCPs are posted.
Glossary of abbreviations and acronyms
ACSF Complementary Financial Services Agency
ADC Collective Deposit Agent
ATM ATM
BCRA Central Bank of the Argentine Republic
CABA Autonomous City of Buenos Aires
CBU Uniform Bank Code
CVU Uniform Virtual Key
CENDEU Central Bank of Debtors of the Financial System
NVC National Securities Commission
COELSA Electronic Clearing House
CTO Zero-rate loans
CUIT Unique Tax Identification Code
EEFF Financial Institutions
ETCNB Non-Bank Credit Card Issuers
FAS Financial Access Survey
FCEM Electronic Credit Invoice for MSMEs
CDF Direct Pool Fund
FCI Mutual Fund
IMF International Monetary Fund
Hor. Lim. Limited Hours
Hs. Hours
A.I. Year-over-year
IFE Emergency Family Income
IIF Financial Inclusion Report
INDEC National Institute of Statistics and Censuses
CPI Consumer Price Index
LFIP Financing Line for Productive Investment
Loc Locations
M Mil
MB Mobile Banking
MPE Electronic Payment Methods
MPOS Mobile Device at Point of Sale
MSMEs Micro, Small and Medium Enterprises.
NEA Northeast Argentina
NOA Northwest Argentina
OPNFC Other Non-Financial Credit Providers
PCT Transfer payments
PDA Access Points
GDP Gross Domestic Product
FAQ Fixed Term
PH Human Person
PN Net Worth
PNFC Non-Financial Credit Providers
POS Point of Sale Device
PSP Payment Service Providers
RS Simplified Regime for Small Taxpayers
SMVM Minimum Living and Moving Wage
NFPS Non-Financial Private Sector
SCA Open Circulation System
SFA Expanded Financial System
TAS Self-service terminal
TNA Annual Nominal Rate
TO Ordered text
UVA Purchasing Value Units
VAR Variation
References
1 GDP values in the first and second half of 2021 are calculated from the average of the first two quarters and the last two quarters of 2021, respectively.
2 The calculation was made by taking the Wage Index and the National Consumer Price Index with national coverage published by INDEC.
3 Resolution 753/21 of the Ministry of Productive Development, July 2021.
4 Increasing to 50% the percentage of these financings that were deductible from the minimum cash requirements from October 2020 until 31.01.22.
7 In September 2021, the application of the quota was extended until the end of March 2022. The NFPS must apply at least 7.5% or 1.875% of their deposits to the NFPS, depending on the share of their assets in the total assets of the financial system, in the financing included in said regulation (Communication A 7369).
8 Decree DNU 512/21. AFIP RG 5058/21 established until 31.12.21 the possibility of requesting CT0.
9 The percentages were calculated based on data from the BCRA’s Report on Banks and statistical series.
10 Agreement between financial institutions and the BCRA.
11 Communication “A” 7305 and BCRA News.
12 INDEC, Internet Access.
13 Smartphone users as share of the population in Argentina from 2015 to 2025. Survey conducted by Statista in July 2020.
15 Point 8 Communication A 7462 and Communication A 7463.
16 Categorization of localities for financial institutions. See methodological note for more details.
17 Financial Inclusion Report, November 2020 and Financial Inclusion Report, May 2021
18 The contraction was driven by the closure of restricted branches that operate within third-party institutions. On the contrary, full branches showed a recovery in their number during the second half of the year.
19 2020 FAS Trends and Developments, IMF and 2021 FAS Trends and Developments, IMF. See Nov-21 IIF for international comparison of branch level.
20 Two localities were covered by public banks and the remaining one by a private bank.
21 The total number of gross discharges from ACSF between December 2020 and 2021 was 7,068 points, of which 1.7% (121 ACSF) went to localities that did not have any ADP as of December 2020.
22.99 % of the ACSFs are located in establishments corresponding to non-bank collection companies.
23 As of December 2021, 96.7% of all ATMs are concentrated in two networks.
24 For example, when the sender of an electronic money transfer has an account in a financial institution, while the receiver has an account in a PSP.
25 Of all the localities with a single network, 533 localities had only the presence of ATMs from public banks, while 414 localities were served exclusively by ATMs from private banks. Among the latter, 142 corresponded to localities covered by provincial banks of private capital.
26 The availability of the device depends on the opening hours of the bank branch or commercial establishment in which it is located.
27 Section 1 / Regulatory incentives to improve financial inclusion in Argentina.
28 It refers to persons who simultaneously hold at least one bank account and one payment account.
29 See Financial Inclusion Report, May 2021, BCRA.
30 The gap in employment – to the detriment of women – was reduced by 0.6 p.p., while that registered in the unemployment rate – in favour of women – fell by 0.3 p.p. between the fourth quarter of 2020 and 2021. Indec. Labor market. Socioeconomic rates and indicators (EPH). Fourth quarter of 2021.
31 IFE Bulletin I-2020: Characterization of the beneficiary population. The bulletin estimates that the unbanked population benefiting from the first payment of the IFE amounted to 4.2 million people. This estimate assumes that the beneficiaries who did not report payment methods did not have a bank account. Although it is higher than the number of 2.8 million people who started to have an account between March and June 2020, orders of magnitude suggest that a significant percentage of this last number would have corresponded to the IFE.
32 In the fourth quarter of 2021, women between 14 and 29 years of age had an employment rate equal to 33.6% vs. 65.8% of those between 30 and 64 years of age. For men, these figures stood at 45.3% and 87.4%, respectively. Indec. Labor market. Socioeconomic rates and indicators (EPH). Fourth quarter of 2021.
33 In the fourth quarter of 2019, the employment rate for women and men between 14 and 29 years of age reached 33.1% and 45.2%, respectively, while for women and men between 30 and 64 years of age, the rates were 63.3% and 85.8%. Historical Series, Labor Market Rates and Socioeconomic Indicators EPH. First quarter of 2017 to fourth quarter of 2021 Table 1.3.
34 The 20-24 age range in the NEA region and the 25-29 age range in the Central, NEA, NOA and Patagonia regions slightly exceed 100% due to population projections from the 2010 National Census.
35 The amounts mentioned throughout the section are expressed at constant prices of January 2019 (Indec CPI January 2019 = 100).
36 Payment aspects of financial inclusion in the fintech era (April 2020) and Payment aspects of financial inclusion (April 2016). Committee on Payments and Market Infrastructures & World Bank Group.
37 Refers to the monthly average of the share in the total for each year.
38 Indec. Survey of supermarkets and wholesale self-service stores. Total sales at current and constant prices, by item group and jurisdiction.
39 76% correspond to payments with credit cards and 7% with debit cards; 4% from electronic wallets and 1% through bank transfers.
40 Chamber of Electronic Commerce. Year 2021. March 2022. The variation in constant terms of annual turnover was calculated from the average of the monthly indices (Indec CPI January 2019 = 100) for the values of each year.
41 It includes transfers from CBU to CVU and from CVU to CBU.
42 Smartphone users as share of the population in Argentina from 2015 to 2025. Survey conducted by Statista in July 2020.
43 It assumes that the transfers initiated in CVU were made by cell phone. The calculation considers CBU-to-CBU transfers through the mobile-banking channel and those initiated in CVU.
44 The PCT name is relatively new, as of the end of 2020. It is an electronic means of payment that took advantage of the benefits of immediate transfers (IT) of funds (immediate crediting, functionality 24 hours a day, every day of the year) to extend its use in stores. While IT was historically characterized by being done remotely (home-banking, ATM, for example), PCTs are basically used in face-to-face commerce through debit cards, QR codes or other credentials.
45 Uniform bank code.
46 Uniform virtual key.
47 Law 25.065 on Credit Cards set a maximum period of 3 business days and, by agreement with the BCRA, the banks reduced this period to 2 business days.
48 “Remote” includes operations carried out by payment button, automatic debit and telephone, among other means.
49 POS devices that record transactions in the month.
50 The mPOS is a small device that connects to a cell phone or tablet to validate card payment/collection transactions. This allows payment/collection to be made at the point of sale.
51 During 2021, 27% more operations were carried out through the “Ahora 12” program, with a turnover of more than 11% in real terms compared to the total recorded in 2020. This represented, in December 2021, 10% of credit to the private sector through “credit cards”.
52 Communication A 7305. News.
53 In this way, micro and small businesses began to receive the collection of sales made by credit card 8 business days after the transaction, instead of the current 10 business days. In the case of medium-sized companies, the deadline was maintained at 10 business days and for large companies the deadline was set at 18 business days, which is the average time that elapses between spending in stores and the payment by cardholders of the card statement.
54 Payment accounts may have a prepaid card associated with them.
55 Section 1 / Regulatory incentives to improve financial inclusion in Argentina.
56 By window, ATM and POS.
57 Depending on the availability of data, only the debits in the savings banks of private sector holders are considered as an estimate of the debits made by natural persons. Debits from private sector current account holders are not included due to the relative importance of the volume of those corresponding to legal persons.
58 The balance of the Net Worth (NP) of FCI of individuals is estimated considering: (i) the balance of the NP of the PH accounts investing in FCI (Argentine Chamber of Mutual Funds – CAFCI) and (ii) the balance of the NP of the common money funds (DCF) operated by PH through PSP. The values for March and June 2020 are estimated for the series of balance in payment account and CDF in PSP.
59 Point 2.2.2. of the T.O. of Payment Service Providers
60 CAFCI. Glossary of Mutual Funds.
61 The average monthly nominal yield for the years 2020 and 2021 was about 7.7 p.p. higher for a fixed term in national currency than the nominal yield of a DCF. It should be clarified that while the nominal yield of the fixed term is known prior to its maturity period, that of the DCFs is not.
62 The amounts mentioned throughout the section are expressed at constant prices of January 2019 (Indec CPI January 2019 = 100).
63 Includes financial institutions (EEFF) and non-financial credit providers (PNFC).
64 Companies must register as long as they have granted financing for an amount greater than $10 million (Communication A 7146). In the case of mutual associations and cooperatives, they must register as long as they have financing granted for at least $20 million, to the extent that they are subject to credit from financial institutions.
65 The Zero-Rate Credit Line was intended for people adhered to the Simplified Regime for Small Taxpayers (RS), while the MSME Lines were aimed at Micro, Small and Medium-sized Enterprises. It should be clarified that individuals can register as MSMEs.
67 See graph 15 Financial Inclusion Report November 2021.
68 Section 1 / Regulatory incentives to improve financial inclusion in Argentina.
69 In line with the objectives outlined in the action plan of the G20 group in charge of promoting financial inclusion, Global Partnership for Financial Inclusion, in which Argentina participates as an active member. It is made up of G20 member and non-member countries, and other relevant parties (international organizations, such as the World Bank and OECD, called Implementing Partners). The GPFI was established more than 10 years ago, in December 2010.
70 G20 2020 Financial Inclusion Action Plan. October 2020.
71 G20/OECD-INFE Report on supporting financial resilience and transformation through digital financial literacy. 2021.
72 Both human and legal, as can be the case of MSMEs.
73 G20 2020 Financial Inclusion Action Plan. October 2020.
74 G20/OECD-INFE report on navigating the storm: MSMEs’ financial and digital competencies in COVID-19 times. GPFI.2021.
75 The term “employers” means that companies have at least one employee. It should be noted that there are also MSMEs, such as Monotributistas and Self-Employed, which are not employers.
76 It was introduced by the “Productive Financing Law”, Law No. 27,440 (2018). Its antecedent is constituted by the credit invoice (in paper format) contemplated in Law No. 24,760 (1997), together with Decree No. 363/02. Computer support comes to give a new impetus to this credit tool. Likewise, the figure of factoring enshrined in Article 1421 of the Civil and Commercial Code of the Nation has represented a credit instrument that preceded the credit invoice: a mechanism through which a company – usually a financial institution – acquires credits from the customer’s portfolio by advancing the amount of these and managing their collection.
78 Art. 1 of Law 27,440.
79 In this case, the company provides its CBU and the corresponding bank account, so that at the time of maturity of the FCE an interbank clearing can be made (Communication “A” 7219, point 3.5.4.3).
80 Article 1851 of the Civil and Commercial Code of the Nation.
81 The beneficiary of an FCEM accepted by the obligor (tacitly or expressly), may take enforcement action against his debtor, in the event that it is not paid when due (Arts. 12, 13 and 14 of Law 27,440). These two characteristics differentiate it and give it advantages over the traditional commercial invoice, which does not grant executive action, but must be claimed for collection through an ordinary trial.
83 FCEM statistics in the capital market can be consulted at this link from the National Securities Commission.
84 For more information, please consult the BCRA website.
85 During 2021, the BCRA has signed agreements with the provinces of Santa Fe, San Juan, Neuquén, Chaco, Formosa and Misiones.
86 Some teachers from the 2020-21 cycles testified to the positive impact of the program in a video
87 Thus, training can be adapted to potential differences and specific needs.
88 For more information, see the Survey of Financial Capabilities of Argentina (2017) and the Financial Inclusion Report for the first half of 2019.
89 Financial Knowledge Index, Financial Attitude Index and Financial Behavior Index.
90 The Financial Capability Index is also known as the financial literacy score.
91 Education, in its school-based form, provides a set of tools for creative and critical dialogue in a culture through the development of personal skills (self-knowledge, self-confidence, motivation, empathy, responsibility) and interpersonal skills (communication, negotiation and conflict resolution). Education oriented to the construction of a critical subjectivity allows the development of skills, values and attitudes of life for individual and social well-being.
92 It should be noted that it refers to different moments in the time when the surveys were carried out.
93 The indicator has a possible range from 1 to 21 points. The data are based on Argentina’s Financial Capability Survey (2017); OECD (2017), G20/OECD INFE report on adult financial literacy in G20 countries; Survey to Measure Financial Capabilities in Colombia (2019); Peru’s Financial Capability Measurement Survey (2019); OECD/INFE 2020 International Survey of Adult Financial Literacy.
94 For more information, see the Financial Inclusion Report for the second half of 2020.
95 The indicator has a possible range from 1 to 21 points.
96 It is represented in the graphs as “INAP”.
97 It is represented in the graphs as “FC Capacitadores”.
98 Caution is advised when comparing these values with others that have not been prepared following the methodology currently used by the BCRA’s Main Management of Financial Inclusion, based on the response to 16 questions.
99 The indicator has a possible range with a maximum value of 100 points.
100 In the regressions we have also controlled, although not shown in the table, by the training groups, the 24 provinces where the survey respondents reside and the number of household members.
101 Asterisks indicate, from lowest to highest, the level of statistical significance. *, ** and *** indicate significance at 0.1, 0.05 and 0.01, respectively.
102 When the form includes the possibility of reporting a non-binary variable as gender, the indicator of those people who have chosen to self-identify as having another socio-sexual identity (OISS) different from women and men is also included in the table
103 But this is not the case for the dependent variable financial attitude.
104 The reader should remember that we are also controlling for the size of the household.
105 The reader should remember that this index ranges from 0 to 100, so the interpretation of the estimates is similar to that applied to the case of financial capabilities.
106 Although the trend continues to grow, only from completed university studies and postgraduate studies are the variables statistically significant
107 Out of 2.82 points in favour of men compared to women.
Share on


