Executive summary
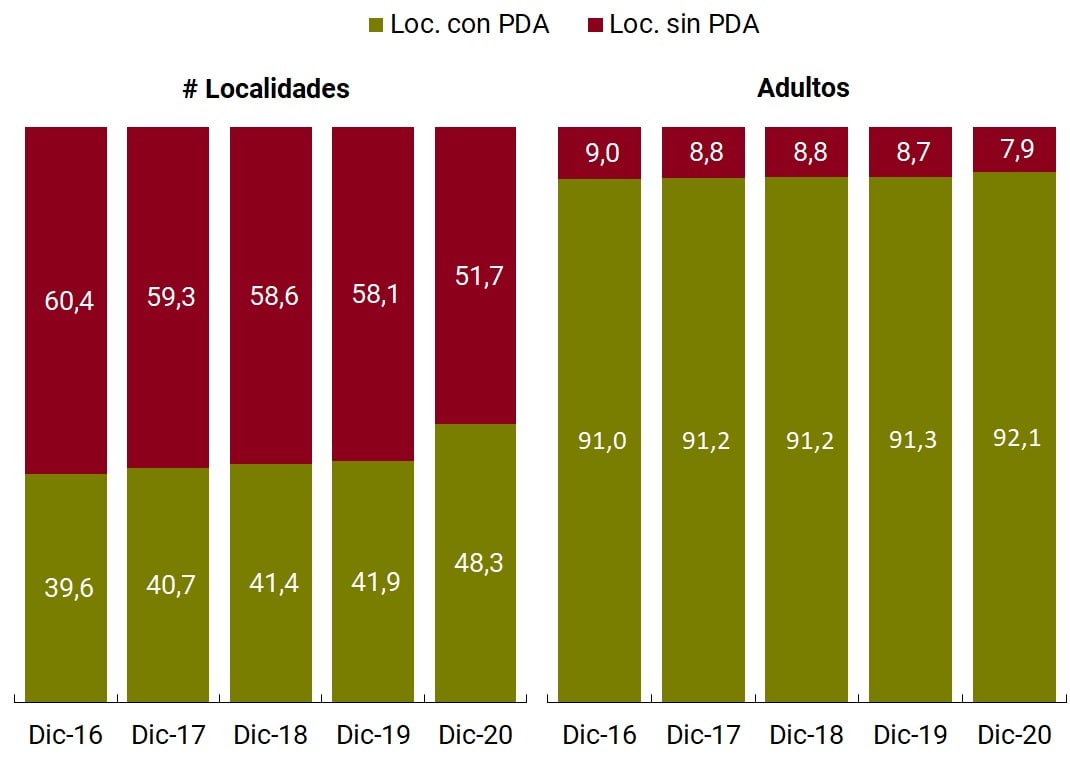
During 2020, a greater capillarity of the financial system was achieved | The indicator of localities with at least one point of access to financial services went from 41.9% in December 2019 to 48.3% in the same month of 2020. Public banks – with considerably larger presence than private banks in terms of branches and ATMs, and particularly in smaller towns – demonstrated net creation of all types of access points, while private banks recorded closures of ATMs, self-service terminals and branches in the country and an expansion in complementary financial services agencies.
Bank account coverage reached 91% of the adult population | More than 31 million people had at least one bank account at the end of 2020. Although this proportion was already at relatively high values compared to other countries with a similar income level, the record opening of more than 5 million bank accounts during the second quarter of 2020 – mostly for the accreditation of social assistance programs implemented for the most vulnerable population – meant that 3 million new people were able to access this instrument. achieving figures comparable to developed economies.
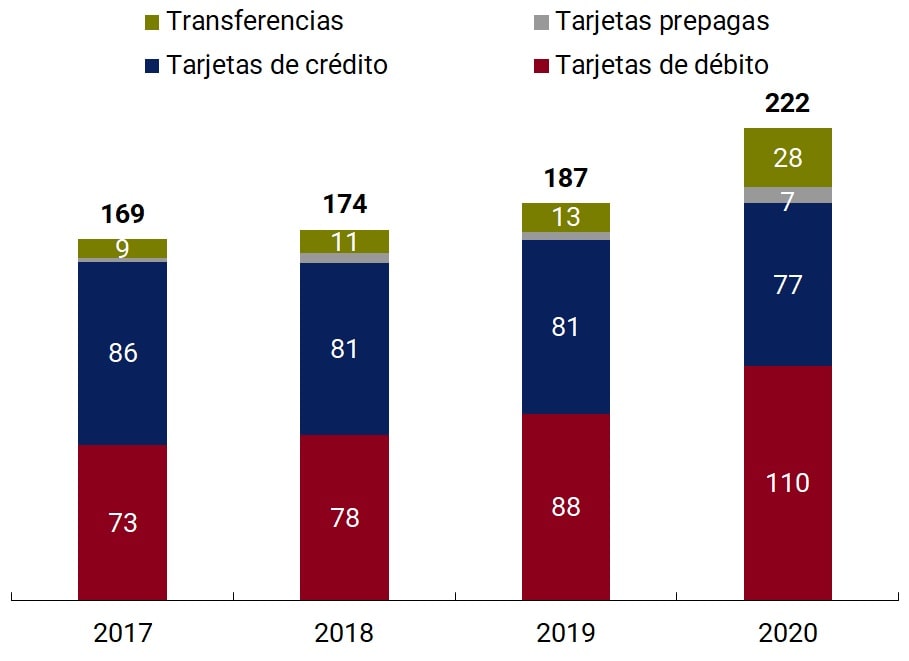
The COVID-19 pandemic and the need for social distancing have put a spotlight on electronic means of payment | In 2020, for every 100 cash withdrawals per adult, more than twice as many transactions were carried out by electronic means of payment (222, 19% more than in 2019), which are broken down into 110 with debit cards, 77 with credit cards, 28 electronic transfers and 7 with prepaid cards.
Remote payments have brought great dynamism to electronic means of payment | Electronic transfers per adult increased their volume by 90% in 2020, through the greater channeling of operations through home banking (86%) and mobile banking (167%), while remote payments with debit cards grew by 227% in the same period, expanding their share by 15 p.p. in the total payments with this instrument.
The massive opening of accounts for transactional purposes associated with social assistance led to a reduction in the ratio of fixed-term loans to bank account holders | At the end of 2020, an average value of 10.5 fixed terms per 100 bank account holders was recorded, which is below the average of the last two years (11.5). However, in terms of amounts invested, it should be noted that during 2020, the balance of fixed terms of individuals in local currency registered an increase of 9.3% in real terms, while fixed terms in the non-financial private sector registered an increase of close to 30%, with those of the UVA-pre-cancelable rate also gaining greater dynamism.
In the first ten months of 2020, the percentage of the adult population with at least one financing fell at a faster rate than in the same period of 2019 | The drop was steeper for non-financial credit providers. However, there is evidence of a significant slowdown in the reduction of the average balance per debtor, demonstrating that, in terms of balances financed, due to the credit stimuli implemented by the National Government, the financial system had a more favorable performance than in 2019.
Indicator Table | Financial inclusion in Argentina
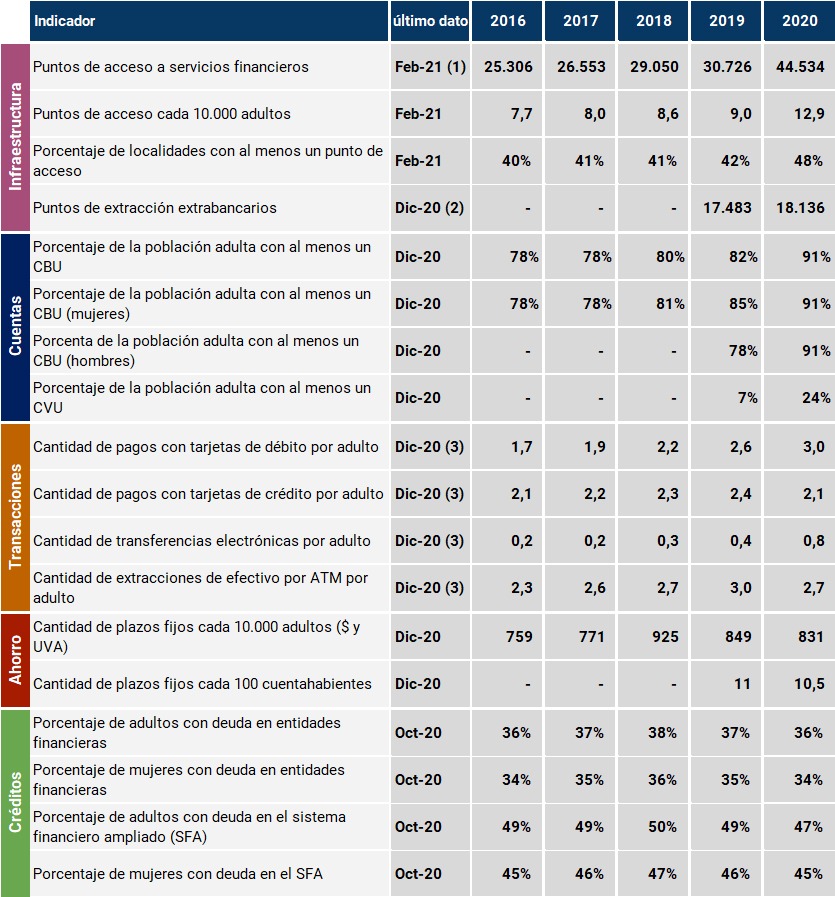
Notes:
(1) This includes access points for financial institutions (branches, mobile branches, ATMs, self-service terminals and complementary financial services agencies) and ATMs operated by non-financial institutions.
(2) Based on the information available, it is estimated that 50% of the points identified correspond to extra-bank collection networks, which could overlap with complementary financial services agencies, while the remaining 50% are businesses. See Methodological Note for more details on the construction of the indicator.
(3) Monthly average for each year.
To consult the historical series of the indicators, see Financial Inclusion Indicators.
Local context
Since the last edition of the Financial Inclusion Report, the local context has been marked by a relaxation of restrictions on movement, which allowed a recovery in economic activity in relation to the onset of the health crisis. In terms of financial inclusion, the BCRA’s measures sought to continue cushioning the effects of the COVID-19 pandemic on the population and MSMEs and to expand the scope of financial services to all segments of society. Likewise, the Financial Inclusion Coordination Council, an instance that articulates public policies in the matter between different areas of the State, approved in December 2020 the new National Strategy for Financial Inclusion 2020-2023.
The global context was marked by measures with the same objectives, which were shared by most countries. The main initiatives consisted of emergency cash transfers to the most affected segments1 through the financial system network and credit support measures for MSMEs and individuals. The first of these involved the opening of new bank accounts for those who did not have a relationship with the financial system. The second took the form of extraordinary lines of credit, the granting of guarantees, the deferral of the repayment of principal and interest, in the case of companies, and relief in the payment of credit cards, including a reduction in interest rates, in the case of individuals. 2
Likewise, at the global level, the importance of having financial systems that guarantee adequate access to and use of financial services was evidenced. The need to operate remotely has put digital financial services in the spotlight, promoting their use and marking a change in the transactional behaviors of the world’s population. While there is consensus on the advantages of digital financial inclusion, mainly for vulnerable and remote populations, both developed and developing economies recognize the risks and challenges associated with its rapid growth, such as the lack of digital skills, those related to cyberattacks and digital fraud, and the absence of internet connection infrastructure.
In this sense, following the global trend during the pandemic, the Argentine population further deepened the use of electronic means of payment, with a great boost from remote payments, and registered a reduction in the number of cash withdrawals for the first time in recent years. Electronic transfers per adult increased their volume by 90% in 2020, through the greater channeling of operations through home banking and mobile banking, while remote payments with debit cards grew by 227% in the same period, expanding their participation by 15 p.p. in the total payments with this instrument. Thus, in 2020, for every 100 cash withdrawals per adult, more than twice as many transactions were carried out by electronic means of payment.
In parallel, in order to continue promoting electronic payments, the BCRA approved the Payments with Transfer3 program that began in December 2020 and will continue its progressive implementation until November 2021. This scheme seeks to expand the scope of immediate transfers and is based on an interoperable (bank and non-bank accounts), immediate (merchants will receive automatic accreditation) and flexible (cards, QR codes, biometrics) digital payment ecosystem, among other aspects.
The aforementioned increase in the transactionality of electronic means of payment was supported by the almost universal penetration of bank accounts in the adult population. Although the Argentine financial system was characterized by a high number of bank accounts prior to the pandemic, during the second quarter of 2020, some 3 million people joined the financial system by accessing a bank account, reaching 91% of the adult population. This increase in the holding of bank accounts had as its main explanatory factor the transfers of income made by the National Government to the individuals most affected by the context.
In addition, the performance of account tenure offered by payment service providers was remarkable, registering more than 8 million people with at least this type of instrument as of December 2020, equivalent to 24% of the adult population. The effect of the health crisis caused, as with bank accounts, a significant jump in their rate of change during the first and second quarters of 2020 (51% and 55%, equal to 1.2 and 2 million new holders, respectively).
On the other hand, the geographical coverage of financial services experienced a significant improvement during 2020. The number of localities with at least one point of access to financial services went from 41.9% in December 2019 to 48.3% in December 2020, reaching 92.1% of the adult population4. Although there is a growth in complementary financial services agencies, only 2% were located in localities that previously did not register any access point. Thus, although they provide additional points of attention, as documented in the November 2020 Financial Inclusion Report, these are not necessarily being opened in the localities with the most vulnerable populations, whose attention is still mostly assumed by public entities through branches, ATMs and self-service terminals. It can also be observed that private banks closed ATMs, self-service terminals and branches, while public banks registered openings of these points.
To facilitate the use of ATMs, it was established that they must have fingerprint readers so that users can choose to validate their identity with this biometric data5. It was also provided that financial institutions that delegate their operations to complementary financial services agencies must have prior authorization from the BCRA. This measure seeks to increase and improve the provision of services by financial institutions and promote financial inclusion, reaching in particular the most vulnerable populations and underserved localities, without neglecting the standards of security and protection of the rights of financial users. 6
In terms of access to credit for individuals, during 2020 the trend that began in 2019 continued to reduce the percentage of the adult population with at least one loan. Likewise, there is evidence of a significant slowdown in the reduction of the average balance per debtor compared to 2019, mainly linked to credit card assistance and, to a lesser extent, to personal loans. To cushion the impact of the pandemic on credit, the BCRA maintained the relaxation of the debtor classification criteria established in the first stage of the necessary isolation and extended the current loan payment conditions and the maximum limits on credit card interest rates. 7
Recently, the BCRA approved a stimulus policy to promote financial inclusion through the promotion of credit and the use of electronic means of payment, as well as to improve the operation and geographical distribution of ATMs. The measure focuses on: (i) expanding credit to individuals and MSMEs that currently do not have loans granted by financial institutions; (ii) promote the use of the electronic check (ECHEQ) and the Electronic Credit Invoice; (iii) encourage the use of electronic means of payment associated with demand accounts in pesos whose holders are individuals; and (iv) improve the operability of ATMs to reduce the time they are out of service and extend the network to unprotected areas and cities and towns where service is not provided. The incentives will be channeled through different franchises that allow unpaid reserve requirements to be reduced to the extent that they reach the parameters established in the new regulation. 8
In terms of financial education, the BCRA together with the Ministry of Education of the Nation have been implementing a Digital Financial Education Campaign9 that seeks to expand the financial knowledge of families through video tutorials on the use of means of payment and electronic channels, financial planning, among other topics. In addition, the BCRA conducted Virtual Training forTeachers in 10 provinces (Catamarca, San Luis and Neuquén) and is working on the development and implementation of federal educational programs, with the aim of bringing financial education to the entire country and, at the same time, promoting greater financial inclusion of the most vulnerable sectors.
The BCRA also continues to promote actions aimed at promoting, developing, and implementing policies that respect rights, gender, diversity, and equality in the financial system. In this regard, it is worth noting the measure adopted to eradicate gender-based violence and discrimination in the advertising of financial institutions11 and the training on financial tools for women State workers developed in collaboration with the Ministry of Economy of the Nation and the National Securities Commission12. In this regard, Section 2 of this report presents as a novelty an analysis of the holding of bank accounts and Payment Service Providers disaggregated by gender, while Section 3 on credit continues to analyze the use of financing by individuals with a gender perspective.
1. Financial infrastructure
Financial infrastructure plays a fundamental role in the access of people and companies to the financial system, providing face-to-face and electronic service channels for carrying out operations. In the context of the COVID-19 pandemic, the importance of having a financial system that allows the population to access and make use of financial services quickly and safely became even more evident.
Since the last publication of the Financial Inclusion Report (FIR), the BCRA has implemented a series of regulations aimed at facilitating access to financial services. On the one hand, with the aim of reducing barriers to the use of ATMs, it was established that they must have fingerprint readers so that users can choose to validate their identity with this biometric data13. In this way, people will be able to use their fingerprint and their ID card or personal code (PIN) to carry out transactions, instead of using a debit card.
On the other hand, it was provided that financial institutions (EEFF) that delegate the attention of their customers and the general public to complementary financial services agencies (ACSF) must have prior authorization from the BCRA14. This measure seeks to increase and improve the provision of services by financial institutions (EEFF) in general and promote financial inclusion, reaching in particular the most vulnerable populations and underserved localities, without neglecting the standards of security and protection of the rights of financial users.
a. Evolution of access points to financial services (PDAs). During 2020, the total number of financial service access points (PDAs) showed an increase of 45%, far exceeding the growth of previous years, which was between 5% and 9% year-on-year since 2017. The incorporation of the figure of complementary financial services agencies (ACSF) at the end of 2018 had its greatest impact during 2020, in which the delegation of banking operations was recorded at more than 12,000 points.
In a context marked by the consequences of the COVID-19 pandemic, branches, ATMs and self-service terminals (TAS) had a mixed performance. Within the set of electronic devices, ATMs, which bring together banking and non-banking devices, slowed down their growth rate compared to previous years, registering an increase of 2% in 2020, while self-service terminals (TAS) demonstrated growth of around 10%15. On the other hand, branches suffered a fall of 0.6% year-on-year, continuing with the phenomenon of reduction of branches at the global level16.
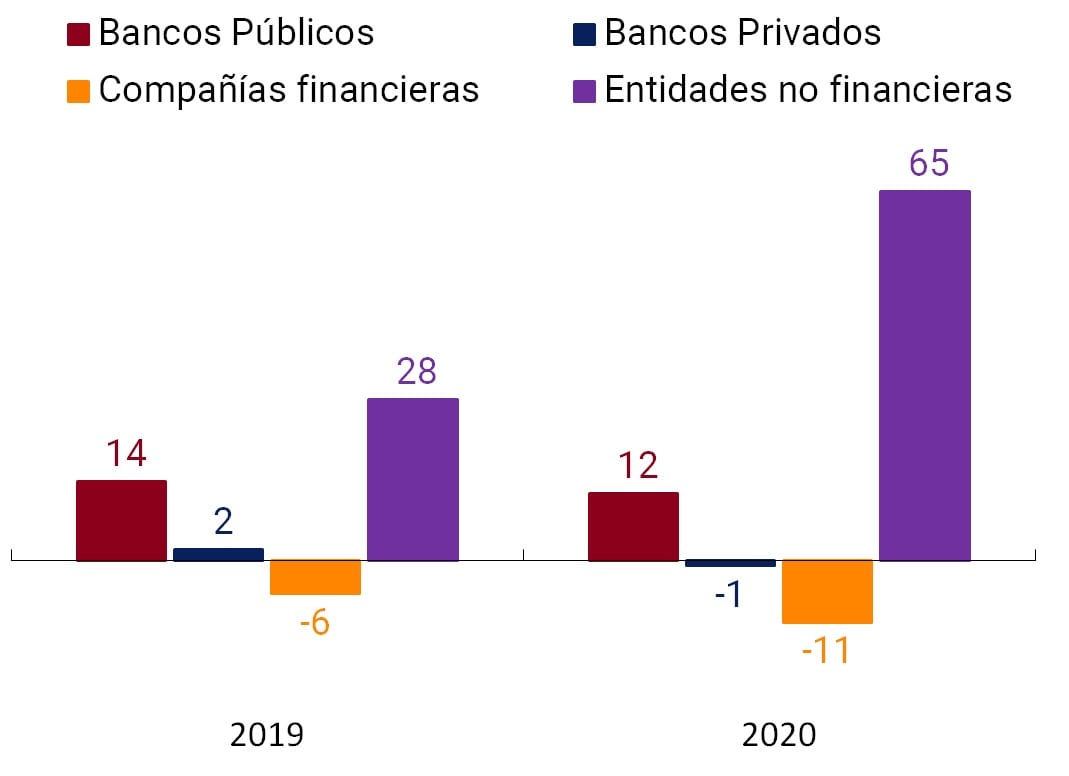
Of the total number of PDAs, 76.6% correspond to private banks, 22% to public banks and 0.4% to financial companies. Non-financial institutions, which operate non-bank ATMs, have been increasing their participation since the incorporation of this figure into the financial system in 201617, reaching a total of 492 devices in 2021 (1% of the total number of PDAs). This institutional group is the one that reports, together with private banks, the highest growth during 2020, reaching an increase of 65% for non-financial entities and 82% for private banks.
Graph 1 | Financial Services Access Points
PDA by Type
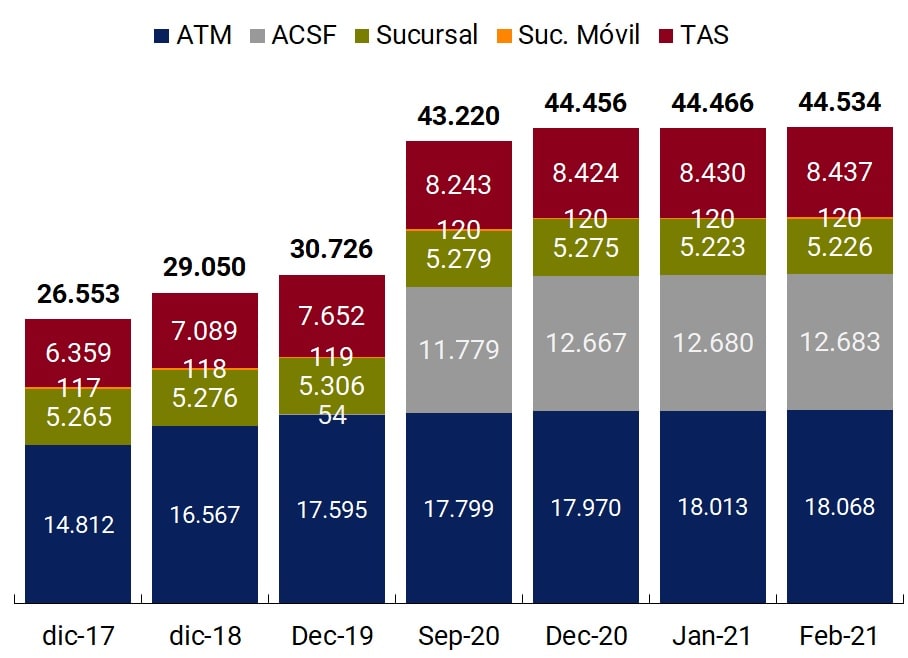
Var. A.I. by group (%)
.jpeg)
Var. a.i. per group without ACSF (%)
Note | The ATM category includes bank and non-bank ATMs. “Non-financial entities” includes companies that operate non-bank ATMs.
Source | BCRA and networks.
If the analysis of behavior at the institutional level is deepened, it can be seen that during 2020 private banks have chosen the figure of ACSF to expand their presence throughout the territory, while they registered a reduction of 1% for ATMs, 0.6% for TAS and 1.2% for branches. It should be noted that the bulk of the ACSFs offer operations that are mainly concentrated on the withdrawal and deposit of cash and the payment of services and loans, and to a lesser extent on the opening of accounts to new users, the constitution of fixed terms or the granting of credits.
Public banks, on the other hand, registered an increase of 4.5% in ATMs, 95.2% in TAS and 0.4% in branches, while ACSFs went from 20 units enabled in December 2019 to 54 in December 2020. In this way, this institutional group demonstrates the net creation of all types of ADPs.
Although the ACSFs provide additional points of attention, as documented in the last Financial Inclusion Report18, they are not necessarily being opened in the localities with the most vulnerable populations, whose attention continues to be mostly assumed by public financial institutions through branches, ATMs and TAS.
In terms of location, of the more than 12 thousand ACSFs that were enabled during 2020, only 2% were located in localities that previously did not register any PDA. In this way, it can be seen that the bulk of the ACSF came to complement the supply of FLW in localities already covered. In this context, it was established that as of December 2020, for the authorization of new ACSFs, financial institutions (EEFF) must have the authorization of the BCRA, which will analyze the existence of branches in the localities, among other aspects. Through agencies located in shops (such as stores and pharmacies) or in extra-bank collection networks, financial services could be brought closer to more remote populations and thus achieve a more inclusive financial system. However, this potential does not seem to be being fully exploited as ACSFs have tended to overlap and replace other pre-existing points of care. Thus, the BCRA will closely monitor the impact that the opening of ACSF may have on the evolution of other types of ADPs, as well as on the characteristics and conditions of care of the population served through them.
Map 1 | PDA per 10,000 adults per department
December-19
December-20
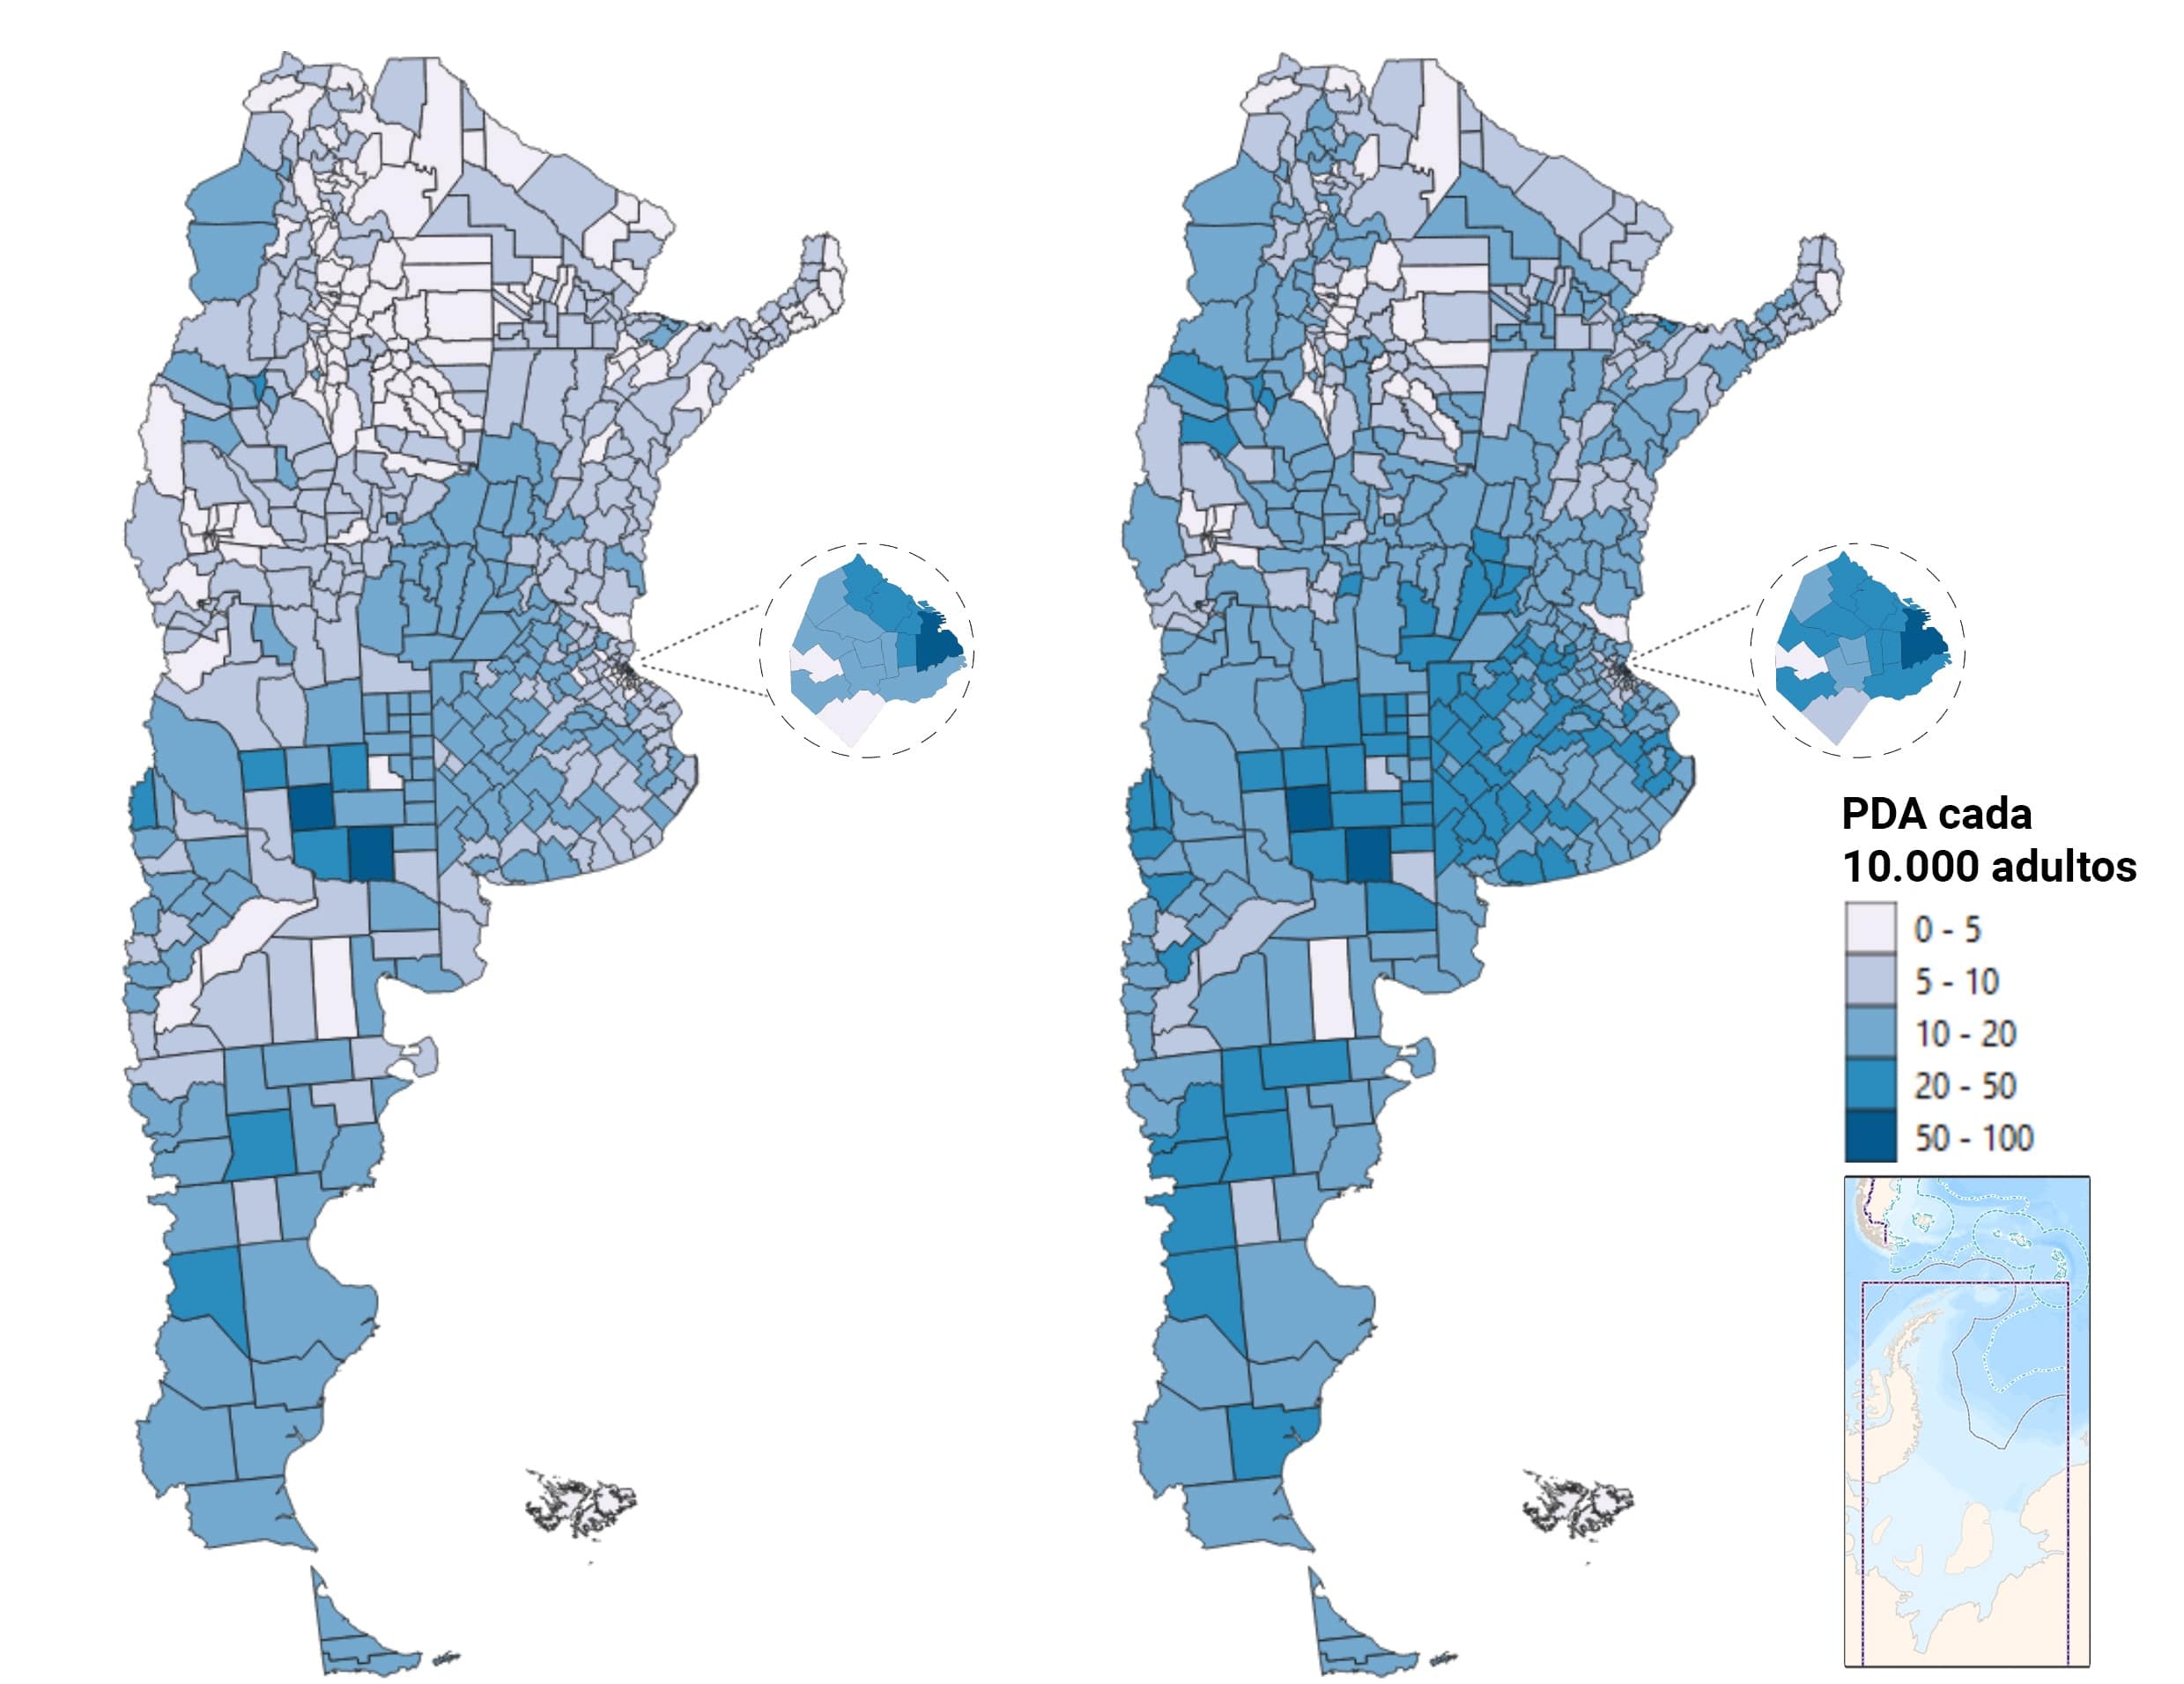
Source | BCRA, networks and INDEC.
In previous editions of the Financial Inclusion Report (FIR), it was shown that the level of coverage of localities increases with the number of adult population that lives in them. In this way, localities with a greater number of inhabitants tend to have a greater number of PDAs. Deepening this line of analysis, it is also observed that localities with more population have a greater variety of FLW. The presence of different types of PDAs impacts the quality of coverage, given that they offer differentiated services and transactions. Likewise, the time availability varies with the type (branches, ATMs, TAS, ACSF or mobile branches) and the location (inside or outside branches) of the PDAs, while access through electronic devices differs from that of branches and ACSF due to the attention of personnel. All of these factors cause the quality of infrastructure coverage to vary with the types of PDAs and the way they are combined.
The results of this analysis show that all localities with more than 100 thousand inhabitants offer their population at least four types of ADP. Although these localities represent 2% of the total localities in the country, they concentrate 56% of the adult population, indicating that 19 million adult inhabitants live in localities with a high variety of FLW. On the other side of the spectrum are localities with less than 5 thousand adult inhabitants, among which localities without PDA or with less varied PDA configurations take a greater relative proportion.
Graph 2 | Coverage of localities
Localities and adults
Localities according to coverage of types of PDAs
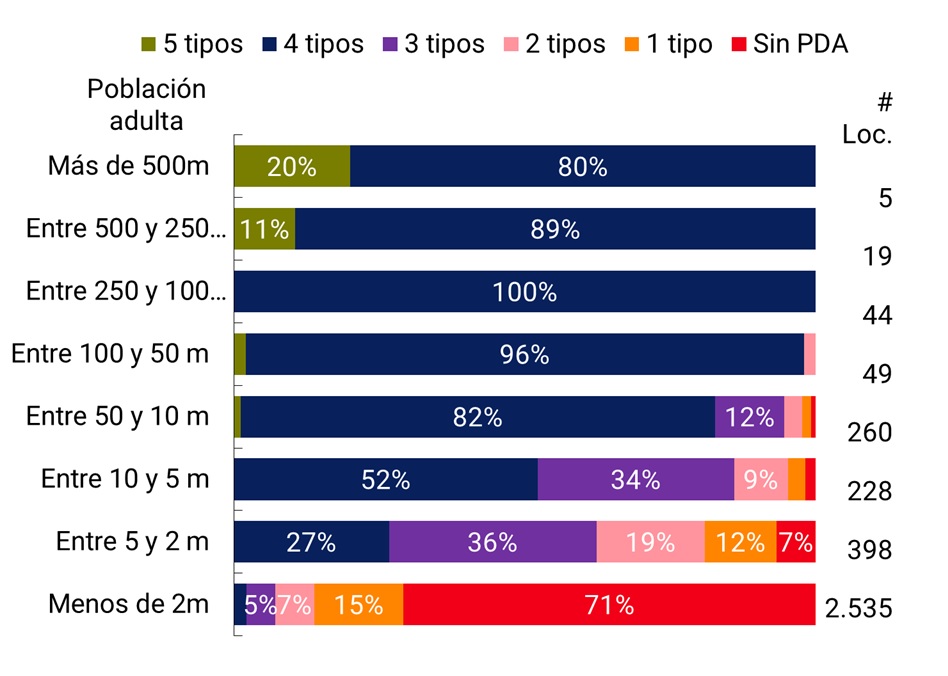
Note | Values expressed as a percentage. m = thousand. Data from the graph on the right as of Dec-20.
Source | BCRA and networks.
Analysing the level of ADP coverage by institutional group, it can be seen that the incorporation of ACSFs has considerably improved the coverage of localities by private banks, which went from having a presence in a total of 889 localities in December 2019 to 1,553 in December 2020. In this sense, the coverage by the ACSF of a significant number of low-population localities (less than 10 thousand adults) is highlighted. On the other hand, although, as mentioned above, private banks show a slight net drop in their number of branches, ATMs and TAS, this did not negatively affect the coverage of localities but there was a slight increase in coverage for all types of PDAs.
In relation to public banks, it is observed that during 2020 these entities also improved their level of coverage for ATMs, TAS and ACSFs, while the number of localities with at least one branch remained unchanged. At this point, it should be noted that public banks register a considerably greater presence than private banks in terms of branches and ATMs. As can be seen in Table 1, this phenomenon increases as the adult population of the localities decreases, confirming the social function carried out by public financial institutions and their leading role in the care of vulnerable populations with a diversity of services and security conditions superior to those of the ACSF.
On the other hand, the growth in the coverage of non-financial institutions stands out, which with their non-bank ATMs have increased their presence at the locality level by 47% during 2020. These devices, which are usually located in service stations and shops, contribute to increasing the capillarity of the financial infrastructure and achieving a more efficient use of cash.
Table 1 | Number of localities with at least one ADP per type and institutional group.jpeg)
Note | m = thousand. Data as of Dec-20.
Source | BCRA, networks and INDEC.
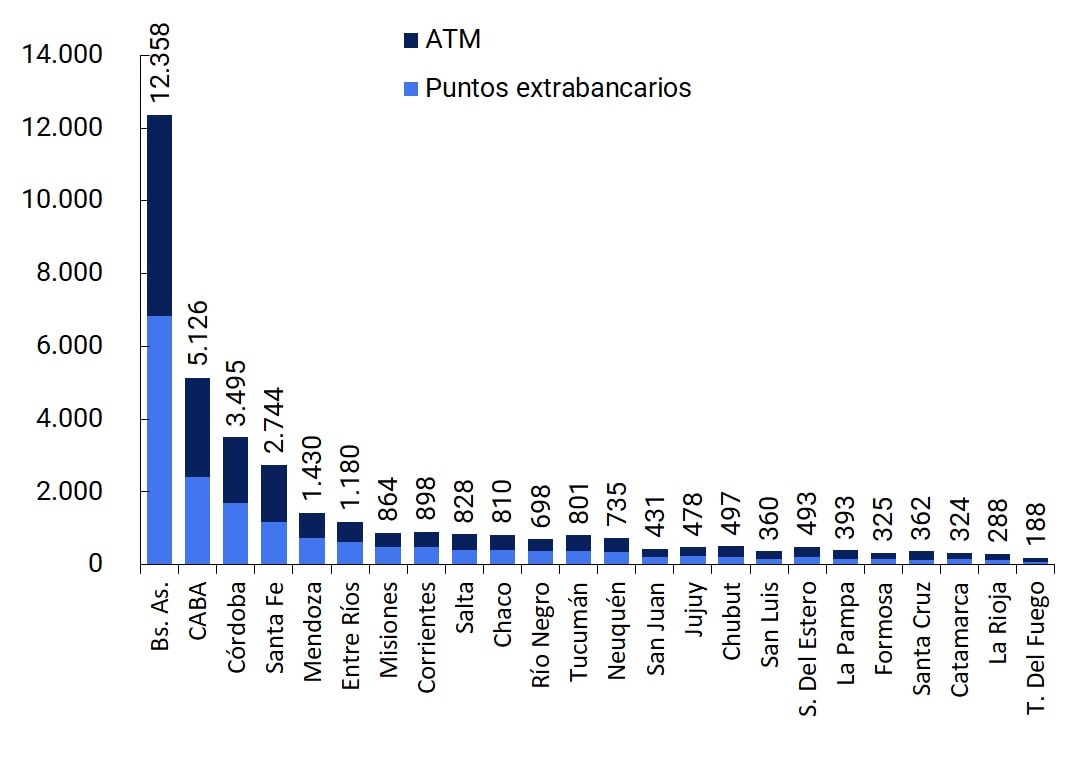
b. Non-bank withdrawal points. In addition to the access points (PDAs), there are alternative channels located in shops (supermarkets, service stations and pharmacies, among others) and extra-bank collection networks that provide cash withdrawal services. These non-bank withdrawal points complemented automated teller machines (ATMs) and complementary financial services agencies (ACSFs) in providing cash to the population during isolation and social distancing.
As of December 2020, there were 18 thousand businesses, 19 in which the population could withdraw cash. This system gave people the possibility of withdrawing cash simultaneously with the purchase with a debit card in a store, contributing to the decongestion of bank withdrawal points and efficiency in cash management. In this sense, this system allows for a more efficient use of cash, attentive to the fact that it allows businesses to reduce the risks and costs related to the handling of physical money.
The provincial distribution of non-bank withdrawal points is similar to that of ATMs and ACSFs, with 67% of the total concentrated between CABA, Buenos Aires, Córdoba and Santa Fe. In 7 of the 24 provinces, the number of extra-bank points exceeds that of ATMs, while in the rest of the jurisdictions they represent, on average, 80% of the total of these devices.
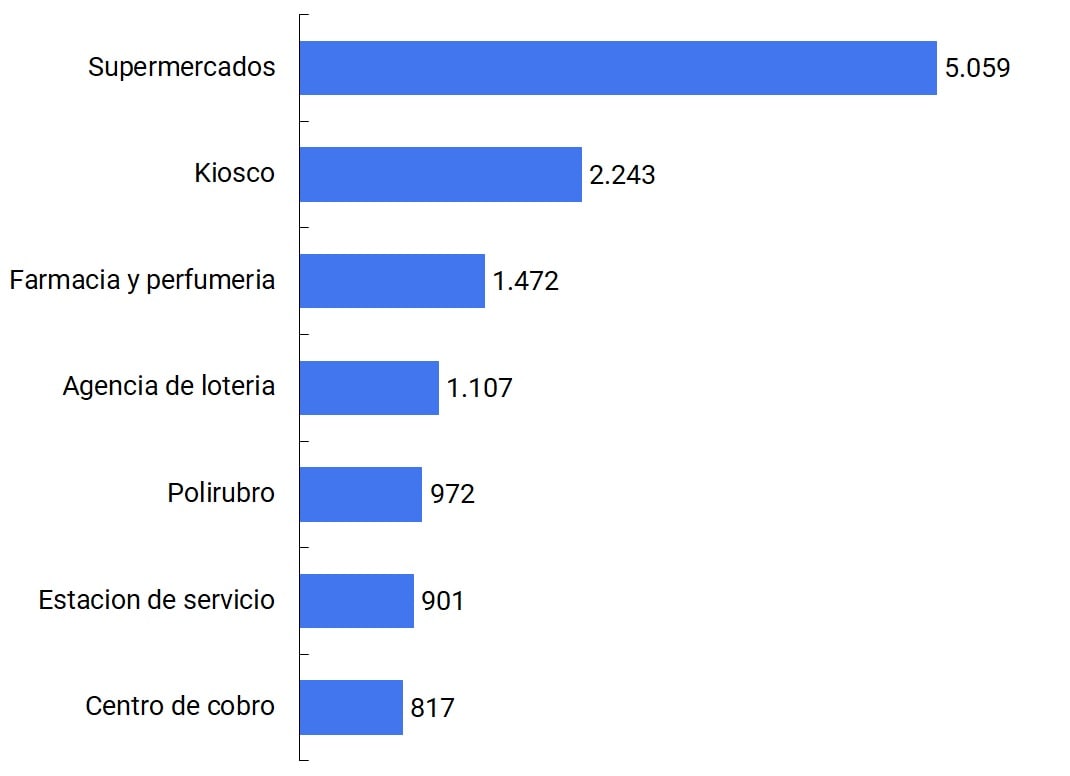
In relation to the types of businesses, the main items identified are supermarkets (28% of the total), kiosks (12%) and pharmacies and perfumeries (8%). It should be considered that some of these were not considered essential during the pandemic, which meant that, in order to reduce the risks of contagion, they were closed during the most restrictive stages of social isolation. In this way, the availability of shops where cash could be withdrawn was reduced, while those that remained open saw a drop in the number of people who visited them due to the lower circulation of people. These factors affected the amount and amount of trades, as described in Section 2.2.
Graph 3 | Extra-bank withdrawal points
Extra-bank points and ATMs by provinces
Points of the main items
Note | Data as of Dec-20. The breakdown by item shows the main items identified, but does not cover all the points.
Source | BCRA survey based on data from Fiserv, Cabal, Prisma, Rapipago, Pagofácil, Cobro Express, Multipago, Pago24, Provincia Net and Bica Agile.ados in percentage. m = thousand. Data from the graph on the right as of Dec-20.
c. Connectivity. In addition to the physical service points offered by financial institutions (EEFF) to their customers, there are electronic channels. Internet banking (or home banking) and mobile banking (or mobile banking) have shown great growth in recent years and play a fundamental role in bringing the population closer to digital financial services. Through these channels, users can carry out a variety of operations, such as transfers (see Section 2.2.), payment of services, loan registrations or the constitution of investments. The digitization of financial transactions was a key factor in mitigating the consequences of the pandemic and the consequent reduction in people’s mobility.
Although digital financial services have great potential to increase the level of financial inclusion of the population, access to electronic channels is conditioned by different factors, related both to the possession of electronic devices (computers, tablets or cell phones) and the availability of internet connectivity, as well as to the population’s ability to use these devices. Considering that the Internet access infrastructure does not present the same level of development throughout the Argentine territory, and considering it as a necessary condition for access to digital financial services, it is convenient to monitor the availability of connectivity at the local level.
In this sense, it was determined that 80% of the country’s localities report some type of internet connectivity (fixed, mobile or both)20, in which 97% of the population lives. In this way, it is evident that 3% of the adult population of our country resides in localities for which no type of connection (fixed or mobile) to the Internet is reported.
Figure 4 | Localities that report Internet connectivity
Percentage of seats
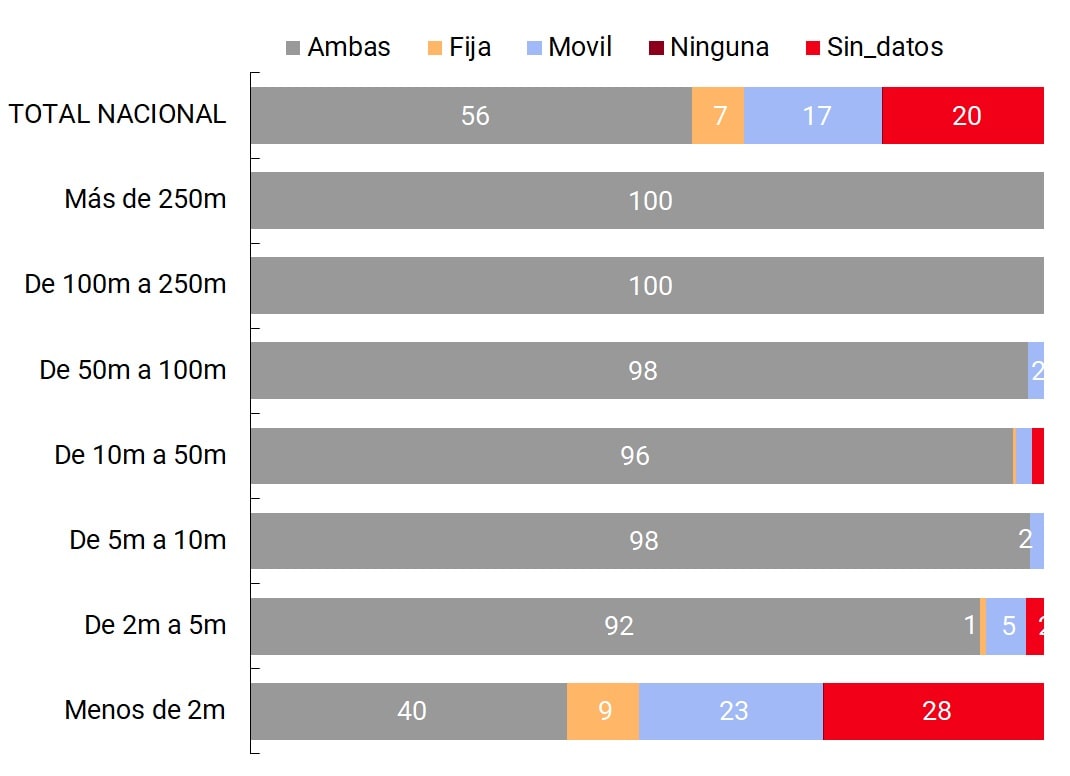
Percentage of adults
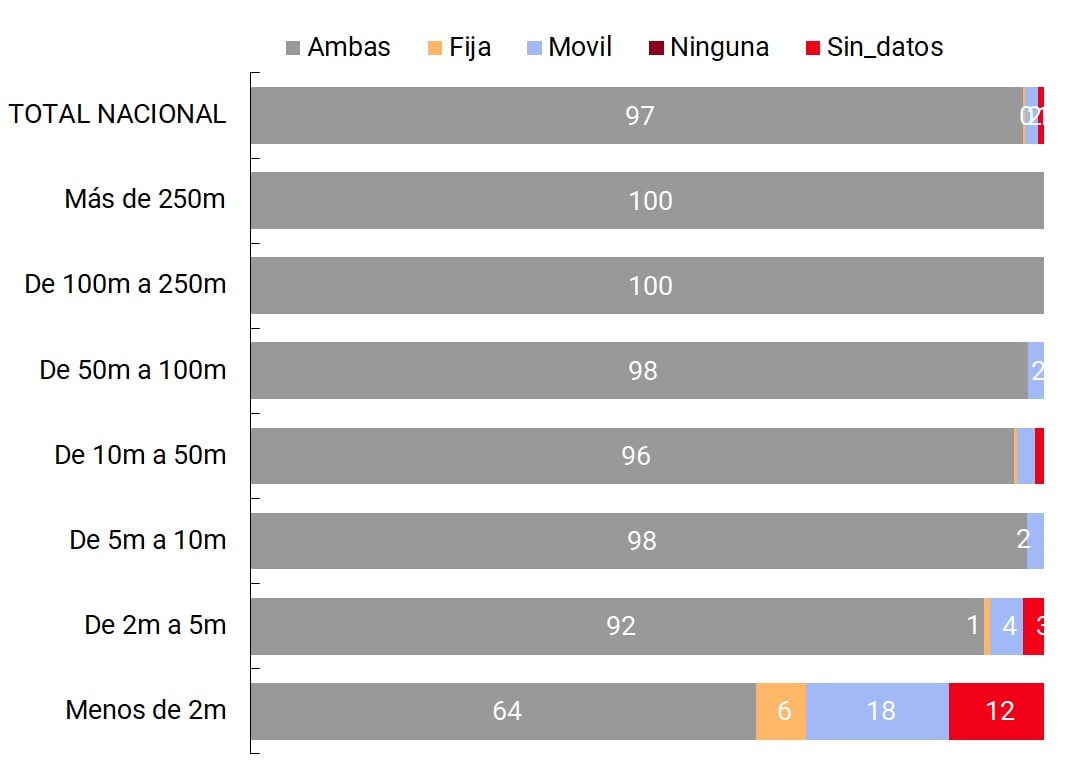
Note | Data as of Dec-20.
Source | BCRA and ENACOM.
This extension of connectivity is a key fact given that, especially for small populations far from urban centers that do not have access points (PDAs), access to the internet allows people to get closer to financial services without the need to travel to a locality with PDAs. In this sense, relating PDA coverage to internet connectivity, it is observed that 64% of the localities that do not have PDAs (1,164 localities) have internet connectivity (either fixed, mobile or both) so residents could interact with the financial system through their electronic devices.
Although there are other factors to consider, such as the quality of connection, the possession of devices and the technological capabilities of the population, the connectivity availability data show the great potential of electronic channels to increase access to and use of financial services by the population, especially those who reside in localities with less physical infrastructure.
2. Deposit accounts and payment and savings methods
The possession of a bank or non-bank account21 as a percentage of the adult population is one of the most widely used indicators to measure the degree of financial inclusion in a jurisdiction. This metric is used globally to define the set of people included and excluded from financial services, although access to an account does not imply automatic or habitual use; In other words, the challenges of financial inclusion persist from the point of view of savings and credit opportunities.
Measuring them is challenging given that countries generally do not have supply data on account tenure and often rely on demand surveys. Local or international surveys of this type have the advantage of obtaining the direct perception of the people but lose precision due to the subjectivity of the answers.
This Financial Inclusion Report (FIR) presents for the first time a complete x-ray of account holding in Argentina based on supply data provided by the Electronic Clearing House (COELSA)22. The processing of this new database and its cross-referencing with other available BCRA databases allows us to show a comprehensive overview of the people who have accounts in our country, depending on whether they are bank or non-bank and depending on the gender, age and geographical location of their holder.
Graph 5 | Bank and non-bank account tenure
Adult population with at least one account
-in percentage-
People with only one type of account or both—in millions
—
Note | Left graph: (a) At least one CBU: holders of at least one bank account – they may own more than one bank account and non-bank accounts; (b) At least one CVU: similar clarification to CBU; and (c) CBU and CVU: persons who have at least one bank and one non-bank account.
Source | COELSA, INDEC and BCRA.
2.1. Bank and non-bank
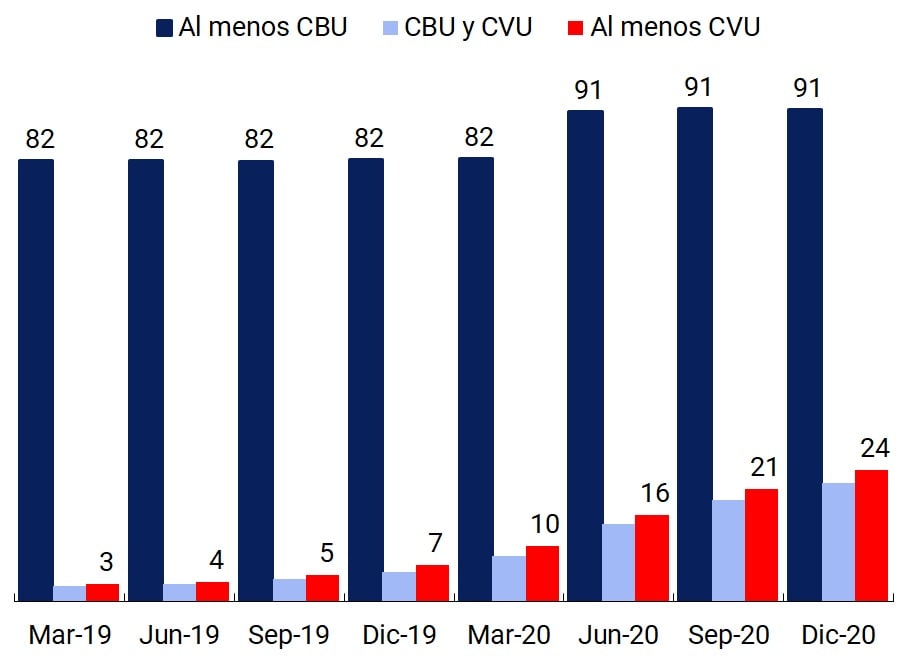
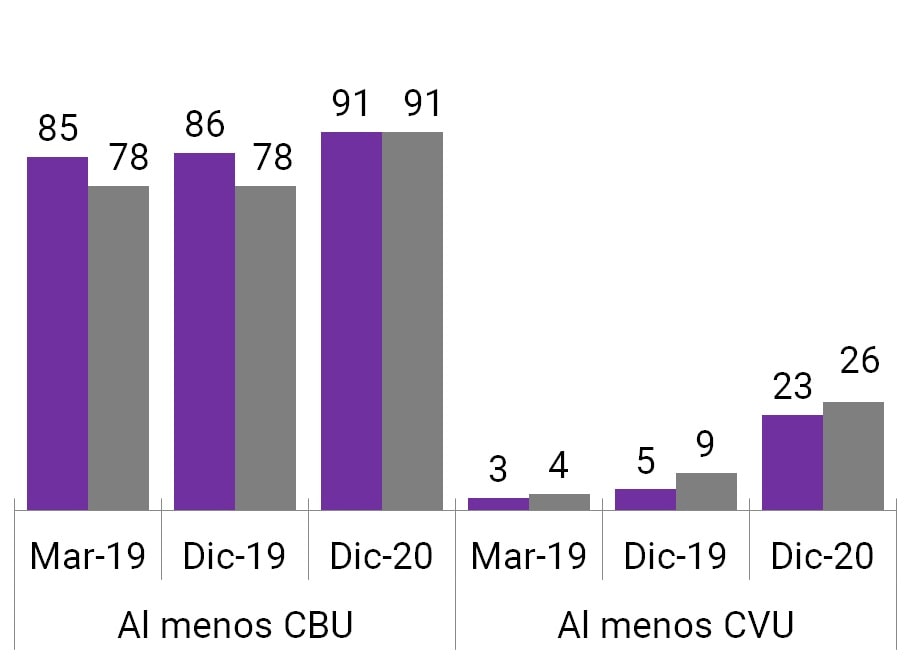
accounts Bank account penetration reached 91% of the adult population in December 2020, which means that more than 31 million people had at least one bank account. At the beginning of 2019, this proportion was relatively high compared to other countries with a similar income level. However, the record opening of more than 5 million bank accounts during the second quarter of 2020 explains the 9 p.p. increase observed between March and June 2020 (just over 3 million people), which made it possible to achieve levels comparable to those of developed economies23. Most of these accounts were opened to channel the National Government’s income transfers in order to mitigate the effects of the pandemic and the need to use financial services during social distancing.
In addition, the performance of account tenure offered by payment service providers (PSPs) (“non-bank accounts”) is remarkable, with figures that went from 3% of the adult population in March 2019 to 24% in December 2020 (more than 8 million people). Although its growth has been distributed over all quarters, the effect of the health crisis caused, as with bank accounts, a significant jump in its rate of change during the first and second quarters of 2020 (51% and 55%, 1.2 and 2 million new holders, respectively).
The joint possession of at least one bank account and one non-bank account has evolved along with the performance of non-bank account ownership, illustrating that banked people are the ones who have mostly chosen to add this type of account (Graph 5). Only 2% of the adult population, some 800,000 people, had only non-bank accounts at the end of 2020, of which 60% were between 15 and 24 years old. Therefore, this instrument has not had the role of promoting access for people without accounts, as has been seen in other countries24, but rather it would be a complement to the access and use of certain financial and payment services.
In terms of the average number of accounts per account holder, there is evidence of a peculiar behavior: the exclusive holders of bank accounts held more than twice as many accounts (2.6) as those who only had non-bank accounts (1.2), while the people who had both instruments owned even more (4.7). This phenomenon could be explained by the fact that it is free to open and maintain and that different incomes are channelled through bank accounts, in addition to the fact that non-bank accounts allow other transactions to be carried out, such as investment in other types of assets and e-commerce.
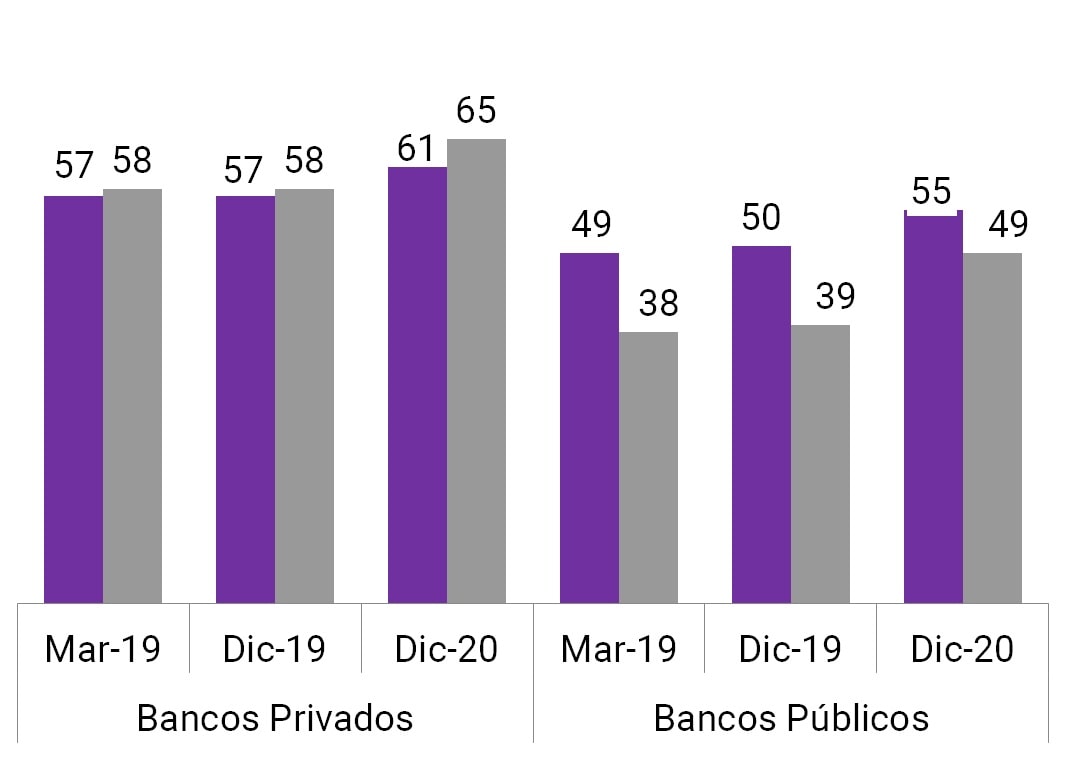
The breakdown of bank account ownership by type of financial institution25 illustrates that 2 out of 3 adults had at least one account in a private bank; while that ratio stood at 1 in 2 people for public banks at the end of 2020. The evolution in both institutional groups remained practically unchanged until June 2020, when the number of account holders grew by 13% in public banks and 9% in private banks.
For each group of banks, this implied expanding their coverage by approximately 2 million people. Financial companies – with the lowest participation – registered a strong dynamism with variation rates of 86% (almost 410,000 people) and 18% in the second and third quarters of 2020, respectively. In this way, they increased their penetration from 1%, prior to the pandemic, to 3% by the end of 2020. The average number of bank accounts per account holder referred to above is mainly explained by the behavior of private banks, which registered the highest number (2.6), followed by financial companies (1.7) together with public banks (1.6) for December 2020.
Graph 6 | Account Holding by Institutional Group and Account Type
Institutional Group
Account Type
Note | Percentage of the adult population with at least one account. In the two graphs, the sets are not exclusive. EEFF: financial institutions.
Source | COELSA, INDEC and BCRA.
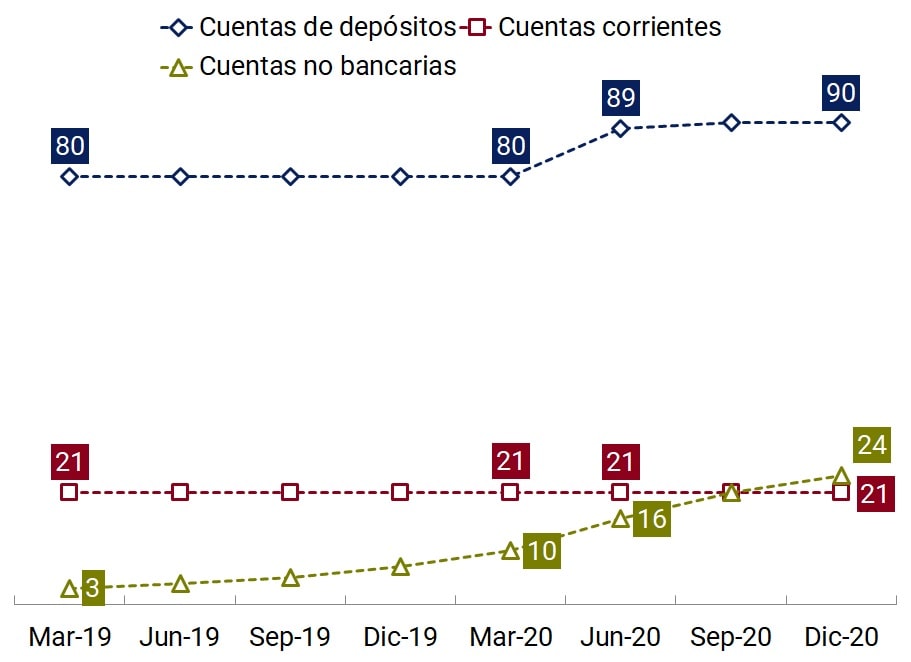
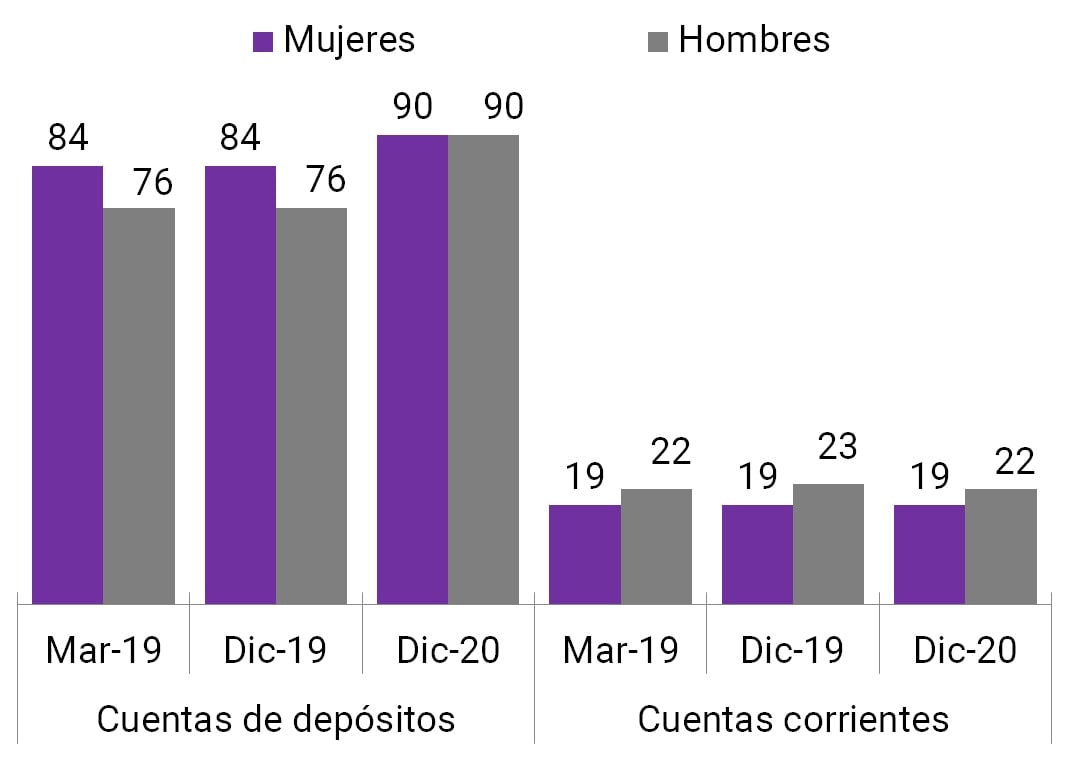
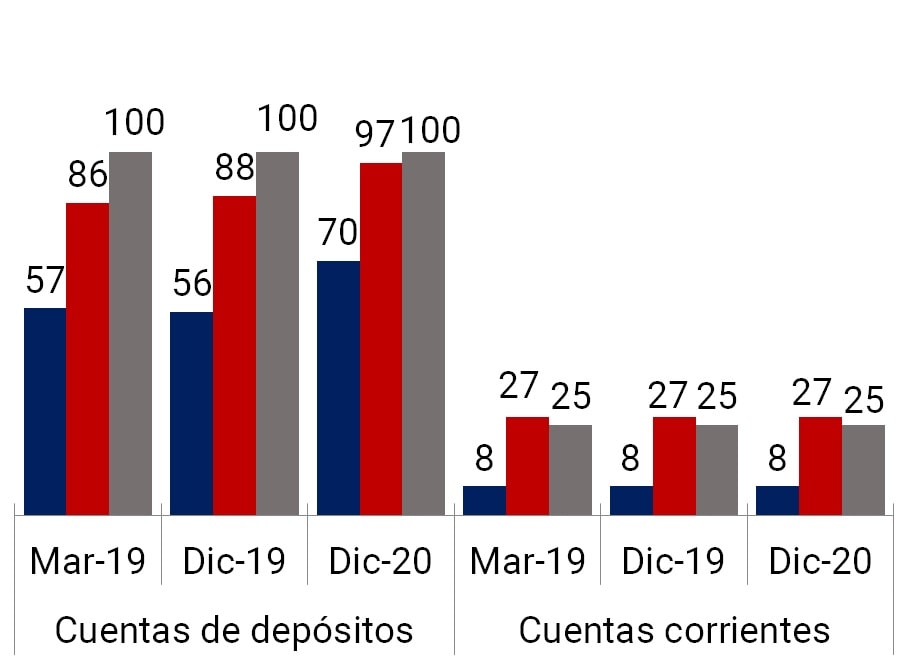
On the other hand, disaggregating the information by type of account, it is observed that at the end of 2020, 90% of the adult population had at least one deposit account, while the holding of current accounts stood at 21%, remaining unchanged during the last two years. On the other hand, deposit accounts experienced a significant increase (11.3%) between March and June 2020 as a result of the measures to mitigate the effects of the pandemic by adding new account holders.
It should be remembered that deposit accounts group those intended for the collection of income – salary, retirement, pensions and social programs – and traditional savings banks, including the universal free account. In turn, current accounts are distinguished by functioning as a financing instrument, since they allow funds to be withdrawn when there is not enough balance26. The functionalities of each type of account, together with the associated costs, are the main explanatory factors for the difference in the level of penetration of each of them.
Likewise, non-bank accounts managed to become the second type of transactional account with the highest coverage at the end of 2020. They are provided by legal entities other than financial institutions (Payment Service Providers -PSPs-) that fulfill at least one function within a retail payment scheme, such as offering payment accounts27. Customer funds credited to payment accounts must be available at all times and legally separate from the assets of PSPs. These accounts have experienced the highest growth over the last two years, mainly explained by their ease of use, the types of services offered, and the possibilities to operate remotely during the Preventive and Mandatory Social Isolation (ASPO).
a. Gender. During 2019 to March 2020, the inverted gender gap among bank account holders ranged between 7 and 8 p.p. to then reduce to 1 p.p. in June of that year and be eliminated in the following28 months, mainly explained by the behavior of the deposit account holder population.
This situation responds to the configuration of the accounts associated with the payment of retirements, pensions and social programs, which have a greater preponderance of women29. It should be noted that, historically, social programmes had women as the main holder of payment (for example, the Universal Child Allowance), an aspect that tended to increase the representation of women as bank account holders. However, the measures adopted by the National Government at the beginning of the ASPO on a transitional basis, such as the Emergency Family Income, aimed to mitigate the reduction in the income of the most vulnerable households30 but without focusing its channeling according to the gender of the affected holder.
In the case of non-bank accounts and current accounts, the proportion of men with accounts is higher than that of women. These differences would lie in the fact that women register higher levels of unemployment and informality, receive salaries – on average – lower than those of men and are overrepresented in the lowest income decile31. It should be noted that the holding of non-bank accounts and current accounts, the opening of which does not respond to the need to channel a specific income, would reflect more clearly the socioeconomic situation of women in Argentina, following the global trend32 in terms of the existence of gender gaps (See Graph 7).
The gap between people who have current accounts, which is equivalent to 3 p.p., remained unchanged throughout the period. This shows that the 9 p.p. increase in deposit account holders had a greater relative participation of men, which caused the decrease in the inverted gap to equate the percentages of the male and female population with at least one bank account and at least one deposit account.
Figure 7 | Account holdings disaggregated by gender of the account holder
Bank and non-bank accounts
Bank account type
Group of banks
Note | Percentage of population with at least one account.
Source | COELSA, INDEC and BCRA.
The disaggregation by institutional group shows that the inverted and zero gap between deposit account holders responded to the behavior observed in public banks. These entities registered a difference in favor of women of 11 p.p. at the end of 2019 and 6 p.p. at the end of 2020; while in private banks the gap has widened from 1 p.p. in 2019 to 4 p.p. in 2020 to the detriment of women. The evolution of access to non-bank accounts has exhibited a gap in all periods, which was between 2 and 4 p.p.
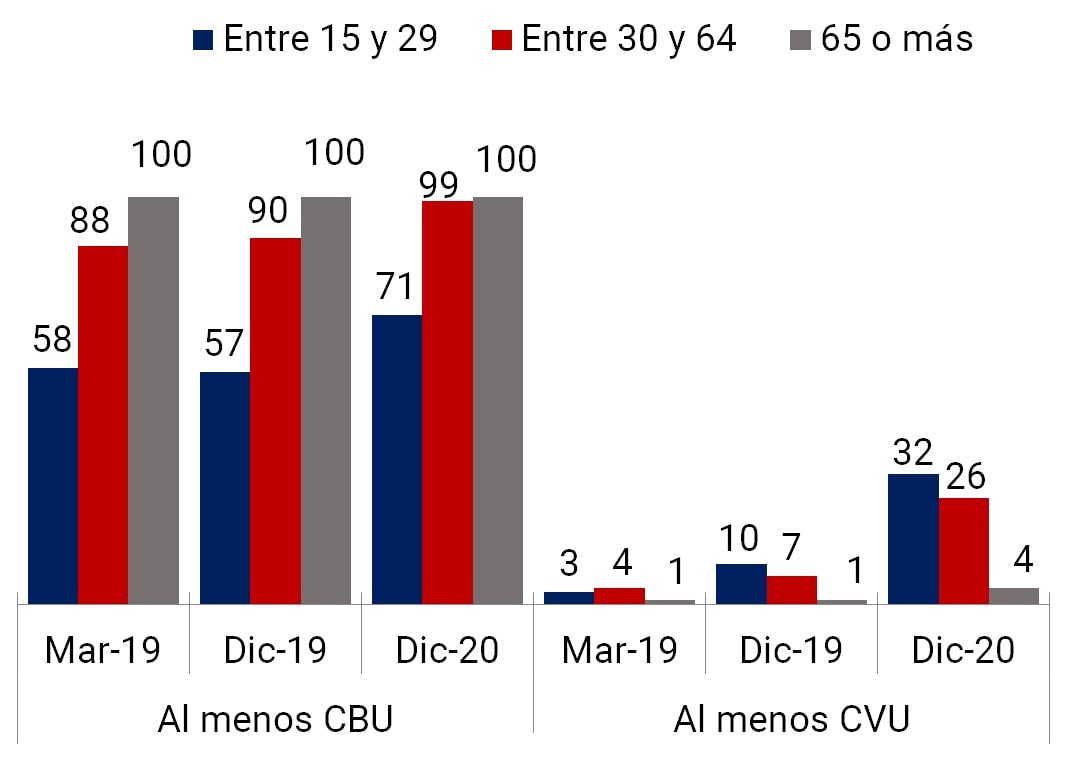
b. Age group. The age analysis illustrates a dissimilar profile between bank account holders and non-bank account holders. The coverage of the population with a bank account shows a positive relationship between age and access to this instrument. As age advances, account holding approaches full coverage33. This could be explained, once again, by the configuration of income-receiving bank accounts – salaries, retirements, pensions and social programs – which cover a significant portion of people of all age groups. On the other hand, the banking penetration induced by the pandemic had its greatest impact in the 15 to 29 age group, where the proportion of the population with a bank account had a notable increase of 14 p.p., from 57% to 71%.
On the other hand, non-bank account holders are concentrated in the younger generations34. The 15 to 29 age range reached the maximum value with respect to its population (32%) in December 2020; while only 4% of people in older ages (over 65 years old) had a non-bank account. This phenomenon would be explained by the technological feature of these accounts, which mainly operate through cell phones, the high use of these devices by the population, even more so at younger ages, together with the digital capabilities of this age group.
Figure 8 | Account Holding by Age Range
Bank and non-bank accounts
Bank account type
Group of banks
Note | Percentage of population with at least one account.
Source | COELSA, INDEC and BCRA.
The combination by gender and age range in the population with a bank account shows that the inverted gap, prior to the pandemic, was more pronounced among younger people (15 to 29 years old), probably explained by the concentration of accounts for the payment of social programs35 with a higher proportion of women. After June 2020, as previously noted, the negative gaps are reduced in the first and second age ranges as a result of the incorporation of new holders with a greater relative presence of men36. Older people, of both sexes, had full coverage in all periods.
The gender gap found among non-bank account holders does not show major differences in terms of age structure. In fact, in December 2020, this gap was equal to 1 p.p. for each age range, while in previous periods, it remained between half a point and 4 p.p., without any specific pattern by age being observed.
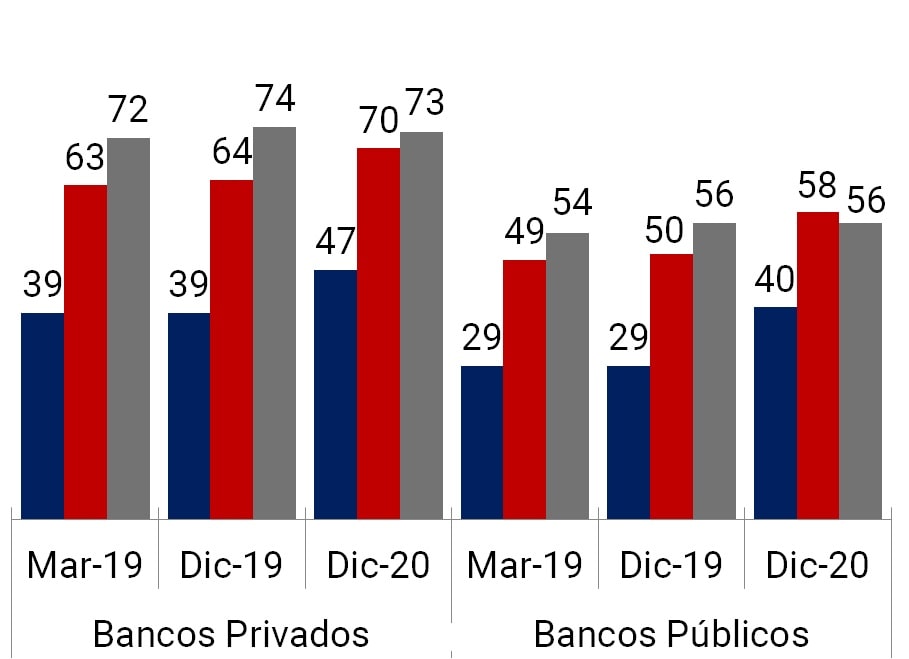
The analysis by age group and type of bank account shows that deposit accounts follow the same pattern as all bank accounts, with an increasing level of coverage with age. On the other hand, current accounts exhibit a different behavior since the greatest penetration is observed in the age range considered more productive (30 to 64 years) and a relatively low tenure for younger people who are starting their lives in the labor market.
As for the institutional group, the age structure of public and private bank account holders shows a similar profile. In both cases, there is a positive relationship between the level of coverage and the age of the account holders; except for public banks in December 2020, where the coverage of the second age range is slightly higher than that of the third. The breakdown by age range shows that the new bank accounts financially included people up to 64 years of age, given that the percentage of the population aged 65 years or older with a bank account remained without significant modifications.
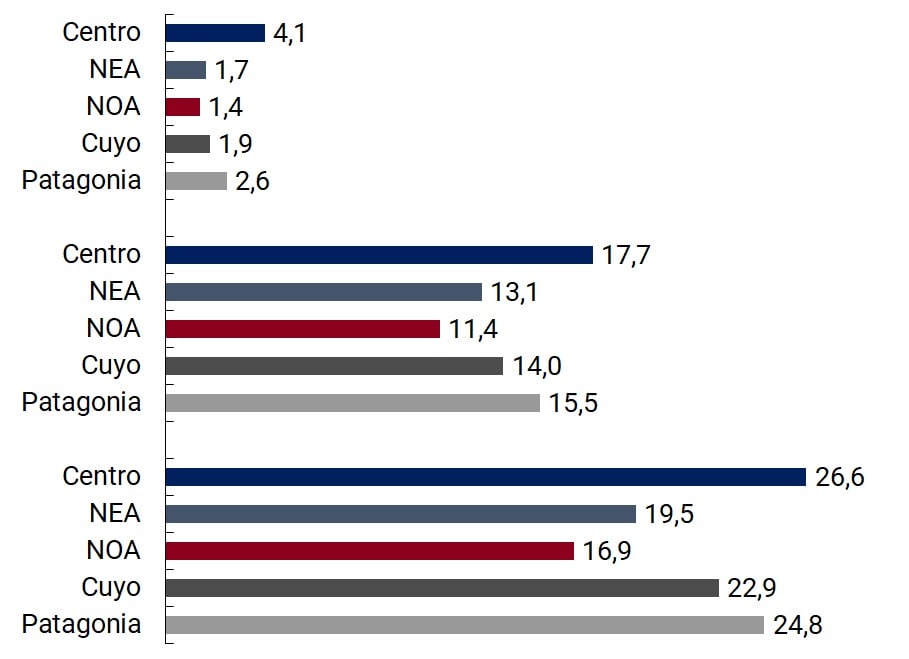
c. Geography. As of December 2020, the five geographic regions into which the country is divided had more than 85% of their adult population with at least one bank account. The gap between the region with the largest population covered (Northeast Argentina -NEA) and the one with the lowest population covered (Cuyo) reached 7 p.p. Between March and June 2020, Northeast Argentina (NEA) and Northwest Argentina (NOA) registered the highest growth rates in bank account holdings (12% and 17%, respectively), reaching the coverage values of the Central and Patagonia regions, which historically led the list (~90%).
This improvement in the coverage of NEA and Northwest Argentina (NOA) was focused on the group of people between 15 and 29 years old, presenting the largest increases in account holders (28% and 37%), followed by the age range of 30 to 64 years with more moderate rates (8% and 14%). Regarding the gender of account holders, the greatest variation was in men in both NEA and NOA (18% and 26%, respectively), while women registered much lower rates (6% and 10%, respectively).
Figure 9 | Account Ownership by Region
At least one bank account
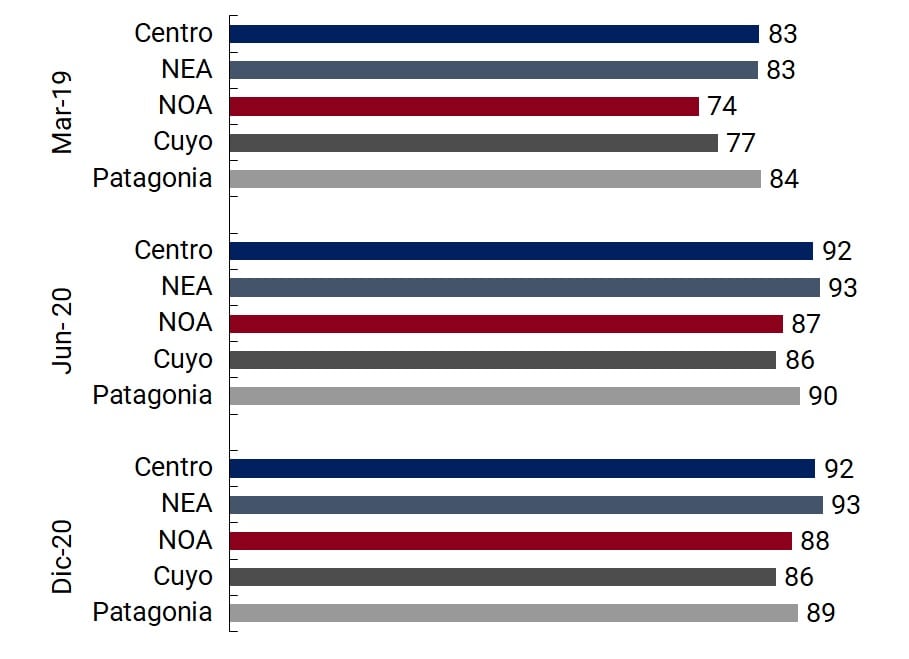
At least one non-bank account
Note | Percentage of the adult population with at least one account.
Source | COELSA, INDEC and BCRA.
One aspect to highlight is that there is no correlation between the income gap of families by region of the country37 and the percentage of adults with a bank account, an association that is verified between countries38. Factors such as the free use of savings banks, the massive crediting of the salaries of people in a relationship of dependency through a bank account, as well as the payment through bank accounts of the different social programs and social security assets could explain this result.
As of June 2020, NEA, with the largest negative difference in family per capita income compared to the national average, began to lead the ranking, displacing the Central and Patagonia duo that usually occupied those positions. This responds to the massive opening of bank accounts to mitigate the adverse effects of the pandemic on the income of the country’s most vulnerable population.
On the other hand, non-bank accounts penetrated all regions of the country, although there are more significant gaps between regions. In Central and Patagonia, coverage reached about 26% of the adult population, while in the NOA it reached 17% of the adult population. In this type of account, throughout all quarters, the level of income of families by region is associated with the degree of coverage of the adult population with non-bank accounts. Unlike bank accounts, this type of account is not used to channel social programs, as has been the case with the National Government’s income transfers to mitigate the effects of the pandemic.
Finally, if we focus on the province as a unit of analysis, it should be noted that the set of account holders, both bank and non-bank accounts, continued to grow in each of them, although at a slower pace, after June 2020, when a significant jump was experienced as a result of the social programs linked to the pandemic. This positive dynamic in the incorporation of people into bank and non-bank accounts can break down barriers to access to financial and other services and bring together populations that were previously excluded.
Figure 10 | Rate of change of account holders by province
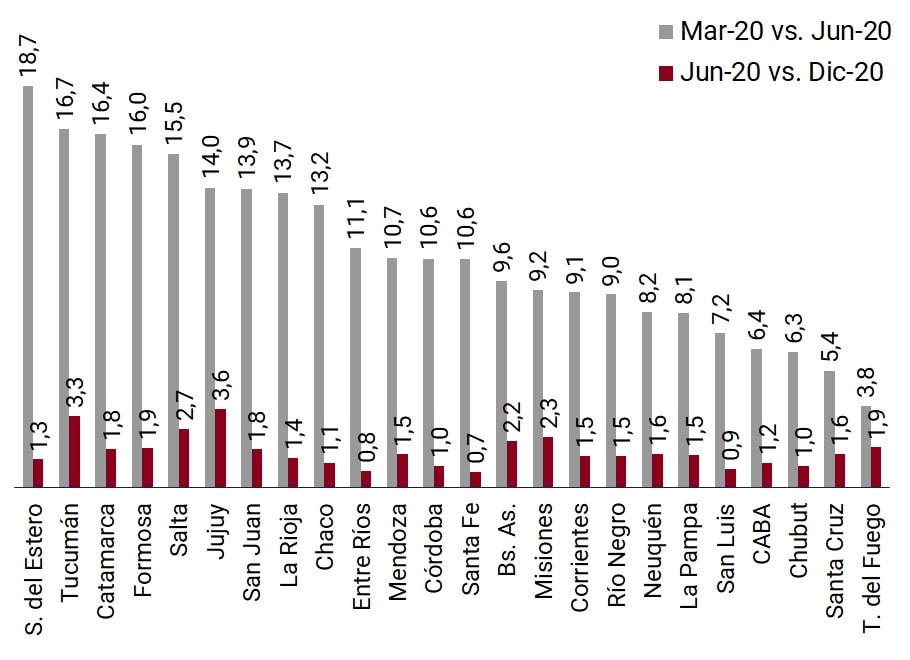
Note | Included are people with bank accounts, non-bank accounts, and both.
Source | COELSA, INDEC and BCRA.
2.2 Transactions by electronic means of payment and cash
withdrawalsThe COVID-19 pandemic and the consequent social distancing measures required to minimize the risk of contagion have modified people’s payment behaviors globally, reflected in a temporary decrease in cash withdrawals, an increase in the use of contactless payments in stores – contactless cards, QR payments – and a greater remote use of payment instruments. driven primarily by e-commerce. 39
Argentina experienced similar changes in 2020: the number of cash withdrawals has decreased for the first time in recent years, while the use of electronic means of payment (EPM) has been further accentuated. Payment for services and e-commerce40 would be the main explanatory factors for the advance in remote payments. 41
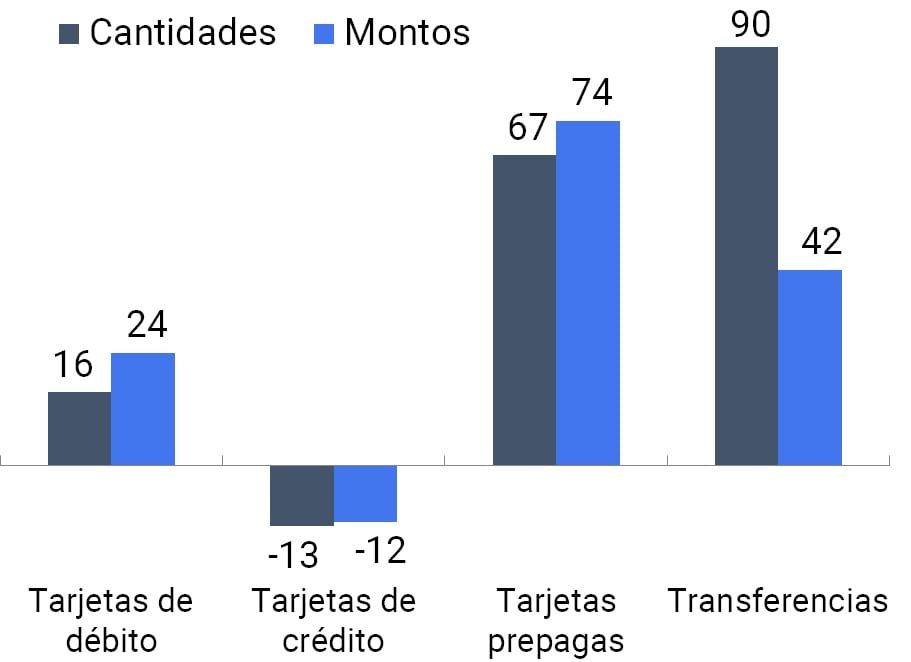
The growth rates of electronic means of payment (EPM) for 2020, 10% in quantity and 21% in amount (in real terms), failed to reflect their strong progress due to the relative participation of each instrument. The fall in credit card transactions, which continues to be the second most used means of payment, dragged down the rates of variation of electronic means of payment (MPE). If credit card operations are excluded, the rates of change in 2020 would be the highest in recent years (27% in quantity and 37% in amount).
Figure 11 | Electronic payment transactions per adult
Quantities
Amounts
Rates of change -19 vs. 20- (%)
Note | The values correspond to the monthly average of each year and the amounts are expressed in thousands of constant pesos (CPI base 100 = Jan-19).
Source | BCRA and INDEC.
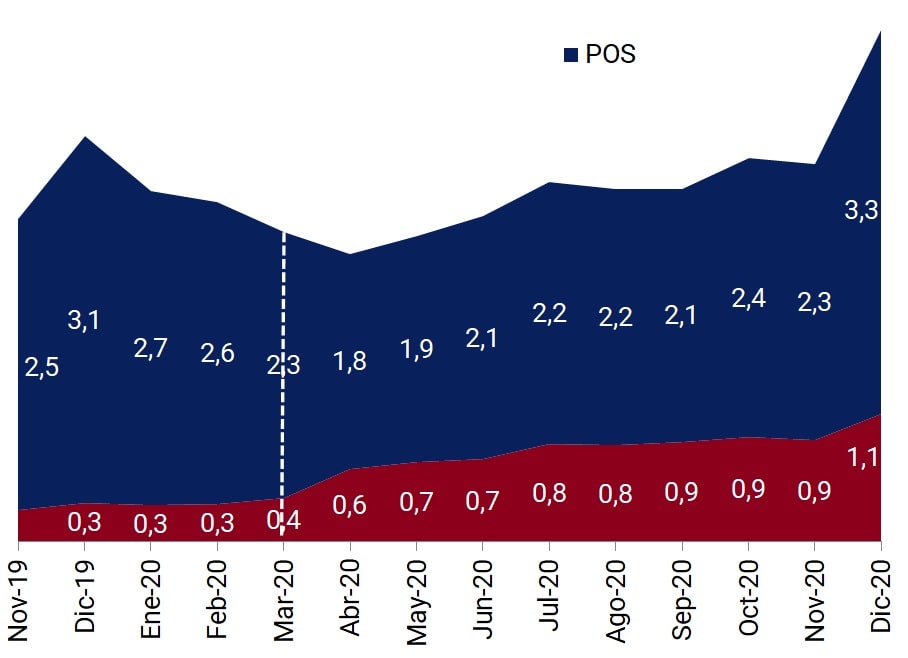
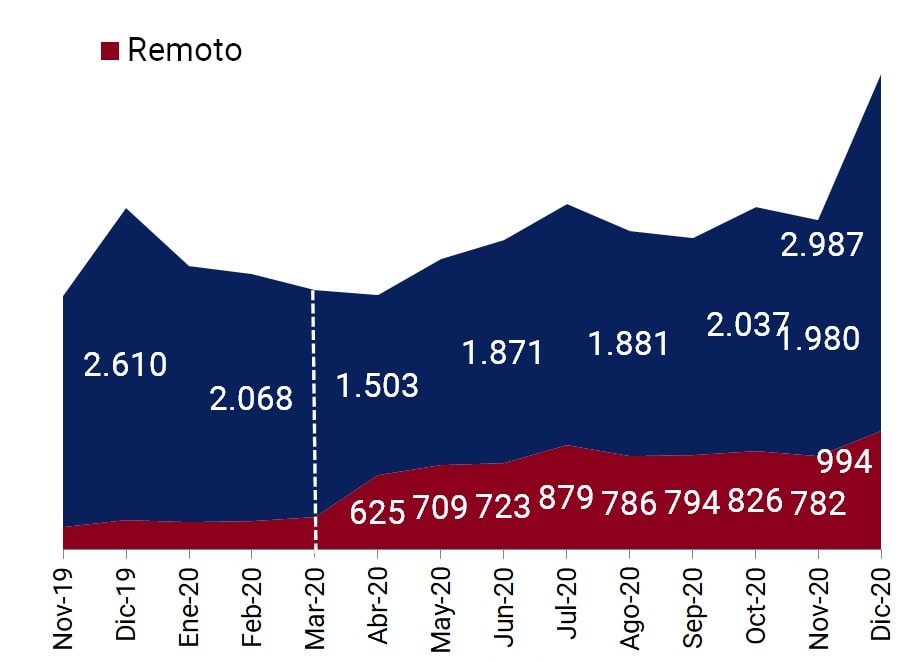
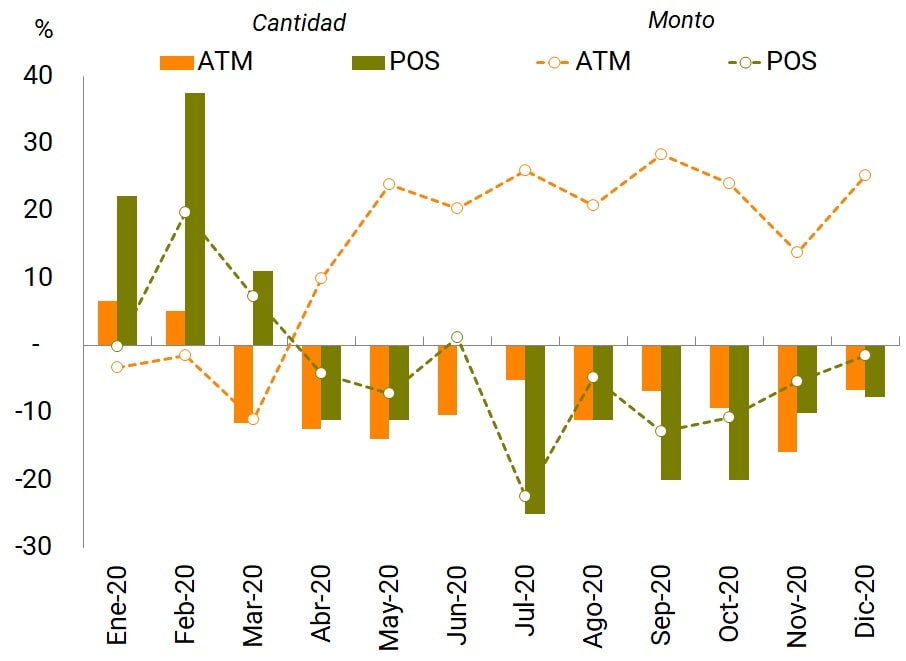
a. Payments for goods and services with cards. Debit card payments per adult continue to establish themselves as the most chosen electronic means of making retail payments. Five out of 10 electronic payment transactions have been made using this instrument in the last 12 months, the equivalent of 3 transactions per month per adult.
Remote payments with debit cards registered an average monthly growth rate during the pandemic42 of almost 3 times that obtained by operations carried out in person via POS, both in amount (20%) and quantity (14%). This acceleration in the rise of remote payments with debit cards resulted in an increase of more than 10 p.p. in its participation in the total payments with this instrument, between March and December 2020. However, considering specific e-commerce operations, the proportion of debit card payments remains low among the payment methods chosen in this environment (7% in 2020). 43
Figure 12 | Debit card transactions per adult
Quantity
Amount
Note | Amounts in constant pesos (CPI base 100 = January 2019)
Source | BCRA and INDEC.
A fact that deserves to be highlighted is that while at the beginning of the Preventive and Mandatory Social Isolation (ASPO) remote debit card payments partially replaced POS payments, once the initial ASPO restrictions were relaxed, the former continued to grow while POS payments recovered the number of lost transactions.
In relation to the number of deposit accounts, debit card transactions by bank account rose by only 5% in 2020, due to the record increase in deposit accounts recorded in that period (16%, more than 8 million accounts). However, each bank account channeled payments of higher amounts – in real terms – during 2020, which registered an annual growth of 13%, a rate that was close to zero in the previous 3 years.
Credit card payments reached the lowest values in the series in 2020, although they continue to be the second most used instrument. The amounts per adult experienced an annual contraction for the first time (-13%), while the amounts – in real terms – that are paid with these means further accentuated the downward trend with a negative rate of 12%, which quadrupled the fall of 2019. This behavior could be due to its characteristics as a financing tool in a context of reduced economic activity forced by the pandemic.
On the other hand, payments with prepaid cards reflected great dynamism, achieving the highest figures in recent years. With positive rates of 67% in quantity and 74% in amount – in real terms – in 2020, these payments multiplied by 5 the values recorded in 2017. This growth is linked to the increase in the number of people who have a non-bank account (See Graph 5), which exposes their potential for expansion. However, in 2020, these payments represented only 3% and 1% of MPE operations per adult, in quantity and amount, respectively.
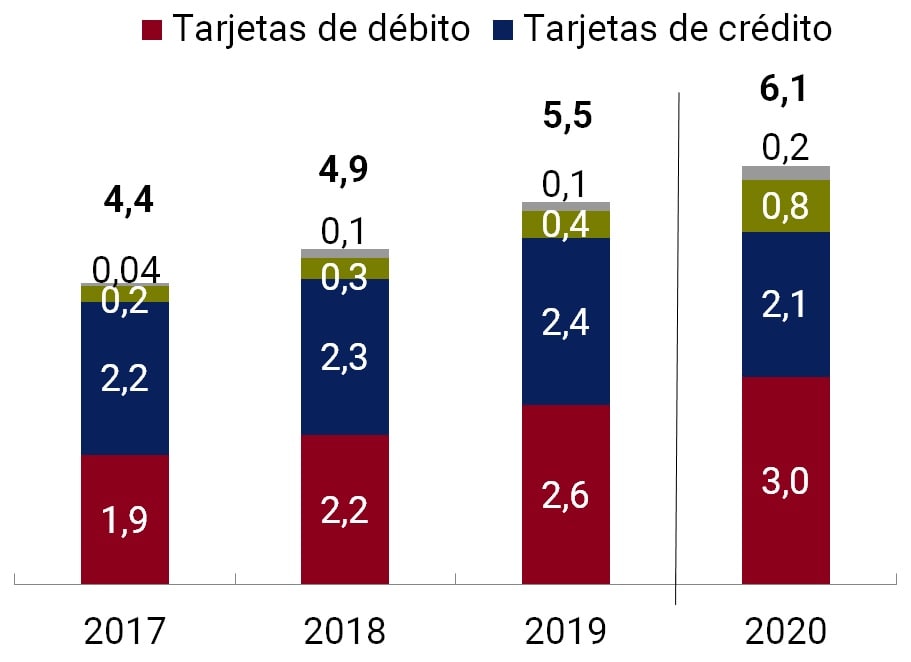
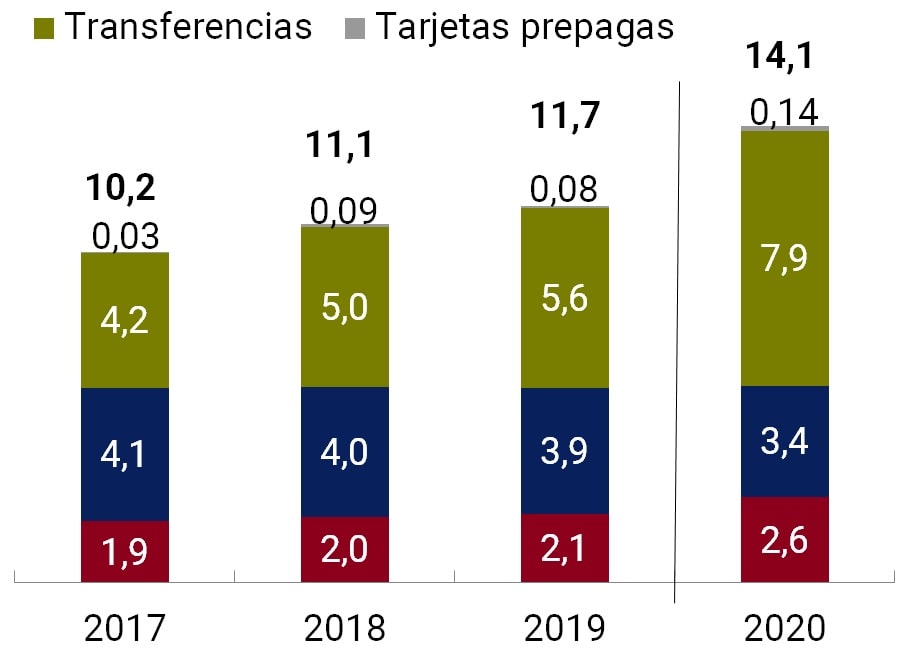
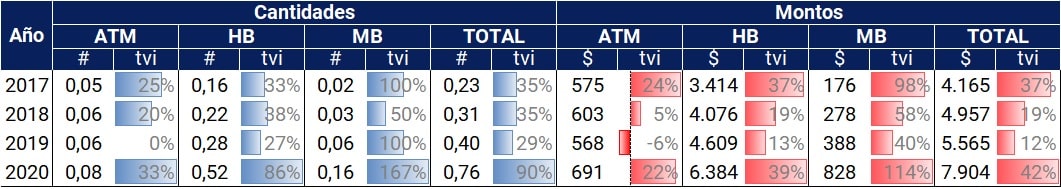
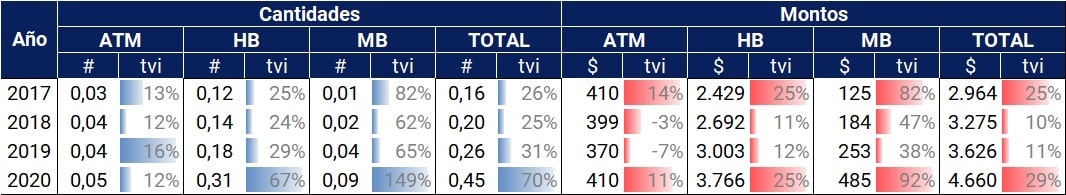
b. Electronic Transfers. Due to its extraordinary performance, electronic transfers were positioned as the most outstanding means of electronic payment (EPM) in 2020, registering the highest rates of variation in recent years, both in amount – in real terms – and in quantity. In 2017, for every 10 adults, an average of 2 electronic transfers were made monthly, while in 2020 8 were made.
Mobile banking was the channel that stood out the most, registering growth of 167% in quantity and 114% in amount at constant prices. Therefore, it managed to position itself as the second most used modality for transfers, behind home banking. The widespread use of cell phones by people, mentioned in the previous Financial Inclusion Report (FIR), together with the offer of applications by financial institutions (EEFF) and dissemination campaigns, have surely contributed to this phenomenon.
Table 2 | Wire Transfers
Per adult
By bank account
Note | Amounts in constant pesos (base CPI 100 = Jan-19). DVI = year-on-year rate of change.
Source | BCRA and INDEC.
The number of electronic transfers per bank account registered the highest growth rate in recent years for the total and for the home banking and mobile banking channels. While for the amounts, this is observed for the total and mobile banking. Compared to 2019, 70% more transfers were made by bank account with an increase in the amount – in real terms – of 29%.
To continue promoting electronic payments, the BCRA launched the “Payment by Transfer” program44 in order to expand the scope of immediate transfers. It is based on a digital ecosystem of open payments: (a) interoperable (bank and non-bank accounts), immediate (merchants will receive automatic accreditation) and flexible (it will allow debit cards, QR codes, biometrics), among others. The new system began operating in December 2020 and will continue progressively until its full implementation in November 2021.
c. Cash withdrawals. Prior to the health crisis, the growth of electronic means of payment (MPE) was accompanied by an increase in the number of cash withdrawals per adult, while the amount withdrawn – at constant prices – per adult fell. This behavior, which could be explained by the increase in the supply of access points (PDAs) and the availability of other means of withdrawing cash, was interrupted in 2020 due to the pandemic and the consequent restrictions on circulation.
Comparing the monthly averages of 2019 and 2020, the number of cash withdrawals at ATMs per adult decreased by 8% while the amount withdrawn – at constant prices – per adult increased by 15% and the average withdrawal by 24%. This behavior is replicated in the decrease in the number of withdrawals at non-bank points but not in the amounts withdrawn, which also decreased.
Figure 13 | Cash withdrawals per adult
Year-on-year rates of change
Operations per MPE per 100 withdrawals
Note | Amounts in thousands of constant pesos (base CPI 100 = Jan-19).
Source | BCRA and INDEC.
The evolution of both channels was influenced by the provisions adopted due to the effects of the pandemic, which generated less movement of people and led to fewer ATM attendances but with higher cash withdrawals than in the past. In the most restrictive stage, only some essential businesses were an alternative to the ATM. It should be recalled that, in order to reduce the risk of contagion, the BCRA increased the limit on the amount of withdrawals at ATMs – currently at $15,000 per day – and eliminated the charges associated with itsoperation 45 until the end of March 2021, when the scheme that was in force prior to the start of the ASPO was returned. In this way, withdrawals remain free of charge for holders of salary accounts, pension accounts and those intended for the payment of social programs and, for savings banks and universal free account (CGU), those made at ATMs of the financial institution itself located within the branches. In the case of the CGU, up to eight free operations are contemplated at ATMs of other financial institutions, where cash withdrawal is one of the available operations. 46
In 2020, the adult population carried out more than twice as many transactions by electronic means of payment as cash withdrawals. This ratio grew by 19% compared to 2019 and is above the values recorded in the last period. This dynamic is explained by the growth of debit card transactions and electronic transfers.
Finally, digital payments are a valuable tool to respond to the impact of the pandemic. But its performance is not without challenges and risks, given that its use can be particularly complex for some population groups, such as the elderly or those with fewer digital capabilities, and be subject to cyberattacks and digital fraud. In this regard, the BCRA has made progress on both fronts through the launch of a digital financial education campaign for families (together with the Ministry of Education)47, and through actions to prevent virtualscams48 and the establishment of cybersecurity guidelines. 49
2.3 Savings
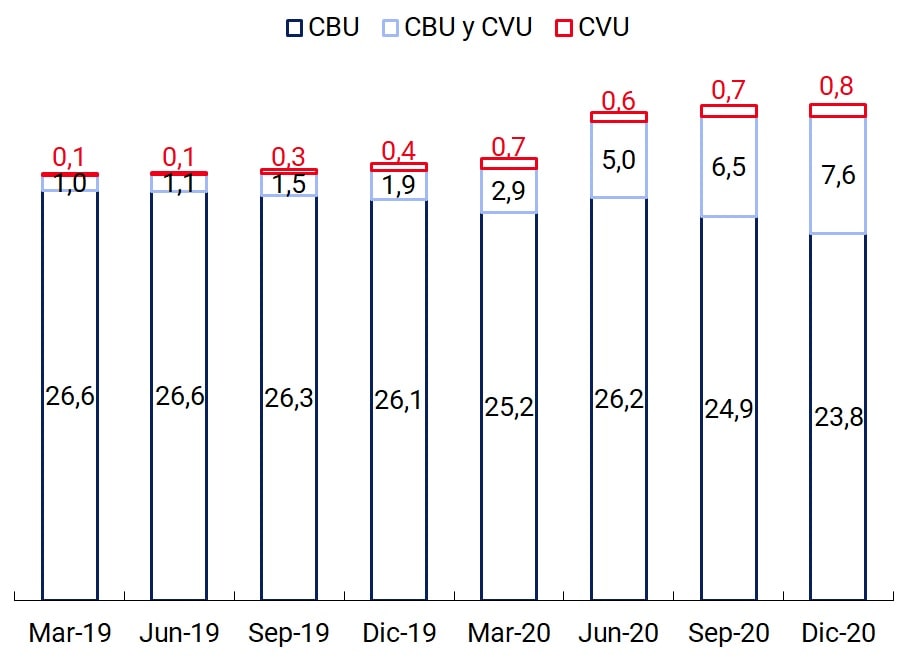
modalitiesIn previous editions of the Financial Inclusion Report (FIR), measurements on the use of savings products were based on relating the number of current fixed-term loans of individuals (hereinafter, fixed-term loans) to the adult population and the number of deposit accounts. In this report, based on the most information available, the evolution of fixed terms in relation to the number of individuals holding accounts in financial institutions (hereinafter, bank account holders) will be analyzed.
At the end of 2020, the metric registered a value of 10.5 fixed terms per 100 bank account holders, being close to the value of March 2020, when the Preventive and Mandatory Social Isolation (ASPO) was established in response to the COVID-19 pandemic. Although both the number of fixed-term loans and bank account holders registered growth from March to December 2020, 8.2% and 10.7%, respectively, the evolution of the indicator reflects the small proportion of bank account holders who use fixed-term deposits as a savings product.
During the COVID-19 pandemic, the National Government provided social assistance to people who faced losses or a serious decrease in their income as a result of the health emergency situation. This policy implied the opening of a large number of bank accounts, in addition to accreditations to people who already had a bank account but who faced a drop in their income. These social aids, such as the Emergency Family Income (IFE), were established in order to allow access to basic goods and services essential for the population as a whole and, mainly, for those who need it most. Therefore, the massive opening of accounts for transactional purposes associated with social assistance led to a reduction in the ratio of fixed-term loans to bank account holders.
Table 3 | Fixed terms per 100 bank account holders depending on the size of the Financial Institutions (EEFF)
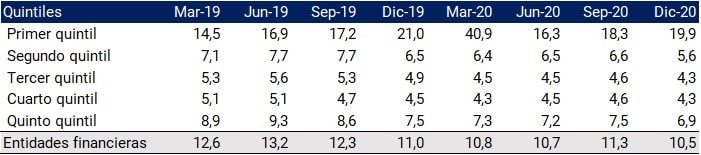
Note | The quintiles group the EFSAs according to the number of bank account holders, where the first quintile groups the FFSs with the lowest number of account holders. The limits vary in each of the quarters. If a person has an account in EEFF of two different quintiles, it is counted in each of them. Fixed terms include those constituted in pesos, UVA and foreign currency.
Source | COELSA and BCRA.
On the side of yields on time deposits, during 2020 the BCRA promoted various measures aimed at harmonizing monetary policy interest rates and maintaining positive real returns on savings in pesos: (i) the interest rate on passive passes for the BCRA (assets for financial institutions -EEFF-) was gradually raised overnight; (ii) passive passes for the BCRA began to be offered to seven days; (iii) the monetary policy interest rate was adjusted on several occasions; (iv) the minimum guaranteed interest rates on fixed-term deposits in traditional pesos were raised in order to ensure returns in line with inflation levels, in order to favor savings in national currency. In addition, in 2020, UVA fixed terms were launched that can be pre-canceled from 30 days (on a total term of at least 90 days), expanding the savings alternatives in pesos at a positive real rate. In addition, the BCRA has been and will continue to cooperate with several provincial governments and different areas of the national public administration to promote financial education in general and savings education in particular.
However, in terms of amounts invested, the behavior was different during 2020. The balance of fixed-term loans of individuals in local currency registered an annual increase of 9.3% in real terms, while fixed-term loans in the non-financial private sector registered an increase of close to 30%, with those of the pre-cancelable UVA rate also gaining greater dynamism.
It should be noted that the low proportion of fixed-term workers with respect to account holders is influenced, in addition to the predisposition to save, by factors such as the savings capacity of the population, certainly compromised during the pandemic, and the knowledge of the alternatives on savings products in the financial system on which the BCRA has been working in various financial education actions. On the other hand, it should be noted that the minimum amounts established by the EEFF from which fixed terms can be made are relatively low (mostly between $500 and $1,000), this limit not being a barrier on the supply side to access this savings instrument.
Segmenting the evolution of the indicator according to the number of account holders of the EEFF as a reference to their size, it can be seen that all groups of entities, except those with a smaller number of account holders, recorded a deterioration in the use of fixed terms throughout the period of analysis. In 2020, the second quintile FUS recorded the largest annual decline (-12.6%), while the smallest FFSs experienced the smallest decline (-4.9%).
Likewise, the gap between the largest and medium-sized EFSs is significant. The third and fourth quintile EFFs should improve their performance by between 60% and 70% to reach the performance of the EFFS with the largest number of account holders. A special mention should be made of the first quintile EFFs that register a much higher indicator than the rest of the LESE. It should be noted that both the number of account holders and fixed term account holders are not significant in the total of both variables (less than 1%), which causes small variations to have a significant impact on the indicator.
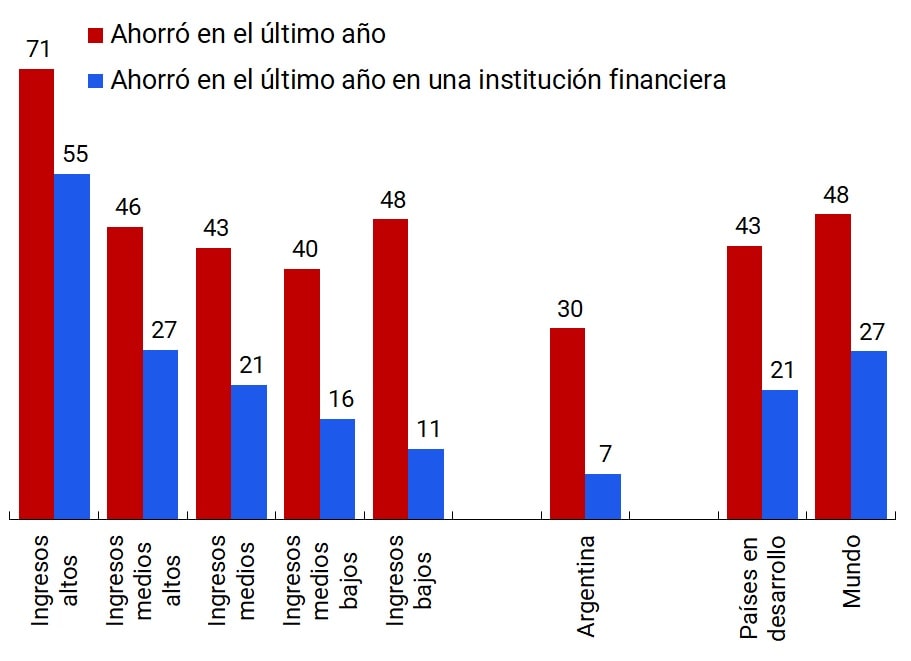
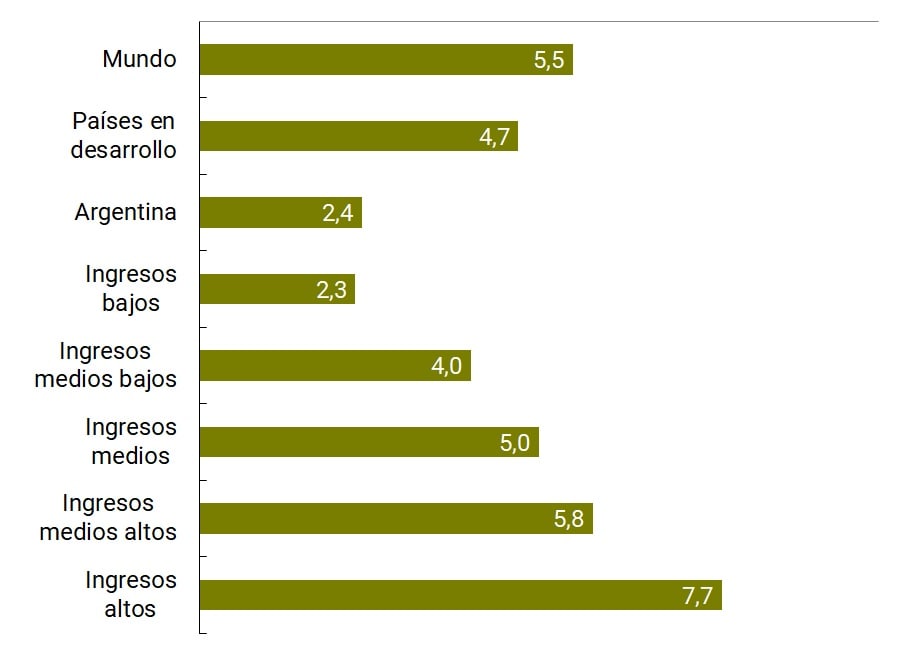
According to data compiled by the Global Findex survey, the global gap between the adult population saving and saving in a financial institution is significant (48% vs. 27%). In low- and middle-income countries, 5 out of every 10 adults who save save do so in the financial system in middle-income countries and 2 in the case of low-income countries.
Figure 14 | Saving behavior as a function of per capita income
Percentage of adult population
For every 10 people who saved, how many did so in the financial system?
Source | Global Findex, World Bank, 2017.
Argentina, although it is part of the group of upper-middle-income countries, registers in the results of the Global Findex50 (2017) a saving behavior of low-income countries in terms of savings links with financial institutions, considering that out of every 10 adults who save, 2 do so in the financial system. Likewise, the propensity to save of the Argentine population is somewhat lower than that reported by low- and middle-income countries (30%). Even with this limitation and given the reduced use of fixed-term deposits as a savings product in all segments of the EEFF, the significant gap between the adult population that saves and those that save in a LFSE leaves room to include more people in the savings products of the financial system.
The increase in the base of bank account holders, which almost reaches the entire adult population, and the growing digitalisation of financial services present a favourable context for promoting the use of savings products in the financial system. Taking as a reference the massive adoption of electronic means of payment after the outbreak of the pandemic, the savings products of the EEFF were leveraged on current technologies to enhance their growth. Along these lines, the literature raises two main aspects for savings products: (i) extending distribution channels; and (ii) developing new characteristics and attributes.
The omnichannel service of EEFFs, both physical and electronic, allows the different population groups to access the placement of their savings through the service channel closest to their usual financial operations. Considering the extensive geographical coverage of the financial system, the possibility of contracting a savings product in any type of PDA, regardless of its entity and network, expands the offer by providing a greater range of possibilities to the user. Likewise, a similar situation occurs with electronic channels such as internet banking and mobile banking, where almost all the EEFF have both channels. Mobile banking requires a particular mention since cell phones, unlike access through computers, are frequently used by all age groups.
3. Credit to individuals
The local context remains marked by the consequences of the COVID-19 pandemic that found Argentina in a vulnerable economic and financial situation. Although the relaxation of social distancing measures allowed for greater movement of people and a certain recovery in economic activity in relation to the first months of the pandemic51, the evolution of the epidemiological situation continues to generate a scenario of uncertainty.
The measures taken by the BCRA in response to the pandemic sought to mitigate the consequences of the economic situation for debtors in the expanded financial system (SFA). In particular, the BCRA promoted various credit assistance programs aimed at boosting the credit channel for the private sector52. Likewise, the flexibility of the criteria for classifying debtors and the current loan payment conditions was maintained, as well as the maximum limits on the interest rates of credit cards issued by financial institutions (EEFF)53.
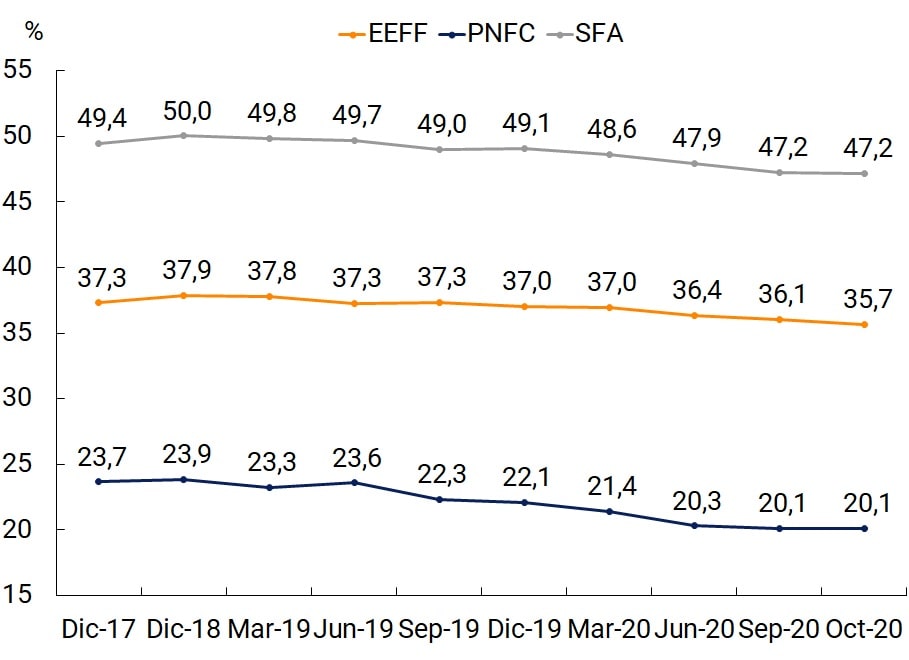
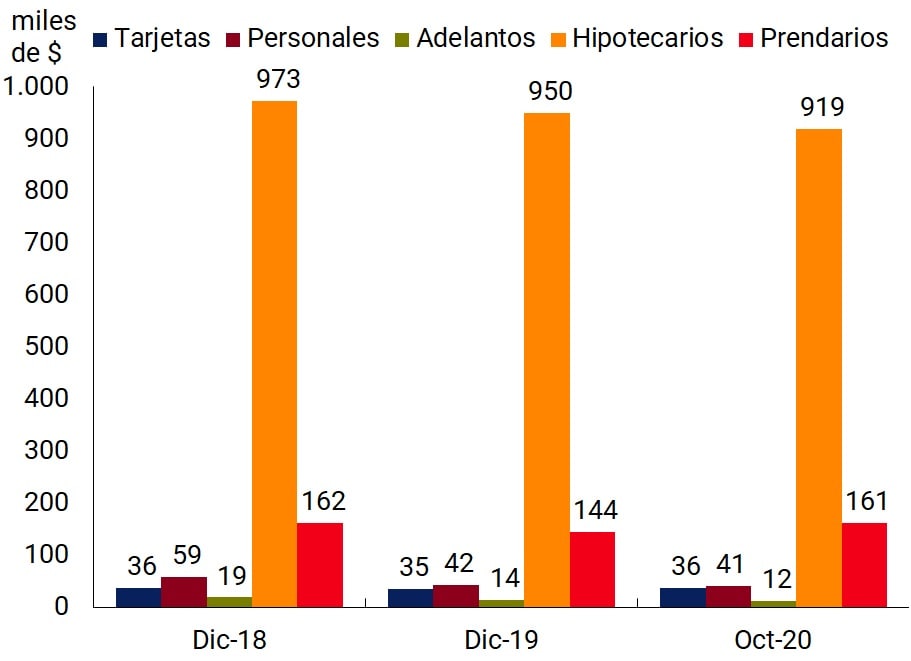
a. Financing and credit line providers. During 2020, the percentage of adults with at least one financing continued the downward trend that began in 2019. The persistence of the reduction in economic activity that was observed from the second quarter of 2018, and that was maintained during 2019, was reflected in the reduction in the indicator of adults who accessed financing. Likewise, as of 2020, the pandemic introduced new elements that deepened the fall of the aforementioned indicator.
During the stages of isolation and social distancing, various factors affected the population’s access to credit. First, the face-to-face component still required for the generation and management of loans meant that the social distancing measures necessary to minimize the risks of contagion made it difficult to take out new financing. On the other hand, the uncertainty regarding the evolution of health conditions and their impact in terms of income, caused part of the population and the financial system to take a more cautious attitude with respect to credit. In addition, the fall in economic activity since 2018 and its effects on income also decreased the population’s possibilities of accessing financing. In response to the pandemic, the National Government in conjunction with the BCRA implemented measures facilitating credit to individuals (zero-rate line for small taxpayers and self-employed and credit line for culture) and MSMEs through loans with subsidized rates and the credit line for productive investment. 54
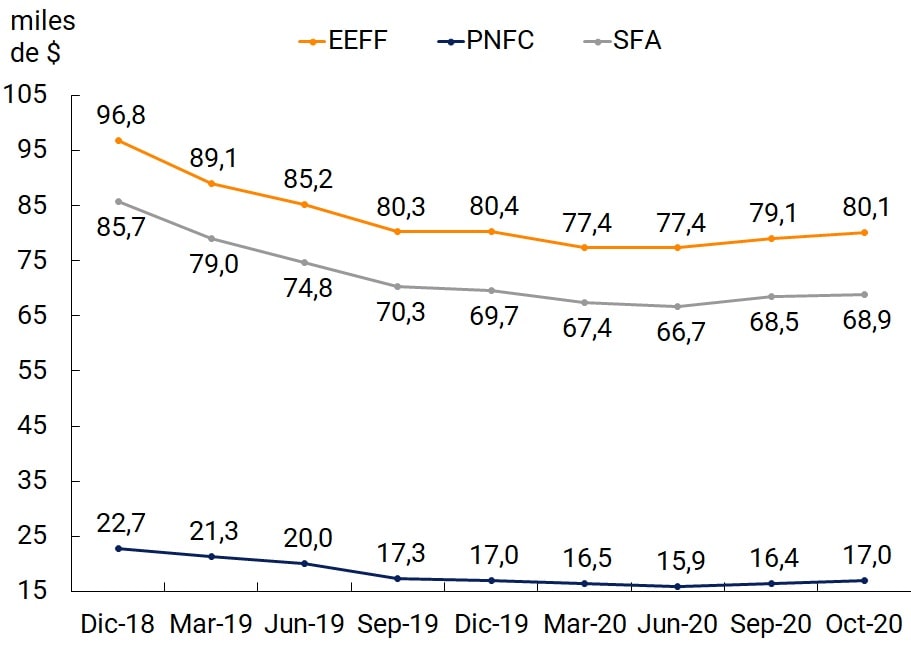
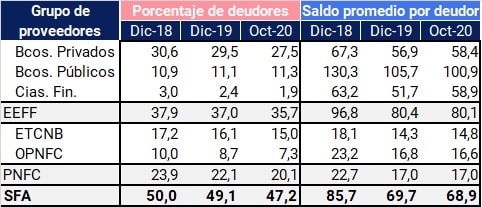
In this context, from December 2019 to October 2020 there was a contraction in the percentage of adults with at least 1.4 p.p. financing for financial institutions (EEFF), 2 p.p. for Non-Financial Credit Providers (PNFC) and 1.9 p.p. for the Expanded Financial System (SFA), higher than that observed during the same period of 2019 (0.5 p.p. fall for EEFF, 1.7 for Non-Financial Credit Providers (PNFC) and 1 p.p. for the expanded financial system (SFA). The difference in these falls may be associated with the lower incidence of formal work55 among PNFC debtors, which could mean a greater impact of the fall in income as a result of the pandemic. Likewise, the need to reduce circulation and thus contagion implied the temporary closure of large businesses that operate as Other Non-Financial Credit Providers (OPNFC) -for example, the sale of household appliances-, which may have affected the generation of new credits.
Figure 15 | Number of debtors and balance per debtor
Debtors on the adult population
Average balance per customer
Note | Balances in thousands of constant pesos (base CPI 100 = Jan-19).
Source | BCRA and INDEC
There is evidence of a significant slowdown in the reduction of the average balance per debtor compared to 2019, given that although during the first ten months of 2020 the average balances in real terms fell by 0.3% for EEFF and 1.1% for SFA, while for PNFCs there is an increase of 0.4%. The falls recorded were considerably smaller than those of the same period in 2019 (16%, 24% and 17% respectively). As of the second quarter of 2020, the balance per debtor shows a recovery with an increase of around 3.6% for EEFF and 3.3% for PNFC between March and October. With these results, it is evident that given the consequences of the pandemic and the credit stimuli implemented by the National Government that were implemented in response, the financial system demonstrated a more favorable performance in terms of real balances financed than in 2019.
Analysing the behaviour by institutional group, within the set of LFFs, public banks have a differentiated behaviour from private banks and financial companies, registering a slight trend towards the incorporation of new debtors since 2019, which was maintained during 2020. Among the PNFCs, Non-Bank Credit Card Issuers (ETCNBs) register a smaller reduction in the percentage of debtors than the other non-financial credit providers (OPNFCs), which could be associated with a greater face-to-face component in the contracting of personal loans in the latter and the temporary closure of large businesses that operate as OPNFCs.
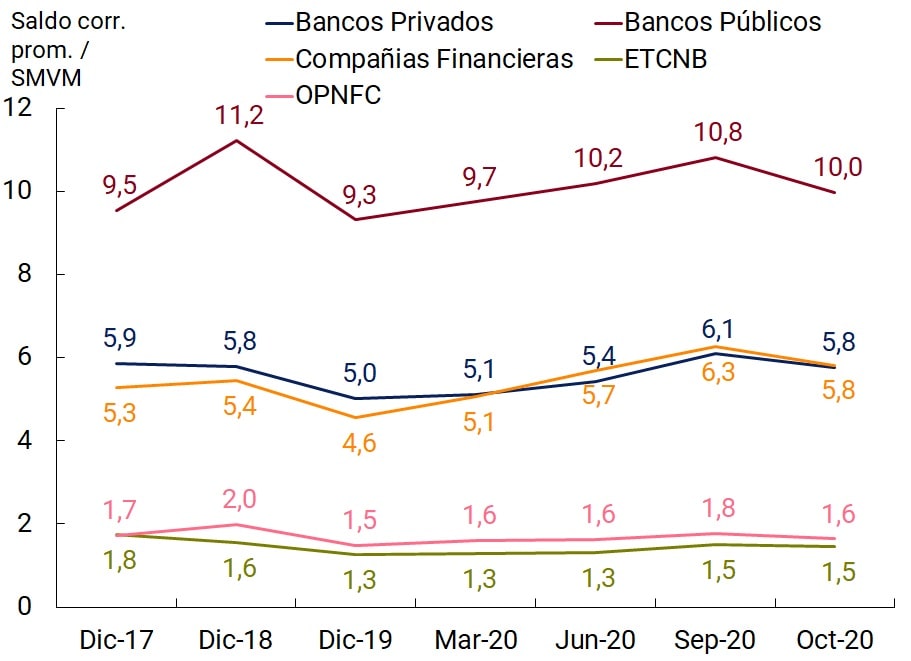
On the other hand, for the purposes of dimensioning the average balances per debtor in relation to people’s income, the variable of the Minimum, Vital and Mobile Wage (SMVM) is incorporated and it is observed that SFA debtors registered balances equivalent to 6.8 SMVM as of October 2020, while for the EEFF they amounted to 7.9 SMVM and the PNFC to 1.7 SMVM. Differentiated behaviors are also observed among the different institutional groups: public banks have persistently higher balances than the other SEEs and NFPs, with balances equivalent in October 2020 to approximately 10 SMVM. In a second group are private banks and financial companies with 5.8 SMVM, while the average balances of debtors of non-bank credit card issuers (ETCNB) and OPNFC were between 1.5 and 1.6 SMVM.
Table 4 | Debtors and balances by institutional group
% of the population adult with at least one financing and average balance
Average current balance in relation to the SMVM
Note | Balances in thousands of constant pesos (base CPI 100 = Jan-19).
Source | BCRA, INDEC and the Ministry of Labor, Employment and Social Security.
In terms of balances, between December 2019 and October 2020 financial companies increased the average balance at constant prices of their debtors by 14%, while private banks registered an increase of 2.7%. These behaviors show a clear change with respect to the reductions observed during 2019. In relation to public banks, although during 2020 this institutional group demonstrated a decrease in average balances per debtor in constant terms (4.5% during the first 10 months of the year), this drop was considerably lower than that of the same period of the previous year (16.6%). Within the PNFC group, ETCNBs reported an increase in actual balances financed, while OPNFCs recorded a fall of 1.2%.
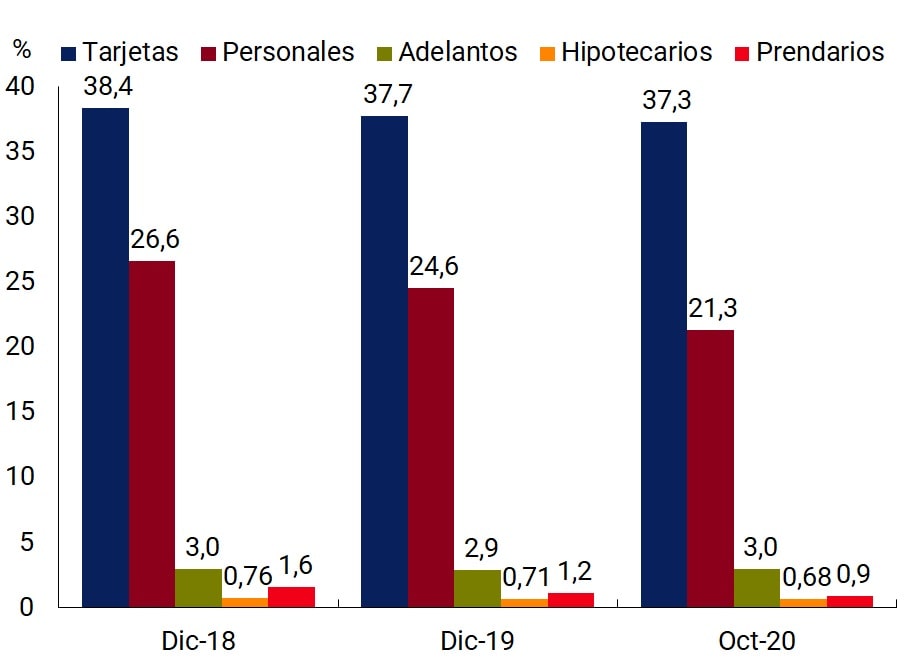
In terms of types of financing, personal loans experienced the greatest reduction in the percentage of adults with at least one assistance, with a drop during the first 10 months of 2020 of 3.3 p.p. This line of financing, usually associated with face-to-face hiring, could have been affected by the need to reduce the circulation of people and thus contagion, as well as by the aforementioned precautionary attitude and the fall in income. Credit cards are in second place, with a reduction of 0.5 p.p. Current account advances reached values similar to those of December 2019 in October. Within the longer-term and larger financings, collateral loans continue with a downward trend, having gone from 1.2% of the adult population in December 2019 to 0.9% in October 2020.
Regarding balances, between December 2019 and October 2020 the average balance per personal loan debtor suffered a drop of 3% in real terms. This reduction in balances meant a clear slowdown of the observed trend, which had shown a drop of 24% during the same period of 2019. A similar behavior is evidenced by current account advances, which registered a decrease in the average balance per debtor of around 13% from December 2019 to October 2020 (vs. 33% drop during the first ten months of 2019).
Figure 16 | Financing of the expanded financial system by type of assistance
Percentage of debtors over the pob. adult
Average balance per debtor
Note | Balances in thousands of constant pesos (base CPI 100 = Jan-19).
Source | BCRA and INDEC.
Credit cards, on the other hand, had a 3% increase in average balances per debtor during 2020, indicating that credit card holders were able to use this means to finance consumption in a context of falling income as a result of the pandemic. At this point, the impact of the Zero-Rate Credit line for self-employed workers and single-payers provided by the National Government within the framework of the Emergency Program for Assistance to Work and Production56 is highlighted – these financings were credited on credit cards, with a positive impact on debt balances for this type of assistance.
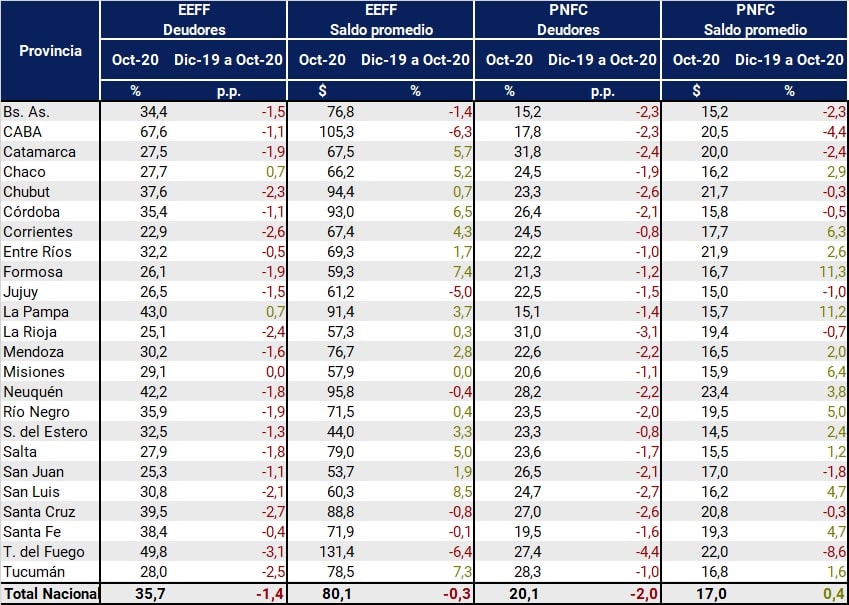
b. Characteristics of the debtors. In terms of the geographical distribution of debtors, with the exception of the provinces of Chaco and La Pampa, all first-tier jurisdictions suffered a reduction in the percentage of their population that accesses financing from financial institutions (EEFF) during 2020. For Non-Financial Credit Providers (NFCPs), the drop in the percentage of debtors is observed in all jurisdictions. The province of Tierra del Fuego registered the largest contraction for both indicators, with a drop of 3.1 p.p. in the percentage of debtors of EEFF and 4.4 p.p. of PNFC.
The average balances per debtor in real terms also showed disparities in their behavior during 2020. In the case of the EEFFs, in 17 of the 24 first-order jurisdictions there was an increase in the average balance, while for the PNFCs 14 jurisdictions showed an increase in balances and 10 a reduction. The largest increases were recorded in provinces that have a relatively smaller percentage of their population with at least one financing.
Table 5 | Debtors and balances by province
Note | Percentage of the adult population with at least one financing and balances in thousands of constant pesos (CPI base 100 = Jan-19).
Source | BCRA and INDEC.
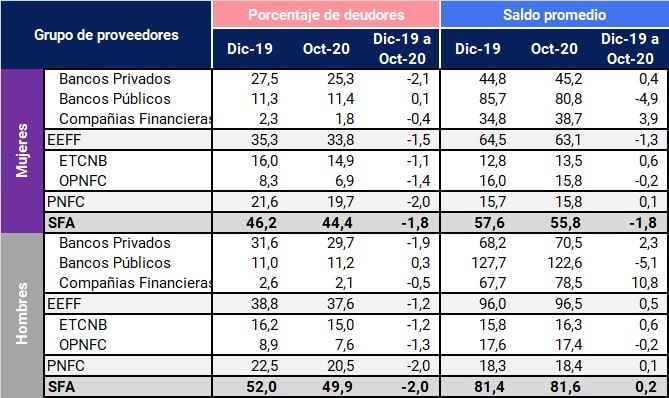
On the other hand, the consequences of the pandemic had a differentiated impact on access to credit for men and women. For the EEFFs as a whole, there is a greater reduction in the percentage of women with at least one loan than men, this behavior being mainly explained by private banks. For financial companies, the decrease in adults with financing was slightly greater for men than for women, while public banks recorded a greater increase in the percentage of debtors for men than for women. Within the PNFC as a whole, the performance was relatively more homogeneous, although there is a small difference in favour of women.
The balances, on the other hand, show more marked disparities, noting that the average balance of male debtors of private banks and financial companies registered considerably greater increases than that of female debtors. For the PNFCs, the drop in average balances was similar for debtors of both genders.
Table 6 | Gender gaps
Note | Balances in thousands of constant pesos (base CPI 100 = Jan-19).
Source | BCRA and INDEC.
Finally, delving into the age of the debtors, it is observed that the differences in access to credit by gender are more important for private banks in the age ranges between 30 and 64 years, while for young and old the difference between the percentage of men and women with at least one loan is less significant. For balances, public and private banks recorded considerably higher average debt balances for men than for women in all age ranges, with the highest gender gap in public banks. For non-bank credit card issuers (NTCNBs) and other non-financial credit providers (NPBOs), the differences between men and women are smaller and more homogeneous across age ranges.
Figure 17 | Funding by age, group and gender
Percentage of the population with financing
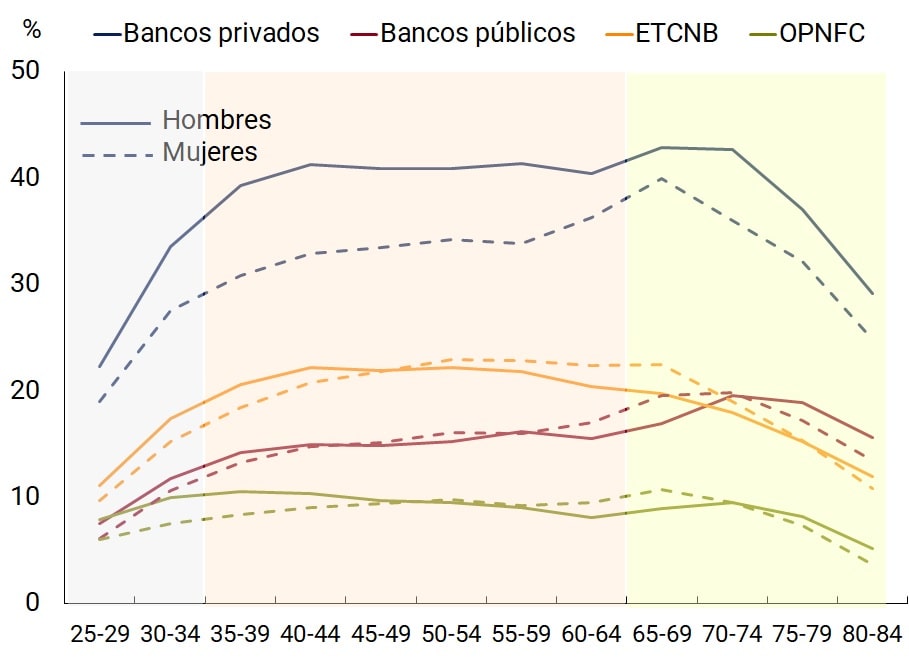
Average balance per customer
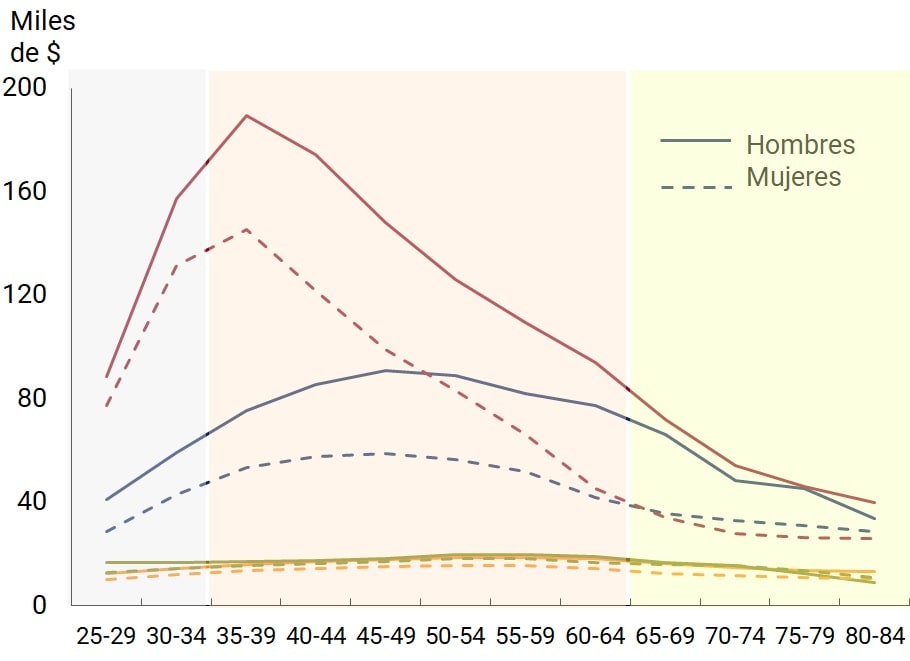
Note | Data as of Oct-20. Balances in thousands of constant pesos (base CPI 100 = Jan-19).
Source | BCRA and INDEC.
Section 1 / An approach to the comprehensive measurement of financial inclusion in Argentina
The process of financial inclusion certainly requires monitoring actions that go beyond the mere registration of indicators referring to access to and use of financial services. As presented in Section 3, there are deeper concepts such as financial health and well-being that are more comprehensive and useful in terms of measuring progress in financial inclusion and that facilitate the detailed design of policy responses to the survey of situations of exclusion. In any case, having an aggregate indicator that synthesizes different aspects related to access to and use of financial services can be useful for a first analysis. The construction of an index addresses this challenge, by summarizing its multidimensionality in a figure, allowing comparisons over time.
As a first point, the assembly of an index requires the selection of variables and the determination of their relative weighting in the calculation. As this is the first exercise, the selection of variables and the calibration of their relative weight was based on the guidelines of a document by the Economic Commission for Latin America and the Caribbean (ECLAC)57 that developed financial inclusion indices for Uruguay. This document uses the deterministic approach (ED) technique to prepare three financial inclusion indices -access, use and global-, where the values of the weights arise from a contextual analysis by the research team.
Additionally, the variables were normalized considering their minimum and maximum values throughout the period of analysis58, which generates that the indices range between 0 and 1. These indices compare the state of financial inclusion between the different units of time (months or quarters) within the period studied, with their temporal evolution becoming more relevant than their specific value. In other words, the proximity of the index to 1 in a month does not imply optimal financial inclusion, but simply that it is better than that of other months included in the calculation.
Within the access dimension, the elements of the physical infrastructure are presented individually, given the different functionalities that each of them develops. Because ATMs represent 40% of the total access points (ADPs)59, they were assigned the highest weight. Branches were considered at a second level of importance, depending on the range of operations offered. Then, self-service terminals (TAS) and complementary financial services agencies (ACSFs), which despite experiencing an expansion process60, still need to be consolidated to meet people’s financial needs in a more complete way61.
Table A.1.1 | Selection of indicators and weights62
The metrics of the usage dimension have been mainly represented by electronic transfers and payments with the different types of cards. Based on the greater adoption they have experienced in recent years, debit cards and electronic transfers received a higher relative weight in relation to the rest of the electronic means of payment.
As a result, the combination of access and use indices in the global index showed an improvement in the degree of financial inclusion in the period under study, with a 5-fold increase in point-to-end progress. The upward trajectory of the global index, with positive year-on-year rates of change for all months, replicated the oscillations of the use index, with seasonal peaks and growth that more than doubled the access index, and the eventual discrete jumps in the access index, generally motivated by specific needs such as the opening of accounts to channel income transfers in response to the COVID-19 pandemic.
Figure A.1.2 | Evolution of financial inclusion indices
Financial Inclusion Index
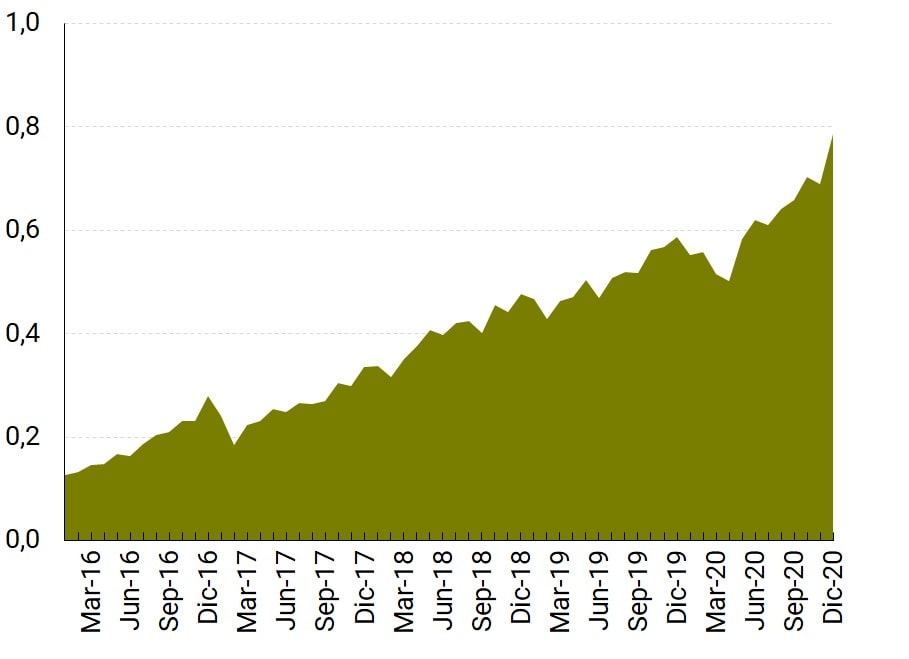
Access and usage rates
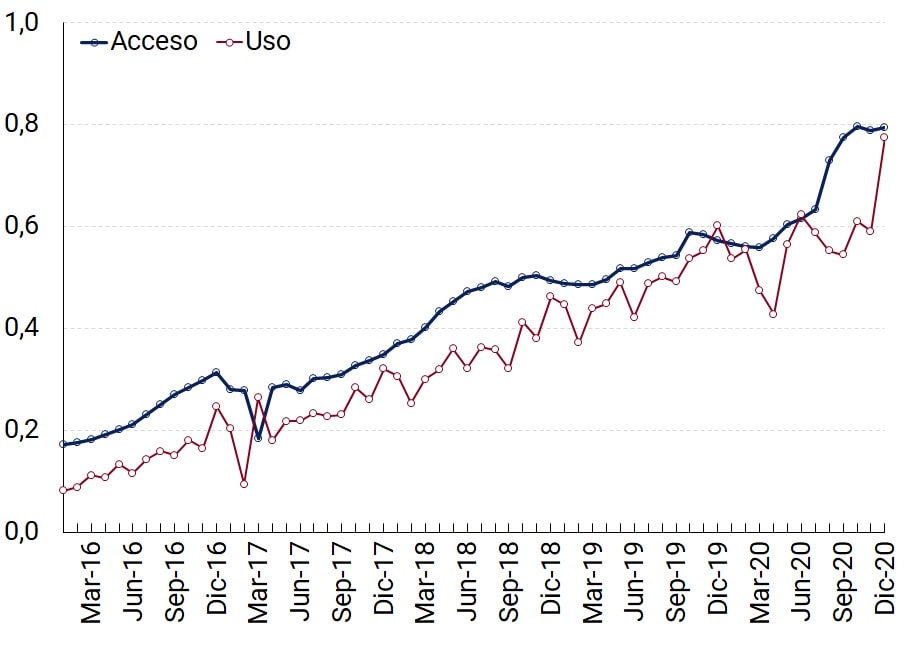
Source | BCRA and INDEC.
The notable increase in the rate of use in the period analysed is explained by the progressive use of electronic means of payment. It should be noted that electronic transfers per adult quintupled in value between January 2016 and December 2020. On the other hand, debit cardpayments 63 and debits related to the population increased by 97% and 99%, respectively. The greater adoption of electronic means of payment was driven by regulatory innovations that sought to expand the universe of providers, reduce interchange fees and add payment alternatives, with safer and faster operations in a framework of incorporation of technology64.
The rise in the access index has been softer, registering a tip-to-end growth of 3.6 times. Some of the factors behind this growth have been the increase in the number of deposit accounts per adult as previously noted, the growth of the ATM fleet over the period (30%) and the launch of ACSFs reaching a value of 3.67 per 10,000 adults in December 2020.
In conclusion, and although a first approximation exercise was carried out that could be developed more exhaustively, the construction of the global index generates a contribution to the measurement of financial inclusion since it quantifies, in a single metric, its progress over time and allows the dynamics of its constituent dimensions to be compared.
Section 2 / Access tools for blind people
Interacting with financial services, both physical and digital, can present a challenge for populations with special abilities if the tools to ensure their proper access and use are not available. In line with the objective of promoting greater financial inclusion for all segments of the population, the BCRA requires financial institutions (EEFF) to incorporate certain elements that allow these people to use financial services safely and independently, actively participating in the financial and economic system.
In this section, we will deal with the specific case of people who have severe vision problems. In Argentina, it is estimated that 2.6% of the population has some type of visual impairment, among which 96% have a lot of difficulty seeing and 4% cannot seeat all 65.
As the main tool to facilitate the link with financial services, audio systems are presented that guide and tell users the steps of the operations available in physical and remote electronic channels, and warn about unwanted events, such as forgetting the debit card at ATMs. This tool is available in ATMs, home banking and mobile banking and use through headphones provides autonomy and security to users66.
In addition, face-to-face electronic channels, such as ATMs, have a keyboard in Braille or standard language with highlighted relief67, which makes it easier for people with vision difficulties to execute any operation without the help of other people, from the generation of a password to a transfer of funds. In addition, ATMs should soon provide the option for people to validate their identity through fingerprint readers68, seeking to facilitate interaction between users and electronic devices. By mid-2022, all ATMs in Argentina will have biometric readers.
The facilities are focused on ATMs because they are the most numerous access point to financial services in the financial system, they are present in 41% of the country’s localities, most of them have 24-hour availability. and they make available a significant number and variety of operations, from cash withdrawals to payments for services and transfers of funds.
At the end of 2020, ATMs with the characteristics mentioned above (“ATMs for the blind”) reached an amount of 7,561, representing 43% of the total ATM fleet and a value of 2.19 units per 10,000 adults. In recent years, ATMs for the blind grew in all regions, showing growth even above the total number of ATMs, except in the Cuyo region.
Table A.2.1 | Geographical distribution of ATMs for the blind
(a) Number of ATMs
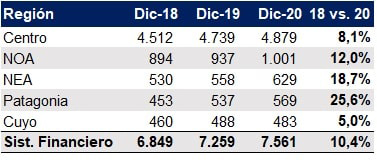
(b) Percentage in relation to total ATMs
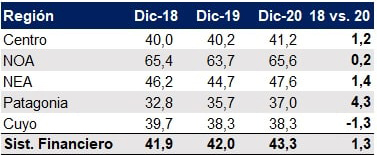
Provincial distribution per 10,000 adults
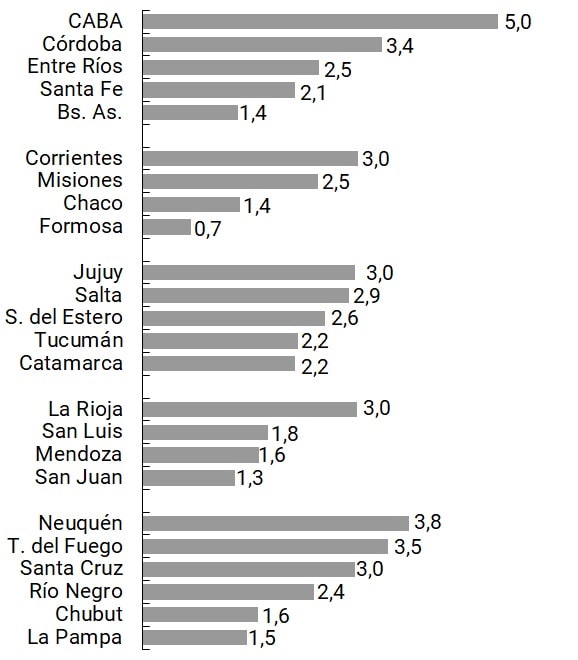
Note | The provincial distribution per 10,000 adults is calculated as of Dec-20.
Source | BCRA and COELSA.
Likewise, all regions show a significant proportion of ATMs for the blind in relation to their total ATM fleet. The Argentine northwest (NOA) has the highest proportion of ATMs for the blind in relation to the total number of ATMs (66%), almost doubling the Patagonian region (37%), which has the lowest value.
However, if we take the adult population as a reference, the provincial distribution of ATMs for the blind shows a mixed result. CABA is the most supplied jurisdiction with 5 ATMs per 10,000 adults, double the national average, while the province of Buenos Aires, despite being the jurisdiction with the highest absolute number of ATMs for the blind, presents a much lower result (1,4)69.
Within each region, the province with the highest number of ATMs for the blind in relation to the adult population more than doubles the province with the fewest, indicating an unequal intraregional distribution. The exception is the NOA, where Jujuy is 1.4 times higher than Catamarca, but all the provinces that make up this region have more than 2.15 ATMs per 10,000 adults. Thus, the proportion of blind ATMs, both in terms of the total fleet and the adult population, does not necessarily follow the geographical distribution of the total ATMs.
On the other hand, the supply of ATMs for the blind was analyzed according to the size of the EEFFs, grouping them into quintiles in ascending order according to the number of account holders, with the first quintile being the one with the fewest account holders and the fifth quintile the one with the highest number. In 2020, all groups showed a growth in the proportion of ATMs for the blind, except for the first quintile that remained constant, which has the lowest ratio. Likewise, in the same period, ATMs for the blind registered a higher growth than the total ATMs, which would imply that the new ATMs already have the aforementioned tools and/or the incorporation of these functionalities to the pre-existing ATMs.
In turn, if the coefficient of ATMs for the blind is considered with respect to the number of account holders of each entity, no significant differences are observed. It should be clarified that the first quintile exhibits a slightly higher value because the EEFF that make it up have very few account holders compared to the rest of the groups.
Figure A.2.2 | ATMs for the blind depending on the number of account holders
Proportion of the total number of ATMs
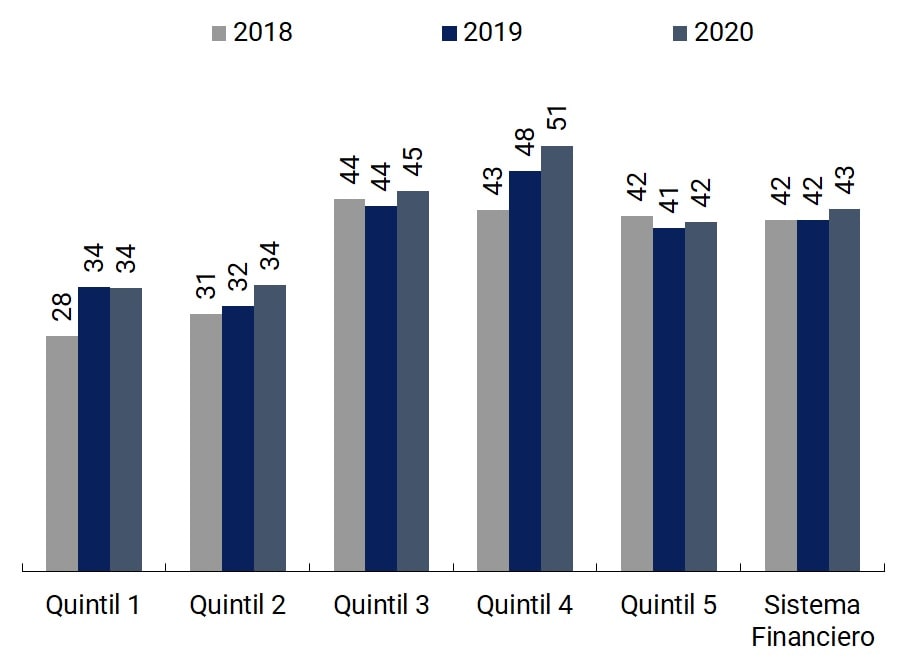
Devices per 10,000 account holders
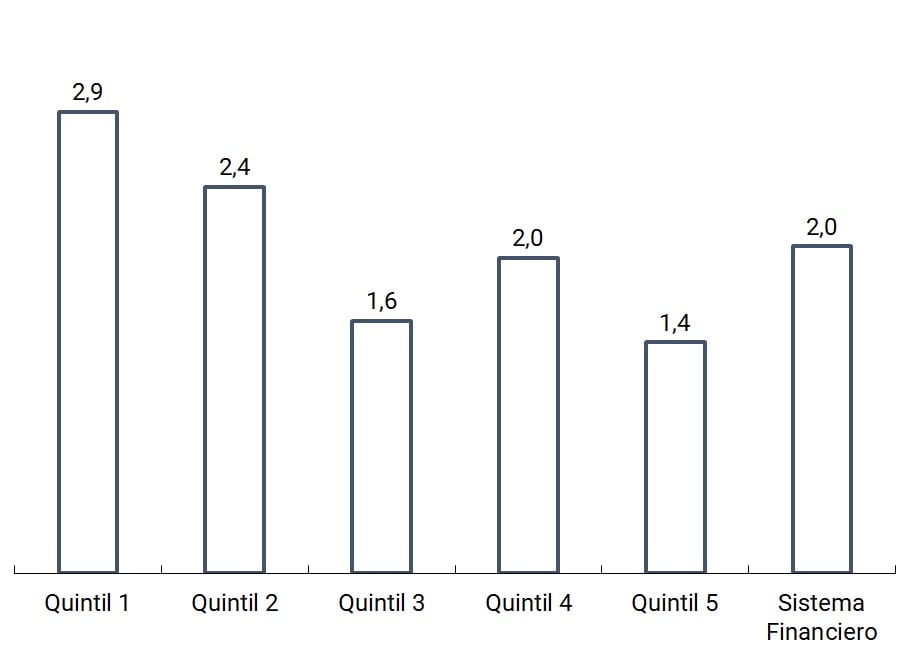
Note | Quintile 1: 0-75m, Q2: 75m-345m Q3: 345m-750m Q4: 750m-1,600m Q5: 1,600m-10,000m. The quintiles and devices per 10,000 account holders are calculated at Dec-20 and “m” stands for thousands.
Source | BCRA and COELSA.
It could be said that, both in terms of geographical coverage and the participation of EEFF account holders, ATMs for the blind have a level of supply in relation to the total number of ATMs far higher than that required by regulation70. Leaving the face-to-face environment, there are also barriers to access and use of financial services through other electronic channels, in particular the difficulties that blind people face when interacting with a computer or cell phone. This situation is exacerbated by the transition to the virtual world, boosted by the COVID-19 pandemic, where home banking and mobile banking environments are becoming more relevant. Going forward, the financial system has the challenge of extending the tools for the blind to a greater number of ATMs and self-service terminals and designing functionalities in all its service channels that facilitate their use.
Section 3 / What is financial health and why should it be taken into account?
A relatively new concept is being addressed among financial inclusion leaders, whose relevance has increased as a result of the financial and economic impact caused by the COVID-19 pandemic. It has even been considered in some recent initiatives, such as national financial inclusion strategies71.
The notion of financial health, on which there is still not full consensus on its definition and measurement among the specialists and agents involved, emerged in 2015 when the Center for Financial Services Innovation72 (CFSI) created the framework and definition for its application in the United States of America. Unlike other more limited metrics used in that country, such as credit scores73, financial health consists of a comprehensive measurement of people’s financial lives: it assesses whether they are spending, saving, applying for financing, and planning in such a way as to allow them to be resilient and seek opportunities over time. The framework included 8 indicators to assess individuals’ financial behaviors and results74.
For their part, for a decade now, international organizations, think tanks, governments and others have promoted financial inclusion as a means to promote economic development. In this sense, the global community concerned has begun to question its link with the fruits of economic development. From this view of financial inclusion on the impact on people’s well-being, the need has emerged to address and adapt, if necessary, the conception of financial health for the rest of the world and, in particular, for developing countries.
In 2017, CFSI75 concluded that the concept of financial health is extensible to other economies in its central aspects – day-to-day financial management, resilience and the ability to take advantage of opportunities. However, according to the research conducted, the measurement framework should consider factors from the context of developing countries. A set of 6 financial health indicators was constructed for the developing world (instead of 8) and 4 external factors, linked to each context, that condition a person’s financial health (see Infographic A.3.1).
Although members of the financial inclusion field agreed with the new approach of the CFSI, the work presents important challenges: (i) the research was based on only two countries (India and Kenya), where it did not reach national representativeness; (ii) the use of abstract terms, difficult to translate into commensurable questions76. This reflects the challenge of collecting data through large-scale surveys.
Infographic A.3.1 | Financial Health for Developing Countries
Source | Beyond Financial Inclusion. Financial Health as a Global Framework. March 2017.
At the same time, it should be added that the literature has explored the relationship between financial education and financial health. Recent studies have found, based on evidence for Latin American countries, that financial education has a positive effect on financial health, highlighting the importance of educational programs to improve financial knowledge, behaviors, and awareness77.
Despite the long way to go in its definition, the concept of financial health constitutes a unique contribution in the space of financial inclusion, as it focuses on measuring the effects of the use of financial services. As access to and use of financial services increases, research is asking whether individuals are meeting their needs78. Consequently, the notion of financial health complements and sheds light, at least in part79, on a key aspect that financial inclusion pursues: the advancement of the population’s quality of life. By focusing on the impact of people’s financial lives, it allows us to build bridges in the understanding of how access to and use of financial services influence their financial well-being. For example, does access to a bank account or loan really improve financial health? Finally, the idea of financial health underlines a fundamental and highly notorious aspect in the face of the global health crisis. It offers a mechanism to know if people manage financial resources effectively in their day-to-day lives and if, in addition, they are prepared to face unexpected situations. Thus, it provides key information to develop policy actions in order to strengthen the financial performance of individuals and to be able to monitor their evolution over time.
Methodological note
Population
dataThis Financial Inclusion Report (FIR) presents indicators that are disaggregated by different demographic and geographical variables. For the elaboration of these indicators, population data were used based on the population projection made by the National Institute of Statistics and Censuses of the Argentine Republic (INDEC). Considering that this agency does not publish a series that simultaneously contains all the disaggregations used throughout this IIF (gender, age group and geographical location at the provincial, departmental and locality levels), it was necessary to take different series according to the definition of each indicator.
For the indicators at the national and provincial levels, the series called “Population by sex and five-year age groups for the country and provinces as a whole” was used. Years 2010-2040″, while for the indicators at the departmental level, the series “Estimated population on July 1 of each calendar year by sex, by department” was taken as a basis. Finally, since INDEC does not publish a projection of the evolution over time of the number of inhabitants of each locality, it was necessary to construct the series for the indicators at that level, for which the results of the 2010 National Census were taken as a basis.
For the purposes of this IIF, an “adult” is considered to be a person 15 years of age or older, following the standard used by the World Bank for its financial inclusion indicators.
Regionalization
For the purpose of developing regional indicators, the regionalization criterion proposed by the Ministry of Economy and Public Finance (currently the Ministry of Finance) was used, which establishes five regions, namely:
– NOA (Northwest Argentina): Salta, Jujuy, Tucumán, Catamarca and Santiago del Estero.
– NEA (Northeast Argentina): Formosa, Chaco, Misiones and Corrientes.
– Nuevo Cuyo: Mendoza, San Juan, San Luis and La Rioja.
– Patagonia: La Pampa, Neuquén, Río Negro, Chubut, Santa Cruz and Tierra del Fuego.
– Centro and Buenos Aires: Córdoba, Santa Fe, Entre Ríos, Buenos Aires and the Autonomous City of Buenos Aires.
In the text of this IIF, Nuevo Cuyo is mentioned as Cuyo and Center and Buenos Aires as Center.
Extra-bank
withdrawal pointsIn order to determine the number of businesses that allow cash withdrawals, a survey was carried out by consulting the different companies that offer the service. Once the data was received and consolidated, the address reported for each extraction point was used to identify those businesses that operate through more than one brand simultaneously with the aim of eliminating duplications and obtaining a list of unique businesses. It should be noted that there are differences in the number of informants for the different editions of the survey. On the other hand, for the last edition, one of the companies reported the businesses that registered cash withdrawals during the last quarter of 2020 instead of the establishments that offer the service, which generated a considerable difference in the total number of non-bank withdrawal points identified with respect to the last published data.
Connectivity
dataInternet connectivity information was taken disaggregated by location and type of connection published by ENACOM. Given the existence of different types of connection, in order to simplify the status of internet access in each locality, a binary indicator was developed that considers a locality with internet access if it has at least one type of connection available (“Yes/No”). This was applied both for fixed internet access (ADSL, Dial Up, fiber optic, satellite, fixed telephony) and mobile (Wireless, 3G, 4G), without considering the quality of connection.
Then, taking as a reference the localities listed in the 2010 National Census (3,538) and the indicator mentioned above, the fixed and mobile connectivity status was assigned to the localities of the CN2010. There were cases where internet connectivity data is reported at a lower level of disaggregation to the locality (neighborhood or entity included), as well as others in which the locality with the largest number of inhabitants in the department does not have information available but the other localities in the department do. This information was used to characterize the localities in question, assigning the value “Yes” to the connectivity indicator to the extent that 50% or more of the neighborhoods that compose it or neighboring localities have connectivity. Finally, there is no information to characterize the connectivity of a set of 717 localities.
Non-Financial Credit Providers
Within the universe of non-financial credit providers there are providers that are simultaneously registered as non-bank credit card issuers (ETCNB) and as other non-financial credit providers (OPNFC). For the purposes of this Report and in order to avoid double counting of debtors, the individuals with financing from these suppliers are assigned to the institutional group (ETCNB or OPNFC) in which the supplier was originally registered.
Financial
Inclusion IndexThe ECLAC document “Financial Inclusion in Uruguay: Analysis through Synthetic Indices” was taken as a reference. The selection of variables was similar to those of Uruguay, taking the months between January-16 and December-20 as the period of analysis due to the availability of information.
As in ECLAC, the weights were obtained through the deterministic approach, whose advantage lies in the fact that the research team chooses the weights based on information from the economic reality. For the calculation of the indices, the variables were standardized using the formula (X-minimum)/(maximum-minimum) in such a way that the values of the variables range between 0 and 1. Once the variables have been standardized, the access, use, and global indices are calculated using the chosen weights, according to the aforementioned formula.
.jpeg)
It should be noted that these indices compare the state of financial inclusion between the different units of time (months or quarters) within the period studied, with their temporal evolution becoming more relevant than their specific value. In other words, the proximity of the index to 1 in a month does not imply optimal financial inclusion, but simply that it is better than in other months.
For the selection of variables that measure different aspects of financial inclusion and the calibration of their relative weight, an ECLAC document “Financial Inclusion in Uruguay: Analysis through Synthetic Indices” was consulted. This document analyzes various indices to measure financial inclusion in Uruguayan households. The Central Bank of Uruguay (BCU) has information on the banking and retail payments system that are the basis for the construction of the financial inclusion index from the supply side on a quarterly basis. The indicators are constructed taking into account the dimensions of access and use80.
Glossary
ACSF Complementary Financial Services Agency
AFIP Federal Administration of Public Revenues
ANSES National Social Security Administration
ASPO Preventive and Mandatory Social Isolation
ATM ATM
BCRA Central Bank of the Argentine Republic
CABA Autonomous City of Buenos Aires
CBU Uniform Bank Code
CENDEU Central Bank of Debtors of the Financial System
UGC Universal Free Account
CVU Uniform Virtual Key
ECLAC Economic Commission for Latin America and the Caribbean
CFSI Center for Financial Services Innovation
COELSA Electronic Clearing House
EEFF Financial Institutions
ENACOM National Communications Agency
ETCNB Non-Bank Credit Card Issuers
FAS Financial Access Survey
IIF Financial Inclusion Report
INDEC National Institute of Statistics and Censuses
CPI Consumer Price Index
M Mil
MPE Electronic payment methods
MSMEs Micro, small and medium-sized enterprises
NOA Northwest Argentina
NEA Northeast Argentina
PDA Access Points
POS Device at the point of sale
PNFC Non-Financial Credit Providers
P.P. Percentage points
PSP Payment Service Providers
OPNFC Other non-financial credit providers
SFA Expanded Financial System
TAS Self-service terminal
TO Ordered text
UVA Purchasing Value Units
References
1 See Financial Inclusion Report. First half of 2020. Local context.
2 TO Financial services in the framework of the health emergency provided by decree No. 260/2020 COVID-19.
4 The remaining 7.9% reside in localities without any FLW or in rural areas.
9 Digital Financial Education Campaign.
10 Virtual Trainings for Teachers.
12 An approach to financial tools for women state workers.
15 The increase in TAS is explained by the regularization of information by a public financial institution.
16 Number of bank branches, FELABAN and the IMF’s Financial Access Survey.
18 Financial Inclusion Report, November 2020.
19 This information comes from a survey of companies that offer this service. In this edition, one of the informants reported active businesses instead of establishments that offer the service, which generated a considerable difference in the total number of points identified with respect to the last published data. See methodological note for more details regarding the survey.
20 Using data from the National Communications Agency (ENACOM), the existence of connectivity is considered if the locality has at least one type of connection, which is determined if any of the internet providers reports to ENACOM at least one active user in the locality. The connection subtypes considered are (1) Fixed: ADSL, cable modem, fiber optic, dial-up; satellite; and (2) Mobile: Wireless, 3G, 4G.
21 For the purposes of this IIF, bank accounts or CBUs are those provided by the entities covered by the Financial Institutions Law No. 21,526, while those classified as non-bank accounts or CVUs are those payment accounts offered by Payment Service Providers (PSPs).
22 Chamber in charge of processing low-value payments electronically.
24 In parts of sub-Saharan Africa. Global Findex (2017).
25 The analysis by institutional group is only carried out for bank accounts, since non-bank accounts are provided by a single type of provider (PSP).
26 In some cases, this type of account may be offered, optionally, in conjunction with a deposit account. For more details on both types of accounts, see section 2.1 of the IIF for the second half of 2019.
28 In previous editions of this IIF, it has been reported that there was a gap of 0.6 p.p. in favor of women among bank account holders as of March 2018.
29 See section 2.1 of the IIF for the second half of 2019. According to the latest data available from ANSES (June-19), 3.6 million women and 2.1 million men were single holders with at least one retirement or pension; while 2.1 million women and 81 thousand men were holders of the Universal Child Allowance.
30 Made up of workers in the informal sector of the economy, low-income single-payers and workers in private homes.
31 Gender gaps in Argentina. State of the situation and challenges. Ministry of Economy.
33 In the age range over 65 years of age, total coverage is observed, which is explained by the high number of holders with at least one retirement or pension and the high percentage of account holdings in the 30 to 65 age group. It should be clarified that the series of the adult population is prepared based on INDEC population projections and that 94% of the deposit accounts of people over 60 years of age (women) and 65 years of age (men) correspond to pension accounts (latest available data: June-19; source: ANSES).
34 95% for the 18 to 64 age range. Access to and use of information and communication technologies. EPH. 4th quarter 2019. INDEC.
35 45% of AUH holders were in the 15 to 29 age range (latest data: June-19, ANSES).
36 In the second quarter of 2020, 1 million men and 500 thousand women (19% and 10% of their respective population) joined the 15 to 29 age group, while 1 million men and 450 thousand women (11% and 5% of their respective population) joined the 30 to 64 age group.
37 Regional family per capita income gap with respect to the national average: Patagonia +27%, GBA +11%, Pampeana +4%, Cuyo -19%, Northwest -32% and Northeast -41%. INDEC: National Household Expenditure Survey 2017-2018. Income report. June 2020.
39 Inclusive payments for the post-pandemic world. SUERF Policy Note. Issue No 193, September 2020.
40 In 2020, e-commerce increased its turnover by 124%, generated 84% more purchase orders and added more than 1 million buyers compared to 2019. Source: annual study of electronic commerce by the Argentine Chamber of Electronic Commerce. Statistics and Summary.
41 “Remote payments” includes card payments in a digital (non-face-to-face) environment and electronic transfers.
42 From April to December 2020.
43 CACE. Statistics and Summary.
46 See point 2.1 of the IIF for the second half of 2019.
47 Tutorials on key management, home banking payments and security measures for digital operations, among others.
51 The INDEC Monthly Estimator of Economic Activity shows a sharp month-on-month drop in the seasonally adjusted index in the months of March and April, which begins to recover from May. However, 2020 ended with a year-on-year drop in economic activity of 3% (Dec-19 vs. Dec-20), despite the fact that economic activity showed a reversal in its trend as of September 2020.
52 Report on Banks, BCRA, January 2021.
53 Communication A 7181 and Communication A 7198.
54 For more details, see local context of the IIF of November 2020 and Communication A 7140.
55 Represented by a lower salary account holding among its debtors (see previous IIF).
57 Sanroman Graciela, Ferre Zuleika and Rivero José Ignacio, September 2016, “Financial Inclusion in Uruguay: Analysis through Synthetic Indices”.
58 (X – minimum) / (maximum – minimum).
59 As of December 2020.
60 See Chapter 1, section 1.1. Evolution of the PDAs in the Financial Inclusion Report April 2020.
61 An alternative to this calculation would be to determine the weights based on the number of operations in each PDA, information that is not available at the moment.
62 In this first stage, financing and savings data have not been included, although their role is relevant in the development of financial inclusion.
63 See Chapter 2, section 2.2. Transactions by electronic means of payment and cash withdrawals in Financial Inclusion Report April 2020 and Communications A 6212 and A 6425.
64 Examples of regulations on the subject: payments through quick response (QR) codes, creation of the Uniform Virtual Key (CVU) -identifies PSP customers and facilitates interoperability-, extension of the electronic transfer system (bank and provided by PSP), among others.
65 “National Study on the Profile of Persons with Disabilities”, National Institute of Statistics and Census (INDEC), Final Results 2018.
66 See point 2.2.2 of the T.O. on “Protection of Users of Financial Services”.
67 See point 2.2.2 of the T.O. on “Protection of Users of Financial Services”.
68 and Communication A 7208.
69 A more accurate metric would be to express the number of TMJs for the blind as a function of the number of adults who have this difficulty. However, since there was no data by region and province, we worked with the adult population in general, in the denominator.
70 The regulations require entities to have ATM coverage with an audio system of at least 10% in relation to the total fleet (Protection of Users of Financial Services).
71 OECD/CAF (2020), National strategies for financial inclusion and education in Latin America and the Caribbean: implementation challenges.
72 Currently, the Financial Health Network.
73 The credit score indicates an individual’s ability to access a loan.
74 Financial Health Measurement.
75 Together with the support of the Center for Financial Inclusion at Accion, the Bill & Melinda Gates Foundation and Dalberg’s Design Impact Group. Beyond Financial Inclusion: Financial Health as a Global Framework. March 2017.
76 Measuring Financial Health: Not as Easy as It Looks. CGAP. April 2017
77 Arellano, A., Cámara, N., & Mejía, D. (2019). “Disentangling Vulnerability through Consumer Behavior: The Role of Financial Health” Working Papers 19/11, BBVA Bank, Economic Research Department.
78 Measuring financial health. What policymakers need to know. Insight2impact &Cenfri. May 2020
79 Since it does not consider non-financial results. See A Research and Learning Agenda for the Impact of Financial Inclusion. CGAP. December 2020 .
80 For more information on the methodology and results in Uruguay, see the following working paper: Sanroman Graciela, Ferre Zuleika and Rivero José Ignacio, September 2016, “Financial Inclusion in Uruguay: Analysis through Synthetic Indices”. CGAP. December 2020.
Share on


