Executive summary
4.8 million new deposit accounts were opened in pesos during the second quarter of 2020, at the same time that the available coverage of accounts made it possible to channel social assistance | The possibility of opening it remotely and the obligation of financial institutions to offer the Universal Free Account (CGU), made it possible to respond to the increased demand for bank accounts and electronic means of payment. In particular, they facilitated the payment of the Emergency Family Income and the Emergency Assistance Program for Work and Production to those who lacked a bank account.
More than half (53%) of the 8.9 million people who received the first IFE settlement did so through a bank account, while of the remaining half, 54% already had an account at the time of collection | In other words, 78% of the people with the highest degree of socioeconomic vulnerability in the country had at least one bank account.
Electronic devices and extra-bank withdrawal points played a fundamental role in the provision of cash to the population during the Preventive and Mandatory Social Isolation (ASPO) | More than 11,000 ACSFs were incorporated. However, the ACSF tended to be located mostly in localities that already had ADP and with better socioeconomic indicators (households whose owners have a greater number of years of education and a lower percentage of the population with at least one unsatisfied basic need -NBI-).
The pandemic and the consequent ASPO measure boosted the use of electronic means of payment and electronic channels | Electronic transfers accumulated increases of 61% and 93% from March to August, in real amounts and amounts per adult, respectively. In that same period, debit card payments in e-commerce also stood out, with real amounts tripling and amounts doubling – measured per adult.
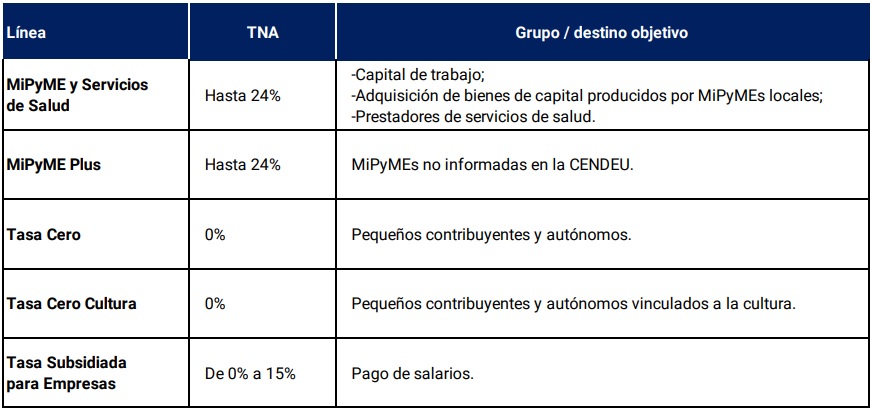
Financing lines for MSMEs, small taxpayers and the self-employed contributed to mitigating the effects of the pandemic |These special lines of financing with subsidized interest rates accumulated a total amount of $482,000 million as of August 2020, which represents 18% of the total financing in pesos to the private sector. The MSMEs and Health Services and MSMEs Plus lines were the most significant in terms of average amounts (around $3.8 million) and reached more than 110,000 companies. The Zero Rate and Subsidized Rate for Companies lines totaled 533,174 loans with an average amount of $119,000 per assistance.
The main recipients of the MSMEs and Health Services and MSMEs Plus lines were micro and small enterprises | These companies represent 77% of the total number of beneficiaries. Services and commerce were the activities that concentrated the most companies. In geographical terms, the Central region encompassed the largest proportion of productive units and balances of these special lines of financing.
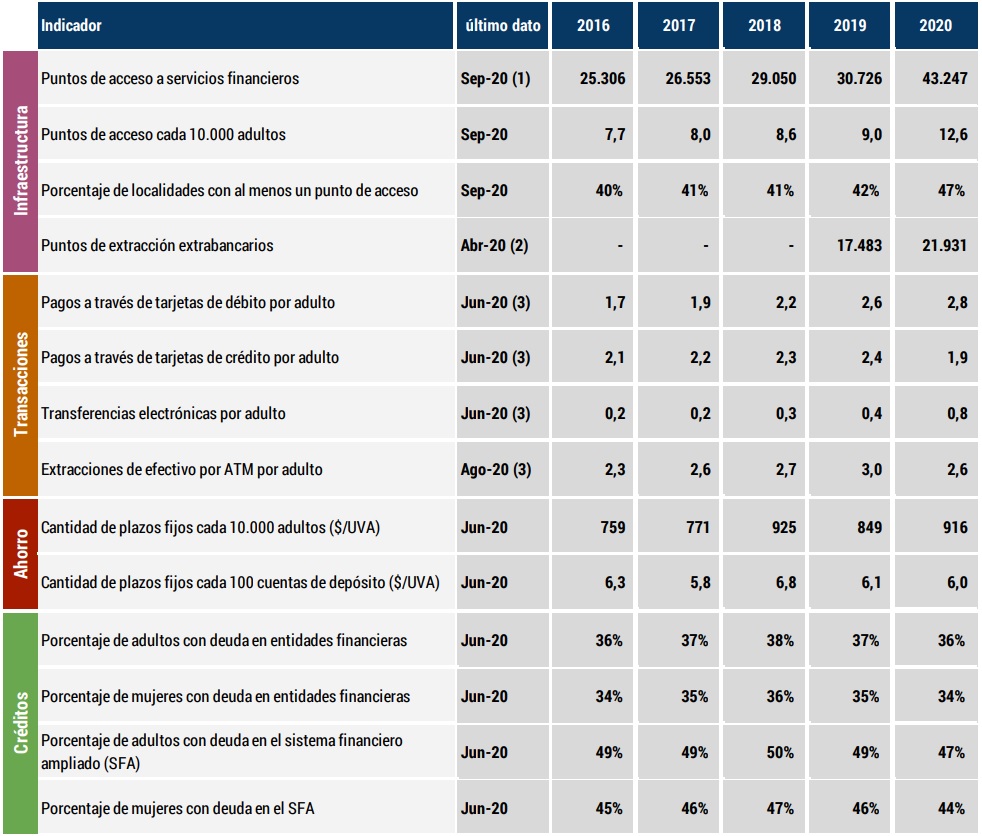
Indicator Table | Financial inclusion in Argentina
Local context
The COVID-19 pandemic is the most prominent event affecting the world economy since March of this year. In line with the measures taken at the global level, the National Government adopted various actions to mitigate the economic and financial effects of the health crisis, including income transfers to the most affected households and the creation of special lines of financing for micro, small and medium-sized enterprises (MSMEs) and self-employed workers.
In particular, the BCRA, as regulator of the financial system, implemented different measures with the aim of tempering the transitory fall in income and facilitating the operations of households and companies in the financial system. The pandemic changed the habits of access to and use of financial services, putting to the test the instruments and tools that the BCRA’s financial inclusion agenda promotes.
When the COVID-19 pandemic led to the declaration of the beginning of the Preventive and Mandatory Social Isolation (ASPO), financial inclusion was built on solid foundations, but with pending challenges to address an atypical context. On the one hand, the high number of bank accounts by the population made it possible to make effective the payment of the Emergency Family Income (IFE)1 and the Emergency Assistance Program for Work and Production (ATP)2. More than half (53%) of the 8.9 million people who received the first IFE settlement did so through a bank account. Of the remaining population, it was determined that 54% had a bank account, despite not having used it as a means of collection3. In other words, 78% of the people with the highest degree of socioeconomic vulnerability in the country had at least one bank account.
It should be noted that anyone can open a bank account, in person or remotely, to receive funds, make payments and transfers through different electronic channels, with the characteristics of free in its opening, maintenance and basic operations.
However, the high number of bank accounts contrasted with the low use of means of payment and electronic channels4. Lack of knowledge of the available services associated with a bank account and the preference for the use of cash are factors that could be linked to the low use of financial services, which is a pending challenge. Electronic means of payment were on a path of sustained growth and, since the ASPO, most of them have deepened their dynamics. Payment operations with debit and credit cards and electronic transfers accumulated increases in recent years, both in amounts and in per capitavalues 5. at constant prices.
To reinforce this trend, at the end of March, the BCRA ordered the delivery of cards by postal mail6, thus facilitating their availability to operate. Along the same lines, it was established that Payment Service Providers (PSPs) must enable all their customers to send and receive transfers of funds to and from bank accounts, their own payment accounts and those of other PSPs, without imposing additional delays when these transfers are made through payment schemes with immediate accreditation7.
On the other hand, in terms of access points to the financial system, the high availability of ATMs and alternative withdrawal points facilitated access to cash. Along these lines, in order to reduce the possible risks of contagion associated with their search, the BCRA established that all ATMs must admit withdrawals of at least $15,000 per day and in a single operation. Also, the collection of commissions and charges for all operations carried out on these devices (including withdrawals) was suspended, making it indifferent to withdraw cash at ATMs of different networks or located outside the branches.
More than 90% of the adult population resided in localities with at least one ATM, where they could withdraw cash from any type of bank and non-bank account. In addition, there were another 22,000 extra-bank cash withdrawal points, particularly shops and extra-bank collection centers8. In parallel, during this period, new access points to the financial system were opened through complementary financial services agencies (ACSFs), helping to expand the capillarity of the financial system and the availability of face-to-face services. It should be noted that there is some overlap between non-bank cash withdrawal points and ACSFs as a significant proportion of non-bank collection centres fulfil both functions.
Anticipating the economic impact that the pandemic would unleash, the BCRA designed a set of low-cost financing tools focused on MSMEs. It should be remembered that the latest available data on access to financing for companies showed a great disparity according to their size. Only 53% of microenterprises had taken out financing during 2018, while for large companies this value was 96%9. Thus, the BCRA provided financing lines so that MSMEs do not have to face extremely acute financial situations in the face of this unprecedented health and economic crisis. In this way, credit regulation was adjusted by reducing minimum cash requirements. This reduction is effective whenever financial institutions apply these funds to finance the following destinations and/or beneficiaries10:
Finally, it sought to strengthen bank savings in pesos by establishing a minimum interest rate, which is determined as a percentage of the monetary policy rate. This percentage depends on the amount of the fixed term, the classification of the financial institution under the Minimum Cash standards and whether the person saving is a natural or legal person11. At the end of October, the fixed-term interest rate for placements of up to $1 million by individuals stood at 34%12.
The pandemic highlights the relevance of certain challenges for financial inclusion in Argentina. Internet connectivity and access to devices such as cell phones and computers have advanced, but there is a certain divergence within the territory and differences that deepen according to age range and educational level13. Likewise, there is evidence of a low intensity of use of savings products in the financial system, an unbalanced distribution of branches, ATMs and TAS, between and within each province, the use of cash as the main means of payment for consumption expenses, ignorance and/or lack of use of bank accounts by their holders and a certain disparity in access to financing for companies depending on their size.
1. Physical infrastructure
The impact of the COVID-19 pandemic highlighted the importance of a financial system with greater capillarity and accessibility, which allows the population to access and make use of face-to-face financial services quickly and securely. On the one hand, the use of cash continues to be significant in the payment of daily operations, implying a positive assessment of the cash withdrawal points by the population. On the other hand, for certain groups of people where technology is perceived as a restriction, face-to-face attention by the financial system is a desirable attribute.
At the beginning of the ASPO, the BCRA, with the aim of mitigating the spread of the virus, determined the closure of the branches for customer service14, maintaining the commitment to guarantee the provision of the necessary cash at ATMs and the continuity of the cash withdrawal operation at extra-bank points.
The measure remained in force for a short period, and then was replaced by a public service scheme aimed at retirees, pensioners and beneficiaries of social assistance plans or programs granted by ANSES15, including the exceptional opening during the weekend of the16th. Subsequently, the service was expanded to serve the general public, with a system of shifts managed through electronic channels still in force today to access branches17. Thus, since the ASPO declaration, ATMs, complementary financial services agencies (ACSFs) and extra-bank withdrawal points have become more relevant as a means of obtaining cash, and electronic means of payment for carrying out daily transactions as developed in Section 2.2.
1. Evolution of access points. In this context, since the last edition of the IIF, there has been a strong growth in financial service access points (PDAs) explained by the incorporation of ACSFs. This figure began to act locally during the third quarter of 2019 and registered its highest growth during 2020. Thus, during the third quarter of 2020, the delegation of banking operations was registered in more than 11 thousand points distributed throughout the country. The addition of these ACSFs represented a 41% increase in the total number of FLWs during the first nine months of the year, higher than the average increase of 5% for the same period in the previous three years.
At present, the operations offered at these points by financial institutions (EEFF) are concentrated to a greater extent on cash withdrawals and the payment of services and loans, and to a lesser extent on the deposit of cash and the opening of accounts to new users. Thus, compared to branches, the bulk of ACSFs offer a limited range of financial services. Thus, its impact is for the moment greater in terms of supporting the transactionality of the population that lives or works in underserved areas, than in terms of generating new financial users.
Figure 1.1 | PDA by type and by type of EEFF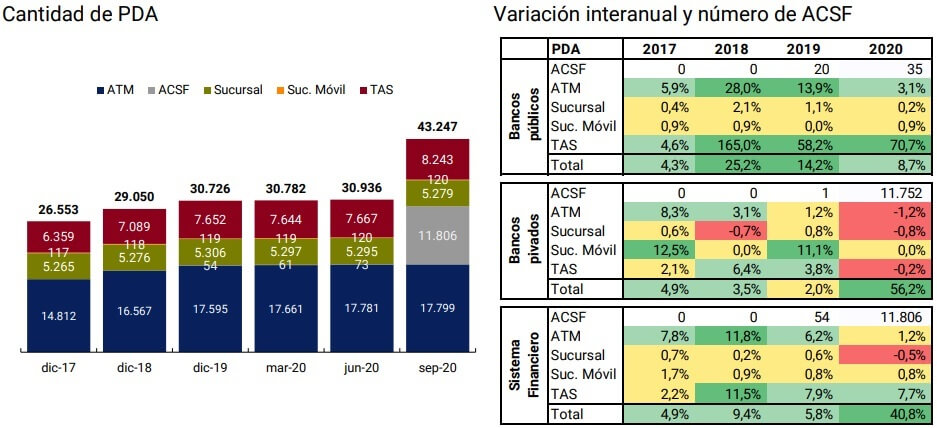
Note | The year-on-year variation in 2020 corresponds to the first nine months of the year. For ACSFs, the number of authorized agencies is indicated.
Source | BCRA and networks.
In contrast, branches had a net reduction of 27 points during these first nine months of the year. Although the total number of branches remained relatively stable over the years, there was evidence of a slight upward trend, with values between 0.2% and 0.7% per year between 2017 and 2019. This trend was interrupted during 2020, in which private EEFF recorded the net closure of 27 branches (representing 1% of the total number of branches enabled at the end of 2019). This performance is in line with the global trend of slow reduction of branches in recent years, showing a change in the format of financial servicesprovision 18. For their part, public LFFs still register a slight net growth of 3 branches nationwide (0.2% of the total) given their focus on promoting broad services for underserved or underserved populations.
Regarding ATMs, there is a decrease in the growth rate that they had been demonstrating in recent years, registering in the first 9 months of 2020 an increase of 1.2% in relation to the 7% average of the same period in the previous 3 years. Again, for ATMs, the distinction is repeated in the behavior of public and private banks: although the former reduced the growth rate previously evidenced, in 2020 they still show net creation (3.1%), while the private ones have implemented a divestment of the order of 1.2% in the number of ATMs in the first nine months of the year.
TAS19, on the other hand, registered a higher increase than that observed in the same period of 2019, which is mainly explained by the incorporation of almost 600 devices by a public financial institution within its branches. Private banks reduced the amount of TAS nationwide by 11 units, representing a 0.2% drop in total TAS.
The evolution of the financial infrastructure during 2020 and in the context derived from the COVID-19 pandemic, shows that private banks have expanded their points of service through the figure of the ACSF, although providing a limited number of services. For public banks, despite observing a reduction in the growth rate recorded in previous years, the trend is still towards the net creation of all types of PDAs.
2. Geographical distribution of the ADPs and level of coverage. Although in absolute terms the geographical distribution of the ACSF followed the pattern of thePDA 20, considering the reality from which each district started in December 2019, the impact was greater for provinces historically more relegated in their number of FLW. Such is the case of San Luis, Formosa and Catamarca, which although they are still among the provinces with the lowest absolute FLW, with the incorporation of the ACSF they considerably increased their amount of FLW.
The case of CABA is interesting to note, since being the second jurisdiction with the largest number of FLW in the country, it is the one that obtained the lowest relative growth with the incorporation of ACSF (See Figure 1.3). This could be explained by the fact that private banks, which are leading the deployment of ACSFs, have concentrated investment in their own infrastructure in the main urban centers and do not need to resort to outsourcing to increase their presence in them.
Since it is mostly the public and private banks that act as financial agents of the provinces (Private AFPs) that have already made and continue to make the largest investments in their own physical infrastructure in the underserved places (See Figure 1.2), it will take time to evaluate the net contribution that the emergence of the ACSF will have among the most vulnerable populations in terms of financial inclusion. beyond its transactional dimension.
Figure 1.2. shows that public banks and private banks that are financial agents of provinces have a greater proportion of their FLW located in the last four deciles of localities, that is, in localities with the worst vulnerability indices. In the case of public banks, if the comparison is made in absolute numbers, it is observed that the number of PDAs exceeds that of private banks.
Figure 1.2 | Vulnerable localities and financial infrastructure of the EEFF
Note | Percentage of PDAs on their own physical infrastructure. The construction methodology is found in the Methodological Note.
Source | BCRA and INDEC CNPHV 2010.
The number of FLWs per 10,000 adults also shows a significant jump, both at the national and provincial levels. In this way, Argentina went from 8.9 FLW per 10,000 adults in December 2019 to 12.6 in September 2020, with ATMs remaining the type of FLW that contributes the most to the indicator with 5.2 ATMs per 10,000 adults. With these new values, Argentina improves its performance in the regional comparison, approaching Mexico (12.7 FLW per 10,000 adults) but still below Brazil (22.2) and Colombia (39.4)21.
In particular, in relation to second-tier jurisdictions, there were more cases of departments that, as of December 2019 with a level of FLW per 10,000 adults below the median (7.7 FLW per 10,000 adults), saw their FLW indicator per 10,000 adults increase at a higher rate than that observed for departments that had a FLW indicator above the median as of December 201922.
Figure 1.3 | Distribution by province of FLW and ADP per 10,000 adults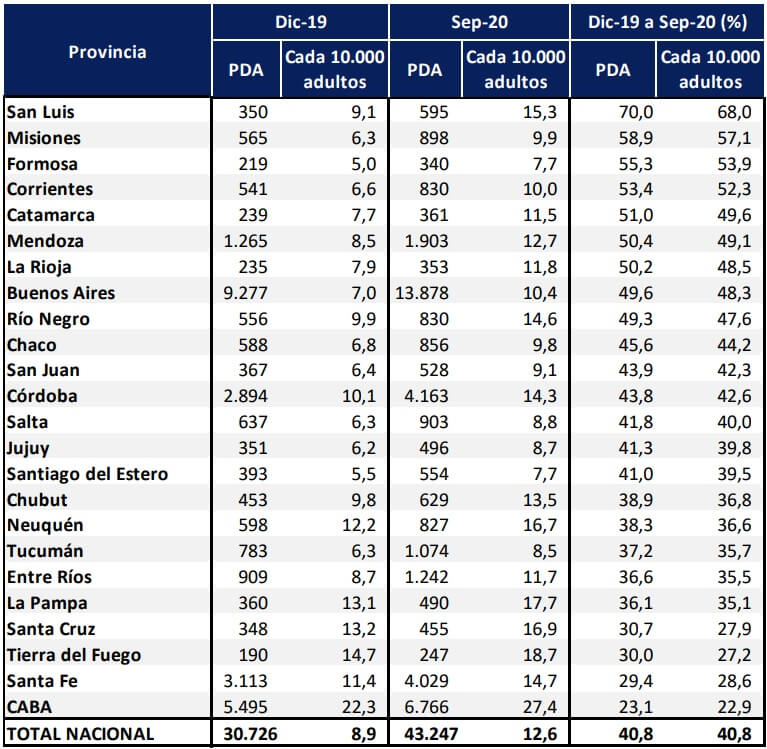
Source | BCRA, networks and INDEC.
The incorporation of the ACSF generated an advance in the level of coverage of localities. Since 2017, the level of coverage of the localities showed a slow but sustained increase that ranged between 21 and 39 additional localities covered per year (between 0.6% and 1.1% of the total). At the end of 2019, the value of 1,484 localities with at least one PDA was reached, which represented 42% of the total localities identified in the last National Census; while as of September 2020, the maximum value was reached with 1,663 seats served by at least one PDA.
The irruption of the ACSF, with its more than 11 thousand points distributed in 1,291 localities (36.5% of the national total), resulted in an increase in the locality coverage indicator to 47%, increasing 5 p.p. since December 2019. ACSF was opened in 1,117 localities that already had at least one PDA, while 174 localities that so far did not have any PDAs were incorporated. On the other hand, it is highlighted that although there was a net closure of 27 branches, the redistribution of this type of point resulted in 7 new locations having at least one branch and two others losing their coverage.
Taking into account the adult population living in each locality, it can be observed that 8% of the localities with less than 2,000 adult inhabitants have at least one branch, while if we consider the ACSF the indicator rises to 15% of the total. Considering all types of FLW, only 27% of localities at that population level have at least one FLW. On the other hand, for localities with more than 50,000 adults, coverage is total, which confirms the hypothesis that access points tend to be located in administrative or territorial units with a significant number of inhabitants.
Figure 1.4 | Coverage of localities by at least one PDA
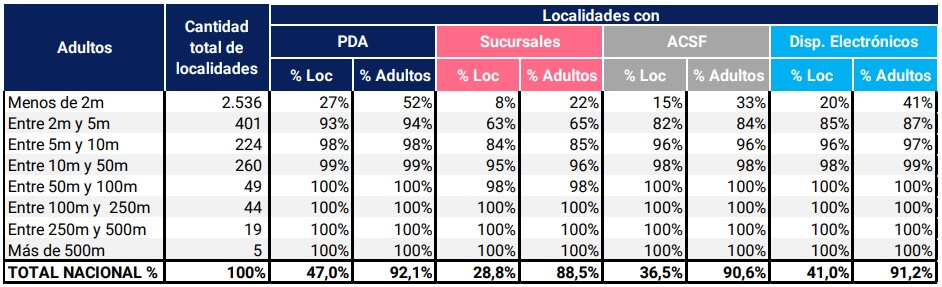
Note | The national total adult population also considers the dispersed rural population. m= mil
Source | BCRA, networks and INDEC.
In the particular case of the ACSF, although they provide additional points of attention, they are not necessarily being opened in the localities with the most vulnerable populations. If we divide the localities into four groups: (1) localities that did not have PDA as of December 2019, nor ACSF as of September 2020, (2) localities that did not have PDA as of December 2019, but did have ACSF as of September 2020, (3) localities that had PDA as of December 2019, but not ACSF as of September 2020, and (4) localities that had PDA as of December 2019 and ACSF as of September 2020; We can present, according to the information from the 2010 National Census of Population, Households and Housing, the average values observed for the variables years of average education of heads of household, years of average education of the mother of the household and percentage of the population with some NBI.
Figure 1.5 | Localization characterization
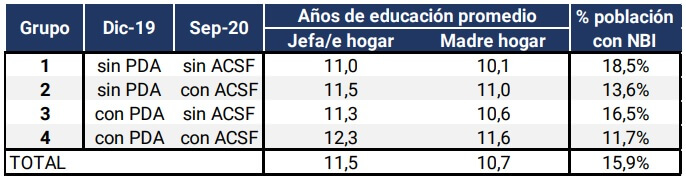
Source | BCRA and National Population and Housing Census 2010.
The values corresponding to group 4, localities where most of the ACSFs have been installed, present indicators of a greater number of years of education and lower percentages of the population with at least one NBI. On the other hand, when looking at the localities of group 2, which did not have PDA and now has ACSF, the values do indicate more vulnerable localities but still with values of lower vulnerability than the localities of group 3, served with PDA other than ACSF, and those of group 1, without PDA.
Thus, the BCRA will closely monitor the impact that the opening of ACSF may have on the evolution of other types of ADPs, as well as on the characteristics and conditions of care of the population served through them.
3. Location and time availability of electronic devices. Electronic devices intended for the provision of financial services (ATMs and TAS) can be located both inside and outside branches. As of September 2020, 73% of the total number of ATMs (both bank and non-bank) are located inside branches, while 27% are located outside them, in places such as supermarkets, gas stations and shopping malls, among others. In the case of TAS, the concentration within banking establishments is almost total, with 99% of the devices located inside and only 1% outside.
These data show that, in order to make use of an electronic device, which allows, among other operations, the withdrawal and/or deposit of cash, the making of transfers and the payment of services, the user population usually must go to a bank branch. Since branches are usually located in urban centers, this implies the movement of people (sometimes over long distances), as well as their concentration in small spaces, which became critical factors during the COVID-19 pandemic.
In this sense, for the purposes of analyzing the quality of the service provided by each PDA, not only its location but also its time availability must be considered. Devices within branches may be located in a lobby that can be accessed 24 hours a day or in the customer service room with restricted accessibility during banking hours. In turn, devices located outside banking establishments can be in places without limited hours for access (such as those on public roads, hospitals or police stations) or with restricted hours (such as in supermarkets and shopping malls).
Taking into account the availability of hours, it is observed that 76% of the bank ATMs (located both inside and outside the branches) have 24-hour accessibility, while the remaining 24% offer limited hours. The evolution of the indicator shows that, although the proportion of devices with 24-hour availability and limited hours has remained relatively constant over time, there is a slight trend towards an increase in devices without time limitations. This could mean that new devices are located in locations with 24-hour availability. In this way, the existing structure of time availability allowed financial services to be supported during the ASPO.
In the case of TAS, a considerably lower proportion of devices with 24-hour availability is observed, which added to the concentration of these PDAs in branches means that access to 43% of the devices is restricted to banking hours. The trend shows a growth of terminals with limited hours, indicating that the EEFF that enable this type of device would tend to choose to locate them in the customer service rooms of their branches.
Figure 1.6 | Time availability of bank ATMs and TAS
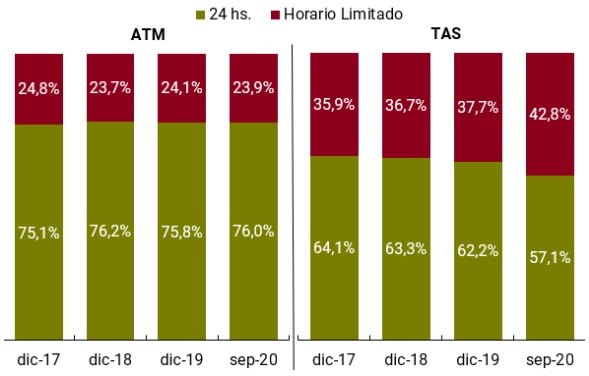
Source | BCRA.
The difference in time availability between ATMs and TAS could be associated with the fact that these devices offer different services. TAS focuses its operations on depositing cash or checks, as well as making transfers and paying for the bank’s own customer services. For their part, ATMs have the central function of dispensing money to the general public and, on the other hand, they allow transfers, payments for services, among other operations, in the case of the entity’s own customers. Also, as a complementary function, some ATMs allow the deposit of cash and/or checks.
2. Deposit accounts and payment and savings methods
2.1. Deposit
accounts The COVID-19 pandemic and the Preventive and Mandatory Social Isolation (ASPO) highlighted the importance of having bank accounts. These facilitate the performance of daily operations such as making payments and transfers, receiving funds or withdrawing cash, without the need to operate over the counter in a branch.
In this context, the high number of bank accounts in our country23, the possibility of opening them remotely and the obligation of the EEFF to offer the Universal Free Account (CGU)24, facilitated the payment of the Emergency Family Income (IFE) and the Emergency Assistance Program for Work and Production (ATP). These programs were created by the National Government to mitigate the negative effects of the pandemic on the income of the population.
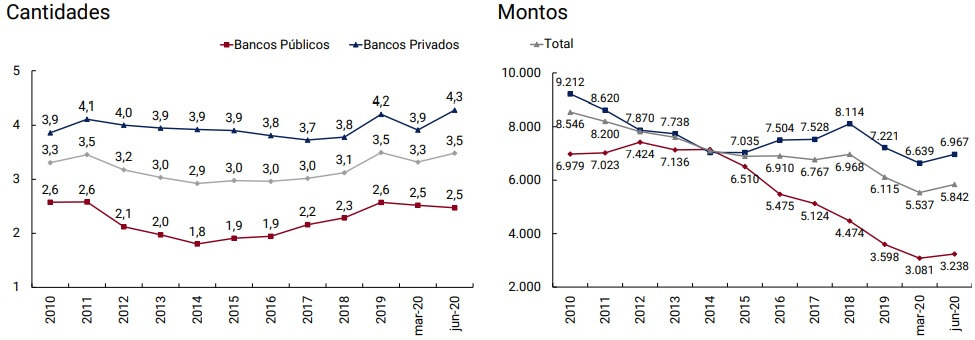
The ATP program is aimed at workers in the private sector25 and involves disbursements in their salary accounts. On the other hand, IFE26 consists of an exceptional income transfer aimed at compensating for the reduction in income in the most vulnerable sectors of the population. More than half (53%) of the 8.9 million people who received the first settlement did so through a bank account. Of the remaining population, it was determined that 54% had a bank account, despite not having used it as a means of collection27. These data indicate that 78% of people with the highest degree of socioeconomic vulnerability hold at least one bank account. From the settlement of the second IFE, the transfer was made only through bank accounts, which implied a process of remote account opening by the beneficiaries.
It is estimated that these programs, together with the need and convenience of using digital financial services, would explain the increase of 4.8 million deposit accounts inpesos 28 (10% growth) observed during the second quarter of 2020. This increase (from 47.5 to 52.3 million) was distributed between public banks (46%) and private banks (47%) and, to a lesser extent, financial companies (7%). The net opening of deposit accounts in pesos recorded in that quarter far exceeds what has happened in recent years, both in the total as a whole and in each of the EEFF groups, which is reflected in the high quarterly growth rates -77% in financial companies, 11% in public banks and 8% in private banks-.
Figure 2.1 | Deposit accounts in pesos
Note | The net opening of accounts by EEFF group is expressed in thousands.
Source | BCRA.
However, significant deposit account ownership is not necessarily associated with high usage of deposit accounts. Various international surveys show the difference between the self-reported ownership of deposit accounts in the interviews29 and the actual ownership of deposit accounts by the adult population (80%), a gap that would reflect the lack of knowledge of many people regarding the possession of this financial product. It should be noted that deposit accounts have a free scheme for various services such as home-banking, mobile banking, ATMs or TAS, such as electronic funds transfers, payment of services, recharge of prepaid services, among others. In this way, a bank account simplifies everyday transactions and reduces the risks associated with the use of cash.
One way to infer the intensity of use of deposit accounts comes from the number of debits30 made on them and their average amount. In the last 10 years, the amount of debits per deposit account grew by only 5%, from 3.31 in 2010 to 3.48 in the first 6 months of 2020 (See Figure 2.2). While the number of debits is growing at a similar rate to the number of deposit accounts, it cannot be determined whether the growth in the number of debits is due to new or existing accounts. However, when disaggregating the metric by EEFF group, a different dynamic is observed between private and public banks, mainly explained by the higher growth rate of deposit accounts in public banks.
As a result of the ASPO and other effects mentioned, the number of debits per deposit account increased by 5% between March and June of this year, mostly explained by transactions in private banks that grew by 10% while public banks did not show significant changes. For private banks, the amount of debits registered in June represents the highest value in the last 10 years. Even in a context of quarterly growth in the total stock of deposit accounts of 8%, the number of debits in absolute terms increased 14%, showing the channeling of new operations through deposit accounts.
As will be seen in Section 2.2, the increase in the number of debits occurs in a context of increased use of electronic payment channels and means, which is reflected in a significant growth in home-banking and mobile-banking transfers and a slight increase in debit card payments. since the number of cash withdrawals was reduced. Most financial institutions have electronic home-banking and mobile-banking channels, allowing their customers to carry out these operations remotely.
Figure 2.2 | Debits by deposit account and average debit amount in pesos
Note | Quantities and amount by institutional group expressed in monthly averages at constant prices (base CPI 100 = January 2019)
Source | BCRA.
In terms of values, the average amount per debit was around $5,500 at constant prices in March 2020. Similar to the increase in the number of debits, there is an increase in their average amount in the second quarter (6%), where public and private banks registered the same variation (5%). As a result of the ASPO, the increase in the average debit is explained by the increase in the amount of cash withdrawals (See Section 2.2) and by operations that were previously carried out in cash in person, such as the payment of services and the purchase of goods in stores, which were now carried out through deposit accounts.
The average debit amount in private banks doubled the value registered in public banks. This difference may originate, in part, from the structure of deposit accounts. The greater concentration of pension accounts and social programs in public banks (50% vs. 39% in private banks)31, whose credits are lower in relation to those received by dependent and self-employed workers, could be an explanatory factor for the disparity between average debits. Likewise, the level of financial skills decreases as income decreases32 and the use of technology tends to decrease among older adults33.
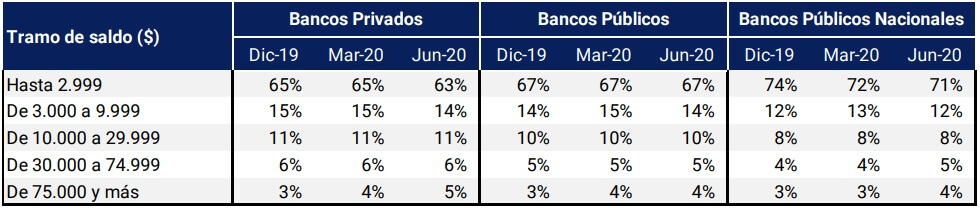
This behavior is also in line with the higher relative proportion of accounts with average daily balances of less than $3,000 in public banks (67% vs. 63% in private banks as of June-2020), a factor that is accentuated in national public banks where 71% of the accounts are located in the lowest stratum34. Since public banks are the ones that focus mainly on the attention of these groups, the relative evolution of amounts and average amounts operated by the institutions belonging to this group is to be expected.
Figure 2.3 | Distribution of the number of deposit accounts in pesos by balance stratum
Source | BCRA.
In conclusion, the high possession of deposit accounts by the population facilitated the payment of income transfer programs as a result of the pandemic (ATP and IFE). On the other hand, the aforementioned programs plus the need to operate remotely, implied a significant boost for the opening of new bank accounts. However, the use of these accounts continues to be low, especially among the most vulnerable population and those with lower technological capabilities, although they are on a path of slow but continuous growth. Possibly, the approach of people to electronic payment channels and means as a result of the isolation situation causes changes to different degrees in the habits of use of accounts, depending on the financial skills and access to technology and internet of the users, among other factors.
2.2 Transactions by electronic means of payment and cash
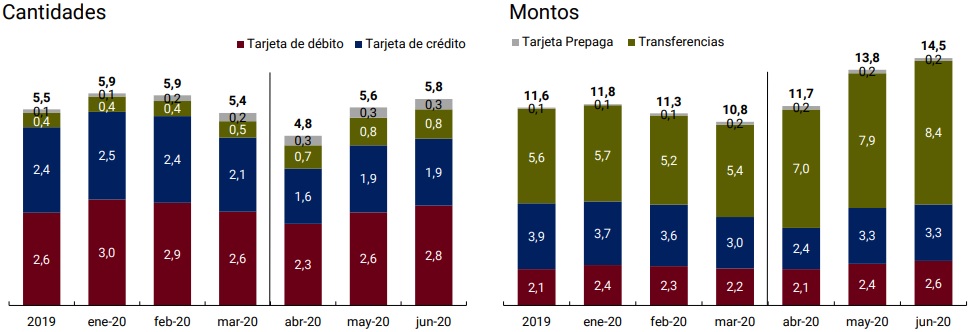
withdrawalsThe health crisis and the consequent ASPO measure boosted the use of electronic payment channels and means, causing changes in the population’s payment and cash withdrawal habits. In the case of face-to-face transactions in stores, the use of debit and prepaid cards is an effective instrument in the current context, since it reduces contact with cash and avoids previously resorting to an ATM. In relation to e-commerce operations, all types of cards can be used to make online payment for purchases of goods and services. On the other hand, electronic transfers facilitate the sending of money between people and the payment of services, avoiding the use of cash and the physical presence in branches, shops or collection centers. This positive aspect of transfers highlighted the importance of electronic channels such as home-banking, mobile-banking and electronic wallets.
Electronic means of payment, with the exception of credit cards, have been experiencing sustained growth for several years. The number of transactions per adult grew at double-digit annual rates in 2018 and 2019; being higher in the case of prepaid cards (75%) and electronic transfers (33%) than in debit cards (18%). In terms of amounts per adult, these operations showed a similar trend to the amounts, but at lower rates.
During the first half of 2020, the use of electronic transfers and prepaid cards intensified, reaching historic highs, both in quantity and amount of monthly transactions per adult. On the other hand, as a result of the closure of businesses and the lower circulation of people, at the beginning of the ASPO there was a slowdown in the monthly growth of debit card operations, to then show a recovery starting in May.
Figure 2.4 | Electronic payment transactions per adult
Note | Average monthly amount and amount per adult. Amounts in thousands of constant pesos (base CPI 100 = January 2019).
Source | BCRA and INDEC.
In this way, electronic means of payment had a mixed behavior in the month of April -taking March as a turning point-, with a drop in quantities (-12%) and an increase in real amounts (9%). This was due to the high face-to-face component of electronic payments, mainly with cards on physical devices (POS). But then, there was a growth in real amounts and amounts (7% and 35%, accumulated from March to June of this year) and, as a result, a greater participation of operations that are carried out exclusively remotely, such as electronic transfers. On the other hand, it should be noted that the historical record of opening 4.8 million deposit accounts during the second quarter of the year (See Section 2.1), also had a positive impact on the growth of electronic payment transactions per adult.
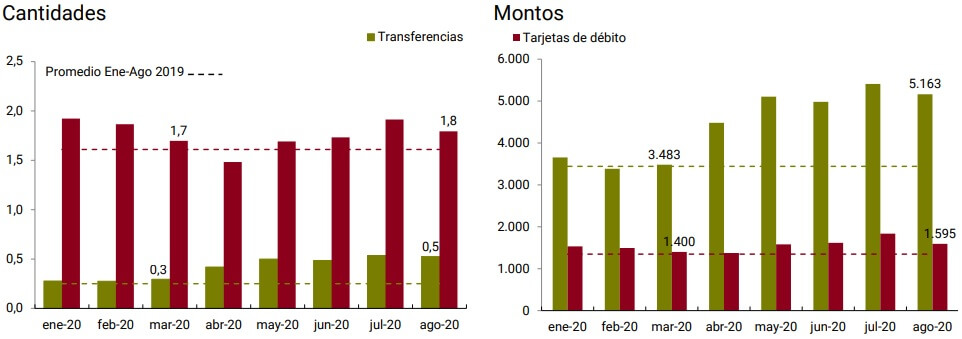
Electronic transfers were the operations that contributed the greatest dynamism to the performance of electronic means of payment, being the instrument that grew the most in April, under an environment of strict isolation. This responds to its intrinsic characteristics as a means of remote payment, both for the purchase of goods and services, as well as for sending money for family aid purposes, or the payment of services and fees, among others. In that month, electronic transfers registered the largest monthly increase in the last 4 years, both in real amounts (29%) and in amounts (42%) and, from March to August, accumulated an increase of 61% and 93%, respectively.
Figure 2.5 | Wire transfers per channel per adult
Note | Average monthly amount and amount per adult. Amounts in constant pesos (base CPI 100 = January 2019). Only operations of human persons are contemplated.
Source | BCRA and INDEC.
Prior to the pandemic, home-banking had the highest volume of transfers, both in amounts (70%) and amounts (82%). This behavior was maintained during the rest of the period under study, losing just a few percentage points to reach 69% and 80% in August, respectively. Mobile-banking was the only channel that increased its share, since since March it experienced the highest growth, both in amounts (104%) and in quantities (153%). This could be associated with a high use of mobile phones (see Section 2), an increase in the familiarity of their use, the significant number of banks offering mobile banking applications and various regulations aimed at eliminating costs and simplifying their use.
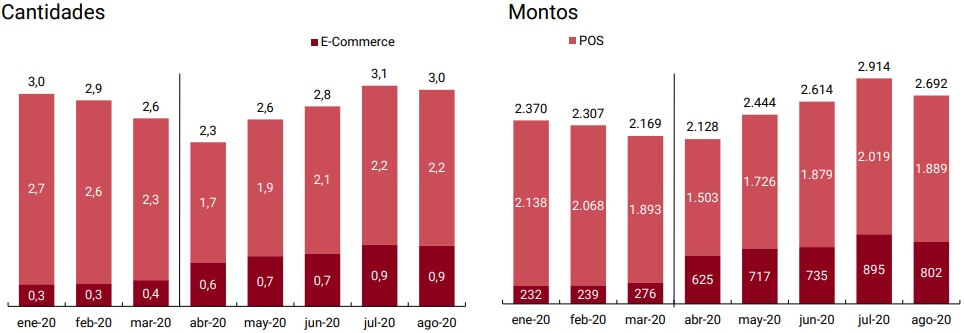
Debit card payments were initially reduced in April, due to the prominent proportion of face-to-face transactions that were carried out with this means (85 out of every 100 transactions in March 2020) and the strict isolation restrictions at the beginning of the ASPO. However, the average amount of each transaction per adult was the highest in recent months, suggesting a change in purchasing behavior.
With greater flexibility in preventive measures, they recovered moderately, with growth from May onwards that allowed them to exceed pre-pandemic levels. This was mainly due to the greater quantity and volume channeled by e-commerce operations with debit cards, whose amounts and amounts per adult practically tripled and doubled from March to August, respectively.
Figure 2.6 | Wire transfers per channel per adult
Note | Average monthly amount and amount per adult. Amounts in constant pesos (base CPI 100 = January 2019). Only operations of human persons are contemplated.
Source | BCRA and INDEC.
Transactions carried out through credit cards and prepaid cards had a heterogeneous behavior during the pandemic. The former fell in quantities in the period from March to June 2020, but the amounts operated per adult increased. In this regard, among the measures taken to mitigate the economic impact of the pandemic on families, the BCRA encouraged credit card financing within the framework of the AHORA 12 Program and established limits on the financing rate of both bank and non-bank credit cards. On the other hand, as will be developed in Section 3.2, the National Government established zero-rate credits for the self-employed and small taxpayers who through the credit card as a specific measure in the context of the pandemic.
As for prepaid cards, both the amounts and the monthly amounts increased significantly, reaching the maximum values of the historical series. However, the average value of each operation registered falls as of March 2020.
An additional indicator that provides an alternative view of the use of bank accounts to make transfers and payments with debit cards arises from the measurement based on the number of accounts available in the financial system. Thus, after the beginning of the isolation restrictions (April to August), an average of 0.5 monthly transfers were made for each PH35 bank account, while the same period of the previous year registered 0.2 transactions, demonstrating a notable improvement.
Debit card payments for each account show similar performance. Despite its fall in April, the recovery resulted in a total of 1.7 operations on average per month, from April to August; 6% above the average for the same period in 2019.
Figure 2.7 | Debit card payments and bank account wire transfers
Note | Amount and average monthly amount per bank account. Amounts in constant pesos (base CPI 100 = January 2019).
Source | BCRA and INDEC.
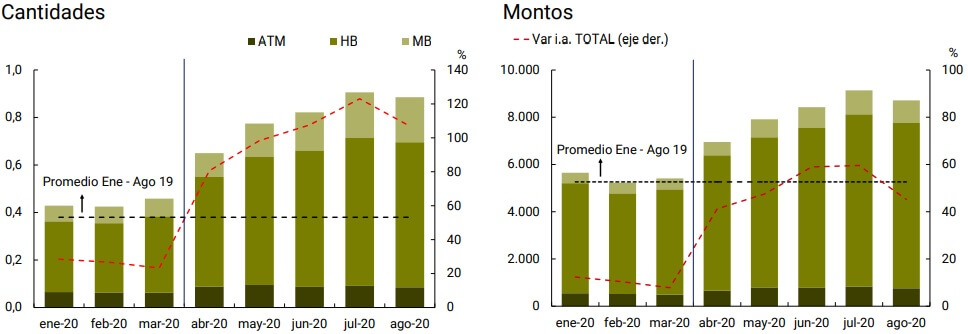
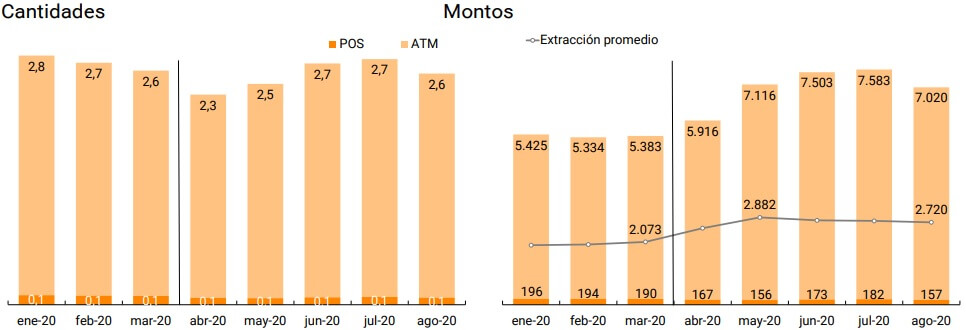
Since the beginning of the pandemic, the BCRA has implemented measures aimed at reducing the risk of COVID-19 contagion caused by the frequency of use of ATMs by the population, increasing the limit on the amount of withdrawals and eliminating charges for operating on these devices (See Local Context). As a result, a lower number of withdrawals of money at ATMs was observed once the period of restrictions began, accompanied by a higher average amount operated per adult person – in the month of April it grew by 10% compared to March and by 30% from that month until August 2020.
In addition, the extra-bank withdrawal points in shops and collection networks expand the network of points where it is possible to withdraw cash. Withdrawals through these devices (POS) fell in April, both in amounts and quantities, as a result of physical restrictions. They then showed a slight recomposition, but continue to represent a smaller fraction of total withdrawals. This could be due to the low level of diffusion of this alternative to stock up on cash, the population’s preference to operate through points of the financial system, and its location, among others.
Figure 2.8 | Withdrawals in stores and ATMs per adult
Note | Average monthly amount and amount per adult. Amounts in constant pesos (base CPI 100 = January 2019).
Source | BCRA and INDEC.
The health crisis has further highlighted the importance of digital payments. In Argentina, this new boost in electronic means of payment adds to the increased use that has been recorded in recent years. The data series shows that the average for the semester following the seasonal peaks (July and December) is higher than that recorded in the previous 6 months. This could contribute to a change in the payment method of the Argentine population, which prior to the pandemic, used cash as the main instrument to pay household consumption expenses (69%)36, while 20% of expenditure was paid through credit and debit cards. Also, there was a positive relationship between income level and the use of bank means of payment.
The lowest income households, quintiles 1 and 2, primarily used cash as a means of payment for their consumption (86% and 84%). However, it could be inferred that many of these households had a bank account (and debit card) since a significant proportion of them received social assistance programs, such as the Universal Child Allowance and Universal Pregnancy Allowance, retirements, pensions, and non-contributory pensions37.
In this way, the effects of the pandemic together with the consequent payment of the IFE, in some cases, through new bank accounts, present an opportunity to consolidate the growth of electronic means of payment and thus deepen financial inclusion in Argentina.
2.3 Savings
modalitiesFinancial inclusion recognizes savings as one of the instruments that contribute to the inclusive development of the population. The precautionary function as a motivation for savings acts as a response to deal with unexpected falls in income38. Thus, in this adverse social context caused by the COVID-19 pandemic, savings take on a relevant role as a counterweight element in the transitory fall in the income of human persons (PH).
Within the financial system, term investments and balances in deposit accounts are the savings alternatives for PHs, both in pesos and in foreign currency. Although the pandemic had a direct influence on the way in which PHs use financial services, in the particular case of savings decisions it is difficult to determine or isolate their impact.
First, the statistics of savings products are presented in an aggregate manner, without the possibility of distinguishing characteristics of the saver such as their employment status, gender or age. Second, PHs may have resorted to loans to deal with the transitory reduction in income and/or reduce savings that are outside the financial system (e.g., in the capital market). Finally, the pandemic produced changes in the main macroeconomic variables, affecting the allocation of surplus income, in relation to expenditures, among the different savings instruments.
Figure 2.9 | Savings alternatives in the PH financial system 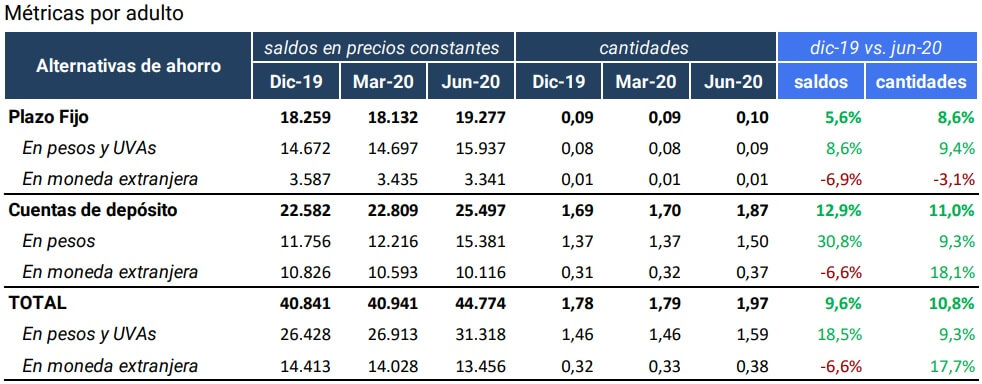
Note | Values in foreign currency are expressed in pesos at the reference exchange rate. The balances are expressed at constant prices (base CPI 100 = January 2019).
Source | BCRA and INDEC.
Taking December 2019 as a reference, the number of PH fixed terms in force per adult grew by 8.6%, while real balances per adult increased by 5.6%. When breaking down the metrics by currency, there is a growth in fixed terms in national currency, both in quantity and amount, and an opposite behavior in terms in foreign currency. It should be noted that the real balances per adult deposited in fixed terms are characterized by their high concentration in local currency (83%), increasing their participation by 3 p.p. in the first 6 months of the year.
At the same time, the average balance per adult of deposit accounts increased during the first half of the year, explained by the significant growth in balances in pesos (31%). This rate represents the highest growth in the first half of the last 5 years. This may be partially explained by the income transfer programs provided by the National Government as a result of the pandemic, which are paid through deposit accounts39.
“If the balances per adult of fixed-term loans and balances in deposit accounts are added together (See Figure 2.9), it can be seen that the share of fixed-term loans fell by 2 p.p. during the first half of the year, from 45% in December to 43% in June. With uncertainty about the duration of the effects of the pandemic, the liquidity of resources is a characteristic that takes on greater relevance compared to situations of greater stability.”
On the other hand, another way of dimensioning the use of savings alternatives arises from observing the behavior of fixed terms in national currency in relation to the number of deposit accounts. The relative amounts indicator continues at low levels, standing at 6.1 fixed terms per 100 deposit accounts in June 2020. Disaggregating the behavior of the indicator by EEFF group, it can be seen that private banks register a slight increase in the relative amounts indicator explained by the increase in fixed terms in pesos.
Probably, the higher proportion of deposit accounts linked to self-employed and dependent workers, which have higher average monthly incomes than other accounts, such as those linked to social security benefits, allow surplus resources to be allocated to less liquid savings products.
Beyond the situation arising from the pandemic, the intensity of use of fixed-term loans is extremely low, regardless of the currency of incorporation and the group of EEFF analysed. In this sense, the financial system has a significant challenge in generating savings products that attract account holders excluded from these products. According to data from the Global Findex 2017 survey, all countries in Latin America and the Caribbean have very low percentages of the adult population that saves in the financial system, with 6% being the minimum value (Paraguay) and 23% the maximum value (Costa Rica).
3. Credit
The deterioration in economic activity resulting from the COVID-19 pandemic impacted a vulnerable economic and financial context. Since credit is a financial product that in most cases still requires some face-to-face work for its improvement, the closure of the branches of the first stage of the ASPO and then the lower circulation of people during the subsequent phases may have had a negative impact on the acquisition of new loans, especially those with a shorter term such as personal loans.
At the same time, the isolation situation also modified consumption plans, postponing certain purchases that are usually financed with loans. In the most extreme cases, the supply of certain goods and services was withdrawn from the market, also implying the impossibility of carrying out transactions for which financing is usually used.
With regard to individuals, the measures taken by the BCRA aimed to soften the consequences of the economic situation for debtors in the expanded financial system (SFA), making the classification criteria40 and the current loan payment conditionsmore flexible 41, as well as establishing maximum limits on credit card interest rates42 and establishing consumer refinancing plans by this means43, among other measures.
Likewise, with the low-cost financing lines for MSMEs and independent workers, it was sought to allocate resources to the productive sector to cover working capital needs, purchase of inputs and equipment and compensate for the fall in the income of monotributistas, self-employed workers and companies that did not register financing in the SFA.
3.1. Credit to individuals
Providers of financing and lines of credit. Since the last edition of the IIF, there has been a reduction in the percentage of the adult population that accesses financing, both from financial institutions (EEFF) and from the SFA, made up of the EEFF and non-financial credit providers (PNFC). During 2019, the percentage of the adult population that owned EEFF financing decreased by 0.8 p.p., while it did so by 0.9 p.p. considering the SFA. From December 2019 to June 2020, the downward trend was maintained by the EEFF with a fall of around 0.7 p.p., similar to the fall in the same period of the previous year, while for the SFA there is an acceleration in the fall in the percentage of adults who access financing (1.8 p.p.).
Figure 3.1 | Percentage of the adult population with at least one financing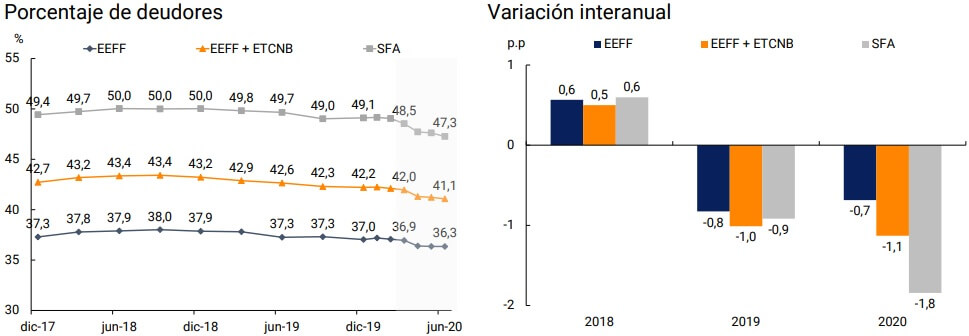
Note | The variation data for 2020 reflects the evolution of the first six months of the year
Source | BCRA and INDEC.
In this way, it is evident that the fall in economic activity derived from the COVID-19 pandemic contributed to deepening the trend that began during 2019 regarding the reduction in access to credit by individuals. In particular, it can be seen that the main decrease is recorded within the PNFCs as a whole, both for non-bank credit card issuers (NTCBs) and for other non-financial credit providers (NFBOs).
The fall observed during 2020 in the indicator of the percentage of the adult population with financing is subject to two simultaneous effects: on the one hand, a real decrease in the number of people with debt that reaches 1.3% of the total debtors for the EEFF and 3.2% for the SFA, and on the other hand, a growth of the adult population of 0.6% in this period. However, it should be noted that, in the case of NFPs, this reduction in access to financing could also be associated with issues related to information reporting, given that in the first half of 2020 there is a reduction in the number of reporting NFPs.
Within the EEFFs as a whole, a distinction can be observed in the behaviour of public and private banks: although the former register a slight reduction in the percentage of debtors, the impact of the crisis has not been comparable to that of private banks and financial companies, which register a greater reduction in the percentage of the adult population with financing.
The worsening of access to credit for individuals is not only observed in the percentage of adults with at least one loan, but also in the debt balances per adult. During 2019, the average balance per debtor at constant prices decreased by 17% for EEFF debtors and by 19% for those of the SFA. Thus, the reduction of around 3.8% for EEFF and 3.7% for SFA during 2020 represents a slowdown in the fall in debt balances.
Figure 3.2 | Debtors in relation to the adult population and balances by institutional group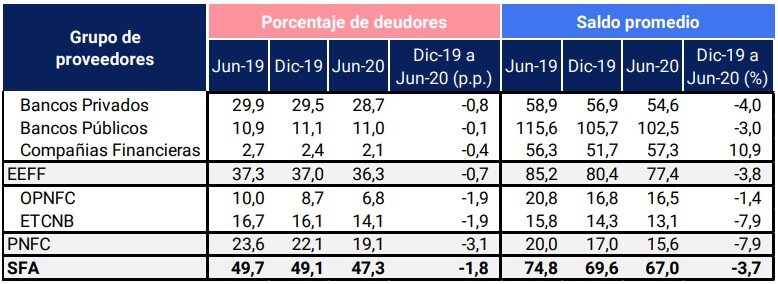
Note | Balances in thousands of constant pesos (base CPI 100 = January 2019).
Source | BCRA and INDEC.
In addition to the impact of the pandemic, this analysis allows us to identify differences in population coverage and the balance of financing between the different institutional groups. Going deeper into what was indicated in the previous IIF, although private banks provide financing to a considerably higher proportion of the adult population than public banks, it can be seen that the balance per debtor of the latter is consistently higher than that of private banks and financial companies. On the other hand, within the set of NFFCs, the average balance per debtor is higher for the OPNFCs than for the ETCNBs, while these subsets register balances between 5 and 6 times lower than the EEFFs.
With respect to these differences between PNFC and EEFF, it should be noted that the holding of salary accounts is lower within the group of PNFC debtors, reaching 36% of their total debtors, while for the EEFF this percentage rises to 46%44. Considering the possession of a salary account as an indicator of registered employment, the aforementioned results would indicate a lower level of formal employment for PNFC debtors than for EEFF.
On the one hand, these factors linked to the level of income and the stability of employment over time may help to explain the differences in the average balance per debtor between EEFF and PNFC. On the other hand, differences in the availability and cost of funding for EEFF with respect to that of PNFC also influence the amounts of loans offered. Likewise, it is verified that for both EEFF and PNFC, the average balance per debtor is higher for debtors who have a salary account. For the EEFF, the balance of debtors without a salary account represents 61% of that of the debtors with a salary account, while in the case of the PNFC it is 69%45.
In terms of the type of assistance, the greatest impact on access to credit for individuals is observed in personal loans, for which, between December 2019 and June 2020, the percentage of the adult population accessing this type of financing was reduced by 2.4 p.p. In second place, there are credit cards with a decrease of 1 p.p. and, finally, current account advances only had a drop of 0.2 p.p., although this is the least used assistance. In terms of balances, there is a reduction in the average balance per debtor at constant values for the three types of financing. In this way, the line of financing that is reduced the most is linked to face-to-face contracting, while the face-to-face aspect is not so significant in credit cards and current account advances.
Figure 3.3 | Financing of the expanded financial system by type of assistance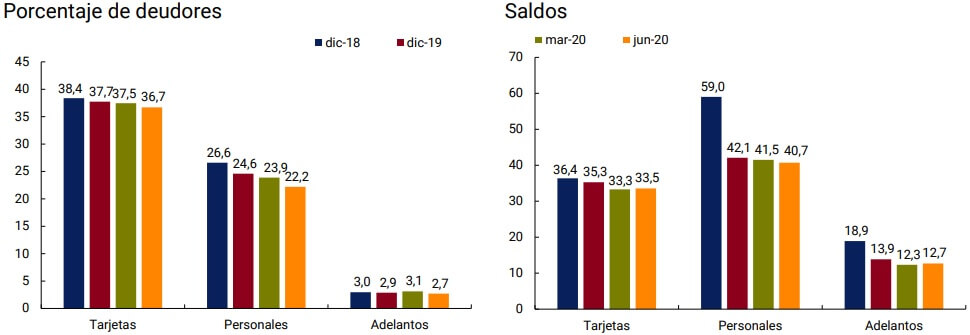
Note | Balances in thousands of constant pesos (base CPI 100 = January 2019).
Source | BCRA and INDEC.
Characteristics of debtors. Geographically, during the first six months of 2020, there was a reduction in the percentage of the adult population that accessed EEFF financing in 21 of the 24 first-tier jurisdictions, with values ranging from -0.2 p.p. (Córdoba and Entre Ríos) to -1.3 p.p. (Tierra del Fuego). In the case of the PNFCs, the drop in the percentage of debtors is evident in the 24 districts, with Tierra del Fuego being the province with the most pronounced decrease (-4.7 p.p.) and Entre Ríos the smallest (-1.9 p.p.).
With respect to balances, there is a marked disparity in the average balance per debtor among the 24 first-order jurisdictions, with the provinces of Patagonia among the districts with the highest average balance and those of the NOA and NEA among those with the lowest balance. These results are in line with the findings of the National Survey of Household Expenditures (ENGHO), which indicate that Patagonia and Greater Buenos Aires, together with Buenos Aires, are the areas of the country where households receive the highest incomes, while households in the NOA and NEA receive the lowest incomes46.
On the other hand, analyzing the relationship between the average balances of EEFF and PNFC, it is observed that in jurisdictions that have a lower balance of EEFF, PNFC balances are relatively higher. By way of example, it is mentioned that in the province with the highest average balance of EEFF (Tierra del Fuego), the balance of PNFC represents 16% of that of the EEFF. On the other side of the spectrum, in the province with the lowest balance of EEFF (Santiago del Estero), the balance of the PNFCs represents 31% of that of the EEFF. This would demonstrate the existence of a certain substitution effect, in which in those districts where the financing of the LFSE is lower, the PNFCs take on greater relevance.
Figure 3.4 | Deusors and balances by province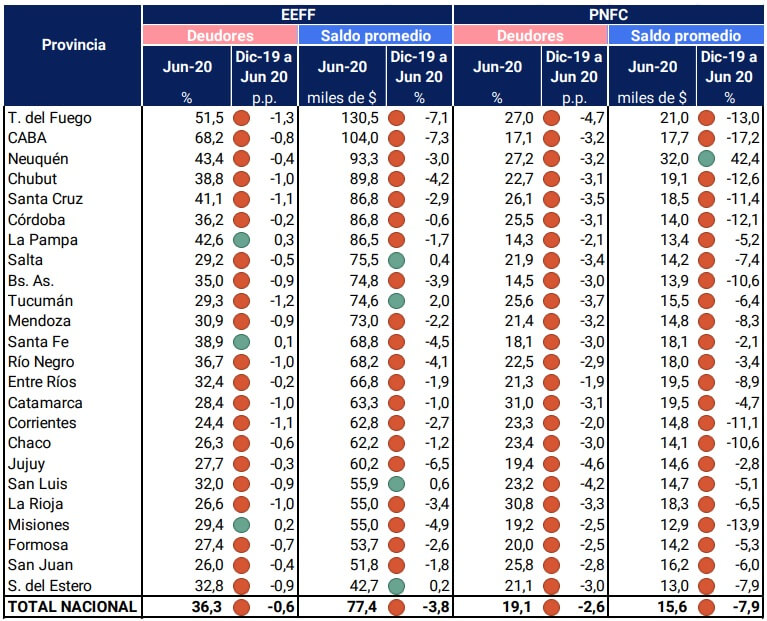
Note | Average balance per debtor in thousands of constant pesos (CPI base 100 = January 2019).
Source | BCRA and INDEC.
Regarding the age of the debtors, the greatest impact on the reduction in the percentage of the population that has access to at least one loan is observed in the higher age ranges, who mainly accessed credit card assistance and personal loans47. This result is observed in the four main institutional groups, although it is more noticeable in the case of public banks and, to a lesser extent, private banks. On the other hand, these two groups, unlike the PNFCs, do not register such significant reductions for the younger age ranges.
In this way, it is understood that the lower adoption by older adults of technological tools (See Section 2.1), as well as the reduction in the circulation of people derived from the pandemic, had an impact on access to credit by this age group. This effect would not be so significant in the case of credit cards, but it would be for personal loans, for which the physical presence of the customer at the bank branch is usually required for their granting and/or renewal.
Figure 3.5 | Percentage of debtors by age
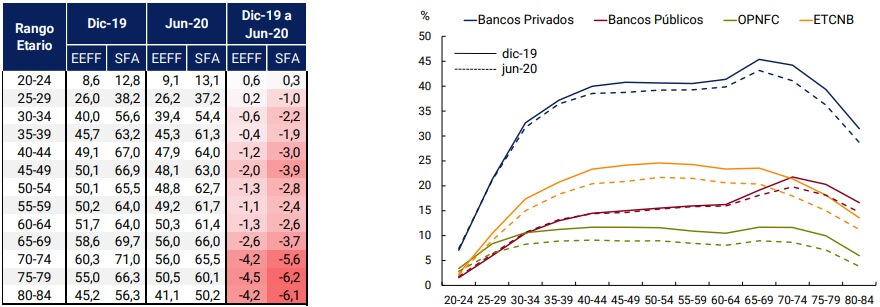
Source | BCRA and INDEC.
Gender gaps. The differences observed in access to credit by men and women are not homogeneous in all institutional groups. Although for the EEFF as a whole, there is a gap that amounts to 3.8 p.p. as of June 2020, analyzing each subset it is observed that this difference is mainly due to the behavior of private banks. Public banks, on the other hand, provide financing to a higher percentage of women than men. Within the PNFCs as a whole, the existence of a gender gap is verified but it is considerably smaller than that of the EEFFs.
With respect to financing balances, the behavior is more homogeneous, with a difference to the detriment of women in all institutional groups. According to data from ENGHO48, the income gap at the national level between men and women amounts to 29.2 p.p., indicating that on average women have an income49 that represents 70% of men’s income. This gap is replicated in all regions, age ranges (being more pronounced among young people and older adults), income strata and types of households. Differences in income levels, coupled with lower activity and employment rates for women50, have a negative impact on their ability to access finance.
On the other hand, it is observed that the impact of the pandemic on access to credit was greater in women than in men, with a greater drop in financing balances for female debtors than for male debtors. As for the percentage of the adult population with at least one funding, in the case of the SEFFs there is a greater impact on women (with a drop of 0.8 p.p. vs. 0.5 p.p. for men), while in the SFA the impact was similar for both groups (1.8 p.p. drop).
Figure 3.6 | Gender gaps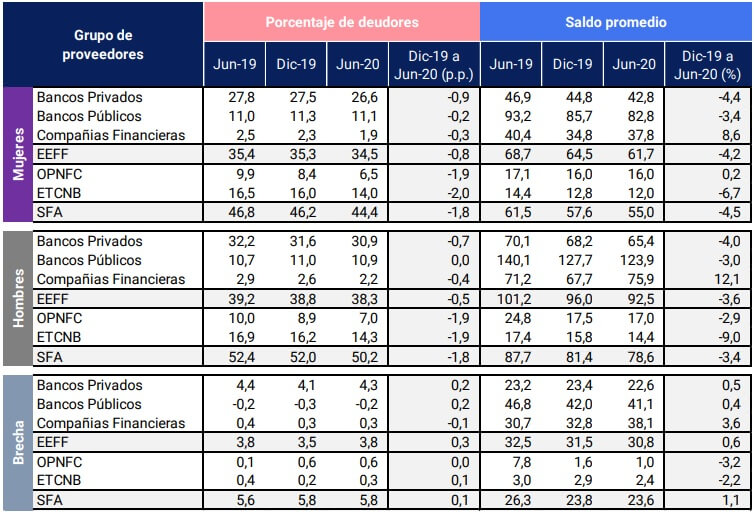
Note | Balances in thousands of constant pesos (base CPI 100 = January 2019).
Source | BCRA and INDEC.
In summary, in terms of access to credit for individuals, as a result of the pandemic, there has been a deepening reduction in the percentage of the adult population with at least one loan, with the greatest impact on PNFC debtors, women and the elderly population
3.2. Credit to MSMEs To mitigate the effects of the pandemic on smaller productive units, the BCRA launched financing lines with subsidized interest rates for MSMEs aimed at covering working capital needs, purchase of inputs and equipment and compensate for the fall in income of single-payers, self-employed workers and companies that did not register financing in the SFA.
Although all the lines have MSMEs as their target population, whether they are constituted as natural or legal persons, they are distinguished from each other by the breadth of the MSME subset to which they are focused and the possible destinations of the financing. This configuration impacts the amounts disbursed, the number of companies reached and loans granted in each of the lines.
By the end of August, the set of financing lines reached a total disbursed amount of around $482,000 million, which represented 18% of the total balance of financing in pesos to the private sector at the time51. It should be noted that this percentage could be somewhat lower in terms of outstanding balance, considering that some of the short-term financing granted could have been cancelled within the period considered.
Due to the breadth of their target population and destinations, the MSMEs and Health Services and MSMEs Plus lines were the most significant in terms of average amounts granted (just under $3.8 million), reaching more than 110,000 companies52, of which 56% are incorporated as legal entities and the remaining 44% as individuals.
Figure 3.7 | Amounts, companies and loans granted by financing line53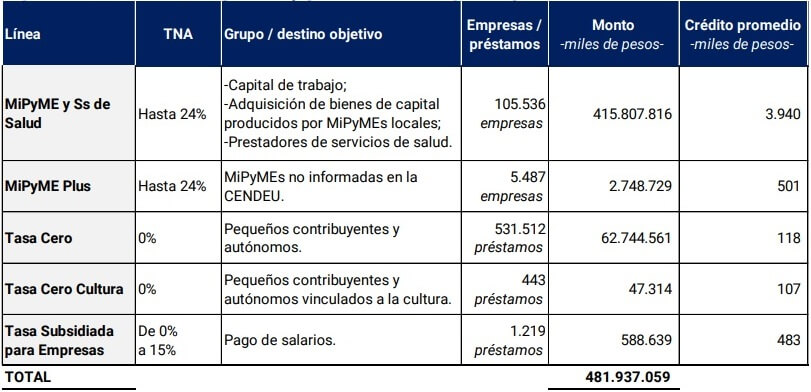
Note | Data at the end of August 2020.
Source | BCRA.
The remaining three lines, which are part of the ATP Program, accounted for 13% of the total amount of financing granted and reached an average amount of $119,000 per assistance. The Zero Rate line stands out from the rest due to the magnitude of the amount and the number of people covered, in particular due to its specific focus on individuals with independent work54.
When deepening the analysis at the level of companies according to the available information, it is observed that most of the companies receiving the MSMEs and Health Services and MSMEs Plus lines are micro and small (77%). However, in terms of amounts, these companies received 40% of the total amount granted, with medium-sized companies tranche 1 being the largest beneficiaries (40%). It is reasonable that companies with a greater number of employees and turnover levels have received a higher volume of financing.
Figure 3.8 | Amount and amount disbursed by size and economic sector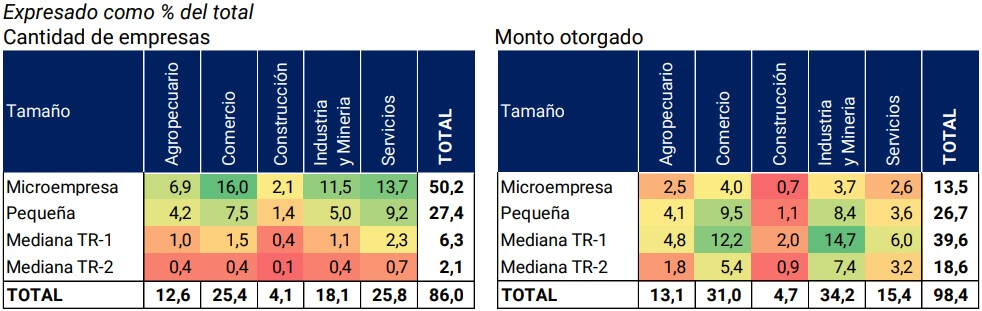
Note | The size and economic sector of 14% of the companies in the sample were not identified, whose amount represents 2% of the total amount granted. To determine the size and economic sector, information from CENDEU and the Ministry of Productive Development at the end of 2017 was used. The size of companies is determined by the number of employees and the level of annual turnover, which vary according to the economic sector55.
Source | BCRA and Ministry of Productive Development.
The distribution by economic sector shows that services and commerce were the activities that concentrated the most companies. The situation of isolation and the temporary closure of businesses as a result of the ASPO, in addition to the fact that these sectors constitute the largest number of employers56, explains their high participation. In relation to financing volumes, the Industry and Mining and Commerce sectors register the highest percentages, 34% and 31%, respectively.
Regarding geographical distribution, the productive units receiving financing from MSMEs and Health Services and MSMEs Plus are concentrated in the Central region (76%), which also results in the distribution of the amount granted (79%). This configuration is in line with the geographical arrangement of the financing balance of individuals and with the number of MSMEs by province presented in the first Financial Inclusion Report57.
Figure 3.9 | Geographical distribution of financing granted
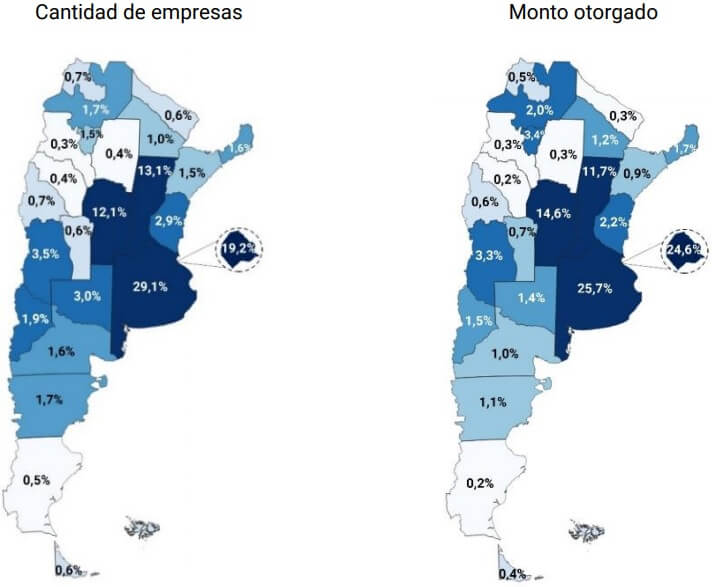
Source | BCRA.
In terms of their link with the financial system, 14% of the companies that until August 2020 were beneficiaries of the MSMEs and Health Services and MSMEs Plus lines, did not have financing in the SFA prior to the pandemic -February 2020-, a percentage that is drastically reduced in the month of April. Likewise, during the first three months of the pandemic, it is observed that the total number of companies were mostly located in the segments with the highest debt balance, which highlights the importance of the instrument as a mitigator of the economic and financial effects of the pandemic. It should be clarified that Figure 3.10 includes the set of companies that took financing through the special MSME lines and the balances owed by these companies for any line of credit in the financial system.
Figure 3.10 | Distribution of the number of companies receiving MSMEs and Health SS and MSMEs Plus lines according to their financing with the financial system 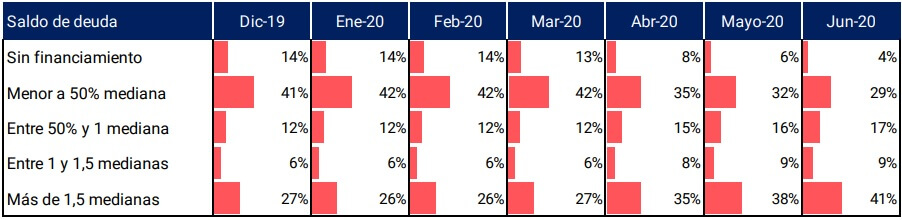
Note | June-20 Median: $639,000
Source | BCRA.
In conclusion, the companies receiving the MSME financing lines were concentrated in the smaller companies in the economic sectors most affected by the ASPO. It should be noted that, although most of the companies receiving the financing already had credit lines, during the first half of 2020, the number of companies without financing was reduced. On the other hand, an increase in the proportion of companies with higher balances owed was observed. In this way, low-cost financing lines were an element that contributed to including new companies in the credit market, also allowing them to meet commitments in an adverse context and to have resources to continue the production cycle or acquire new capital goods.
Section 1 / Analysis of the forms of payment of women’s households. An opportunity hand in hand with digital financial inclusion
Around the world, women are being affected by the economic impact of the COVID-19 pandemic. Women make up 50% of the global population, but they are overrepresented in the poorest segments. Women occupy low-wage positions in greater proportion than men, including care and cleaning tasks58.
Access to the financial system is crucial, especially in the context of the pandemic, where many governments are providing subsidies to people and most are destined and/or channeled to women. Encouraging the use of bank accounts is key on the path for women to achieve economic and financial autonomy.
Women in Argentina are no strangers to what is happening to their peers in the world: (i) they register higher levels of unemployment (10.8% vs. 8.9% of men) and informality (36% vs. 34.2%); (ii) they receive salaries, on average, 29% lower than those of men, a gap that widens for informal salaried women (35.6%). In addition, their main occupation is paid domestic service, representing 21.5% of salaried workers, and, among domestic workers, a large proportion do not have a formal job (72.4%)59.
Figure A 1.1 | Distribution of households according to the sex of the head and income level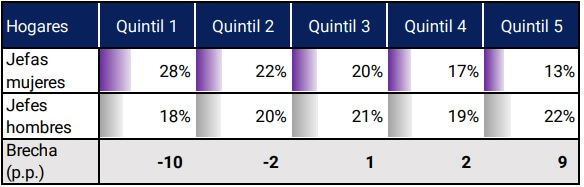
Note | Percentage of each income quintile with respect to the total of the total number of heads of households of each sex. Total households: female heads: 9,534; male chiefs: 12,009.
Source | Prepared by the author based on ENGHO 2017/2018 (INDEC).
These differences explain why women are oversized in the lowest income decile (66.1%) and are a minority in the highest (35.3%). Similarly, 1 in 2 female-headed households belongs to the lowest income quintiles. This precariousness illustrates why more than half (56%) of the 8.9 million people who received the first settlement of the Emergency Family Income (IFE)60 have been women, reaching 28% of the female adult population in relation to 24% of adult men.
As mentioned above, financial inclusion can contribute to the process of women’s economic and financial autonomy, particularly for the most vulnerable group. To consider a person’s financial inclusion, accessing a bank account is the first in a series of steps. In Argentina, prior to the pandemic, 80% of the adult population had at least one bank account, and there was no gap between women and men61. However, the wide scope that exists in the possession of bank accounts does not imply a similar use between men and women, depending on their financial and digital capabilities, cell phone ownership, use of the internet, product offer, among other factors.
To begin to inquire about the use of bank accounts, electronic payments are the starting point in the relationship with the financial system. Recent data, published by INDEC62 on consumer expenditures63, allow us to disaggregate the forms of payment of households headed by men and women, and consequently, to observe whether there was a differential behavior prior to the pandemic.
Figure A 1.2 | Methods of payment for consumption according to the sex of the head of household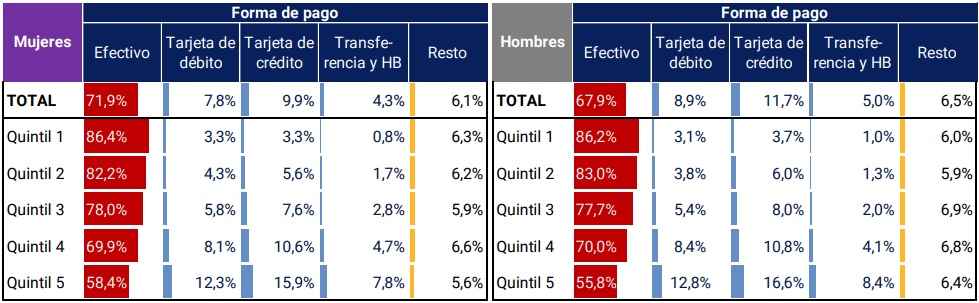
Note | The Transfers and HBs column includes transfers and other home banking operations (such as automatic debits).
Source | Prepared by the author based on INDEC (ENGHO 2017/2018).
As a first point, the intensive use of cash in all quintiles and regardless of the sex of the person in charge of the household is highlighted. Focusing on electronic means of payment, it can be observed that households with female heads use these means less than households with male heads to pay for consumption expenditure (22% vs. 25.6%) (See Figure A.1.2). If we exclude credit cards, since they are not necessarily associated with a bank account, the difference is smaller but still persists (1.8 p.p.). Considering the homogeneous distribution of bank accounts between women and men64, it can be inferred that the lower use of the means of payment associated with them by women in charge of households is not explained by the lack of these financial instruments.
In both types of households, the use of electronic means of payment grows with the level of income. However, the gaps observed in the use of these means are not replicated in all income strata. In the case of credit card transactions, the gap is qualitatively in line with the difference identified in credit card debtors, where as of June 2020, the proportion of men with this type of assistance exceeded that of women (39% vs. 35%). It is worth noting an important difference between the two sources of information: while the ENGHO measures use without distinguishing between headline or extension; in the case of the CENDEU the possession of a credit card holder without registering extensions is calculated. Therefore, even when the operations of the holders and the extensions are considered independently, the gap remains.
For debit cards and transfers (including home banking), households headed by women report greater use of these means of payment than those by men, both in the lower and middle quintiles65. During the last few years, and particularly in the isolation stage, the use of these means has intensified significantly (See Section 2.2).
This shows that, although starting from very low levels, women heads of lower-income households are not at a disadvantage in the use of electronic means of payment in relation to their male counterparts.
Overall, the impact of the pandemic has amplified the need to promote digitalization and embrace digital financial inclusion with a gender lens as part of recovery efforts. The fact that there is some equity, and even a better situation in favor of women, in the use of bank accounts among the most fragile households in the country, points to the potential that electronic means of payment have to begin to build the financial autonomy of the lowest-income women. It is clear that all this requires strengthening other dimensions, such as the use of information and communication technologies (See Section 2) and the digital and financial capacities of women66. However, the high level of access to bank accounts for the country’s most vulnerable women, together with the payment behavior surveyed, place digital financial inclusion as a relevant tool in the construction of women’s economic and financial development.
Section 2 / Internet connectivity as a determining aspect of digital financial inclusion
As mentioned in different sections of the report, the digitization of financial services played an important role in mitigating the economic impact of the crisis resulting from the COVID-19 pandemic. This digitalization process is contained in a broader concept called digital financial inclusion, which highlights the role of digital devices in the massification of financial services. This approach proposes the performance of transactional operations in the digital environment and the use of face-to-face contact for the deposit and withdrawal of cash.
Digital financial inclusion allows households and productive units traditionally underserved or excluded from financial services to carry out financial transactions in their localities. By leveraging the existing digital and physical infrastructure, its offer allows for greater scale and capillarity in the territory. Likewise, the literature suggests that the development of digital financial inclusion has a positive effect on GDP, since it increases the resources in the financial system, which are subsequently allocated to finance productive activity67.
However, digital financial inclusion presents the challenge of unequal access to digital infrastructure, both devices and internet connectivity. This difference can be enhanced if the information generated in the digital environment is later used to access other financial services, for example, financing or savings products. Likewise, this scheme raises the need for digital and financial knowledge and skills on the part of the user population.
In this section, we focus on analyzing internet access at the local level, understanding that the widespread availability of connectivity is a necessary step for the development of digital financial inclusion. We will also analyze the existence of access points to financial services (PDAs) in the localities according to their degree of connectivity.
To carry out the analysis, the availability of fixed and mobile internet connection at the locality level was combined, according to data from ENACOM68 and the localities considered in the last National Census, using the latter as a reference universe. To simplify the approach to the issue, the existence of fixed and/or mobile connectivity is considered if the locality has at least one type of connection in each group69, which is determined if any of the internet providers reports to ENACOM at least one active user in the locality.
According to the exercise carried out, it was identified that 53% of the localities have fixed and mobile connectivity, while 23% do not report any type of connection. Likewise, 24% of the localities have only one type of connection (fixed or mobile)70. In demographic terms, localities with both types of connection concentrate 96% of the total population, which indicates that a large part of it could access the internet taking the aforementioned metric as a reference. It should be remembered that the constructed indicator does not consider the quality of the internet connection, but focuses on availability.
Figure A 2.1 | Localities and population according to the degree of internet connection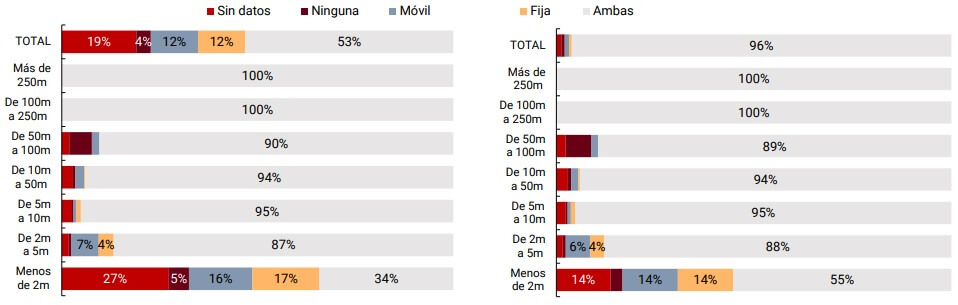
Note | “M” = thousand. Data as of June 2020.
Source | BCRA, ENACOM and INDEC.
When segmenting localities according to their inhabitants, it is observed that only a relatively small portion of localities with smaller populations do not report internet connectivity. Likewise, the bulk of the population lives in localities that have both types of internet connection, posing a certain uniformity in the availability of internet connection in relation to the number of inhabitants. A positive aspect of these results lies in the fact that localities with fewer inhabitants, which are far from urban centers, have the possibility of interacting with financial services through digital channels, without the need to physically travel to a PDA. Although it is not possible to identify the origin of the transactions, the significant growth of electronic transfers and debit card purchases in e-commerce within the framework of the ASPO, pose a scenario of greater use of digital products, which may incorporate new people into electronic channels.
Along the same lines, but on the demand side, the use of the internet is widespread in the population, declining slightly in the age group of 65 years or older71. This behavior is reflected in the number of internet users in the country – 35 million72 – and the percentage of urban households that have an internet connection – 83%. Likewise, in relation to the adoption of devices, the use of cell phones far exceeds that of the computer in all age ranges and genders. Likewise, linking the availability of connectivity with the physical infrastructure of the financial system (PDAs), 61% of the localities that do not have PDAs have at least one of the types of internet connection, reaching 78% of the population of those localities. This configuration suggests that these people are more likely to access financial services through digital channels than through face-to-face channels.
Figure A.2.2 | Availability of internet connection according to the presence of PDA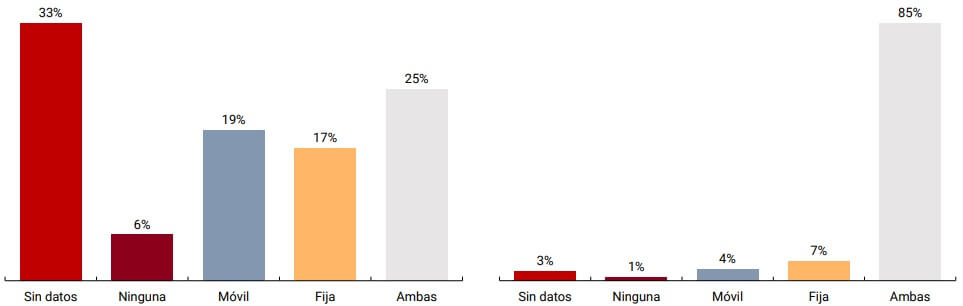
Note | Connectivity data as of June 2020 and PDA as of September 2020.
Source | BCRA and ENACOM.
This first approach to internet connectivity exposes the possibilities of scale that digital financial services would have, particularly those used from cell phones, ranging from the population of urban conglomerates to the smallest and most remote localities. However, scalability poses challenges that exceed this section, such as access to smartphones, the structure of mobile internet access plans (prepaid/postpaid), the data consumption of applications and the speed of internet connection depending on geographical location, among others. Although the basic conditions for the development of digital financial services would be present, there are challenges to be solved to reach their true potential and achieve digital financial inclusion for the entire population.
Methodological note
Population
dataThis IIF presents indicators that are disaggregated by different demographic and geographical variables. For the elaboration of these indicators, population data were used based on the population projection made by the National Institute of Statistics and Censuses of the Argentine Republic (INDEC). Considering that this agency does not publish a series that simultaneously contains all the disaggregations used throughout this IIF (gender, age group and geographical location at the provincial, departmental and locality levels), it was necessary to take different series according to the definition of each indicator.
For the indicators at the national and provincial levels, the series called “Population by sex and five-year age groups for the country and provinces as a whole” was used. Years 2010-2040″, while for the indicators at the departmental level, the series “Estimated population on July 1 of each calendar year by sex, by department” was taken as a basis. Finally, since INDEC does not publish a projection of the evolution over time of the number of inhabitants of each locality, it was necessary to construct the series for the indicators at that level, for which the results of the 2010 National Census were taken as a basis.
For the purposes of this IIF, an “adult” is considered to be a person 15 years of age or older, following the standard used by the World Bank for its financial inclusion indicators.
Regionalization
For the purpose of developing regional indicators, the regionalization criterion proposed by the Ministry of Economy and Public Finance (now the Ministry of Finance) was used, which establishes five regions, namely:
– NOA (Northwest Argentina): Salta, Jujuy, Tucumán, Catamarca and Santiago del Estero.
– NEA (Northeast Argentina): Formosa, Chaco, Misiones and Corrientes.
– Nuevo Cuyo: Mendoza, San Juan, San Luis and La Rioja.
– Patagonia: La Pampa, Neuquén, Río Negro, Chubut, Santa Cruz and Tierra del Fuego.
– Centro and Buenos Aires: Córdoba, Santa Fe, Entre Ríos, Buenos Aires and the Autonomous City of Buenos Aires.
In the text of this IIF, Nuevo Cuyo is mentioned as Cuyo and Center and Buenos Aires as Center.
Extra-bank
withdrawal pointsIn order to determine the number of businesses that allow cash withdrawals, a survey was carried out by consulting the different companies that offer the service. Once the data was received and consolidated, the address reported for each extraction point was used to identify those businesses that operate through more than one brand simultaneously with the aim of eliminating duplications and obtaining a list of unique businesses. It should be noted that there are differences in the number of informants for the months of December 2019 and April 2020.
This figure was constructed from PDA data from September 2020 and socioeconomic vulnerability indicators (years of education of the head of household, the mother and percentage of the population with unmet basic needs -NBI-) from the 2010 National Population and Housing Census. For each locality, the indicators corresponding to the average years of education of the head of household, the mother and the percentage of the population with NBI are normalized using the min-max technique. With the normalized values, a synthetic index aggregated by locality is constructed, which is called the “Vulnerability Index”. The higher the index, which has a theoretical range of 0 to 3, the more vulnerable the population residing in the locality.
The localities that have a PDA of their own financial institutions are ordered from the lowest to the highest vulnerability index and the deciles (from 1 to 10) are calculated according to the vulnerability index. The higher the decile, the more vulnerable the population residing in the locality. For each type of financial institution, namely public, private financial agents of the provinces, private and financial companies, the percentage of PDAs they have in each type of locality is calculated. Finally, the percentage and number of PDAs that each type of financial institution has in the localities corresponding to deciles 7 to 10 (those of the most vulnerable populations) is calculated.
Section 2
Internet connectivity information disaggregated at the level of locality and type of connection published by ENACOM was taken. By virtue of the existence of different types of connection, in order to simplify the status of internet access in each locality, a binary indicator was developed that considers a locality with internet access if it has at least one type of connection available (“Yes/No”). This was applied both for fixed internet access (ADSL, Dial Up, fiber optic, satellite, fixed telephony) and mobile (Wireless, 3G, 4G), without considering the quality of connection.
Then, taking as a reference the localities listed in the 2010 National Census (3,538) and the indicator mentioned above, the fixed and mobile connectivity status was assigned to 2,829 localities of the CN2010. There were cases where internet connectivity data is reported at a lower level of disaggregation to the locality (neighborhood or entity included), as well as others in which the locality with the largest number of inhabitants in the department does not have information available but the other localities in the department do. This information was used to characterize the localities in question, assigning the value “Yes” to the connectivity indicator to the extent that 50% or more of the neighborhoods that compose it or neighboring localities have connectivity. With this exercise, 35 additional localities were characterized. Finally, there is no information to characterize the connectivity of a set of 674 localities.
Glossary of abbreviations and acronyms
ACSF Complementary Financial Services Agency
AFIP Federal Administration of Public Revenues
ANSES National Social Security Administration
ASPO Preventive and Mandatory Social Isolation
ATM ATM
ATP Emergency Assistance Program for Work and Production
AUE Universal Pregnancy Allowance
AUH Universal Child Allowance
BCRA Central Bank of the Argentine Republic
CABA Autonomous City of Buenos Aires
CENDEU Central Bank of Debtors of the Financial System
UGC Universal Free Account
EEFF Financial Institutions
ENACOM National Communications Agency
ENGHO National Household Expenditure Survey
EPH Permanent Household Survey
ETCNB Non-Bank Credit Card Issuers
FAS Financial Access Survey
IFE Emergency Family Income
IIF Financial Inclusion Report
INDEC National Institute of Statistics and Censuses
CPI Consumer Price Index
MSMEs Micro, small and medium-sized enterprises
NBI Unmet Basic Needs
NOA Northwest Argentina
NEA Northeast Argentina
PDA Access Points
PH Human person
GDP Gross Domestic Product
PNFC Non-Financial Credit Providers
POS Device at the point of sale
P.P. Percentage points
Prom. Nac. National average
PSP Payment Service Providers
OPNFC Other non-financial credit providers
SFA Expanded Financial System
TAS Self-service terminal
TNA Annual Nominal Rate
UVA Purchasing Value Units
References
1 Decree 310/2020 and Decree 332/2020.
2 Except in the case of single-tax and self-employed workers, which is credited to the credit card (ATP. MyA).
3 ANSES. IFE I-2020 Bulletin: Characterization of the beneficiary population.
4 Prior to the pandemic, the population used cash as the main instrument to pay off household consumption expenditures (69%). Barely 20% of the expenditure was paid through credit and debit cards. INDEC. National Household Expenditure Survey 2017-2018. Income report.
5 In relation to the adult population (15 years or older).
6 Point 7 of Communication A 6948.
7 Communication A 6948.
8 Based on the information available, it is estimated that 40% of the points identified correspond to extra-bank collection networks, which could overlap with complementary financial services agencies, while the remaining 60% are businesses. See Methodological Note for more details on the construction of the indicator.
9 Financial Inclusion Report. Second half of 2019.
10MSMEs and Health Services: Communication A 6937; MSMEs Plus: Communication A 7006; Zero Rate: Decrees 332/20 and 376/20, Communication A 6993; Zero Culture Rate: Decrees 332/20 and 376/20, Communication A 7082; Subsidized Rate for Companies: Decree 621/20 and Communication A 7082.
11 Time deposits and investments. 1.11.1. Fixed-rate deposits.
12Communication A7139.
13 INDEC. Access to and use of information and communication technologies. EPH. Fourth quarter of 2019.
14 Communication A 6942.
15 Communication A 6949.
16 Communication A6953
17 Communication A6958
18 Number of bank branches, FELABAN and the IMF’s Financial Access Survey.
19 Electronic device that allows cash and check deposits, among other operations.
20 As indicated in previous IIFs, the disparity in the number of FLWs by province is associated with the distribution of the population, since districts with a greater number of adults would tend to have a greater number of FLW.
21 Data from the Financial Access Survey (IMF) as of 2019.
22 Among the 519 departments with FLW as of Dec-19, 163 departments, which had a level of FLW per adult below the median, increased their FLW per 10,000 adults by more than 50%, while only 96 of the departments that had a FLW indicator above the median increased their FLW per 10,000 adults by more than 50%.
23 80.4% of the adult population had at least one account as of March 2018. See “Financial Inclusion Report Second Semester 2019, Section 2.1. Deposit accounts.”
24 Communication A6876.
25 Decree 332/2020. The ATP consists of salary assistance by the National State, taking into account the different degree of vulnerability of formal workers and companies.
26 Decree 310/2020. The IFE is aimed at people between 18 and 65 years of age who are self-employed workers registered in the Monotax Regime (categories A and B), social monotributistas, staff of private homes, informal workers or people who are unemployed and in a situation of exclusion or vulnerability. Its amount amounts to $10,000 and can only be collected by a member of the family group.
27 IFE Bulletin I-2020: Characterization of the beneficiary population.
28 Deposit accounts in pesos are intended only for individuals and are made up of savings banks, salary accounts, social security accounts and the CGU. There are also other types of deposit accounts used for specific purposes, such as savings banks for the payment of social assistance plans or programs, among others.
29 Global Findex 2017: 48% of bank account ownership by the adult population; Survey on the measurement of financial capabilities, BCRA-CAF, 2017: 39% responded that they did not own any financial product in that same year.
30 Debits include transactions executed over the counter and by any banking or electronic payment mechanism. Transfers between the same type of account of the same customer are not considered.
31 Although the values correspond to Dec-2019, these proportions have shown little variation over the years.
32 Financial Inclusion Report. First half of 2019.
33 The age range of 65 and over registers the lowest proportions of use of the internet, computer and cell phone. Access to and use of information and communication technologies. EPH. 4th quarter 2019.
34 Prepared by the author based on data collected.
35 Deposit accounts and current accounts of individuals in pesos.
36 National Household Expenditure Survey 2017-2018 June 2020. Income report. Towns with 2,000 or more inhabitants.
37 Quintile 1: 46% receive AUH and AUE, 18% retirement/pension and 13% non-contributory pension. Quintile 2: 20% receive AUH and AUE, 33% retirement/pension and 10% non-contributory pension.
38 García Bianchi Antonella, Santillán Leiba Rubí, Sotomayor Valenzuela Narda. Determinants of voluntary savings in Peru: Evidence from a Demand Survey, SBS.
39 Monetary Policy Report (IPOM), August 2020. Box. The atypical behavior of the means of payment during the transition, p. 75.
40 Communication A6938.
41 Communication A6949.
42 Communication A6949 and Communication A6964.
43 Communication A6964 and Communication A7095.
44 Average of 2018 and 2019.
45 Average of 2018 and 2019.
46 ENGHO. Income Report, INDEC (June 2020).
47 See Figure 3.4. Financial Inclusion Report. Second semester 2019.
48 ENGHO. Income Report. INDEC (June 2020).
49 Includes labor and non-labor income (e.g., retirements and pensions, social benefits, etc.).
50 Labor market. Socioeconomic rates and indicators (EPH).
51 Statistical Bulletin. September 2020.
52 Approximately 1,015 companies took both lines of financing.
53 MSMEs and Health Services: Communication A6937; MSMEs Plus: A7006 Communication; Zero Rate: Decrees 332/20 and 376/20, Communication A6993; Zero Culture Rate: Decrees 332/20 and 376/20, Communication A7082; Subsidized Rate for Companies: Decree 621/20 and Communication A7082.
54 Given that each taxpayer can apply for only one loan, it is equivalent to refer to loans as to persons (Source: AFIP).
55 Source: Ministry of Productive Development.
56 Social Security Report, AFIP.
57 Financial Inclusion Report. First half of 2019. Figure 2.21 | MSMEs. Provincial distribution and use of financing.
58 Why the economic response to covid-19 needs to be financially inclusive and gender-sensitive. Alliance for Financial Inclusion.
59 Gender gaps in Argentina. State of the situation and challenges. Ministry of Economy.
60 See section 2.1 Deposit accounts for more details on the payment of the IFE. ANSES, IFE I-2020 Bulletin.
61 See Figure 2.2 of the first Financial Inclusion Report 2020. The lack of a gap in account tenure is explained by the collection of social assistance programs, such as the AUH, with a majority of female holders, and retirement and pensions.
62 Microenterprises, according to the legal classification, may have a maximum of 5 to 15 employees, depending on the sector (on average, up to 9 employees). See Resolution 220/2019
63 National Household Expenditure Survey (ENGHO) 2017-2018. Income report. June 2020.
64 Equity in the holding of bank accounts between the heads of households – men and women – is assumed based on the uniform distribution among the adult population (March 2018), given that INDEC data do not allow us to know the possession of these instruments.
65 Except in the use of transfers and home banking of quintile 1.
66 See Survey on the measurement of financial capabilities.
67 The Promise of Fintech. Financial Inclusion in the Post COVID-19 Era, IMF, Chapter 5.
68 National Communications Entity. List of localities with internet connectivity. Data as of June-2020.
69 The types of connection mentioned are: (1) Fixed: ADSL, cable modem, fiber optics, dial-up; satellite; (2) Mobile: Wireless, 3G, 4G.
70 There is no information available on internet connectivity for 19% of the universe of localities. According to what was consulted to ENACOM, the localities without information can be explained by the lack of information sent by internet connectivity providers or by the non-availability of internet providers in that place.
71 EPH. Data available as of the fourth quarter of 2019, on 31 urban agglomerations.
72 Statista.
Share on


