I. Recent measures1
In order to continue improving access to financing for the private sector and to expand the instruments available to carry out an evaluation of credit performance, in November additional information was incorporated into the Central Debtors of the Financial System2 that is available to the public. In particular, it will be possible to know the date from which a debtor registers a normal situation in an uninterrupted manner in all entities.
Recently, the BCRA put into circulation the new legal tender bill of $1,000 pesos3. This ticket, which has strict security measures, is the fourth of the new family “Native Animals of Argentina” (after the $500, $200). By renewing the currency, the aim is to promote greater efficiency in daily transactions and a reduction in the cost of printing banknotes. At the same time, with the higher denomination banknotes, it is possible to reduce the cost of transporting, transporting and storing money in the financial system.
In order to make more efficient use of cash and by virtue of technological advances, at the end of November the National Government provided that companies dedicated to the electronic service of payments and/or collections on behalf of third parties, of utility bills, taxes and other services can offer the service of withdrawal and deposit of cash with a bank card4.
II. Activity
In October, financial intermediation with the private sector continued to grow. Adjusting for inflation, loans to the private sector increased by around 2.6% compared to September (22.7% in the last twelve months), while deposits arranged by this sector increased by 0.3% in the month (7.7% year-on-year).
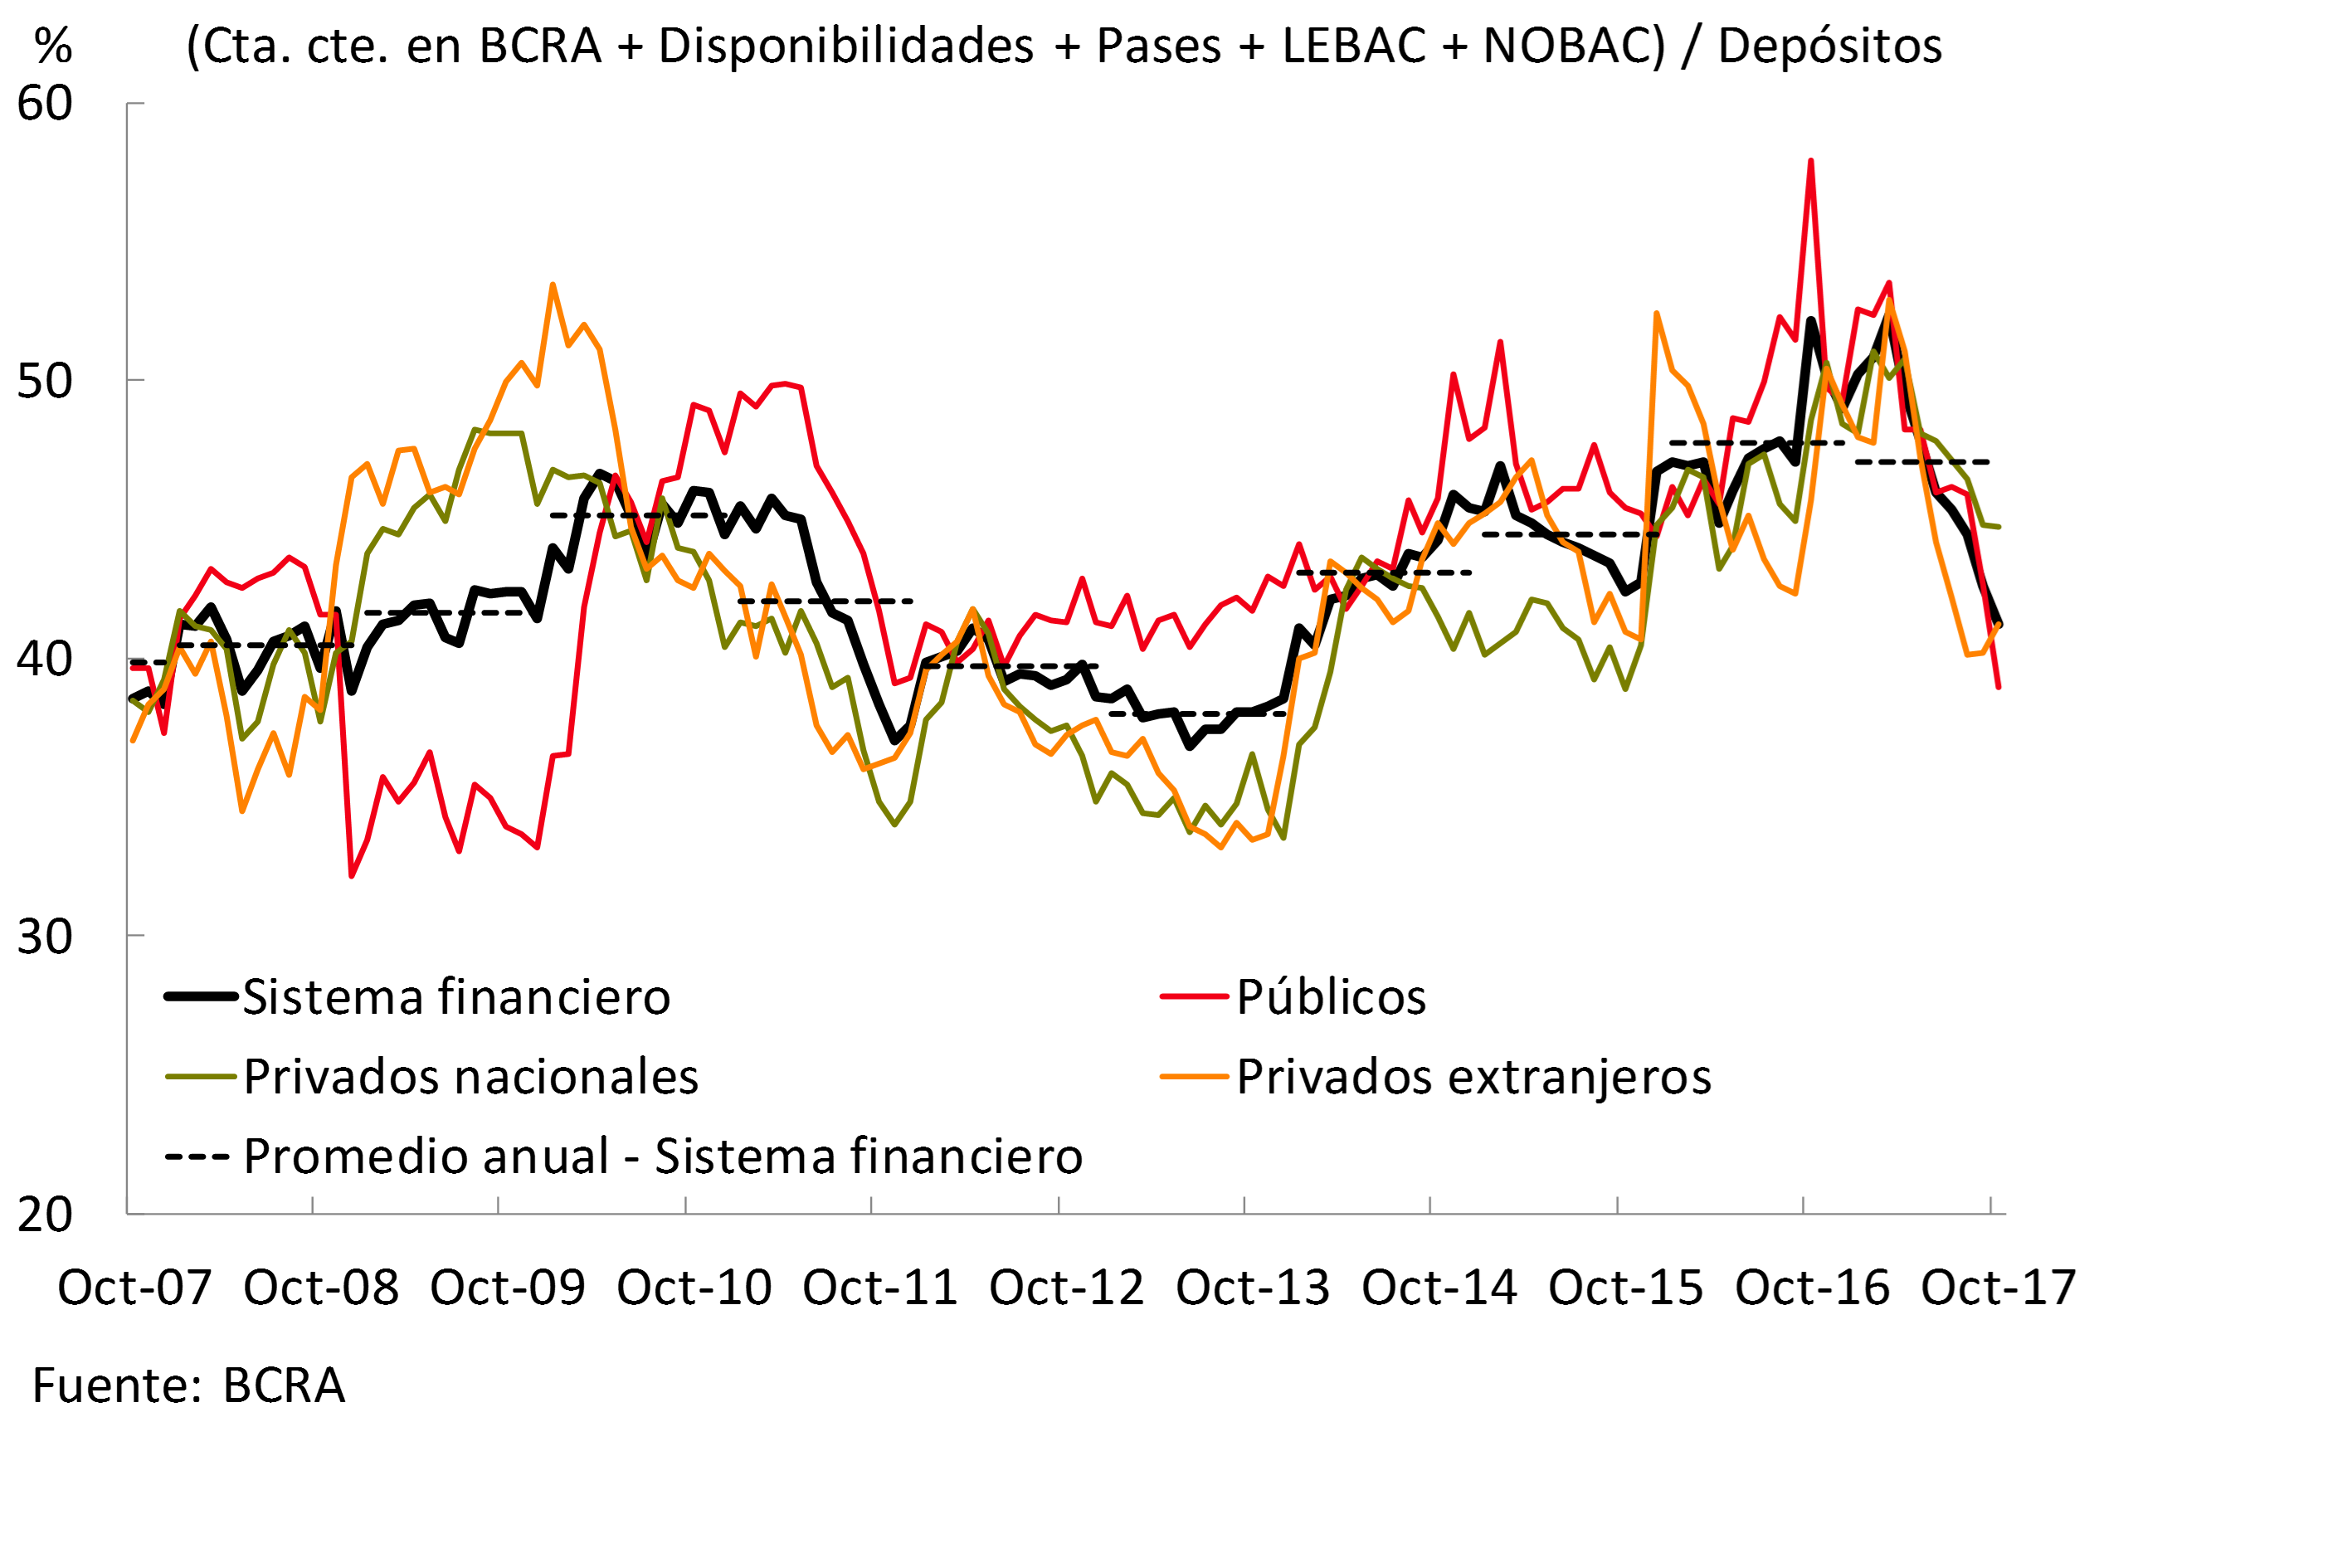
Banking activity, with greater dynamism of loans in relation to deposits, is reflected in the balance sheet of the financial system. Credit to the private sector was the item that gained the largest share of assets, reaching 49.4% in October, 6.2 p.p. more than a year ago. This performance was reflected in all groups of banks, reaching the highest for public financial institutions in the last fifteen years (see Graph 1). For their part, in the last year, the deposits of families and companies practically maintained their participation within total funding (liabilities plus net worth), totaling 56.8% as of October.
Graph 1 | Private Sector Credit in Asset Terms – By Bank Group

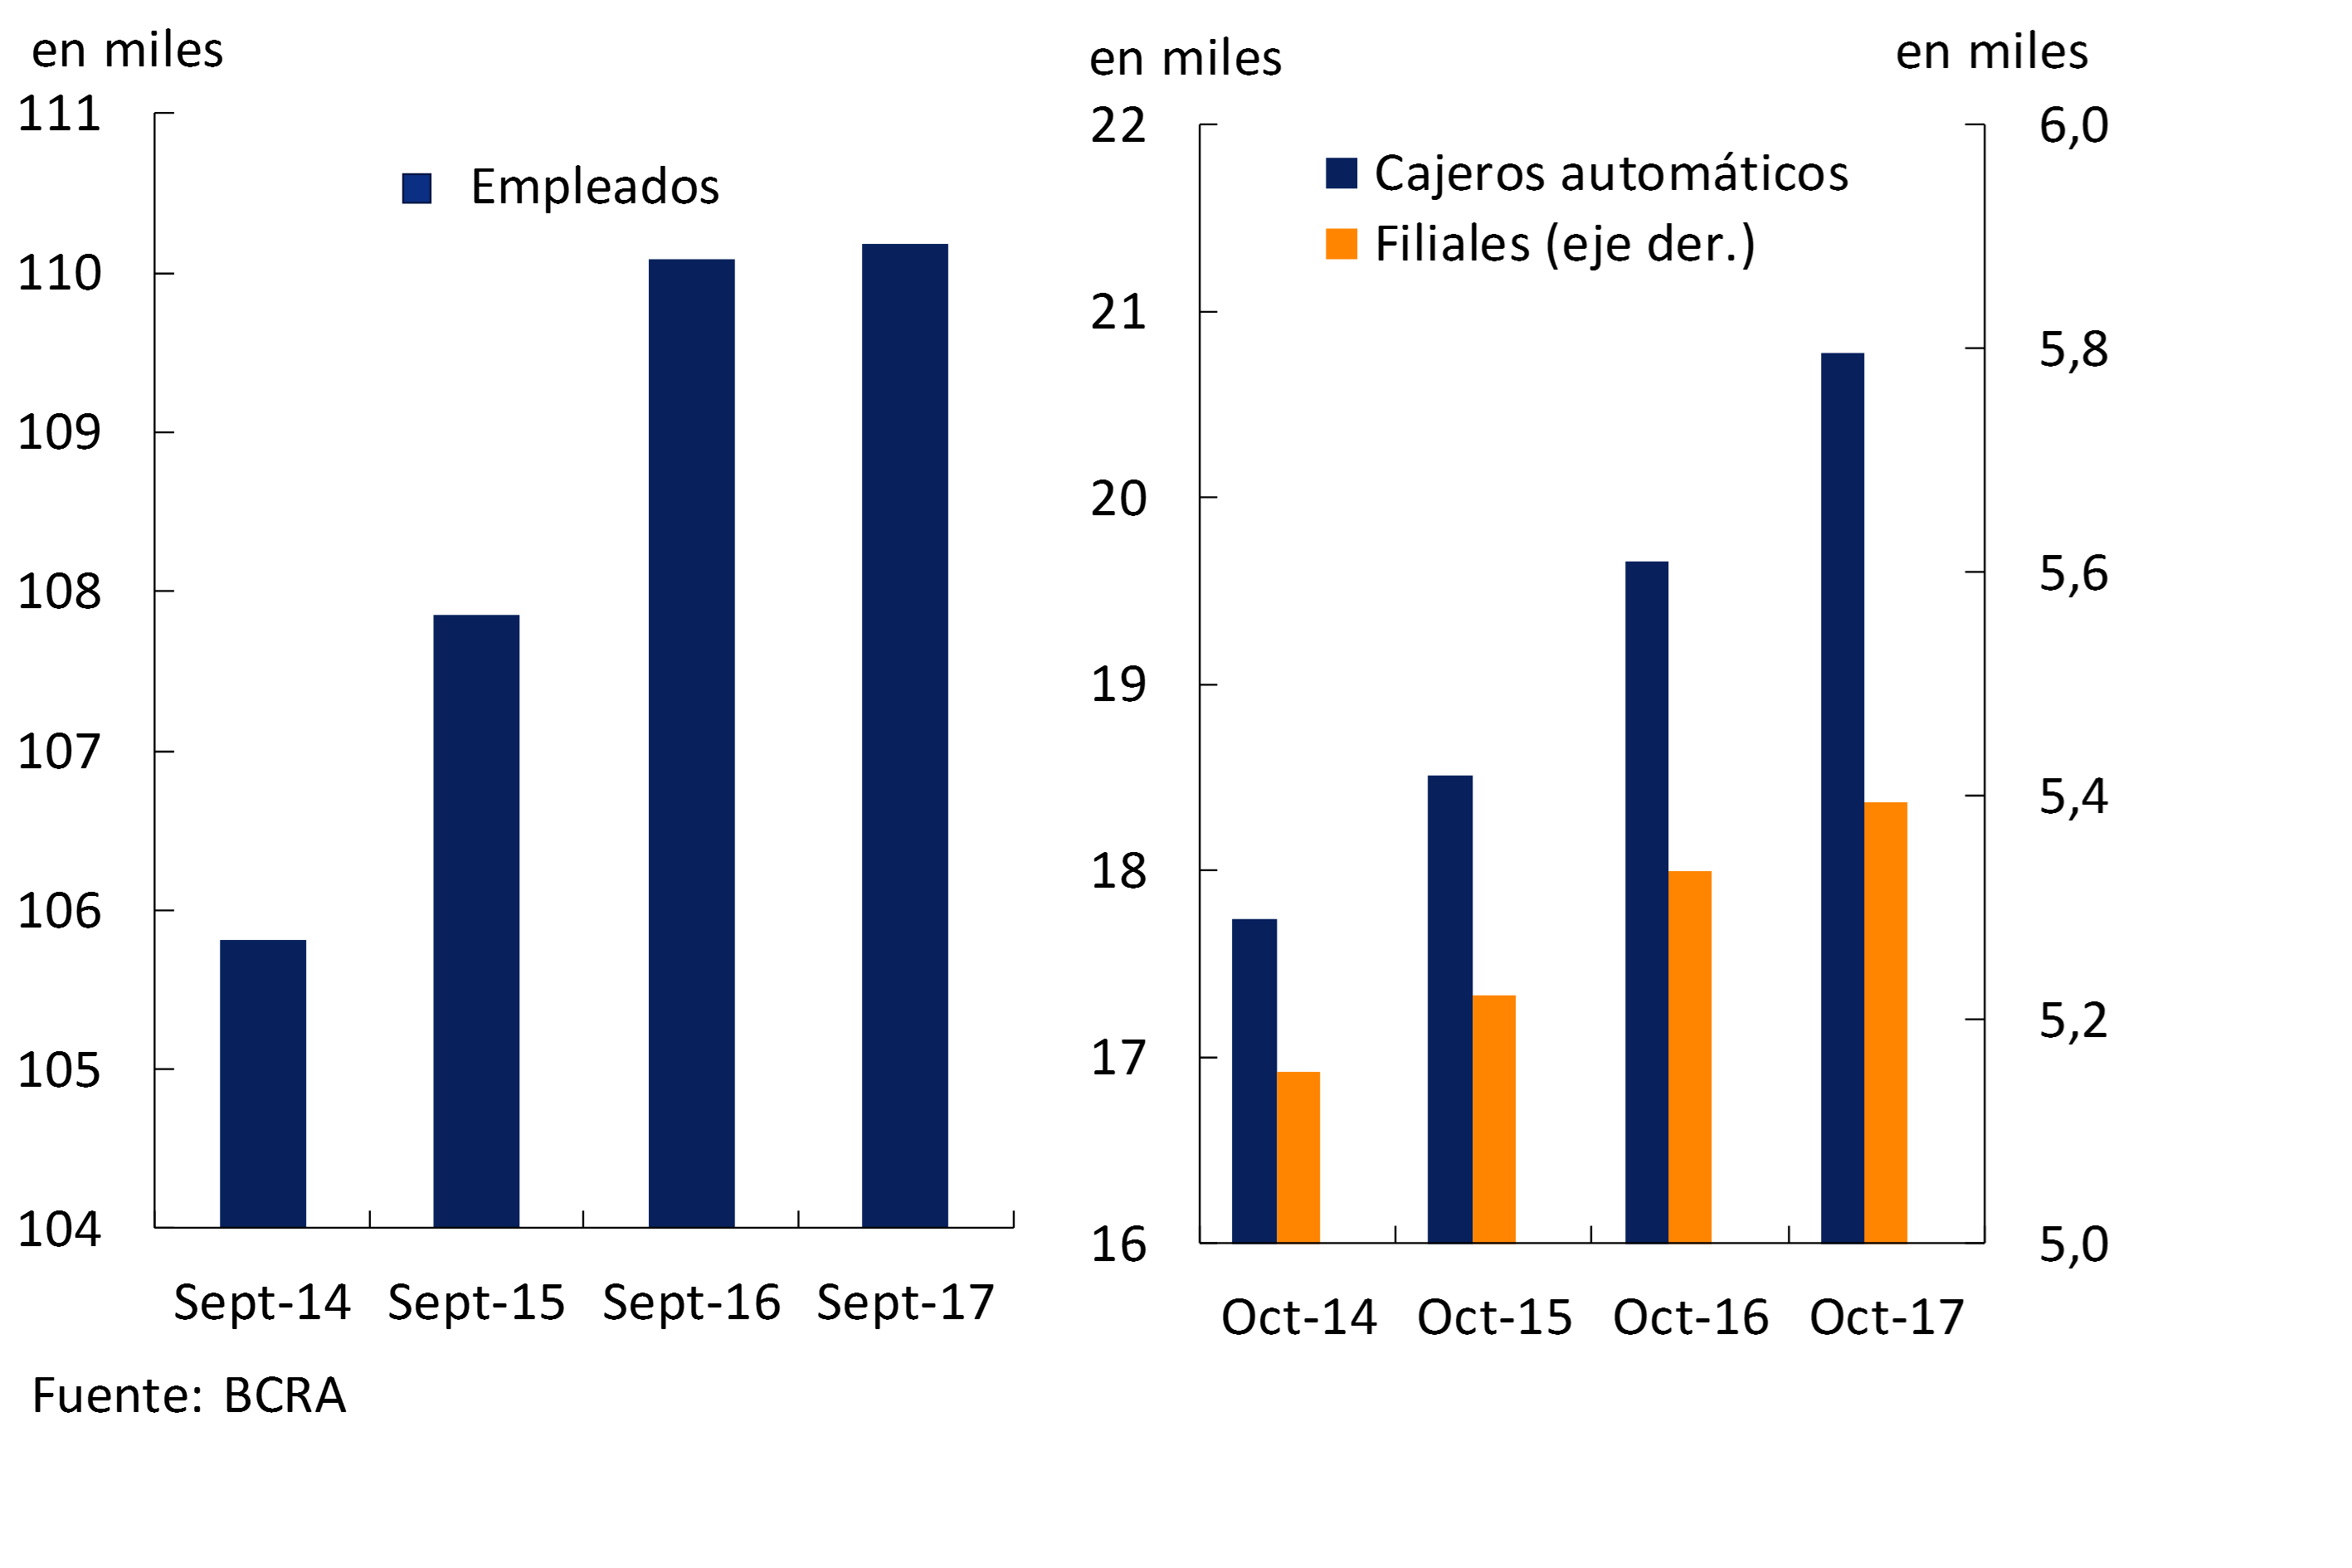
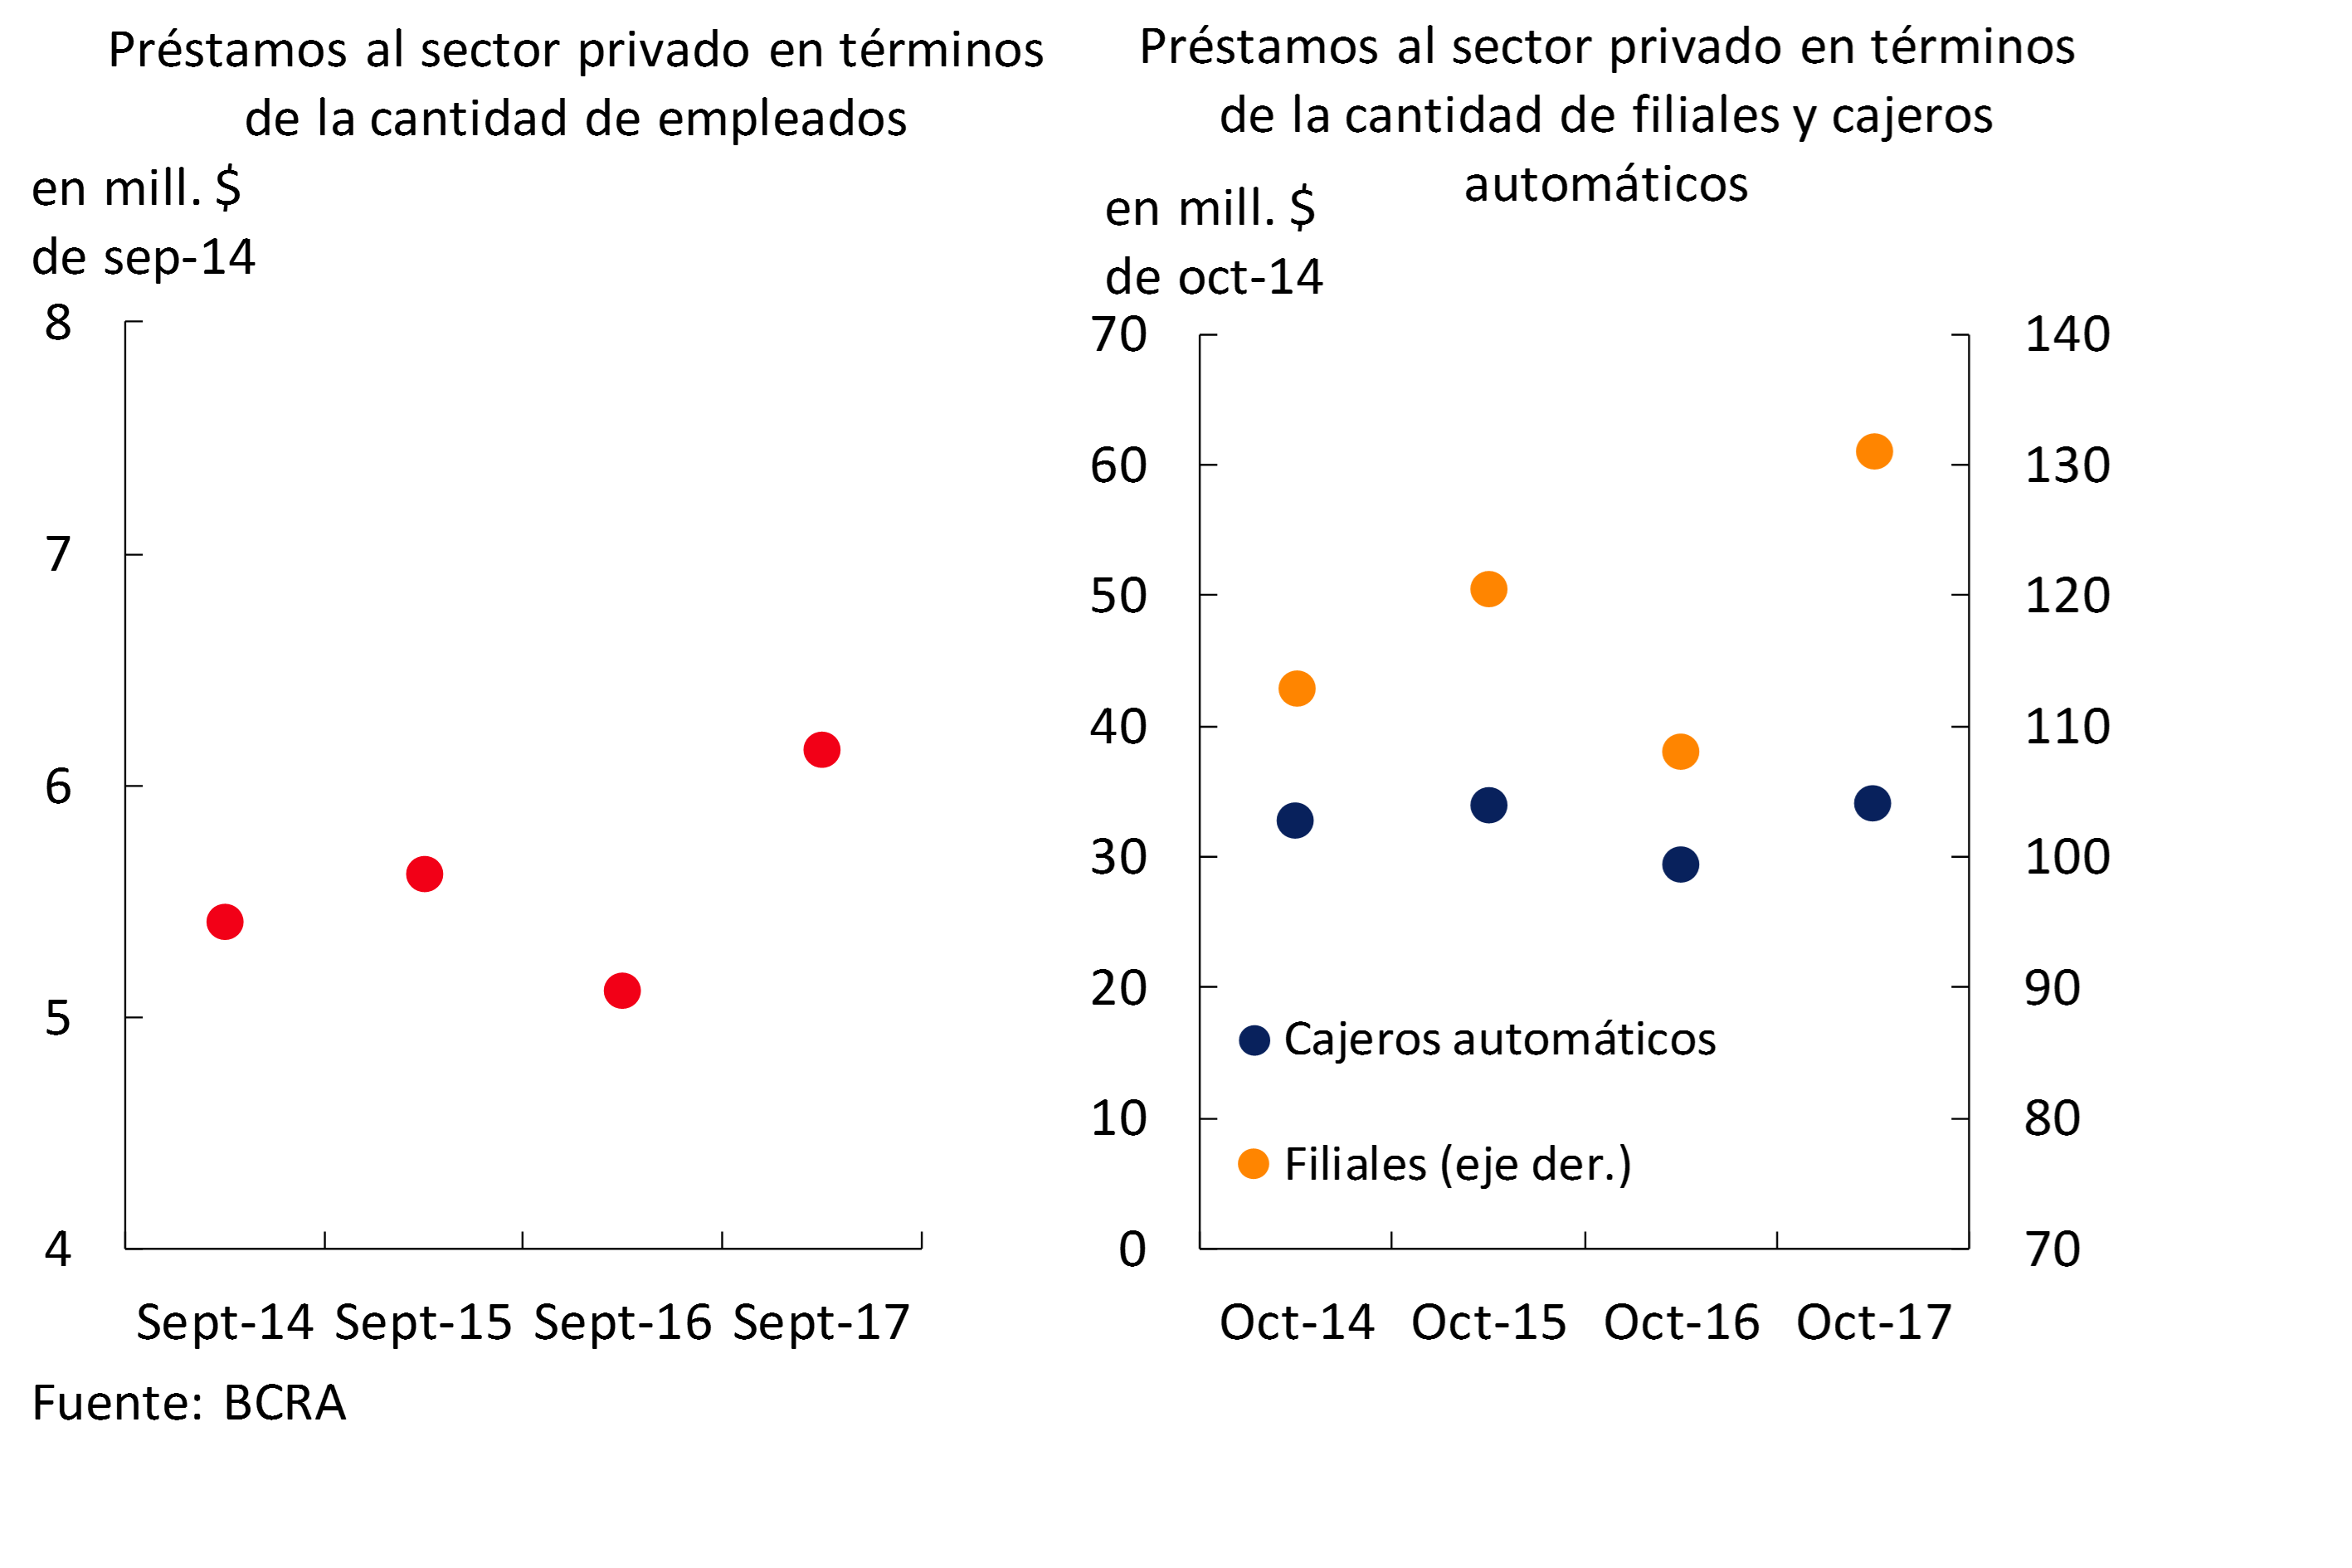
This performance is combined with greater use of the banking infrastructure. As of October, the number of ATMs amounted to 20,776, an increase of 5.7% compared to the same period in 2016 (see Graph 2). Bank subsidiaries totaled 5,395 at the beginning of the fourth quarter of the year, showing an increase of 1.2% YoY. For its part, the staffing reached 110,184 as of September – the latest information available – without significant changes compared to a year ago. Based on the outstanding dynamism of credit to the private sector, the ratios between the real balance of loans and ATMs, branches and bank personnel increased in the last year (see Graph 3).
Graph 2 | Staffing and Operational Infrastructure of the Financial System
Graph 3 | Loans, Employment and Service Units
Considering the estimate of the monthly cash flow5 of the items in national currency, the main source of resources for banks came from the increase in private sector deposits (see Graph 4). To a lesser extent, the decrease in the balance of the current accounts that the banks in the BCRA and the profits of the sector resulted in additional sources of funds for the month. These resources were mainly applied to expand financing to families and businesses ($56,000 million) and, to a lesser extent, to slightly increase LEBAC holdings. On the other hand, considering the monthly evolution of items in foreign currency, the reduction in liquidity and the increase in private sector deposits were the most prominent sources of funding for banks. The reduction in public sector deposits was the most relevant monthly application of resources for the segment in dollars.
Figure 4 | Monthly Cash Flow Estimate

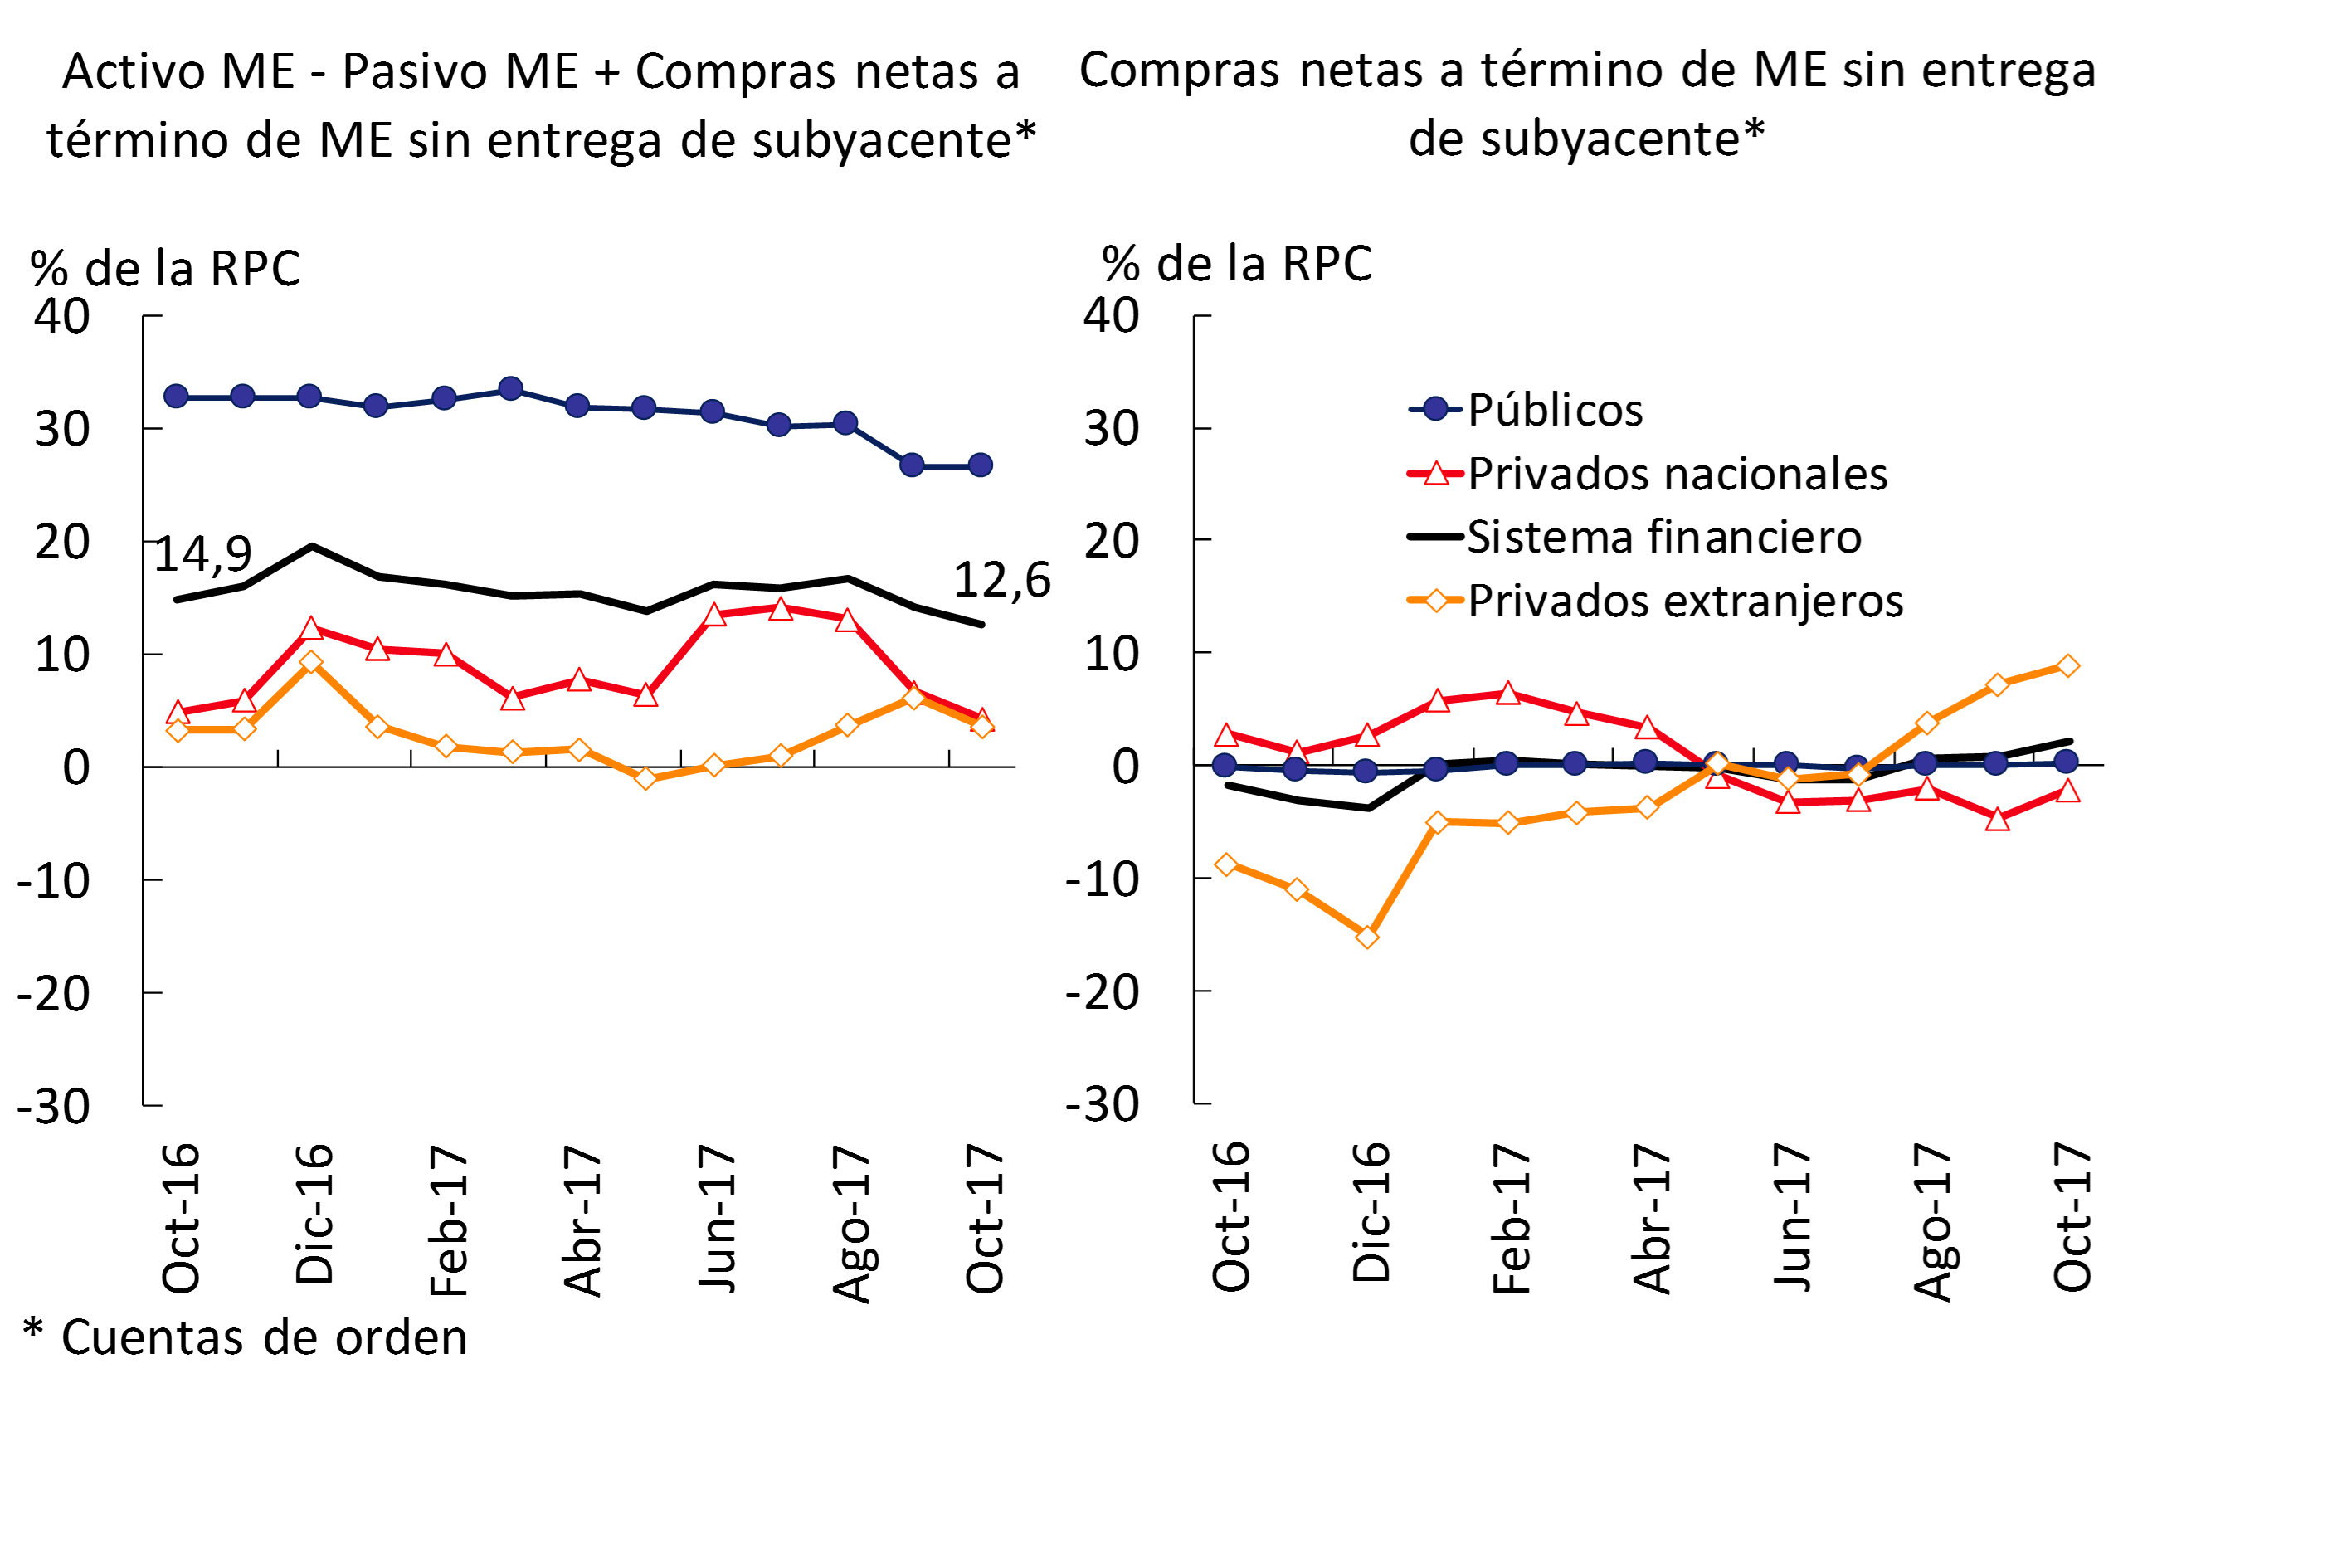
The dynamism of financial intermediation with the private sector was partly reflected in a higher volume of operations in foreign currency and in UVA – items with CER adjustment. In this context, the BCRA continues to monitor the evolution of equity items under different denominations. The aggregate mismatch of foreign currency in terms of the Computable Patrimonial Liability (CPR) has shown limited volatility in recent months (see Graph 5). In October, this mismatch stood at 12.6% of the PRC, 1.5 p.p. and 2.2 p.p. less than in the previous month and in the same period of 2016. With respect to the items adjusted for CER, it is estimated that the financial system presented an active mismatch of around 19% of the PRC as of October6.
Graph 5 | Foreign Currency Mismatch
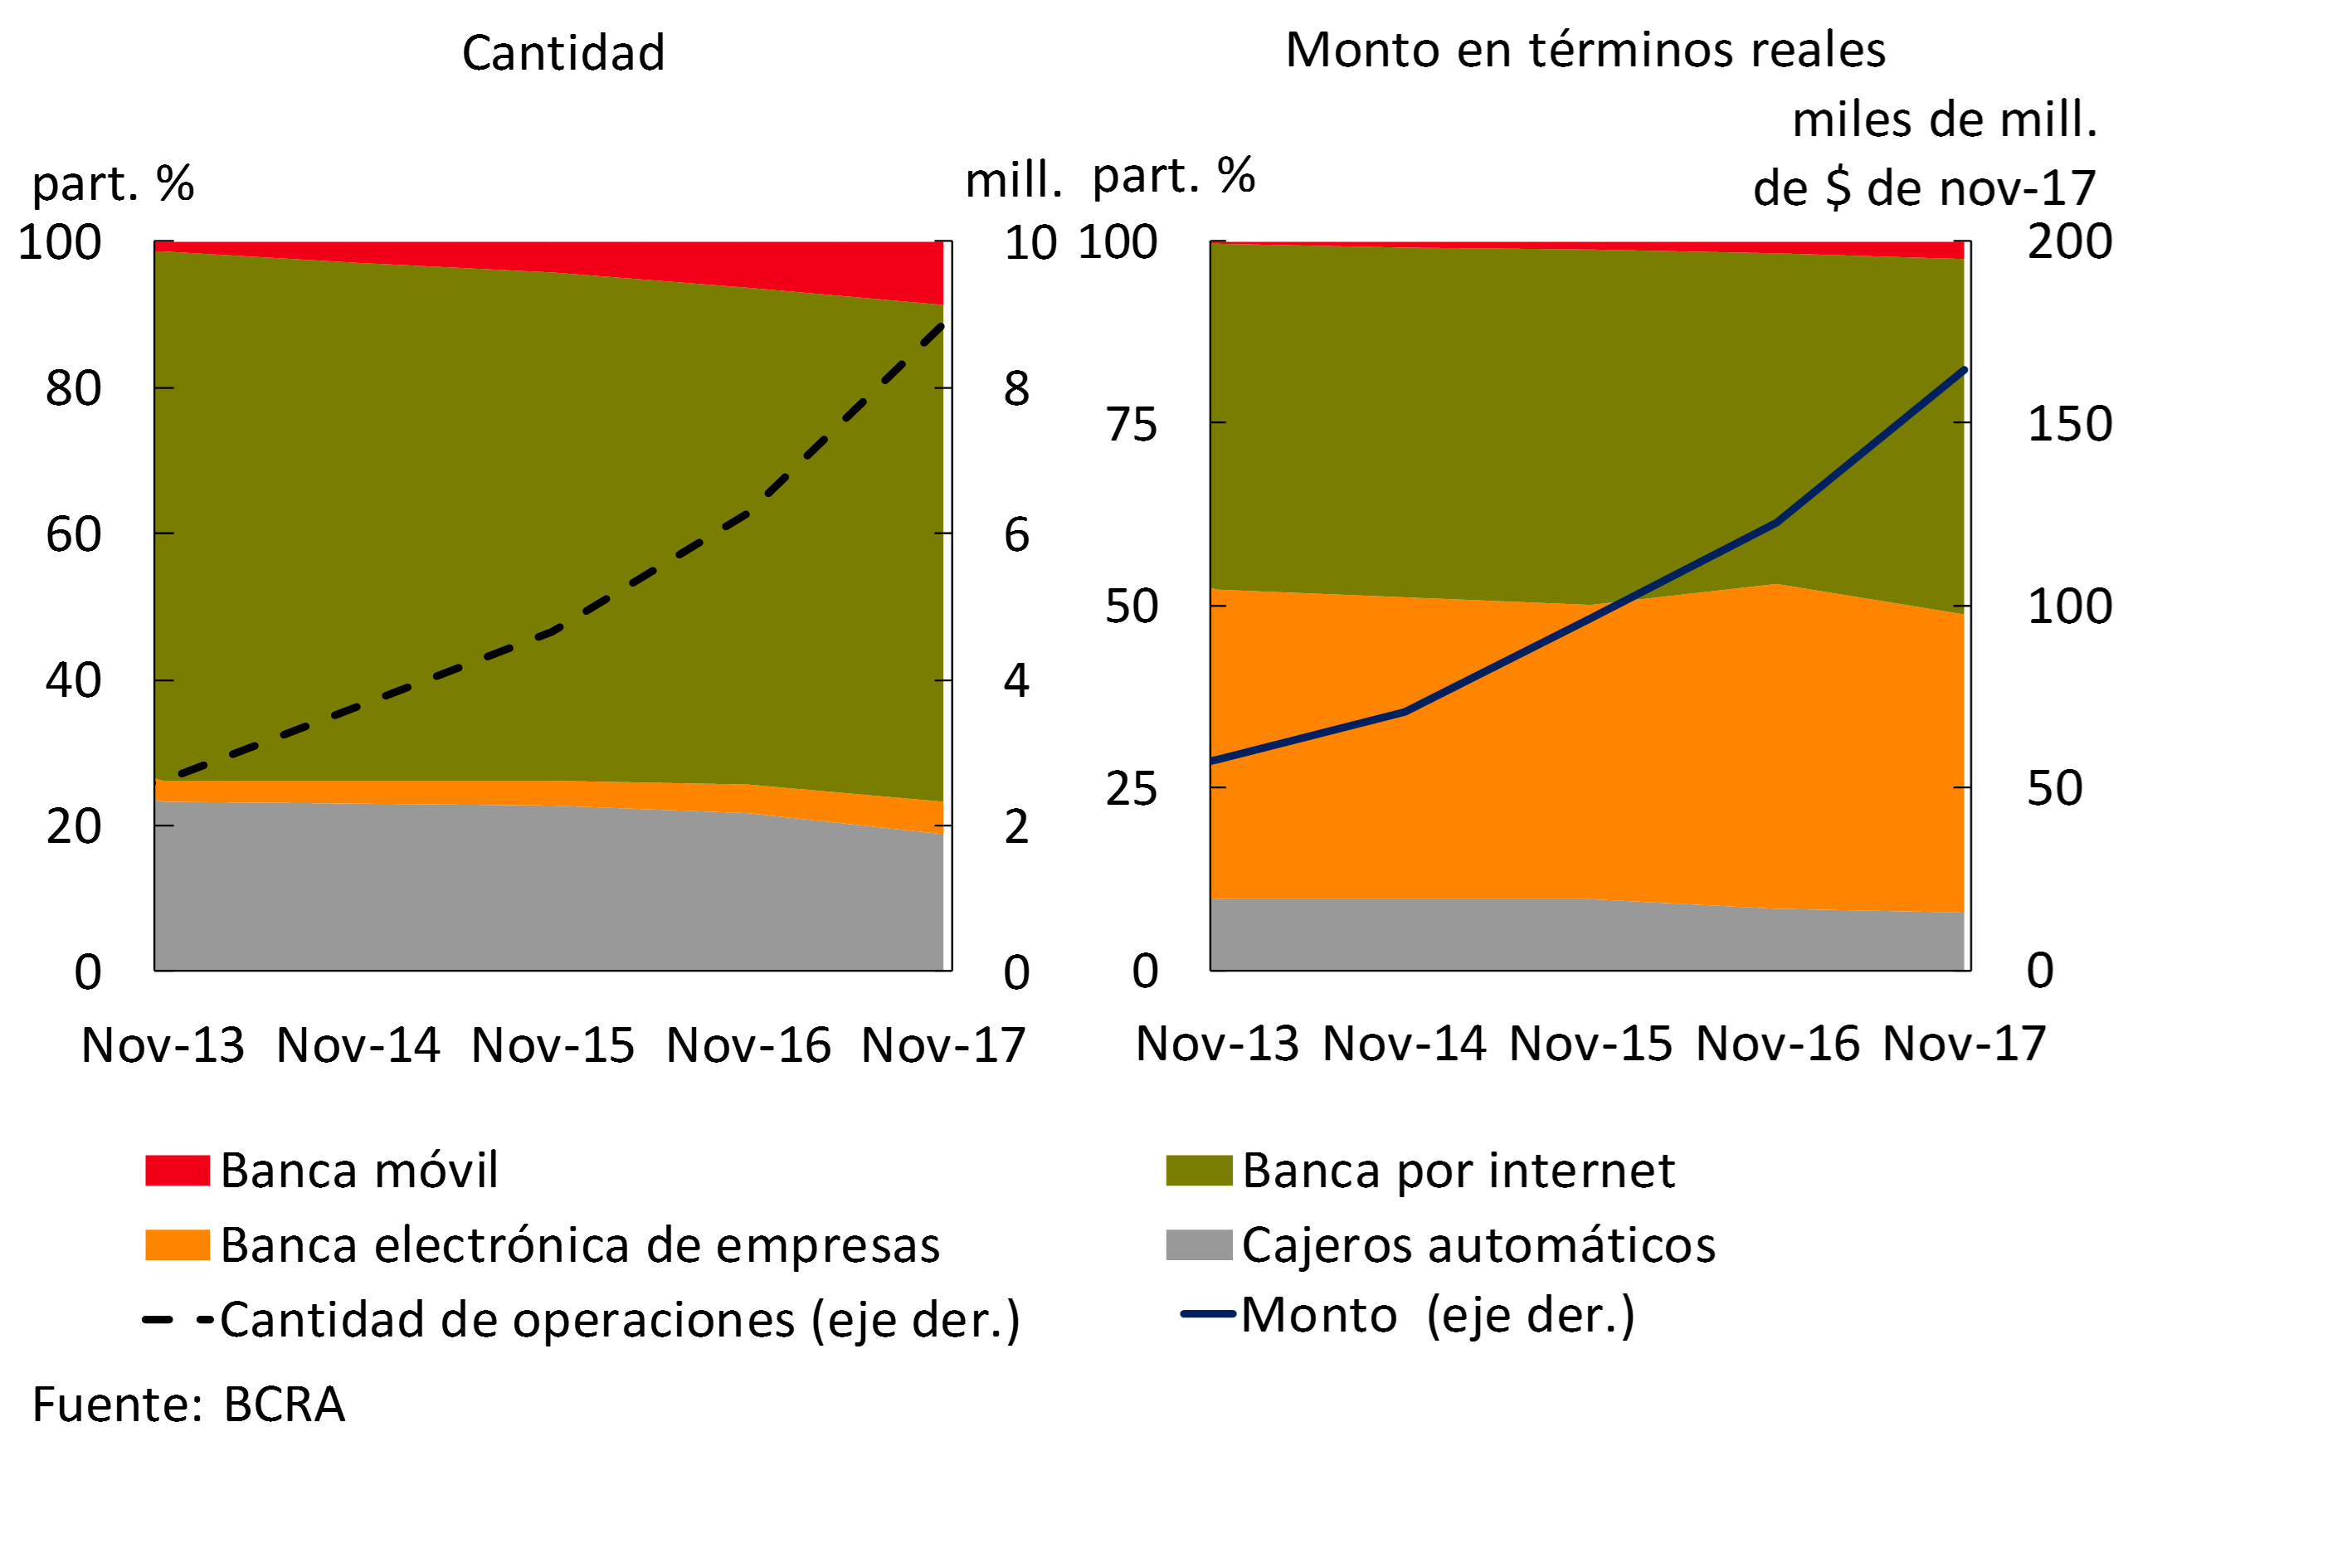
In relation to the payment system, in November transfers to third parties continued to grow significantly, driven by those that have immediate accreditation. The latter increased 41.2% YoY in number of transactions and 34.1% YoY in real values. As for the channels in which these operations are carried out, it is observed that the use of mobile banking is gradually gaining relevance, reaching 8.6% in November. On the other hand, the number of ATM transactions has been reducing its share (see Chart 6).
Graph 6 | Immediate Channel Transfers of Funds
The clearing of checks fell in November, both in real values and in amounts, continuing the trend observed in recent times. On the other hand, the rejection of checks due to lack of funds in terms of the total compensated remained at levels similar to those of last month, standing at around 1.1% for amounts and 0.7% for values. The current records were relatively in line with the medium-term average.
III. Deposits and liquidity
In October, private sector deposits – domestic and foreign currency – increased 0.3% in real terms compared to September. This performance was mainly due to the monthly increase in foreign currency placements by the private sector (+0.8% in source currency), while deposits in pesos remained unchanged in magnitude compared to last month when adjusting for inflation – with a similar dynamic of demand accounts and time deposits. For its part, the public sector accounts fell in the month, leading to a 1.3% drop in total deposits in the financial system in real terms.
Considering the last twelve months, the balance of private sector deposits grew 7.7% in real terms (see Chart 7). This increase was almost entirely explained by the segment in foreign currency (+48% YoY in home currency), while the real balance of deposits in pesos was practically unchanged in relation to the level of October 2016. On the other hand, public sector placements fell 12.4% in real terms compared to the same month in 2016. Thus, total deposits in the financial system accumulated an increase of 3.1% y.o.y. adjusting for inflation.
Figure 7 | Total Private Sector Deposits – Var. A.I. of the balance in real terms

From high levels, the liquidity of the financial system continued to be reduced, in line with the performance of financial intermediation. The broad liquidity indicator – including LEBAC and passes with the BCRA – of the banks as a whole reached 41.3% of deposits in October, 1.4 p.p. less than last month (see Chart 8). This monthly reduction was explained by the decrease in the balance of the current account in foreign currency of financial institutions at the BCRA. The broad liquidity ratio accumulated a reduction of 11.1 p.p. in deposits since the peak reached in March 2017. For its part, the limited liquidity indicator – without LEBAC holdings or passes – represented 24.9% of deposits in the month, 1.8 p.p. less than the September figure.
Figure 8 | Ample Liquidity by Group of Banks
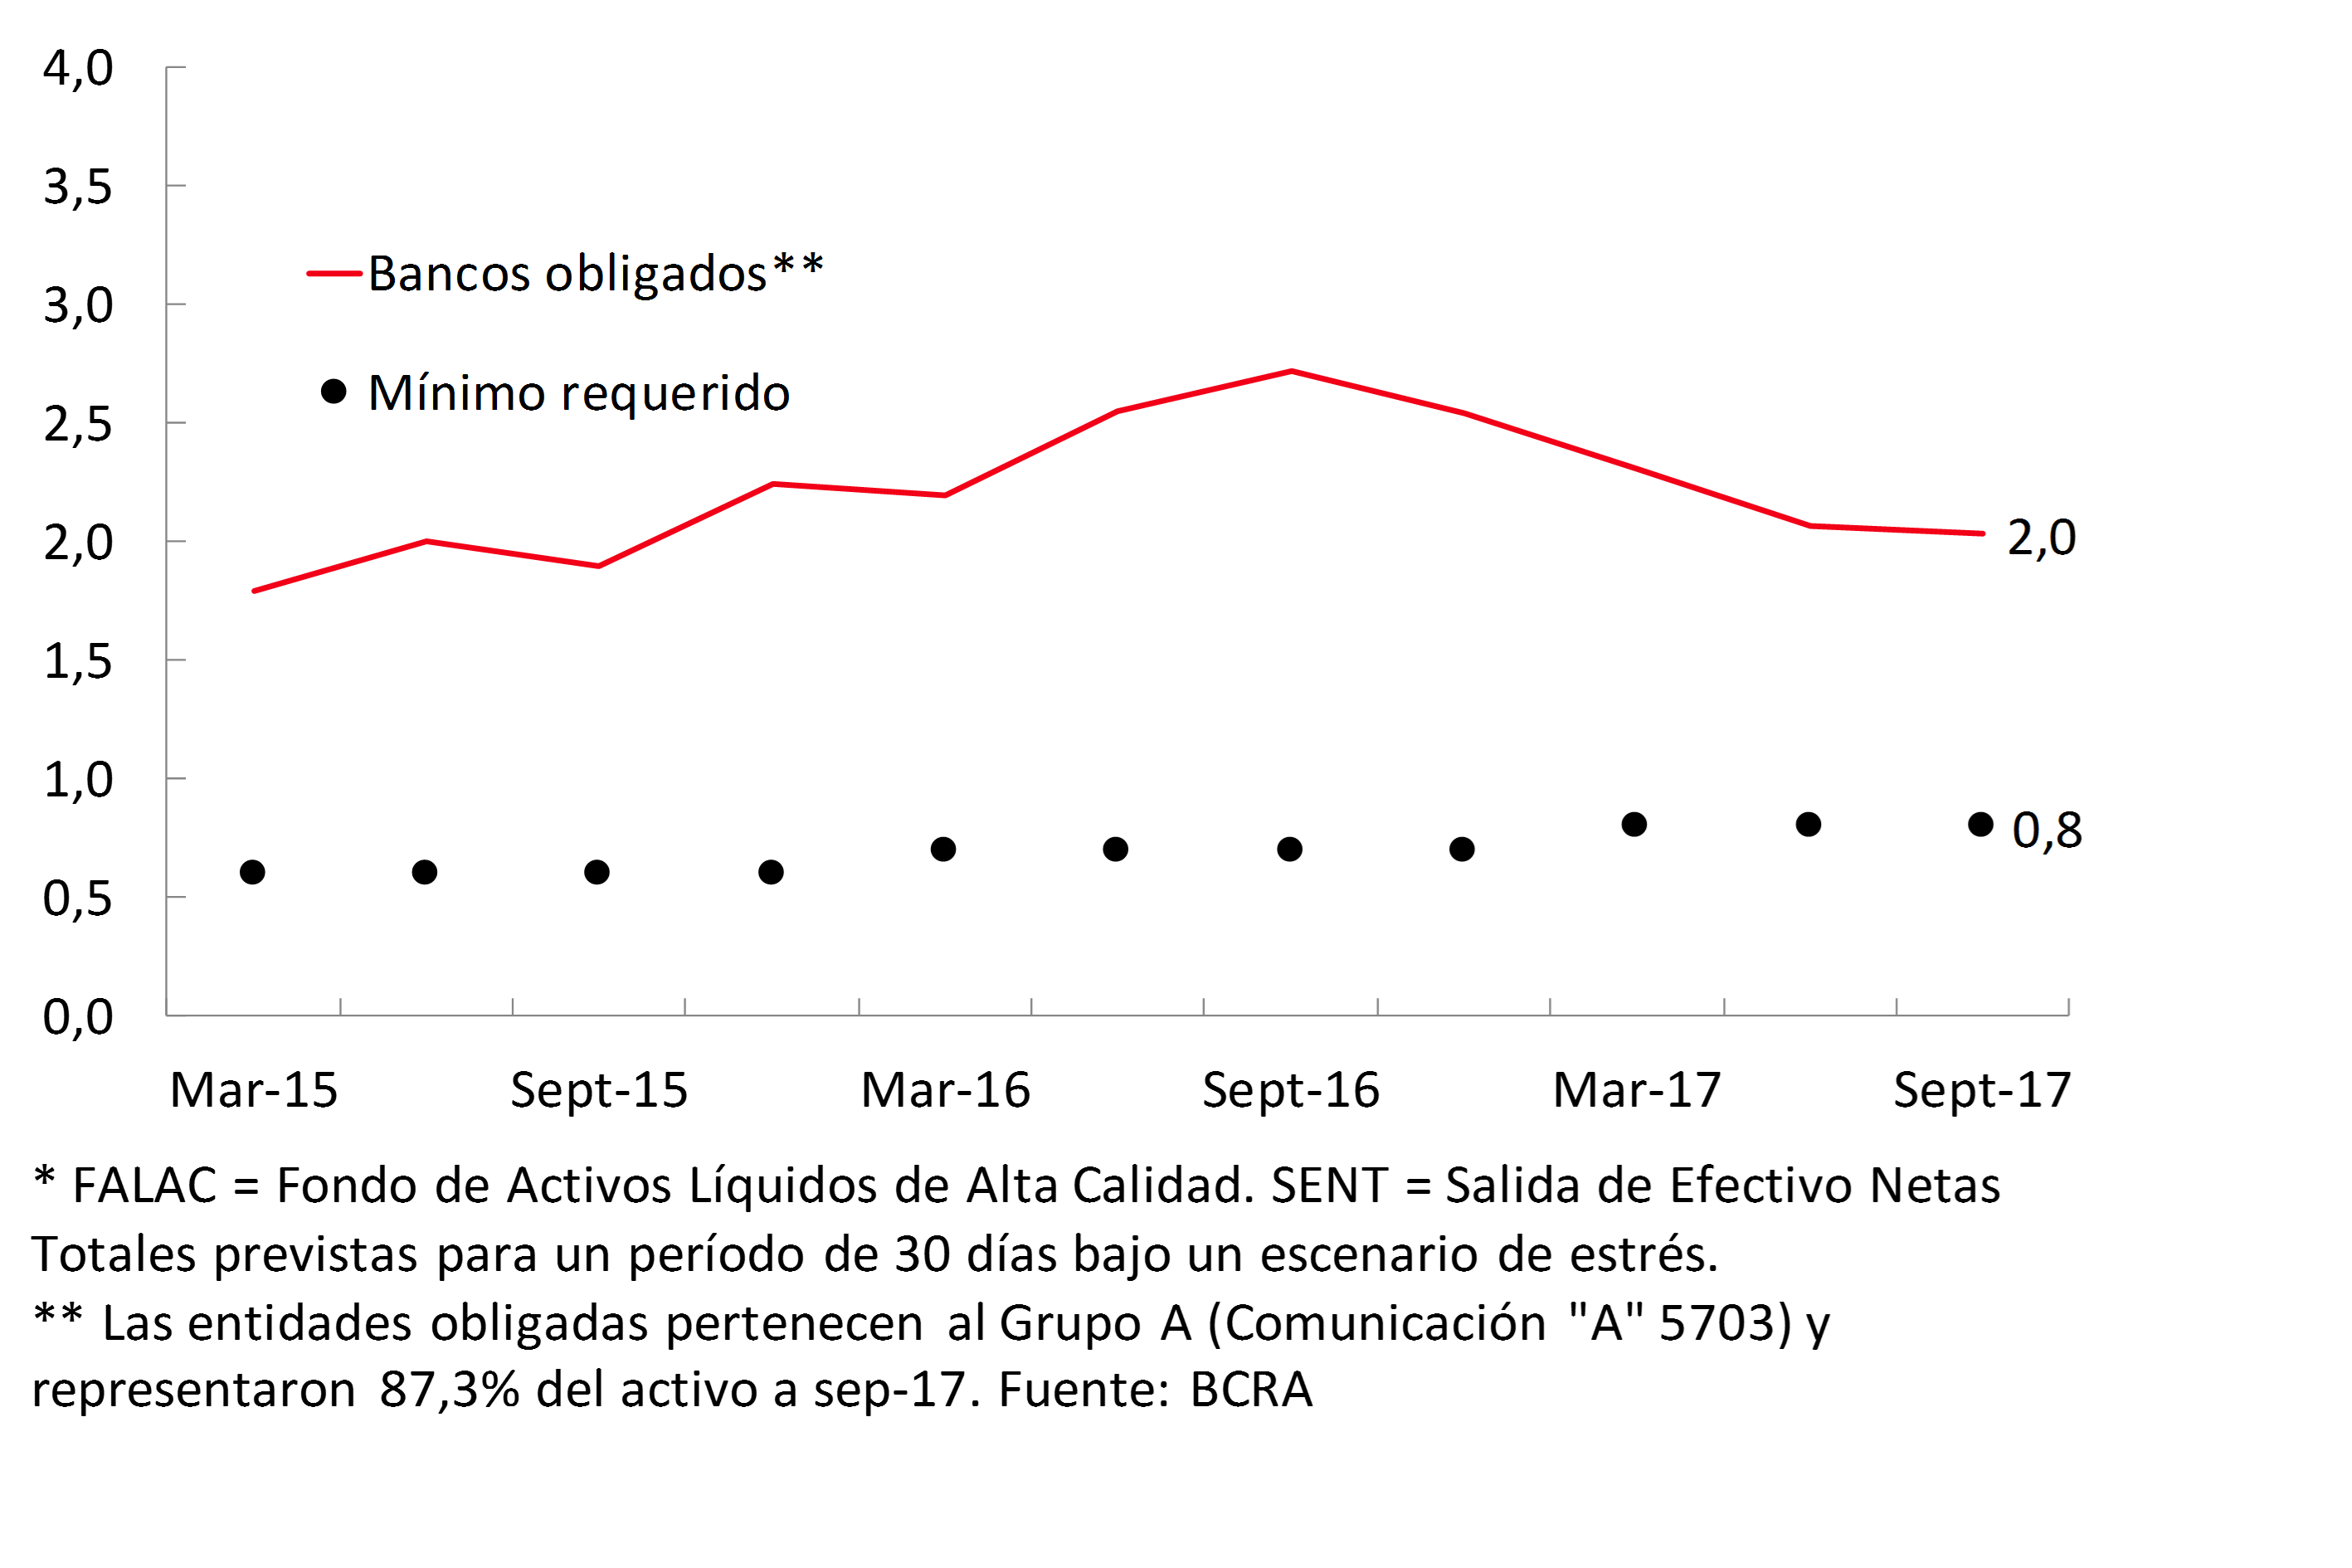
In relation to the liquidity coverage ratio (LCR), the largest local financial institutions7 continued to show levels that exceed the minimums recommended by the Basel Committee (see Chart 9). As of September, the latest information available, the largest banks presented an average record for the liquidity coverage ratio of around 2, slightly lower than that recorded in mid-2017 and September 2016. However, the current level has far exceeded the minimum required at the local level, which is in line with the schedule defined by the Basel committee.
Figure 9 | FALAC / SENT* liquidity coverage ratio
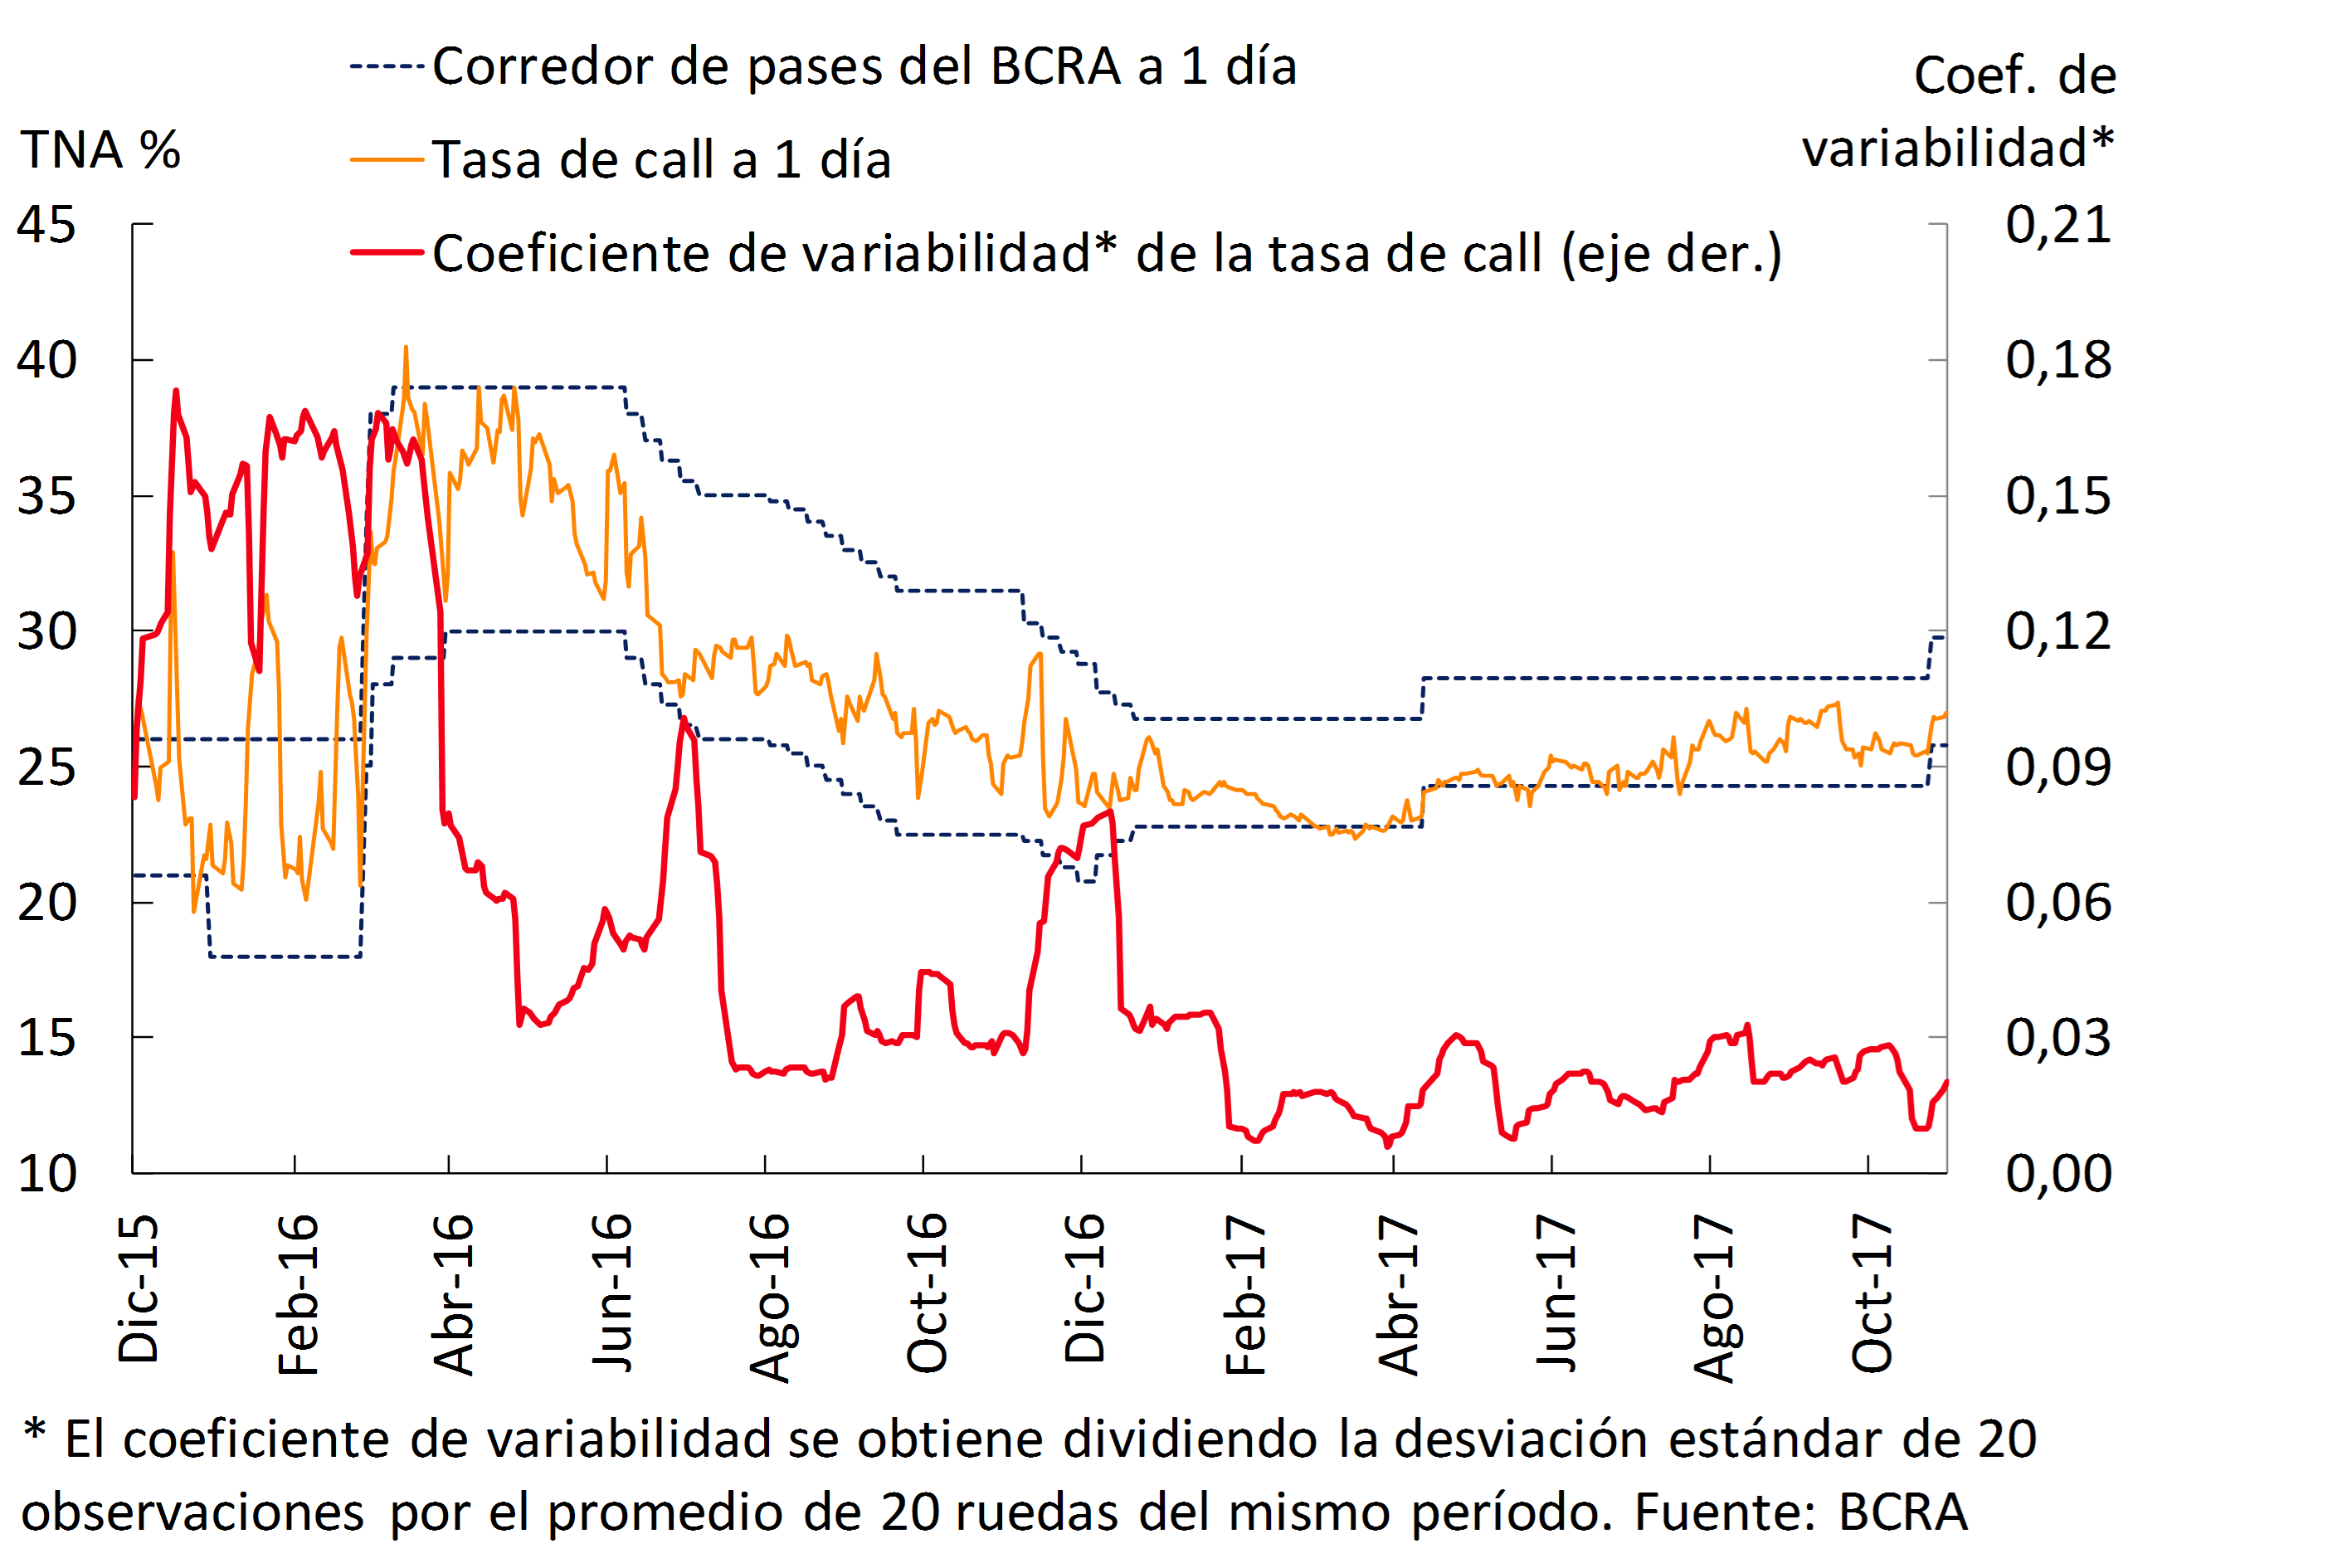
In October, the interest rates of the call market remained within the BCRA’s pass corridor, adapting to the increase provided for pass operations with this Institution. In the month, the monetary policy rate – the center of the 7-day pass corridor – increased 1.5 p.p., to 27.75%. This corridor reached 27%-28.5% in October. Subsequently, at the beginning of November, the BCRA decided on another 1 p.p. increase in its monetary policy rate, bringing the center of the corridor to 28.75%. In this context, interest rates in the interfinancial liquidity markets continued to show moderate volatility in October (see Chart 10).
Figure 10 | Interest Rates in Interfinancial Markets and Volatility
IV. Financing
In October, the balance of total financing to the private sector grew 2.6%8 when adjusted for inflation. This performance was explained by the lines in pesos, which verified a real monthly increase of 3.1%9. Within this segment, mortgage lines were the most dynamic, followed by advances, cards and personal. For its part, the balance of loans in foreign currency did not show significant changes in October —in the currency of origin—. Loans channeled by public banks observed the highest relative growth in the month.
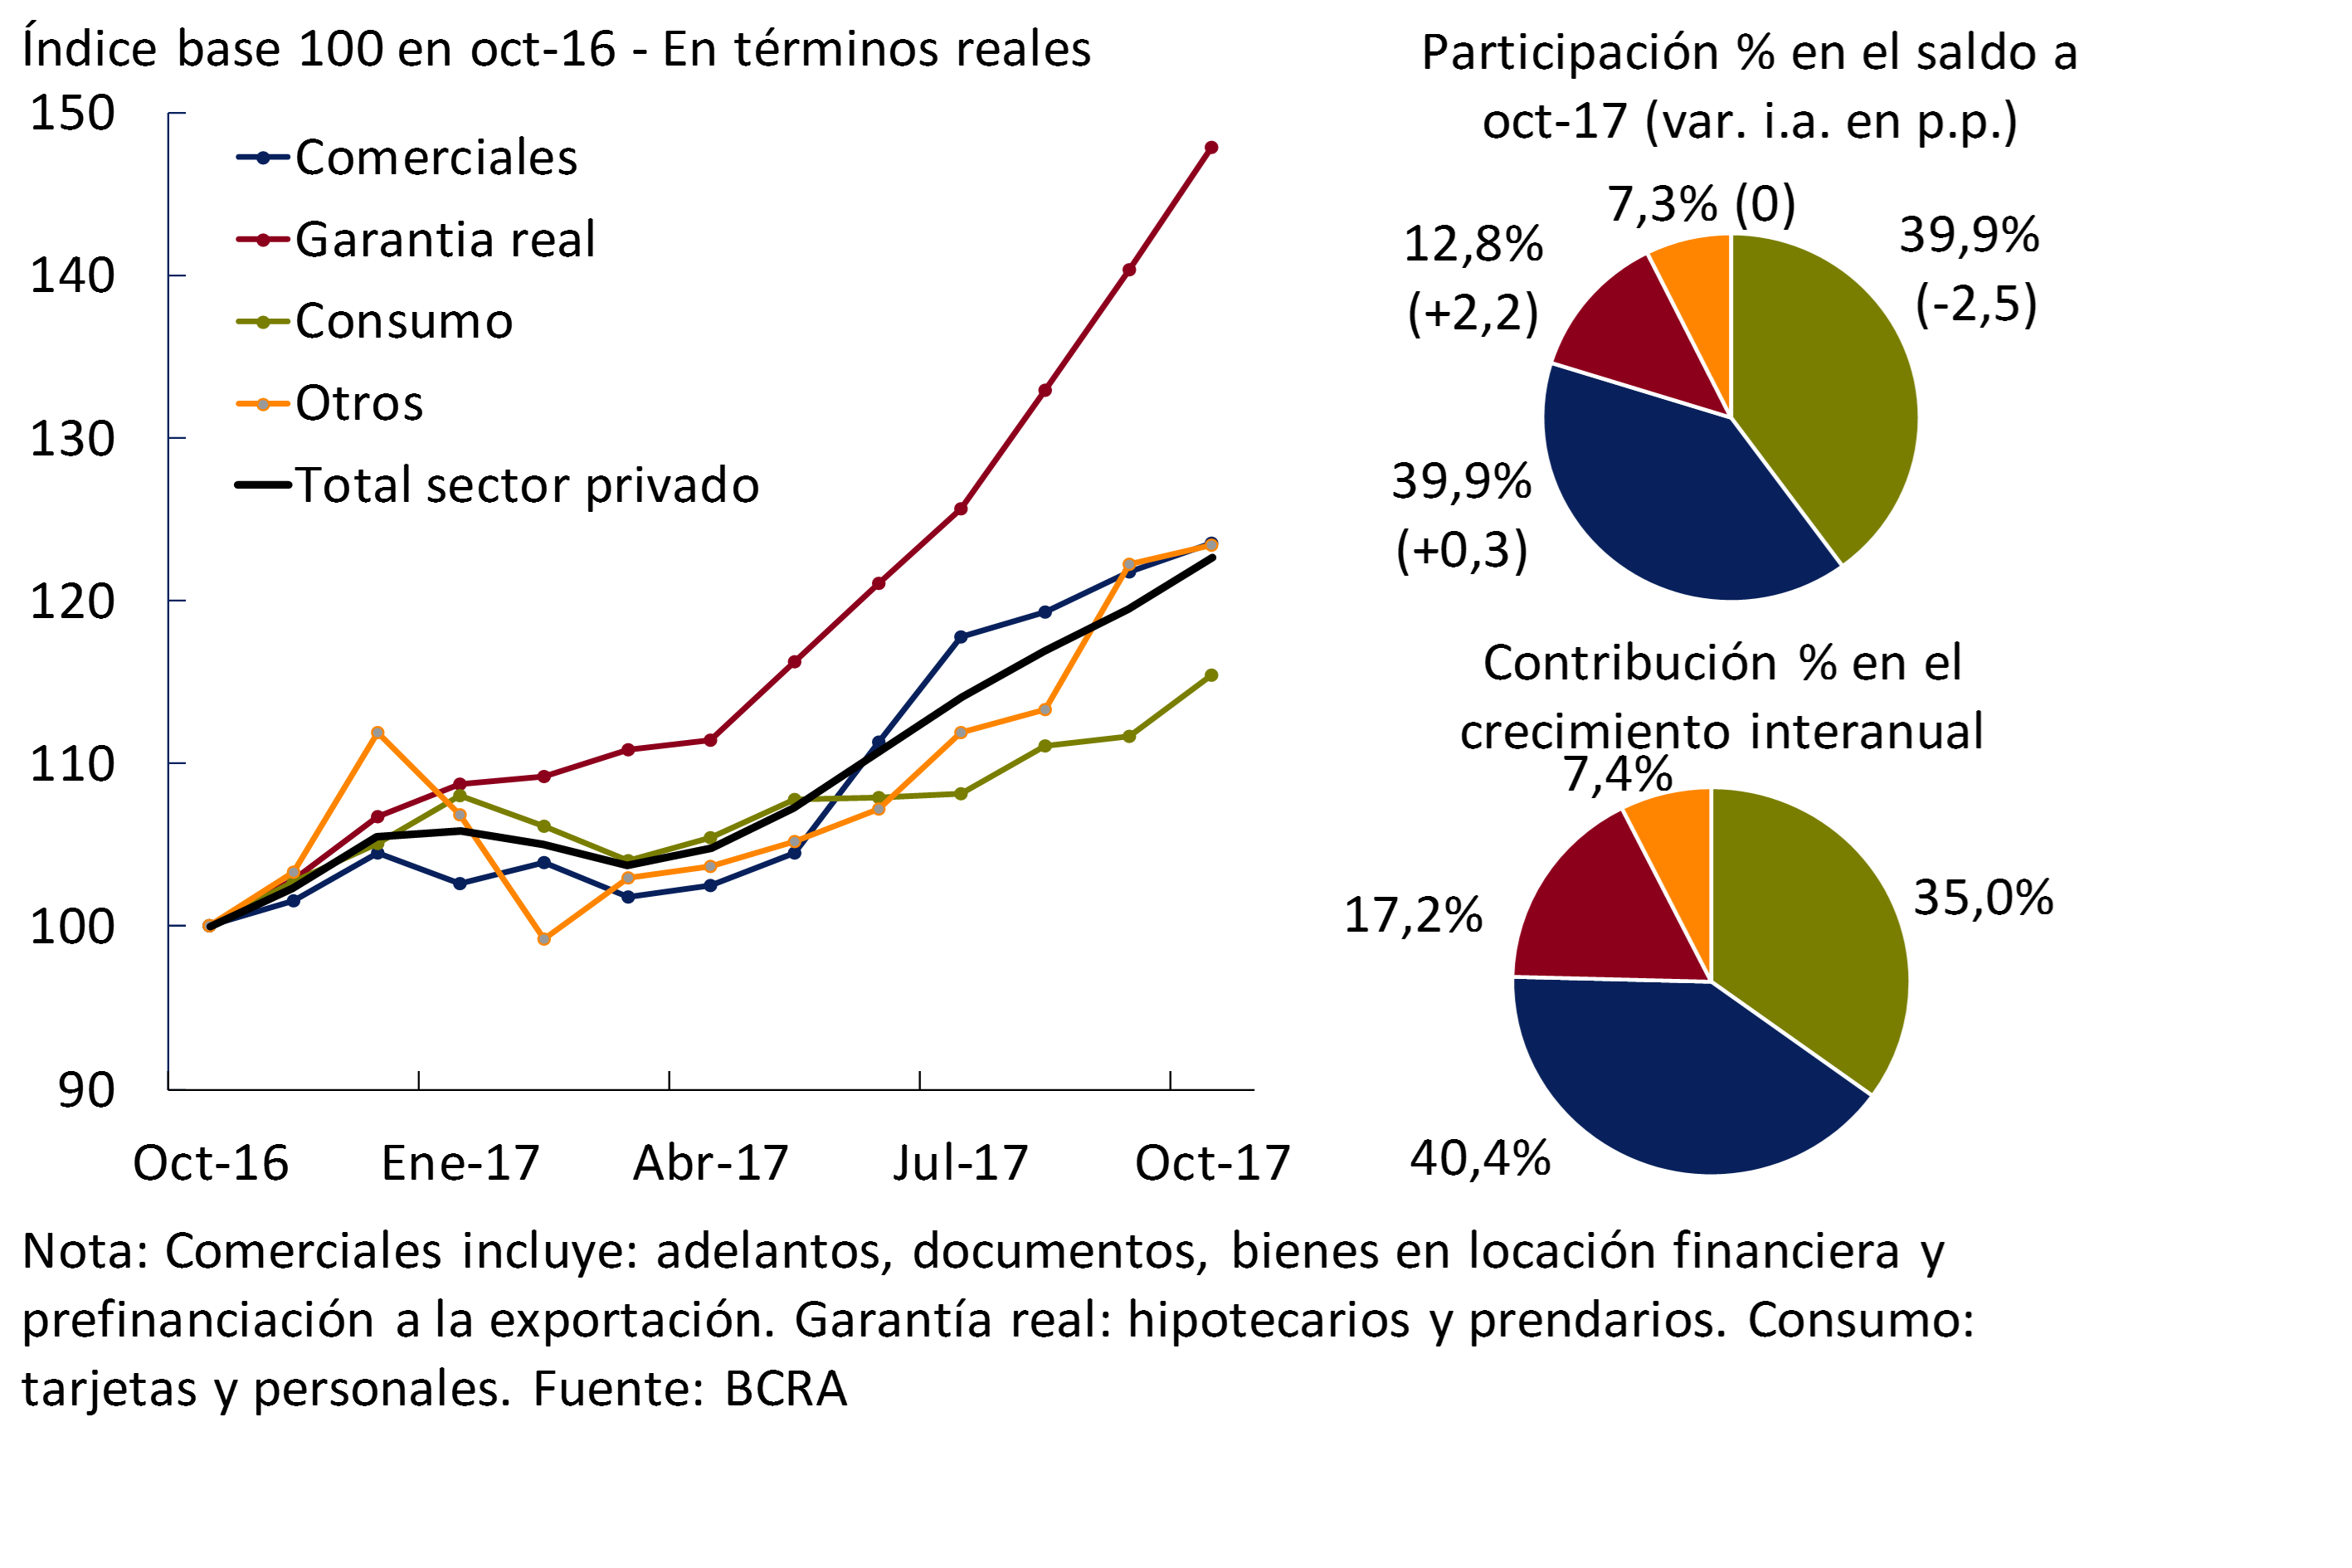
Year-on-year growth in total credit to the private sector continued to consolidate in October (see Chart 11). In this way, financing to this sector accumulated a year-on-year increase of 22.7% y.o.y. when adjusted for inflation. The expansion of credit in the last twelve months was widespread among the different credit lines (see Graph 12), highlighting the mortgage and pledge segment, and to a lesser extent, commercial loans. Distinguishing by currency, financing in pesos showed an increase of 16.9% real YoY; while those denominated in foreign currency grew 67.5% YoY.10
Figure 11 | Real Balance of Total Credit to the Private Sector

Figure 12 | Total Credit Balance to the Private Sector
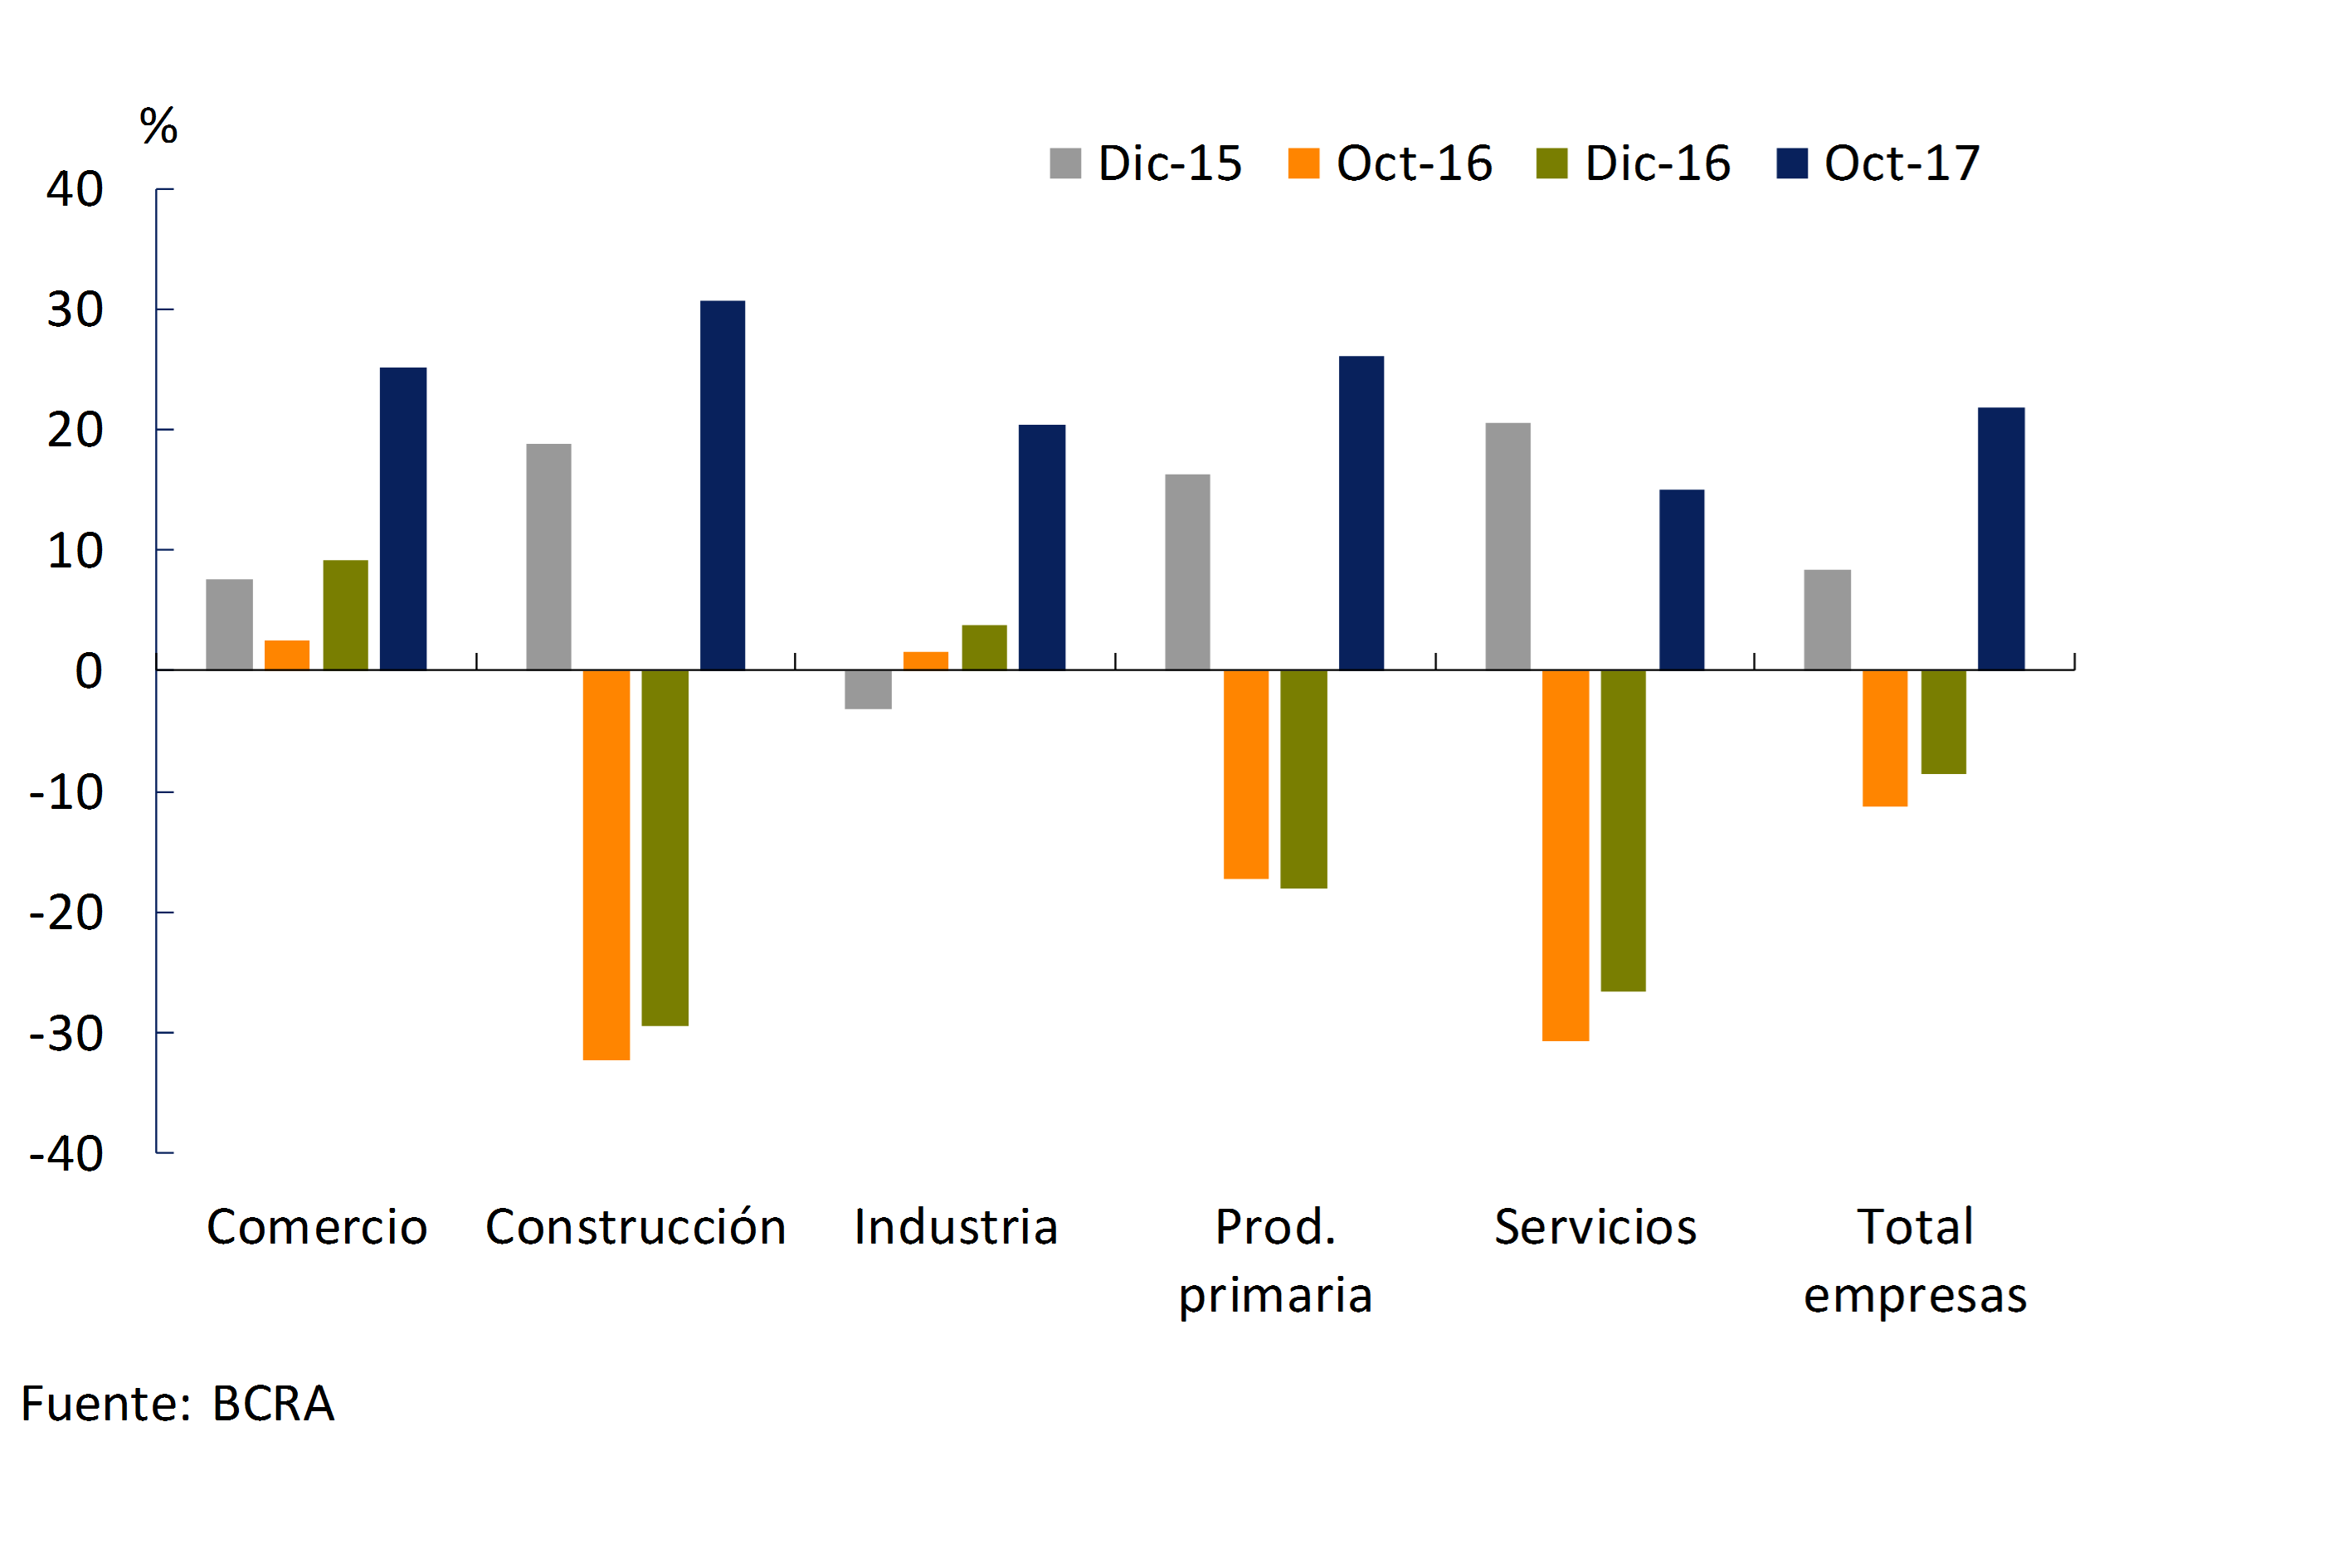
Total financing to companies11 increased 2% when adjusting for inflation compared to September. In the month, loans to construction and primary production were the most dynamic. In a year-on-year comparison, loans to the productive sector grew 21.8% in real terms, with a substantial improvement in all productive sectors compared to the levels observed months ago (see Graph 13). This performance was driven by public banks and, to a lesser extent, by domestic and foreign private banks.
Figure 13 | Real Balance of Total Credit to Companies – Change % year-on-year
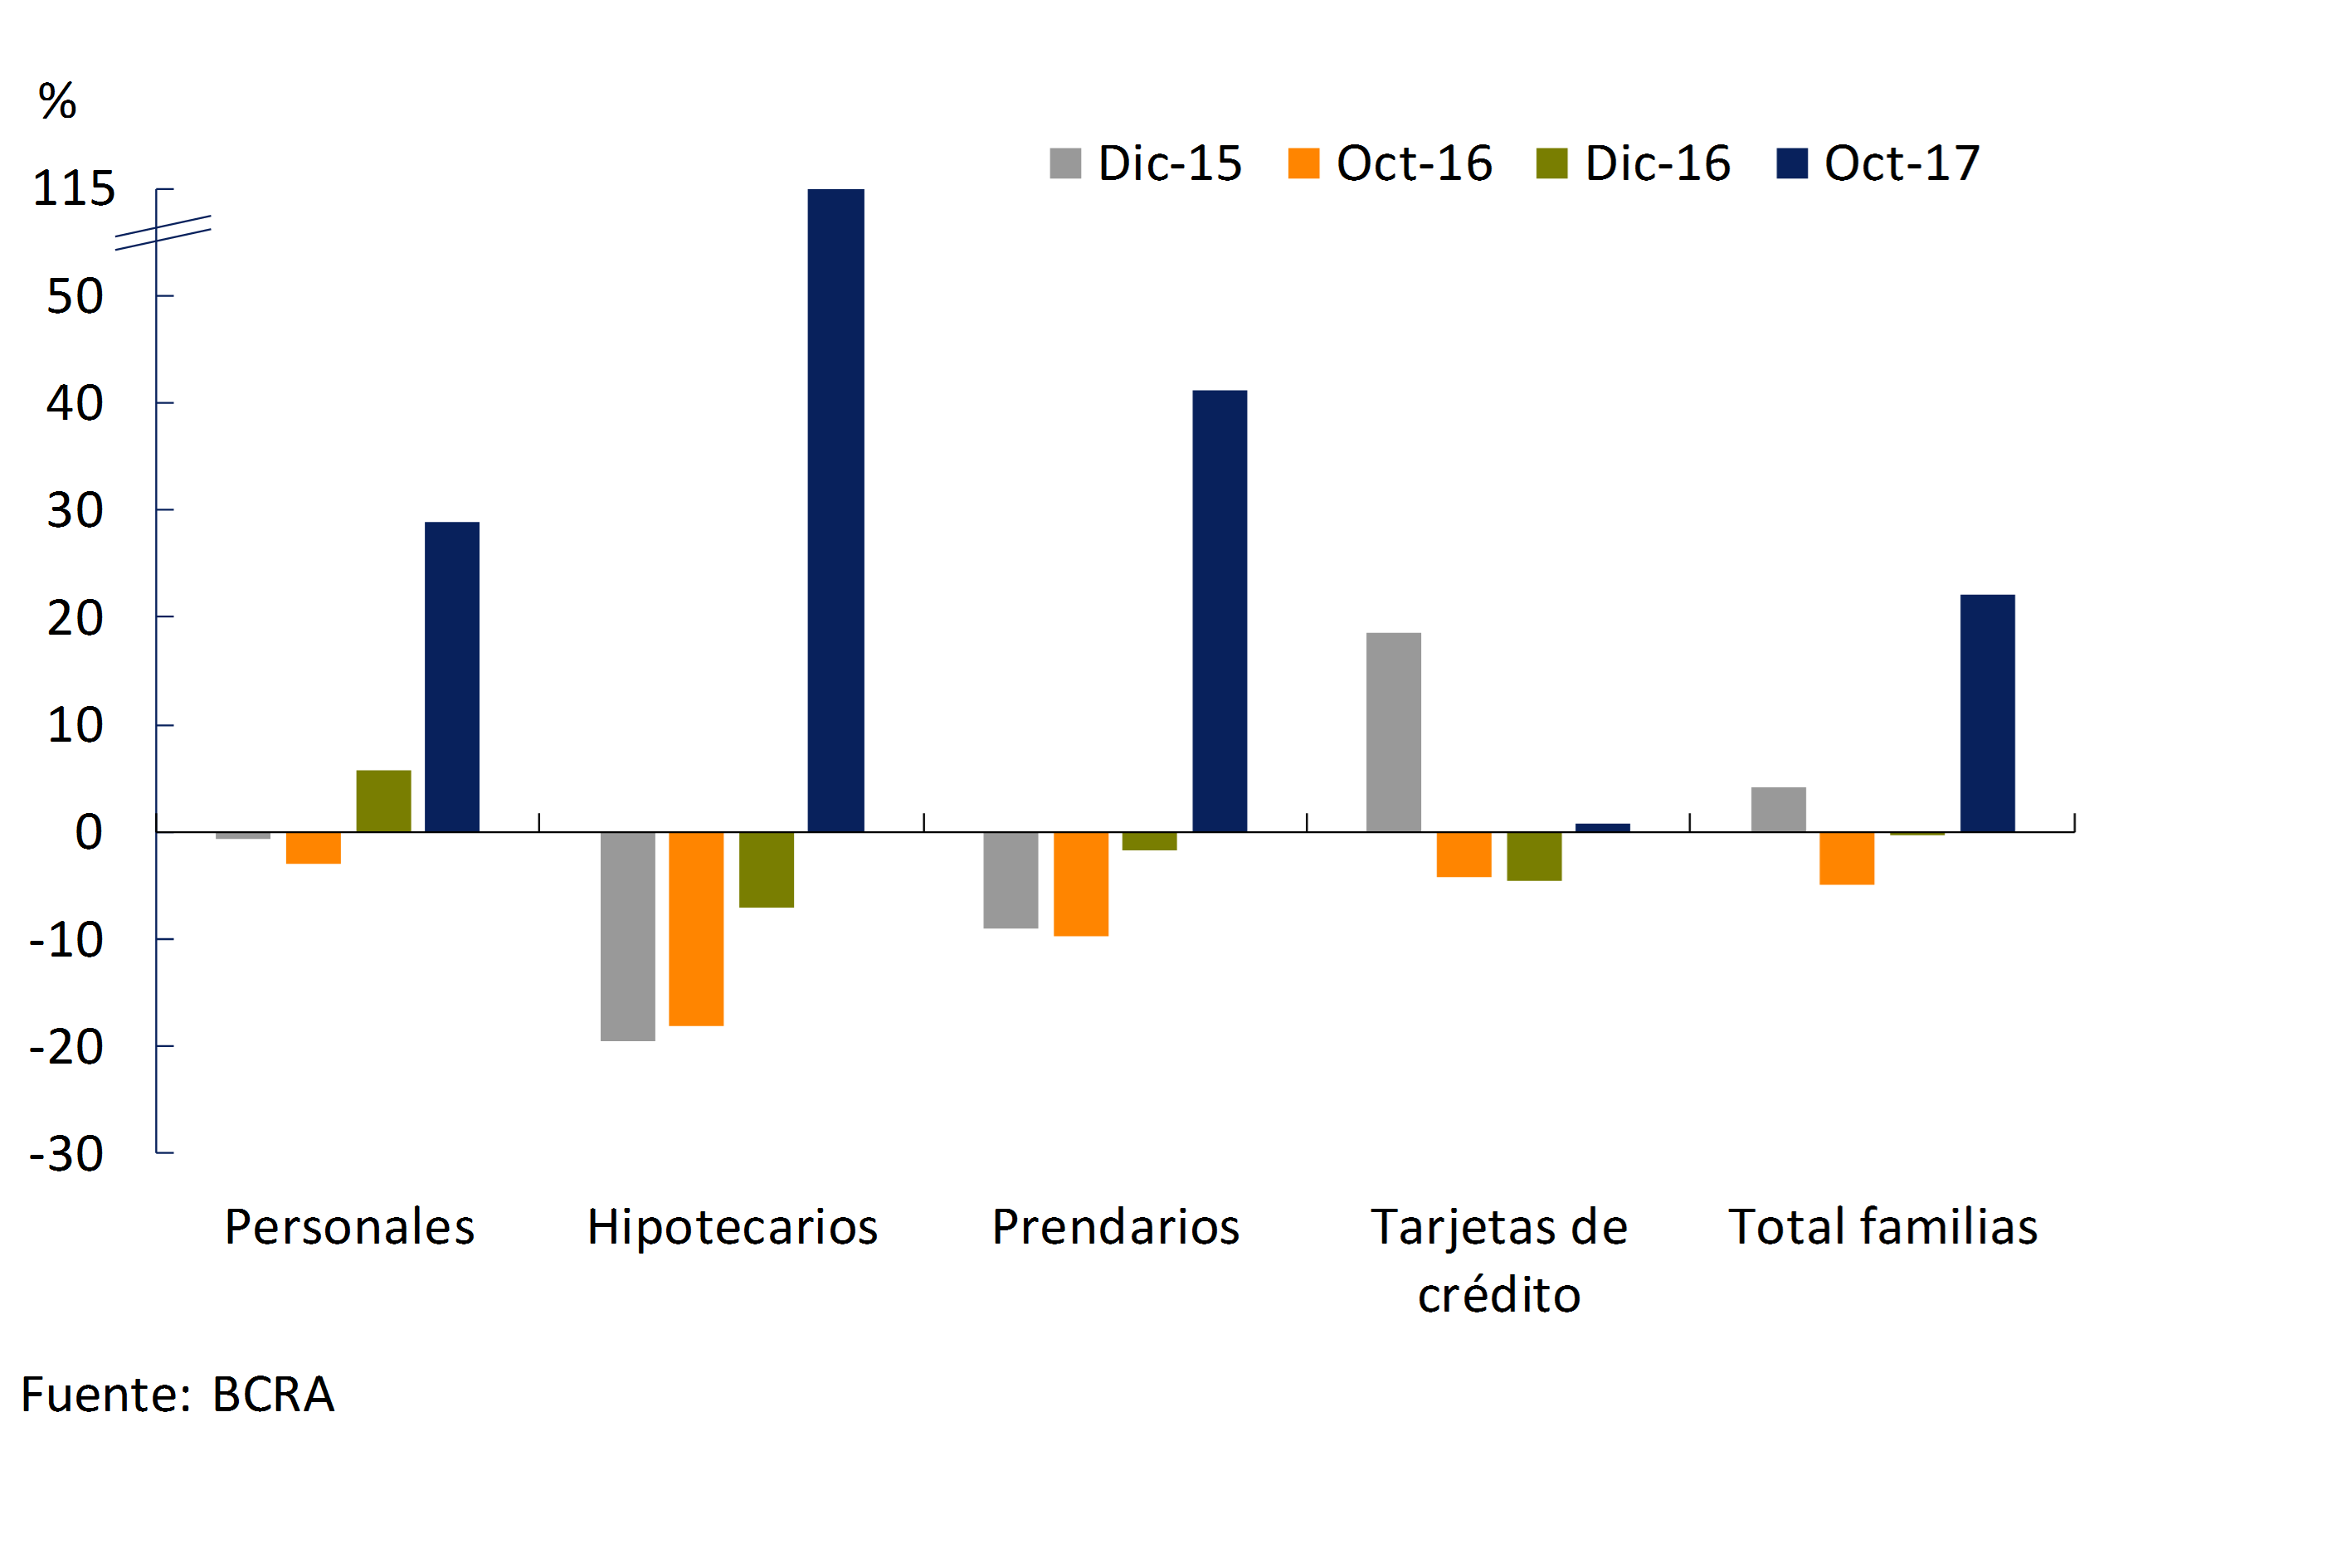
Financing to families increased 3.7% in real terms in October. In the month, mortgage loans continued to grow at a significant rate (+12.6% in real terms compared to September), in a context in which the rest of the lines also verified monthly increases. In year-on-year terms, the balance of credit to households increased by 22.2% in real terms (see Chart 14), with a higher rate of increase in mortgages (the year-on-year increase in this line explained 18.7% of the expansion of financing to households).
Figure 14 | Real Balance of Total Credit to Households – Change % year-on-year
In November, loans granted in UVA totaled $13,600 million, more than two-thirds of which correspond to mortgage lines (see Graph 15). Thus, in the cumulative between April 2016 – the time of the launch of the UVA – and the beginning of December 2017, banks have granted more than $67,70012 million of UVA loans (69% mortgage, 30% personal and 1% pledge).
Figure 15 | UVA Financing

Nominal interest rates operating in pesos with the private sector13 showed heterogeneous performances in October. The interest rates agreed on personal and pledged loans were reduced compared to September, while the rest of the lines showed a slight increase.
V. Portfolio Quality
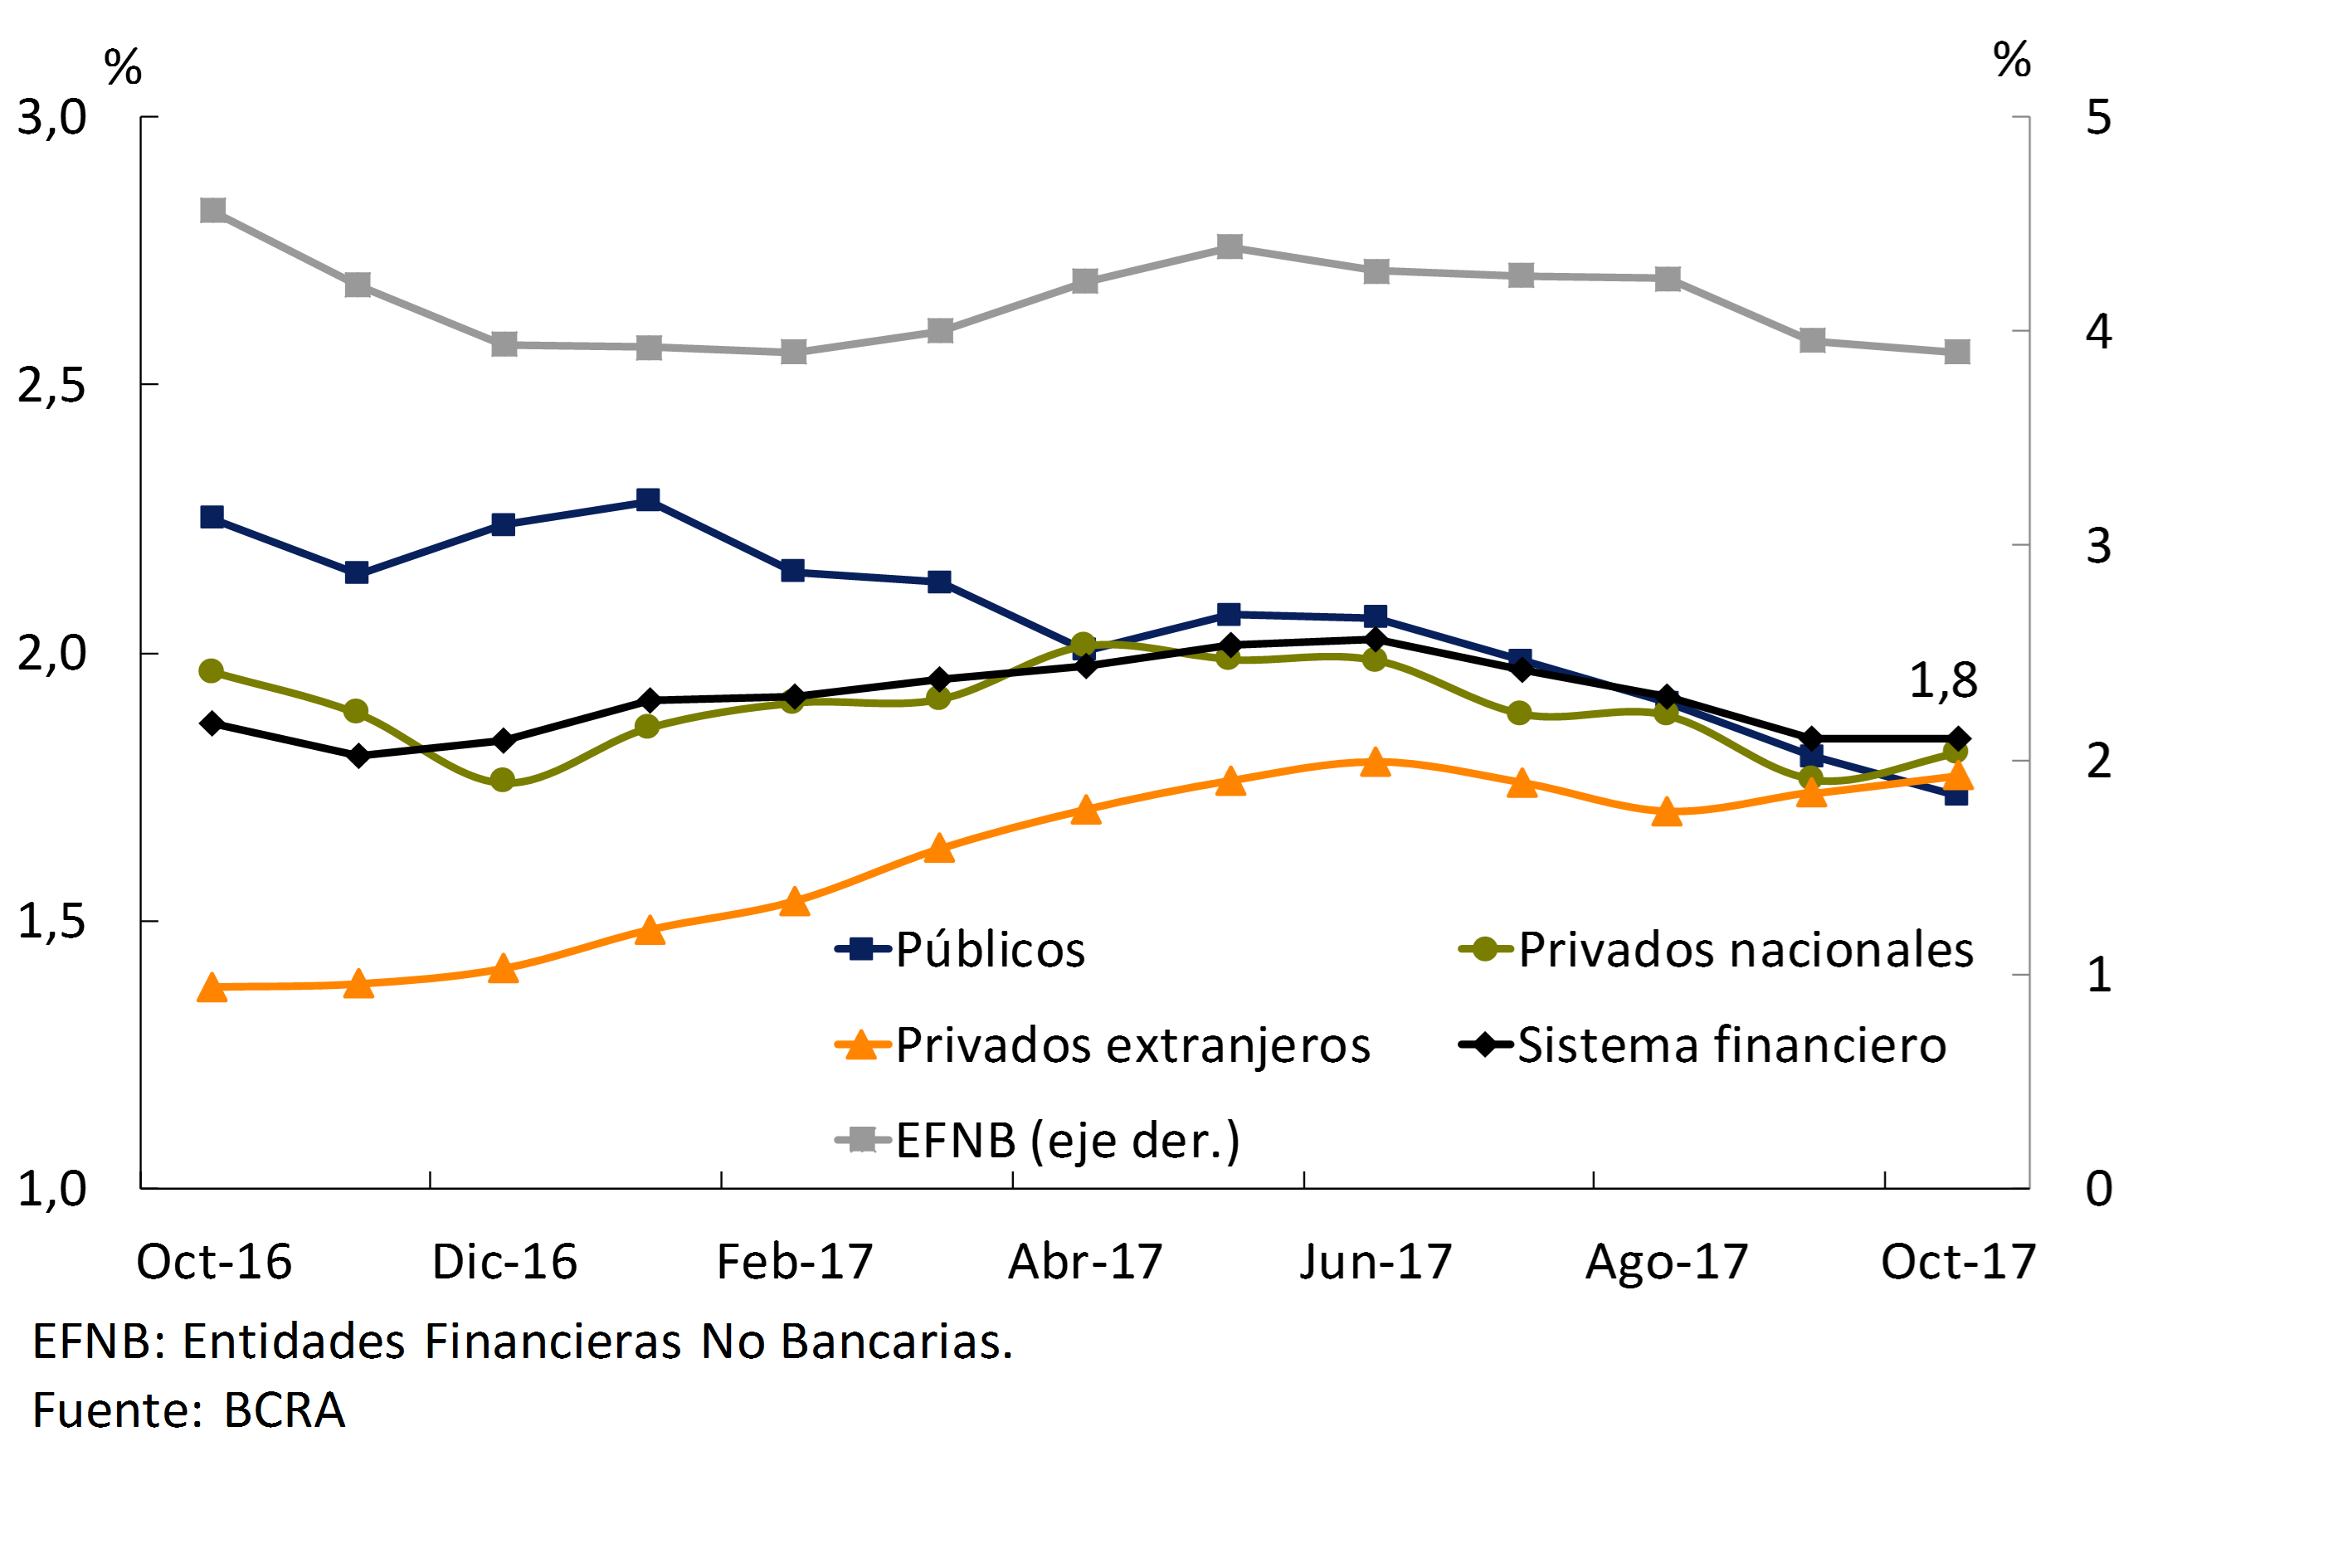
The NPL ratio for credit to the private sector remained unchanged from September, standing at 1.8% (see Chart 16). In the context of the sharp increase in credit to the private sector, the irregularity indicator fell slightly in the last twelve months14 mainly driven by the performance of public banks. It is worth mentioning that the low level of non-performing loans in the portfolio, together with the high forecasting and capital records, explain the high degree of resilience of the financial system in the face of different hypothetical scenarios of extreme materialization of credit risk15.
Figure 16 | Irregularity of Credit to the Private Sector – Irregular portfolio / Total financing (%)
In October, non-performing loans to households remained at around 2.9% of the sector’s total portfolio (see Chart 17). This level was slightly higher than the figure for October 2016, a behavior driven mainly by credit cards and personal loans. Meanwhile, mortgage loans reduced their levels of irregularity in the period, while pledges maintained them.
Figure 17 | Irregularity of Credit to the Private Sector – Irregular Portfolio / Financing (%)
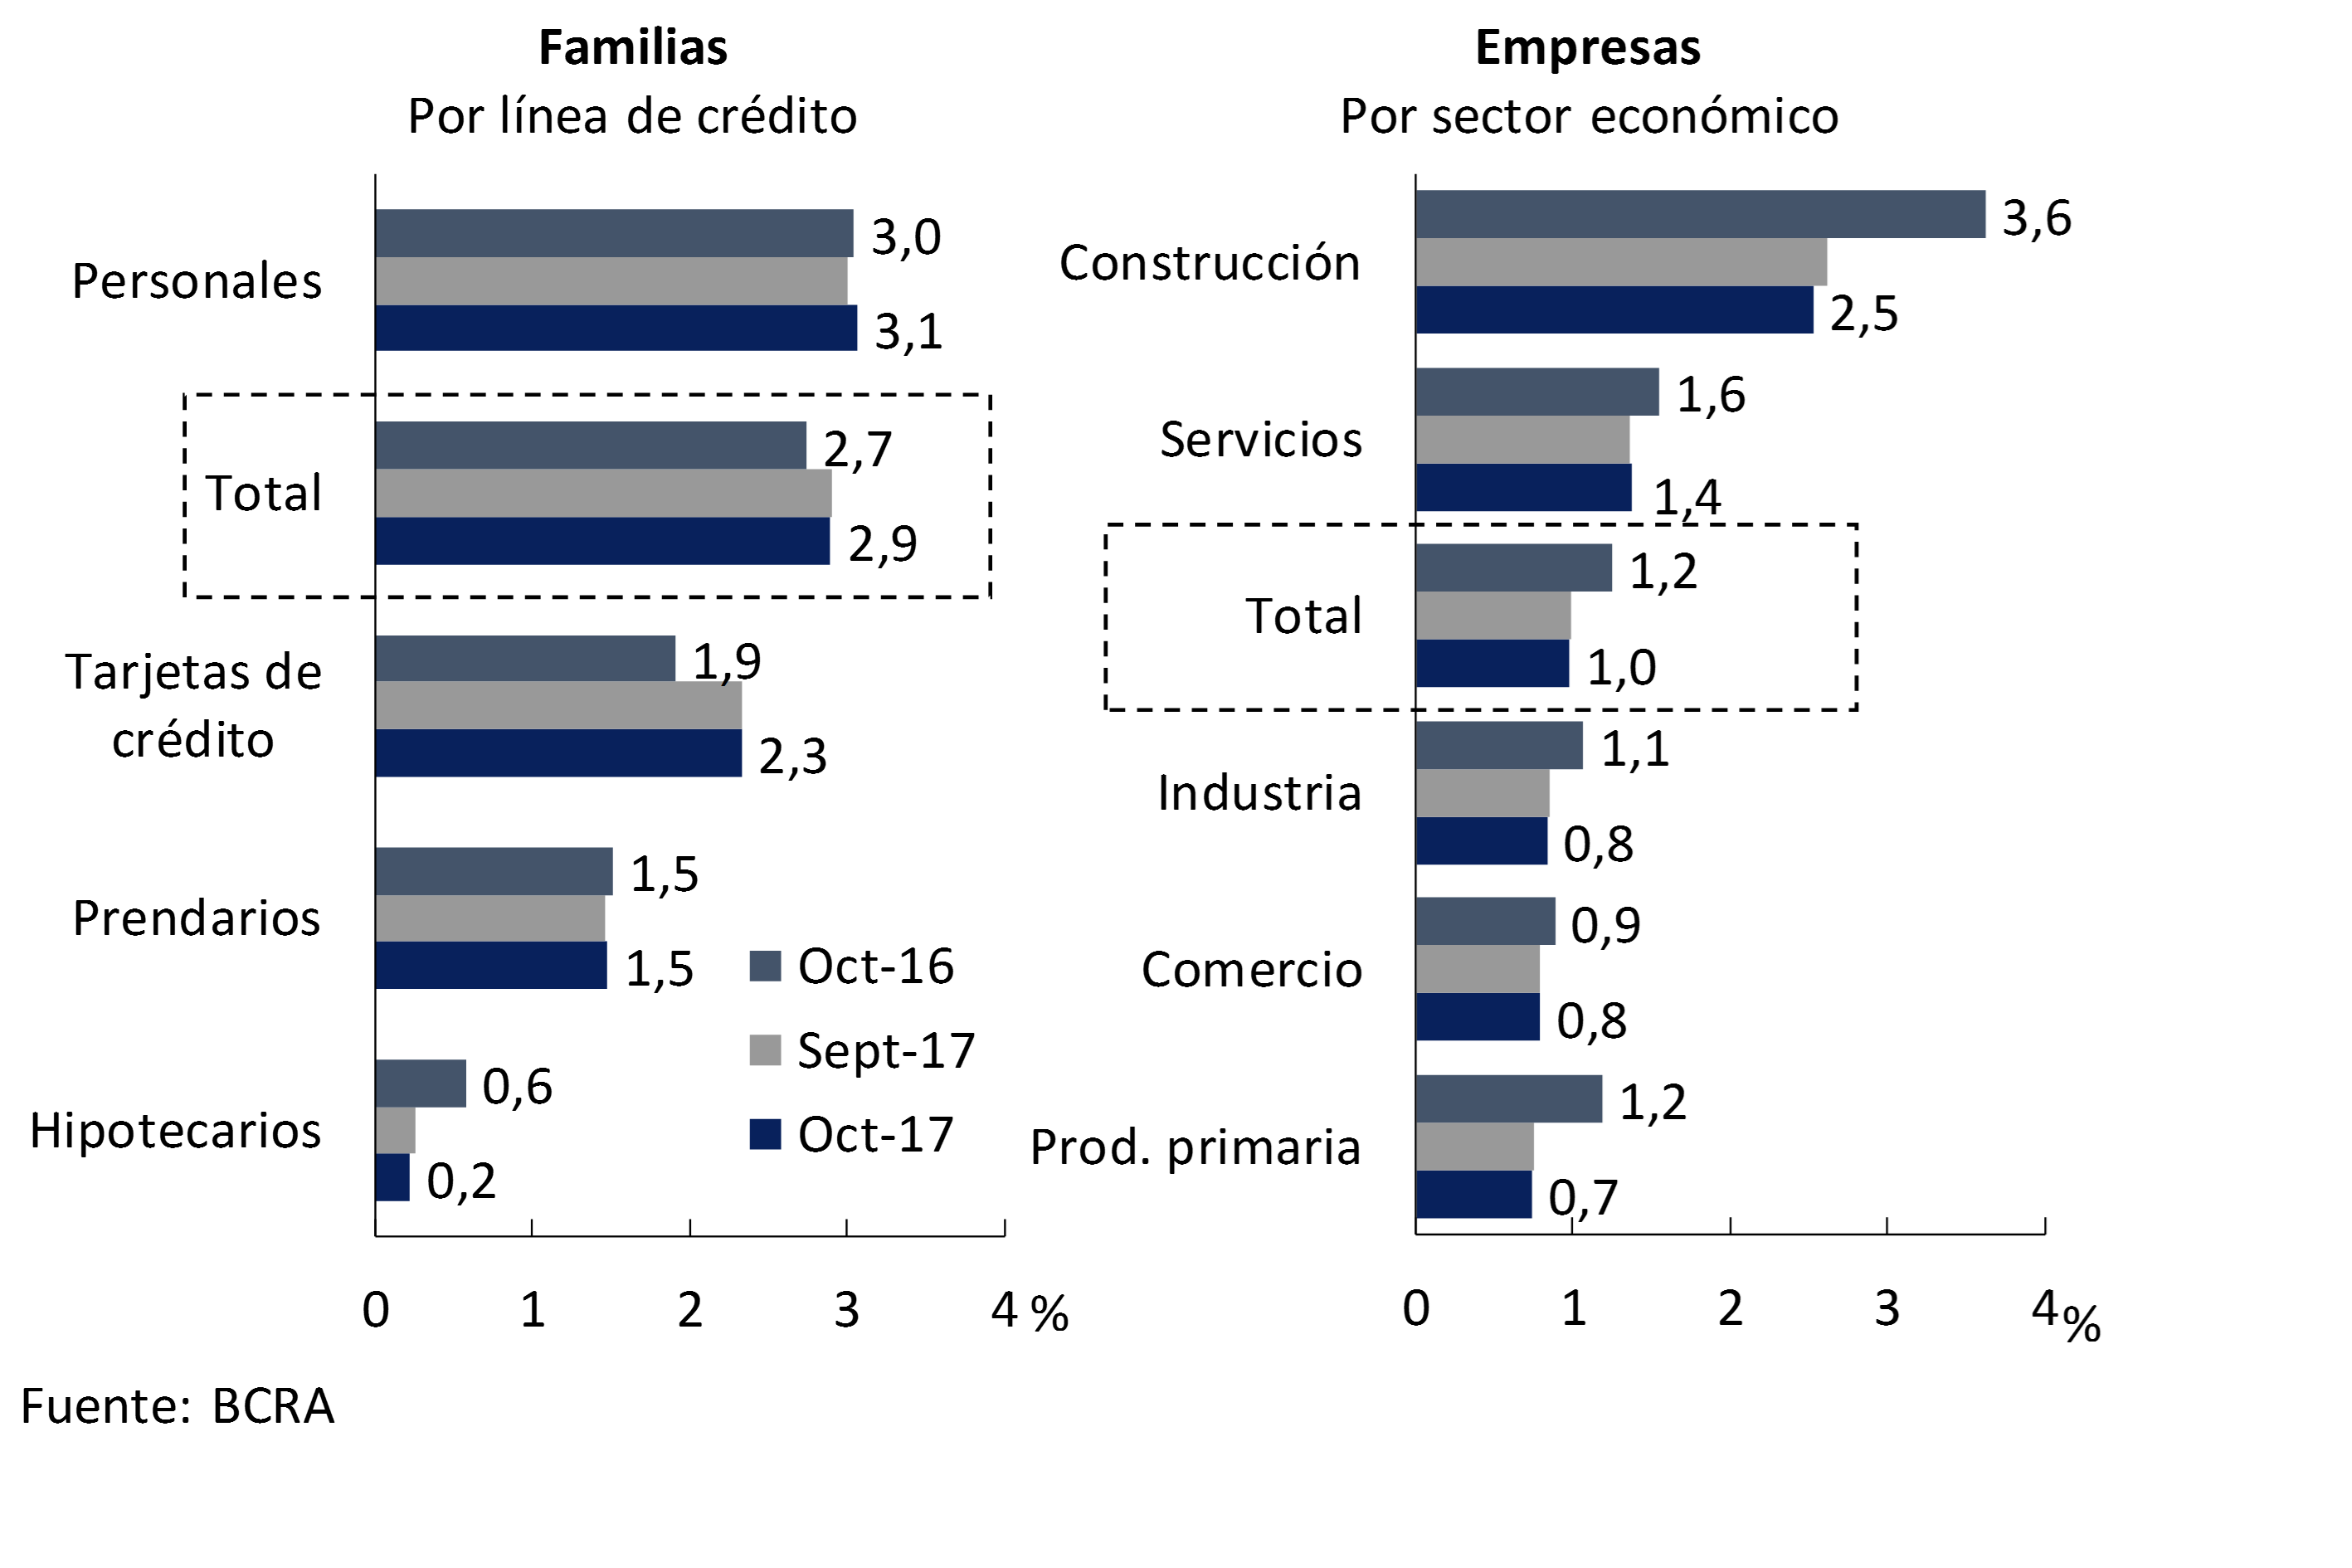
The non-performing loan ratio to companies remained stable at 1% in October (see Chart 17). In a year-on-year comparison, this indicator registered a small reduction. This performance was verified in all productive sectors, with construction and primary production standing out.
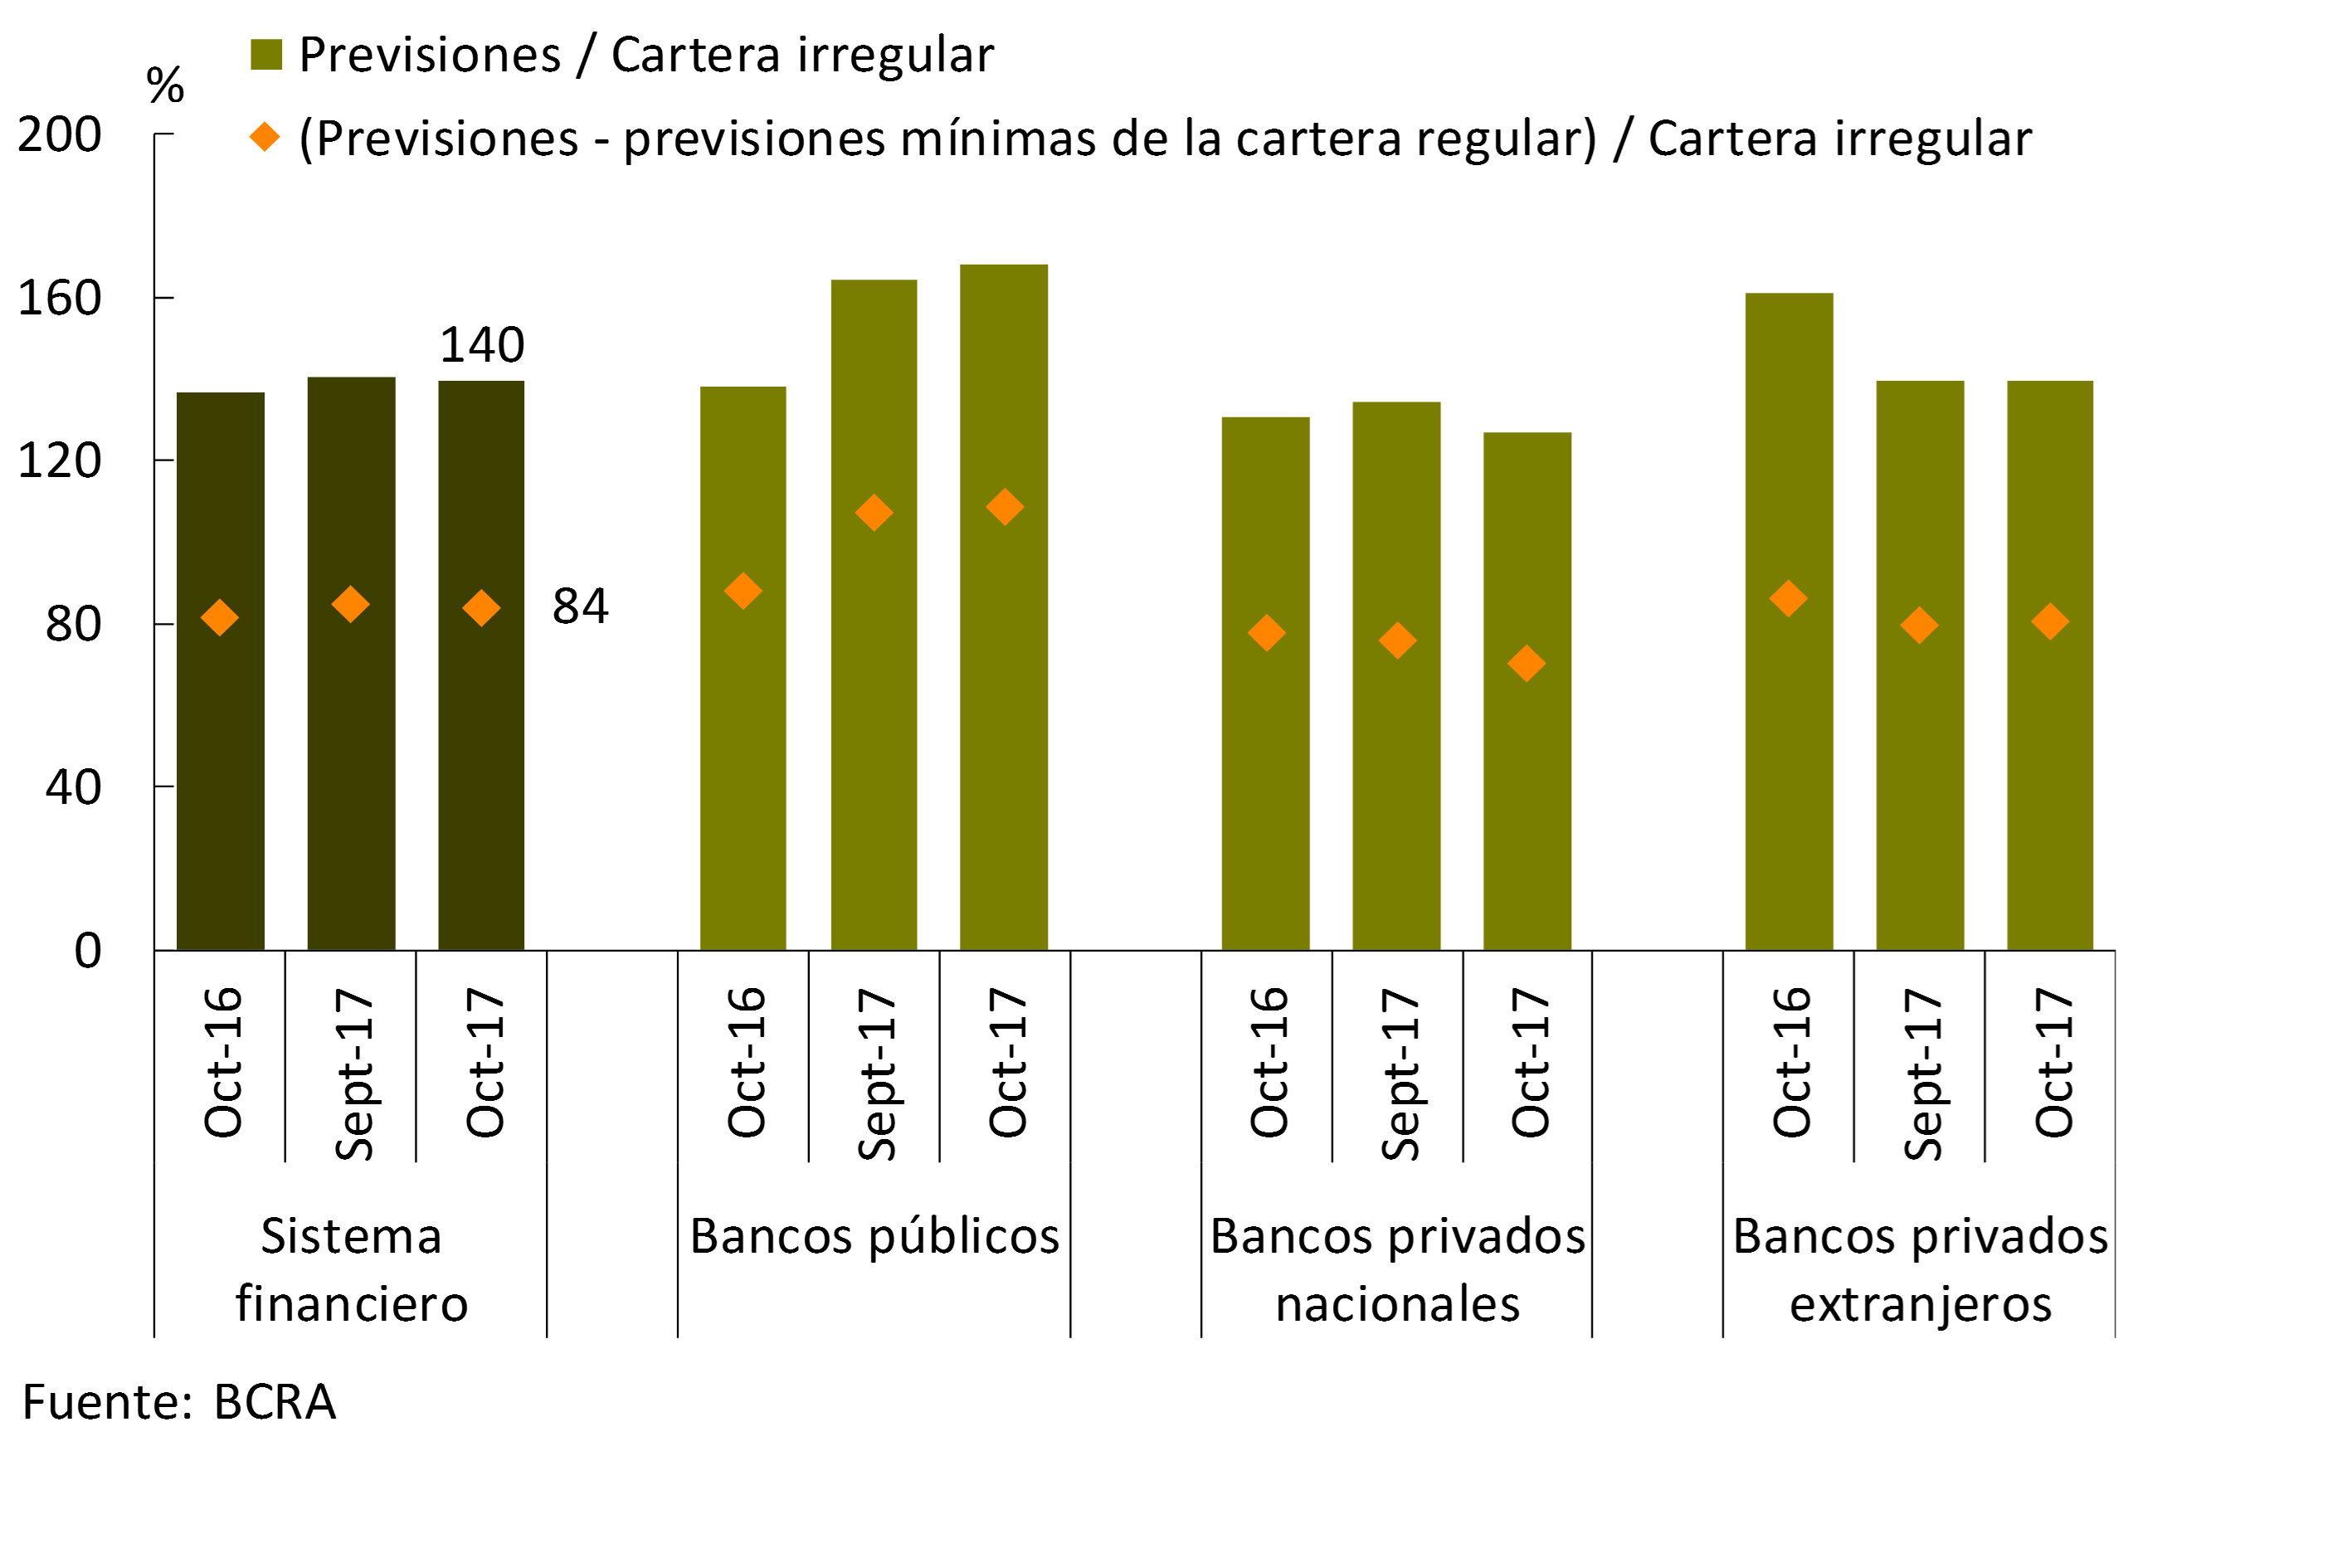
The balance of accounting forecasts of all financial institutions represented 140% of the irregular portfolio to the private sector in the period (see Chart 18). If the minimum forecasts attributable to the regular portfolio are excluded, the forecast ratio would stand at 84% of irregular financing.
Figure 18 | Forecasts and Irregular Portfolio by Group of Banks
VI. Solvency
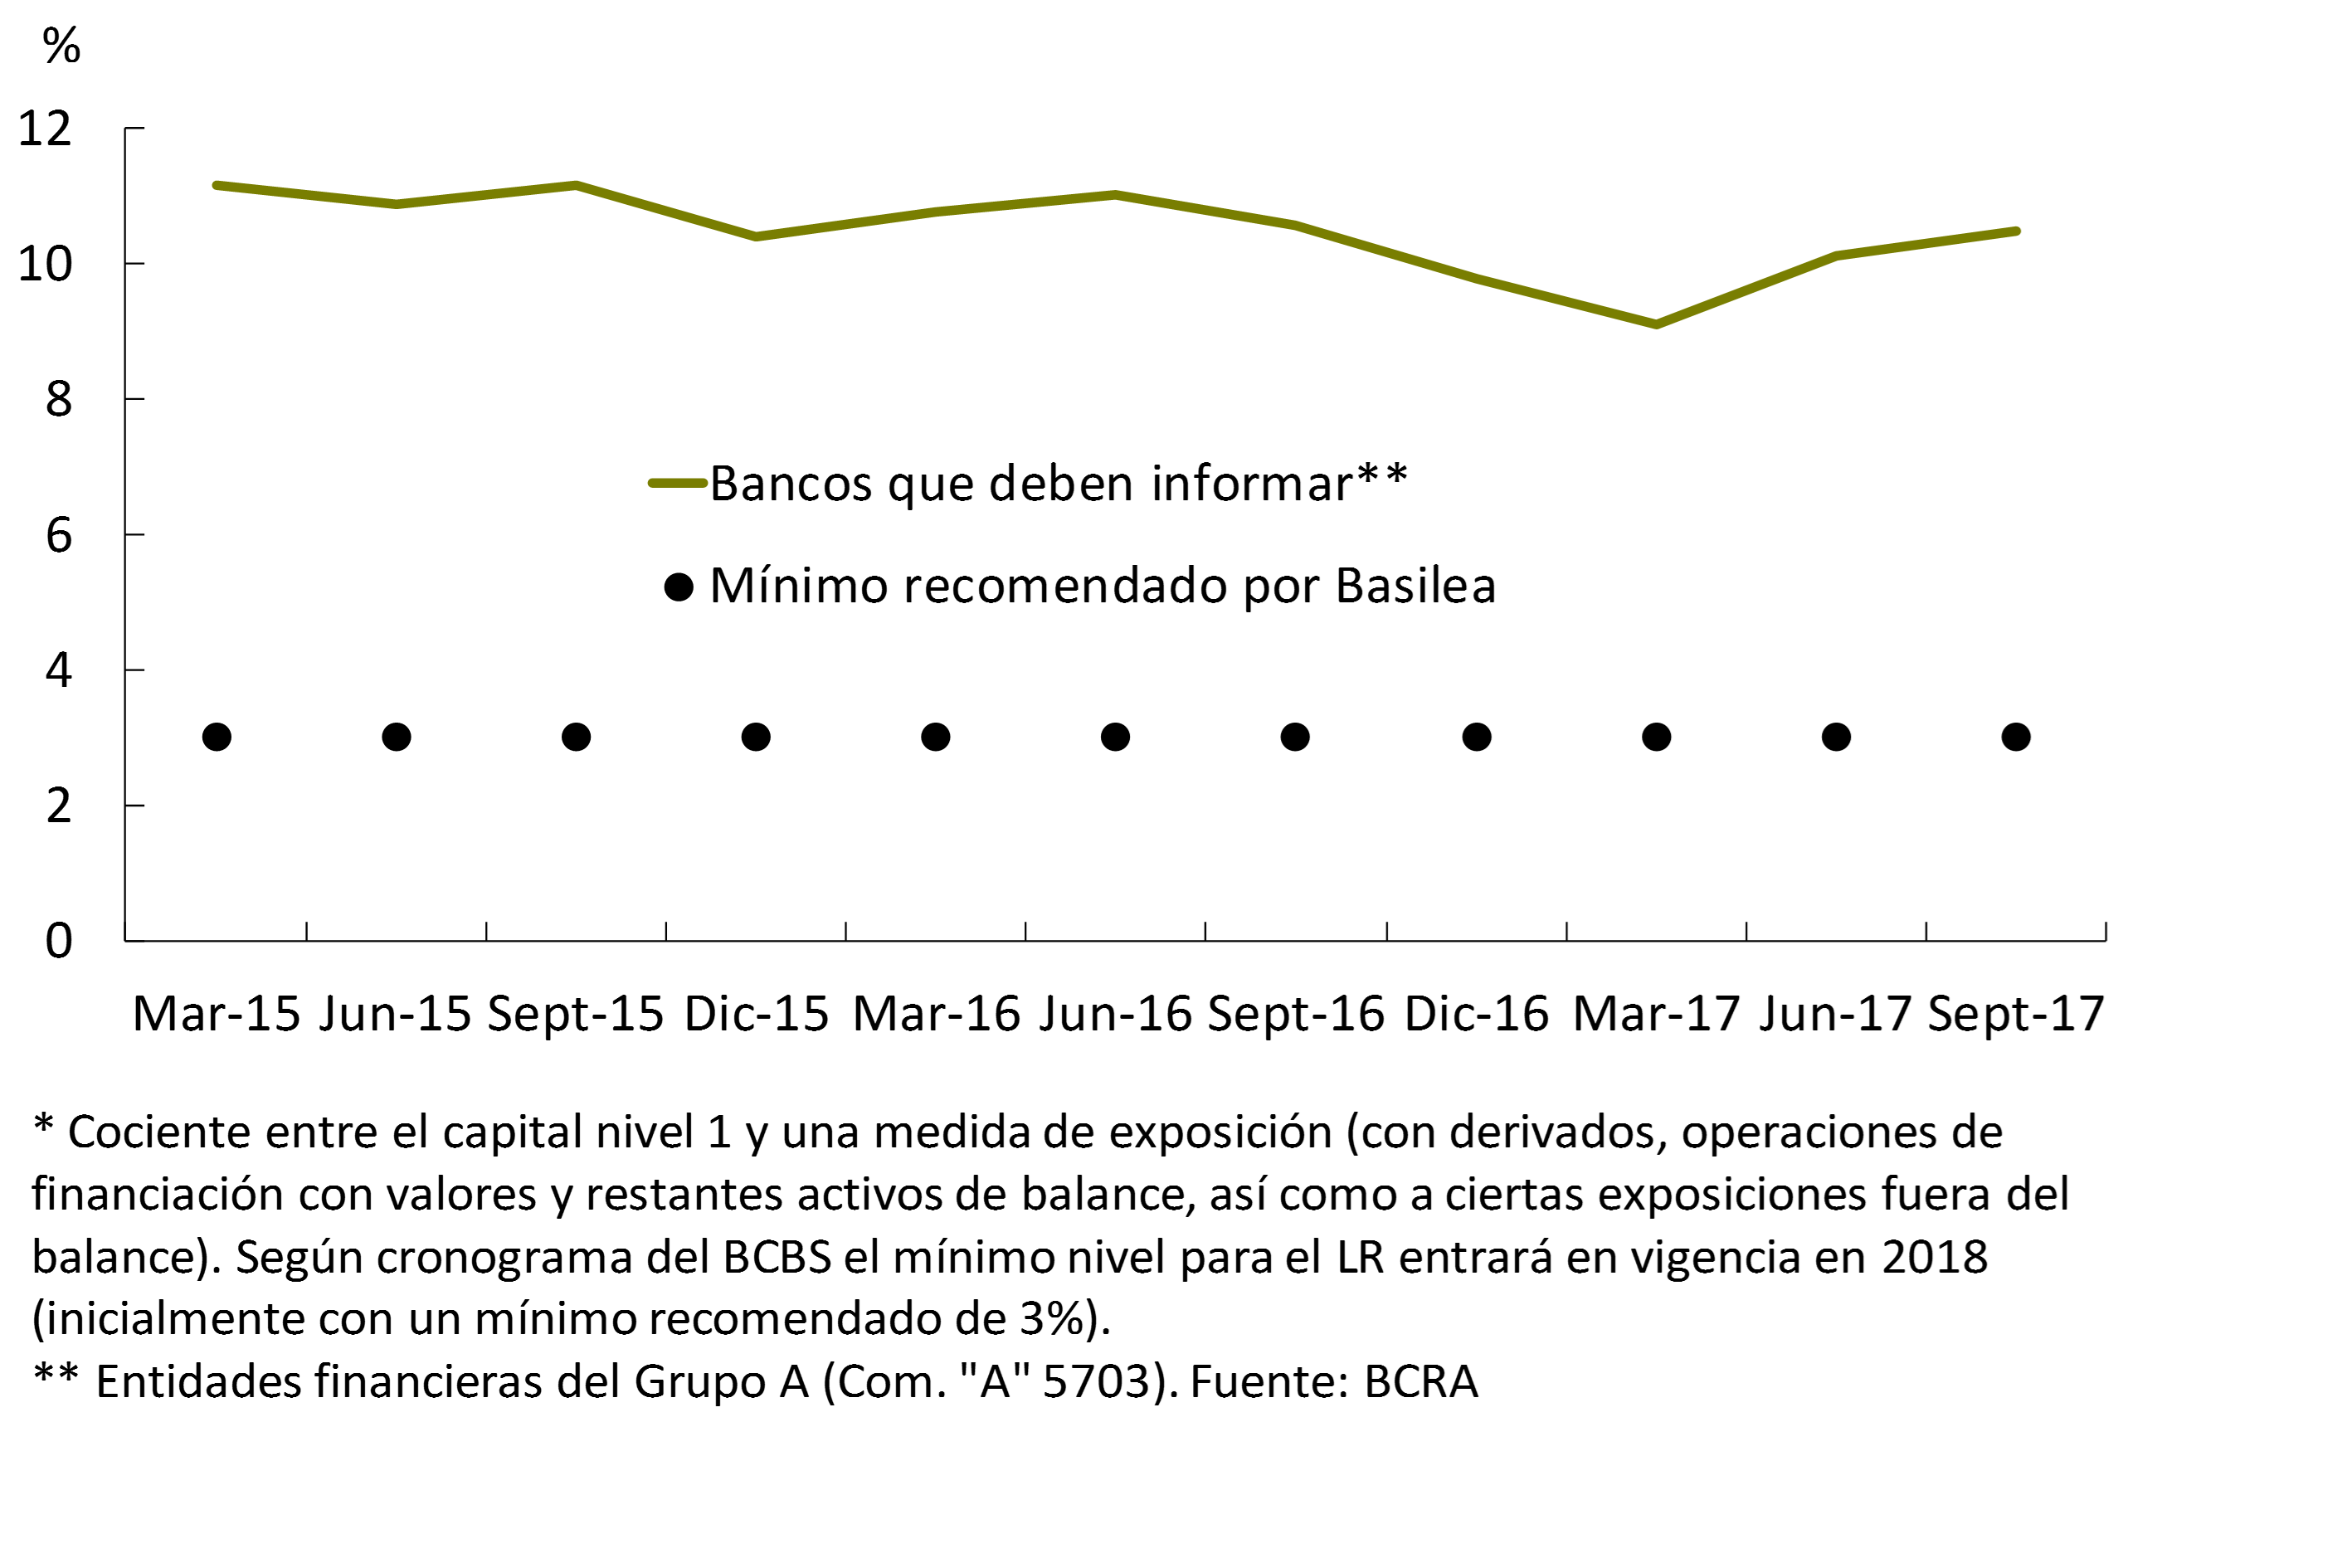
At the aggregate level, solvency ratios for the financial system remained at high levels. In October, capital integration for the banks as a whole totaled 16.2% of risk-weighted assets (RWA), similar to last month’s figure. Tier 1equity 16 accounted for 14.7% of RWAs for the month. The aggregate excess of regulatory capital was equivalent to 88% of the regulatory requirement (see Chart 19). The sector’s leverage remains moderate. The leverage ratio17 for the largest banks as a whole18 reached 10.5% as of September (latest available information), well above the initial lower level of 3% recommended by the Basel Committee (see Chart 20).
Figure 19 | Integration of Regulatory Capital
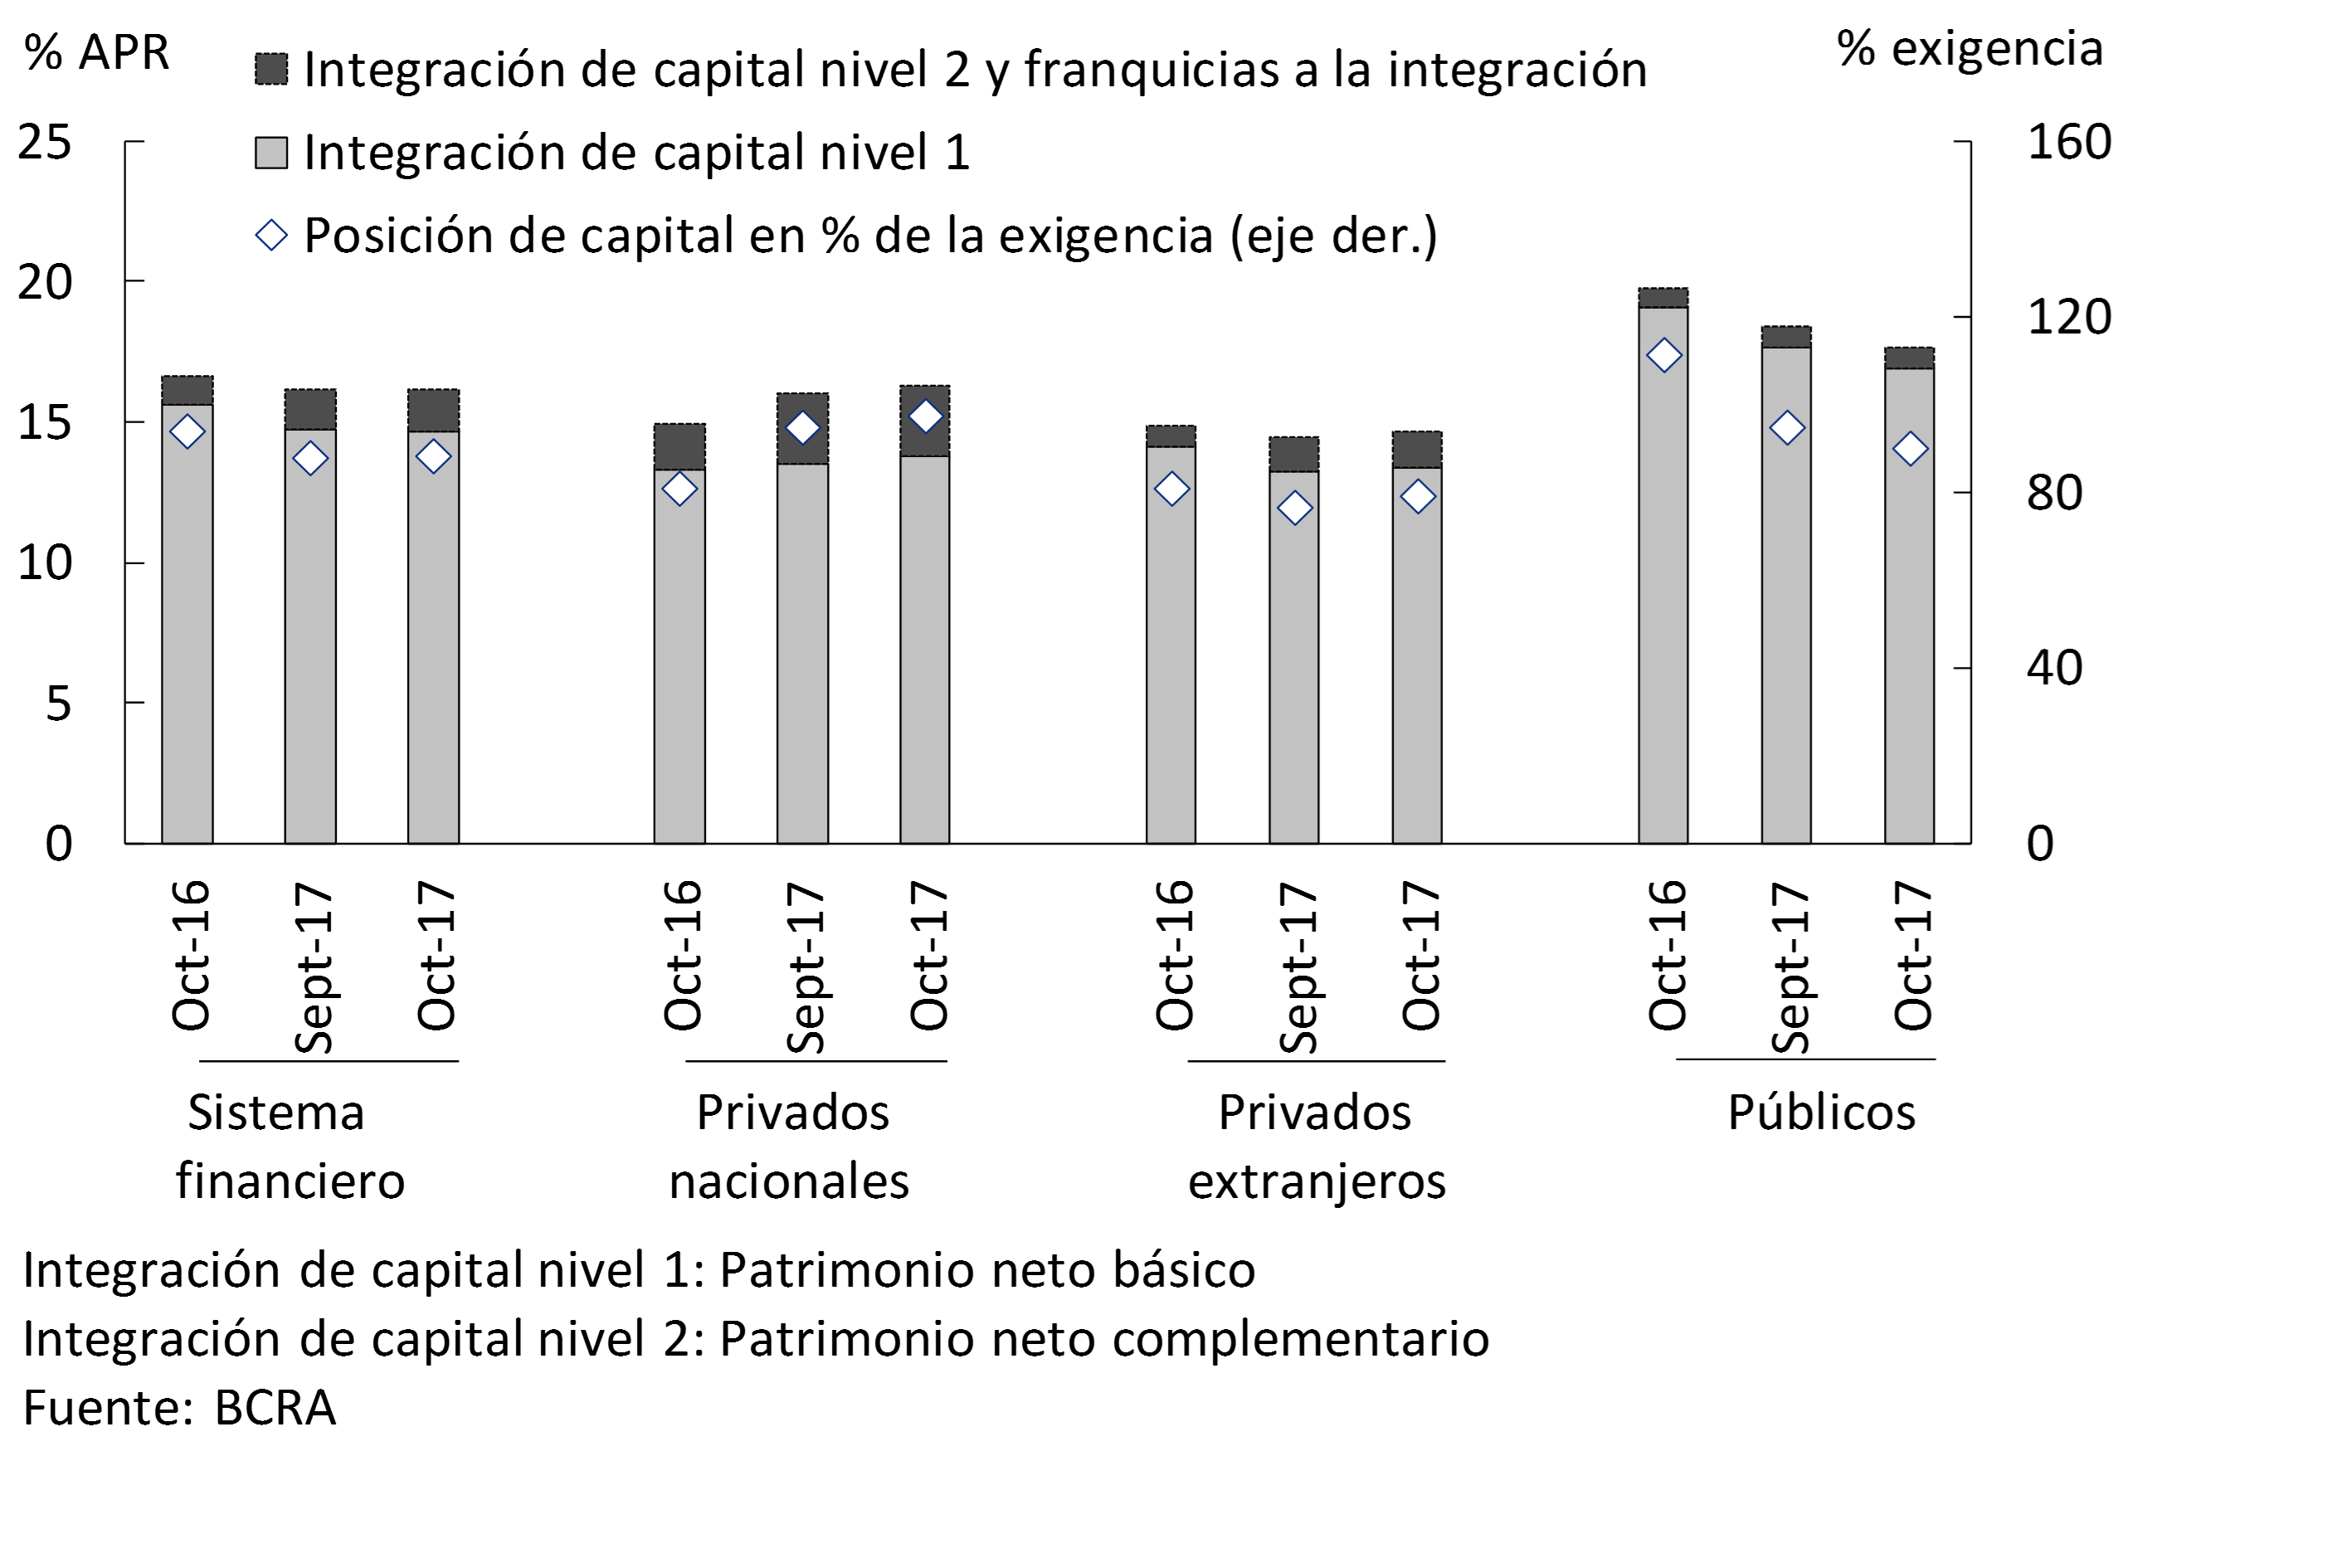
Figure 20 | Leverage Ratio*
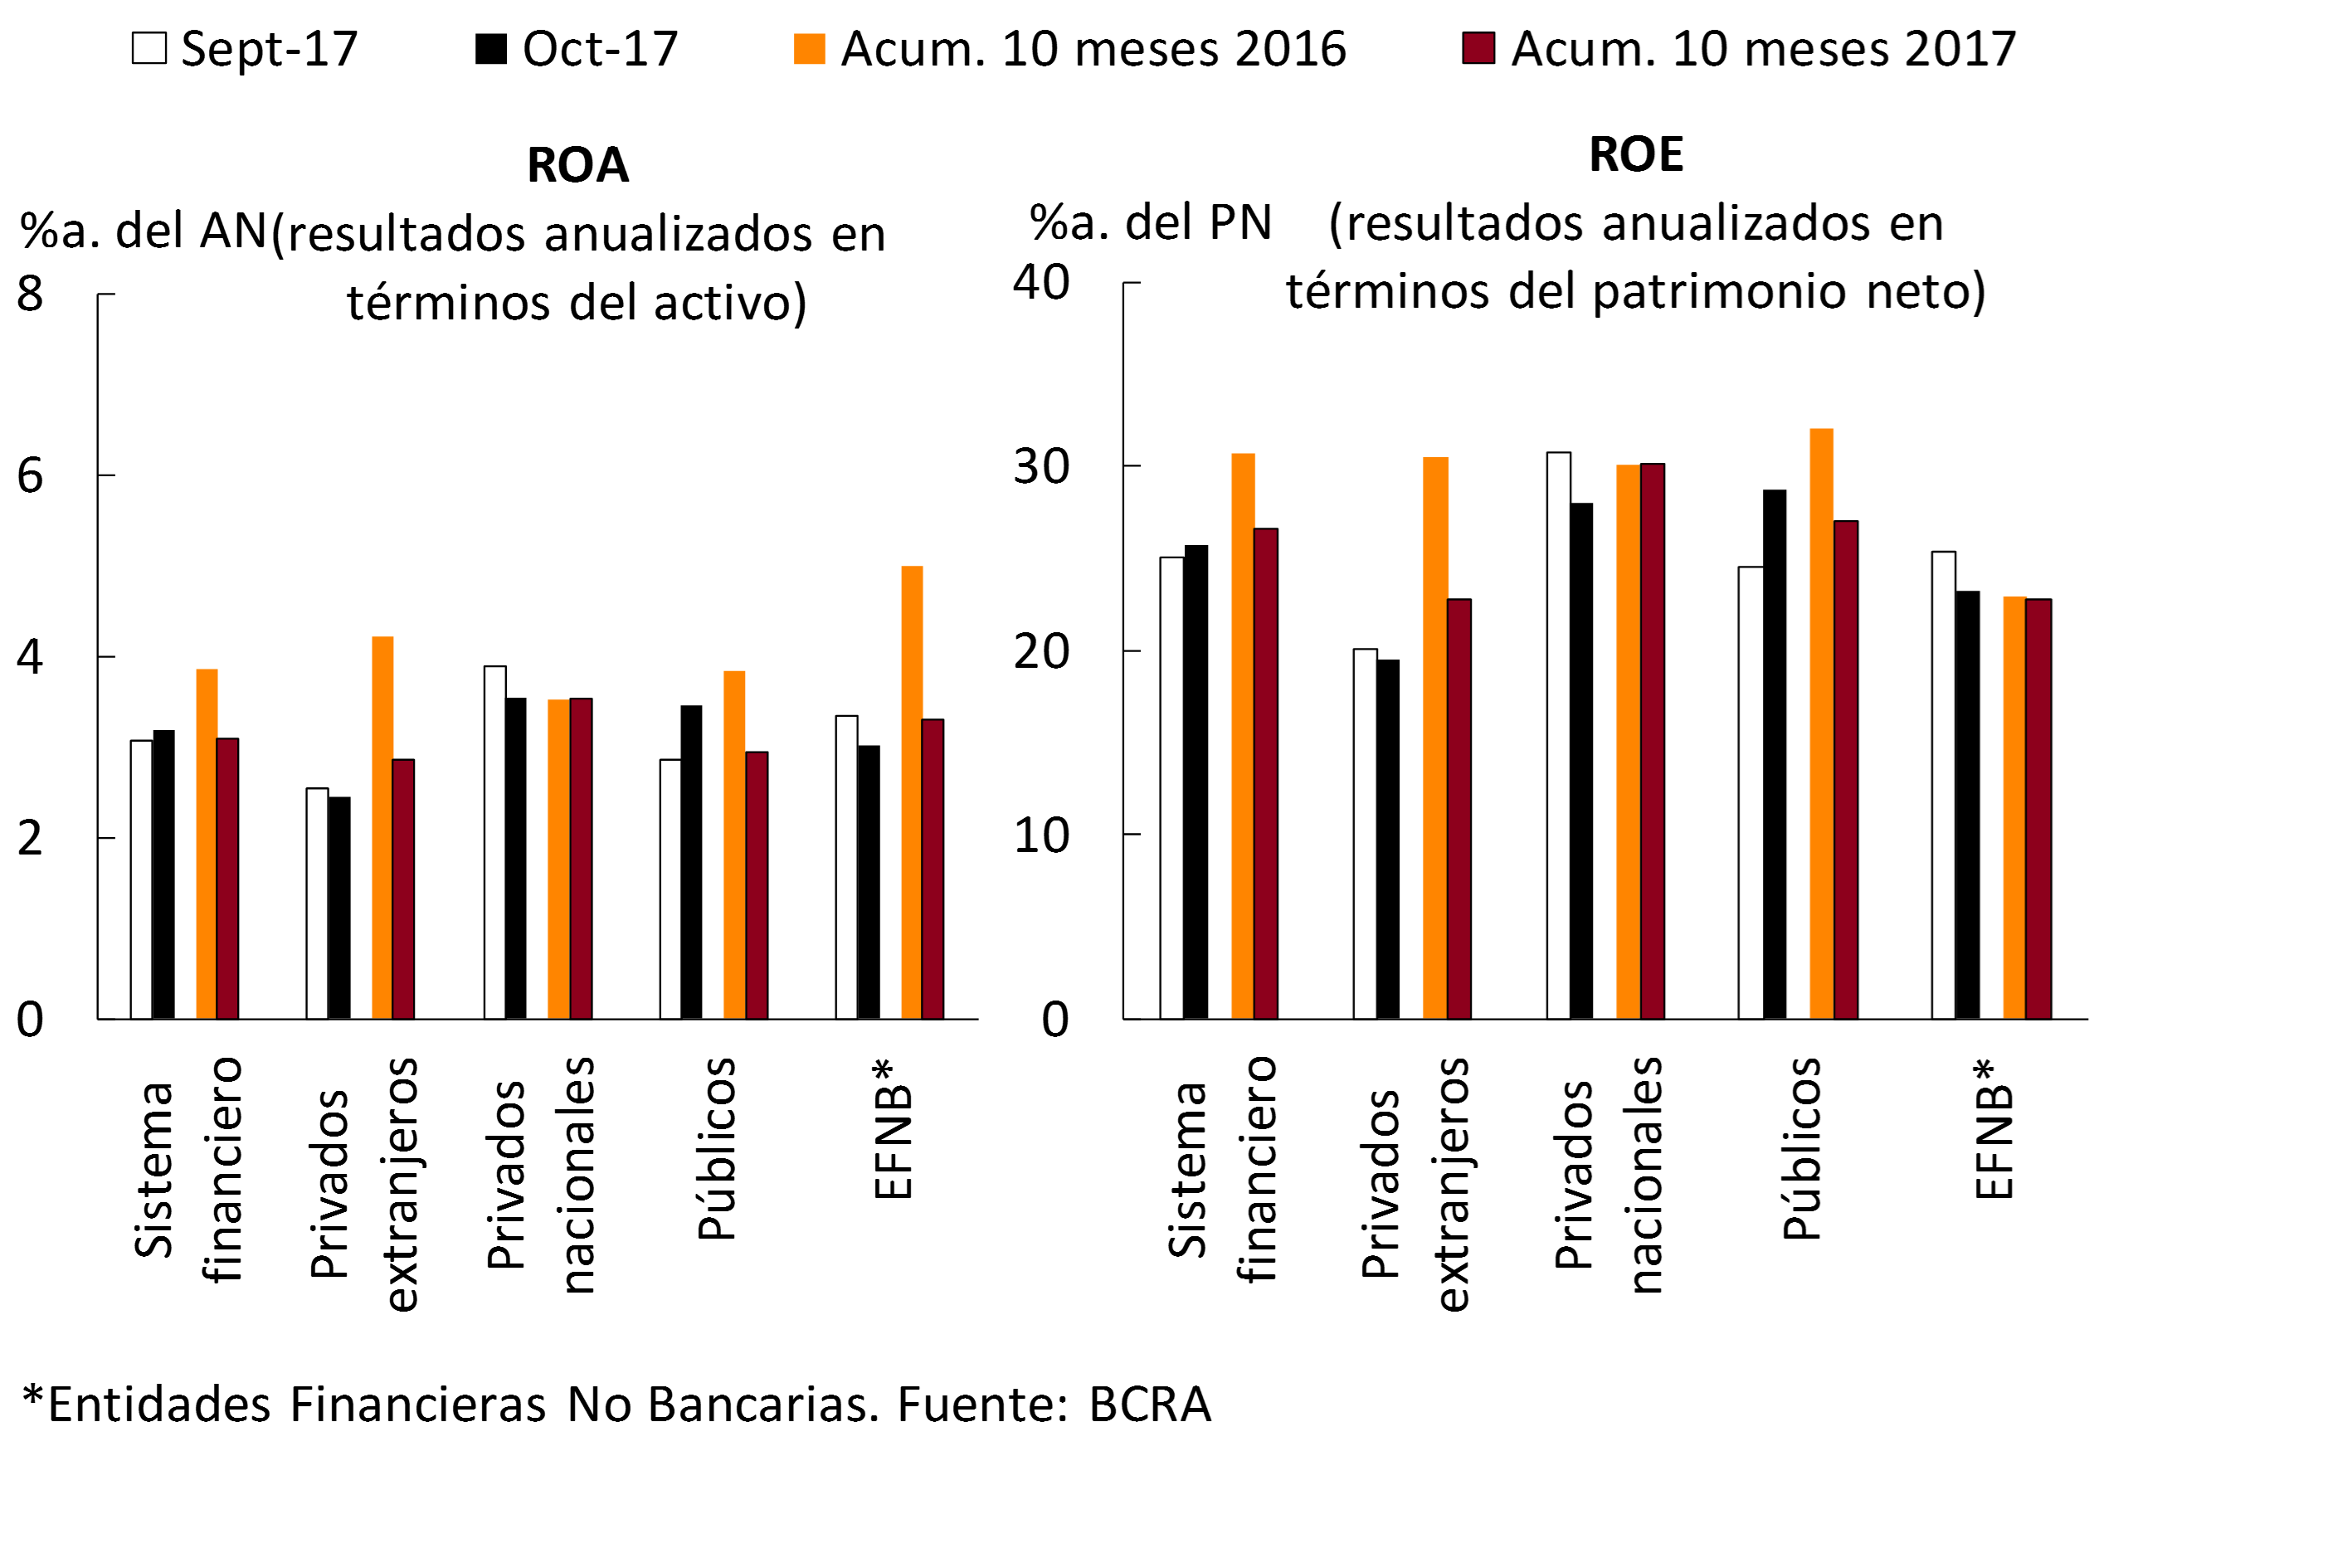
The monthly profits accrued by the financial system in October were equivalent to 3.2% of assets (25.7% of net worth), being slightly higher than those of last month, mainly due to the performance of public banks (see Chart 21). In ten months of 2017, the aggregate financial system increased its profits by 13.6% in nominal terms compared to the same period in 2016 (accruing positive results of $71,512 million). The accumulated gains in ten months represented 3.1% of the assets of the financial system, falling 0.8 p.p. compared to the same period last year. In particular, private banks as a whole obtained gains of 3% of assets in October, slightly lower than in September (ROA for this group in the last ten months reached 3.2%, falling 0.6 p.p. in a year-on-year comparison).
Figure 21 | Profitability by Group of Financial Institutions
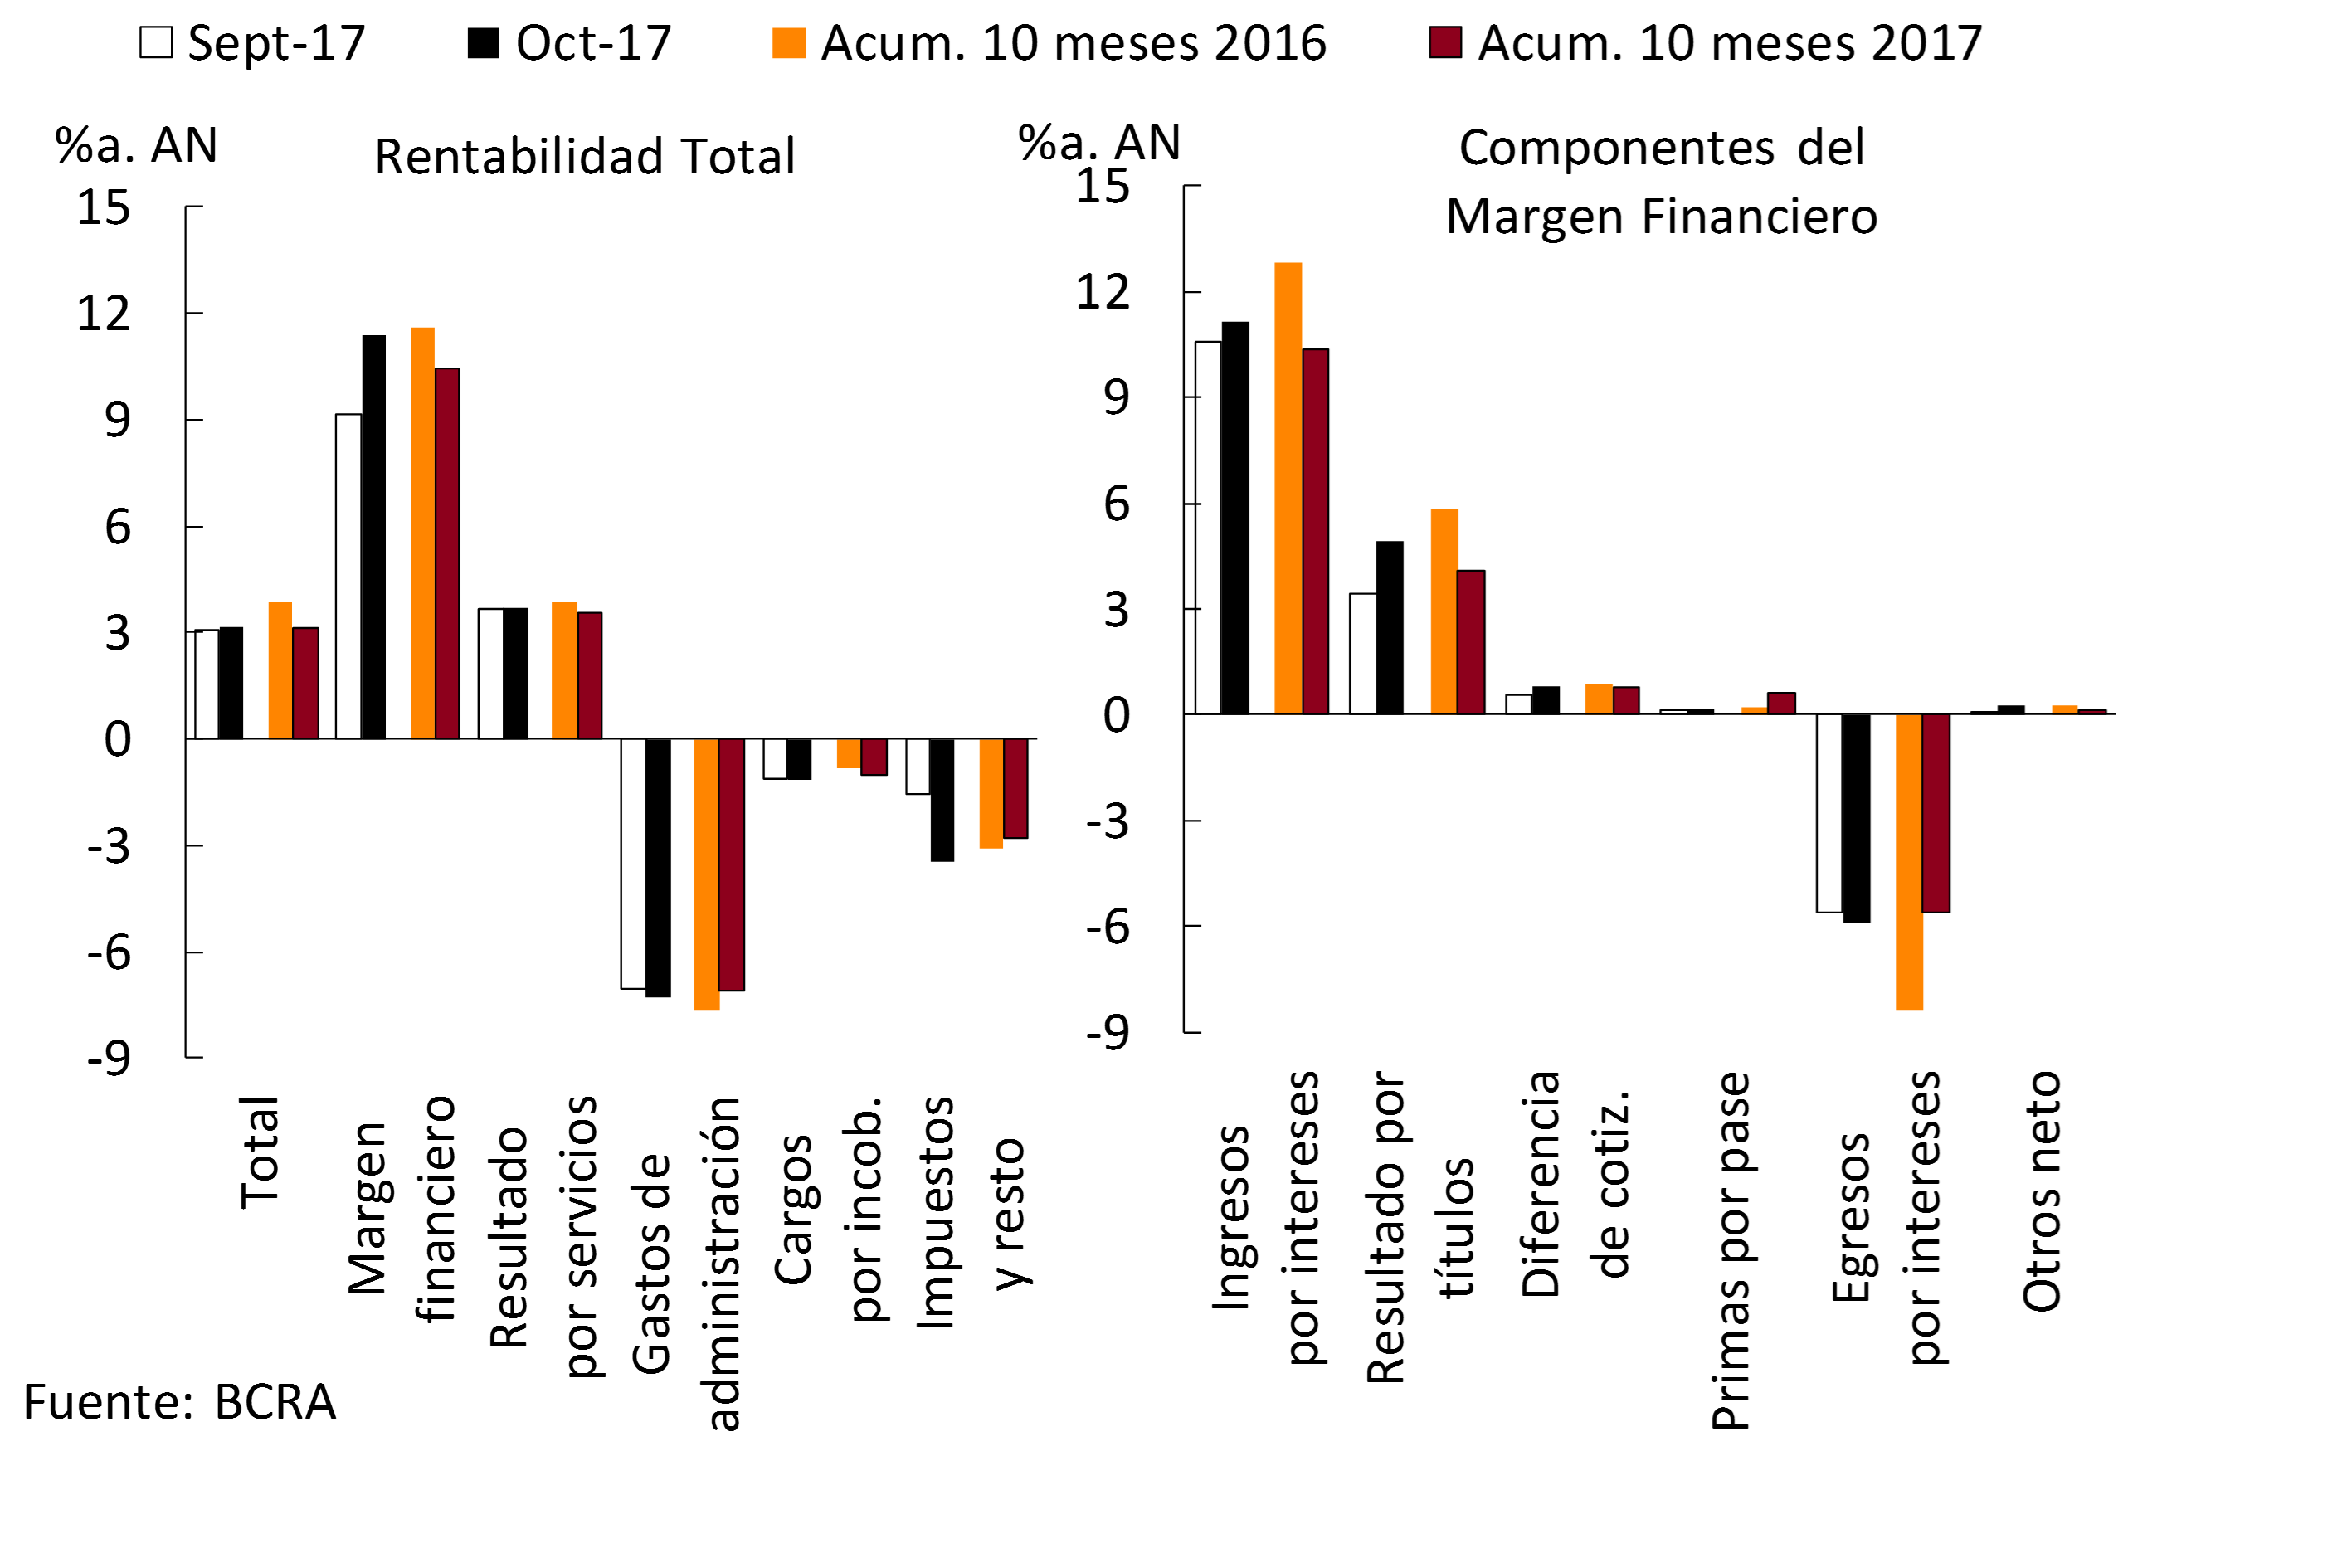
The sector’s financial margin totaled 11.4% of assets in October, being 2.2 p.p. higher than the September level, mainly due to the higher accrual of gains from securities19. In addition, interest income and earnings from the difference in quotation increased compared to September, variations that were partially offset by the increase in interest expenses. Considering the cumulative figure for ten months of 2017, the sector’s financial margin reached 10.4% of assets, 1.1 p.p. less than in the same period of 2016 (see Chart 22), as a result of the reduction in interest income and securities gains, movements tempered by the decrease in interest expenses and the increase in premiums per pass. With respect to the group of private banks, in October the financial margin stood at 11.1% of assets, falling 0.2 p.p. mainly due to lower gains from securities (in 2017, the financial margin of private banks totaled 11.3% of assets, falling 1.1 p.p. year-on-year).
Figure 22 | Components of the Profitability of the Financial System
The results for services of the financial system represented 3.7% of the assets in the month, being slightly higher than those of September. Between January and October 2017, these net income from services stood at 3.6% y/y. of assets, 0.3 p.p. lower in a year-on-year comparison.
On the side of the income statement, charges for uncollectibility reached 1.2% of assets in the month, being slightly higher than those recorded in September. In the accumulated ten months of the year, charges for uncollectibility represented 1% of assets, 0.2 p.p. more in the same period last year.
In October, administrative expenses stood at 7.3% of assets at the aggregate level, 0.2 p.p. more than in the previous month. In 2017, the administrative expenses of the financial system were equivalent to 7.1% of assets, 0.6 p.p. lower than those corresponding to last year (see Graph 22).
The tax burdens of the financial system totaled 2% of assets in the month, similar to those of September and 1.8% of assets in the case of the accumulated period of 2017 (without significant changes in a year-on-year comparison). On the other hand, the accrual of income tax stood at 1.8% of assets in October after the reduction recorded last month20. In the accumulated ten months, the accrual of income tax totaled 1.4% of assets, 0.3 p.p. less than in the same period of 2016.
Regulations
Summary of the main regulations of the month, implemented by the BCRA, related to financial intermediation activity. The effective date of the regulation is taken as a reference.
Communication A6336 – 05/10/17
The rules on Credit Assistance to Non-Financial Credit Providers are adapted in relation to the treatment of non-compliance with their obligations, providing for more gradual sanctions and facilitating the rehabilitation of suspended providers.
Communication A6337 – 05/10/17
It is established that indirect financial assistance originating from interest rate subsidies derived from credit promotion programs – to the extent that their payment is provided for in the budget of the corresponding jurisdiction or entity of the non-financial public sector – will be considered an operation excluded from the rules on financing the non-financial public sector.
Communication A6341 – 13/10/17
The rules on savings deposits, salary and special accounts are adapted in relation to the special accounts called “Severance Fund for workers in the construction industry. The remuneration provided for this type of account is modified, establishing that the balances recorded will be expressed in UVA, admitting the possibility that the entity may apply (additionally) an interest rate freely agreed between the parties and not less than 0%. On the other hand, the rules on “Minimum cash” are modified, in relation to the minimum cash requirement that financial institutions must integrate for deposits in these accounts (7% in pesos and 6% in foreign currency). This measure will be effective as of 11/1/17 and all accounts of this type (regardless of the date on which they were opened) must comply with the new operating conditions as of 12/1/17.
Communication A6342 – 13/10/17
The figure of the Global Investment Advisory Agent (GAA) is incorporated into the rules on Complementary Services of Financial Activity and Permitted Activities .
Communication A6343 – 13/10/17
The rules on Minimum Capital of financial institutions are adapted in relation to the general provisions that establish the eligibility criteria of the ECAI (“External credit assessment institution”, ECAI). It is provided that financial institutions must report the chosen ECAI to the corresponding Management of Supervision of Financial Institutions of the SEFyC. It is established that eligible ECAI may be national or international. Only global (international) qualifications are accepted.
Communication A6344 – 20/10/17
The rules on Minimum Capital of financial institutions are modified in order to recognize the credit protection provided by multilateral development banks (MDBs).
Communication A6349 – 10/20/17
The rules on minimum cash are modified, leaving without effect the quarterly position (December – February) of minimum cash in pesos.
Communication A6350 – 10/26/17
It is provided that financial institutions that provide Internet Banking and/or Mobile Banking services to individuals must enable in the name of the BCRA a savings account in pesos, a savings account in dollars, a checking account without the use of checks or authorization to draw overdrafts and access to the functionalities of these channels. Where such entities are credit card issuers, they must provide a basic national credit card. This is for the purpose of using such products exclusively for the control by the SEFyC of compliance with the provisions related to the protection of users of financial services.
References
1 Reference is made to those measures of relevance to the financial system that were adopted since the date of publication of the previous Report on Banks.
2 Press Release of 11/22/17.
3 Press Release of 11/30/17.
5 Based on differences in balance sheets.
6 For more detail, see Chapter 3 of IEF II-17.
7 Corresponding to Group A according to Communication A5703.
8 In October, two financial trusts were issued for a total of $711 million with loans originated by banks, corresponding to sectionalizations of personal loans and credit card coupons. If the real balance sheet is corrected for securitized assets in October, the increase in total loans to the private sector would be 2.7% compared to September.
9 If the real balance sheet balance is corrected for securitized assets in the month, the real variation in the balance of credit in pesos to the private sector would amount to 3.2% in October.
10 Variation in currency of origin.
11 Information extracted from the Central Debtors (includes both national and foreign currency). Loans to residents abroad are not included. Business financing is defined here as that granted to legal persons and commercial financing granted to individuals. On the other hand, loans to families are considered to be those granted to individuals, unless they are for commercial purposes.
12 Expressed in pesos at the time of granting (CER adjustment is not included).
13 It includes a fixed and repacable interest rate.
14 The indicator that considers the balance in an irregular situation in the month (t) in terms of the total lagging balance of the month (t-12), expressed all in pesos of the same purchasing power, shows a slight increase in year-on-year terms from low levels.
15 For more details, see Chapter 3 of IEF II-17.
16 Capital Level 1. Defined as basic equity (ordinary and additional capital, net of deductible accounts). See Communication A5369.
17 Ratio between capital with the highest capacity to absorb losses (Level 1), and a broad measure of exposure (includes derivatives, securities financing transactions and other balance sheet assets, as well as certain off-balance sheet exposures).
18 Corresponding to Group A according to Communication A5703.
19 Influenced by a specific record of a public bank of magnitude.
20 Variation explained mainly by a public bank of magnitude.
Glossary
%a.: annualized percentage.
% YoY: Year-on-year percentage.
Liquid assets: availabilities (integration of “minimum cash” in current accounts at the BCRA and in special guarantee accounts and other concepts, mainly cash in banks and correspondent offices) plus the net credit balance for transfer operations of financial institutions against the BCRA using LEBAC and NOBAC.
Consolidated assets and liabilities: those arising from deducting transactions between entities in the system.
Net assets (NA): assets and liabilities are net of accounting duplications for pass-through, forward and spot transactions to be settled.
APR: Total Risk Weighted Assets.
BCBS: Basel Committee on Banking Supervision (BCBS).
Irregular portfolio: portfolio in situation 3 to 6, in accordance with the Debtor Classification regime.
Credit to the public sector: position in public securities (without LEBAC or NOBAC) + Loans to the public sector + Compensation to be received + Debt securities and certificates of participation in financial trusts (with underlying public title) + Miscellaneous credits to the public sector.
Credit to the private sector: loans to the non-financial private sector including accrued interest and CER and CVS adjustment and leasing.
Differences in exchange rates: results from the monthly update of assets and liabilities in foreign currency. The item also includes the results originated by the purchase and sale of foreign currency, which arise as a difference between the agreed price (net of the direct expenses originated by the operation) and the book value.
Miscellaneous: miscellaneous profits (including, but not limited to, gains on permanent shares, recovered loans and unaffected provisions) less miscellaneous losses (including, but not limited to, losses on permanent shareholdings, loss on sale or disposal of goods for use and amortization of business keys).
Equity exposure to counterparty risk: irregular portfolio net of provisions in terms of equity.
Administration expenses: includes remunerations, social charges, services and fees, taxes and amortizations.
IEF II-17: BCRA Financial Stability Report.
IPCBA: Consumer Price Index of the City of Buenos Aires.
CSF: Liquidity Coverage Ratio (LCR).
LEBAC and NOBAC: bills and notes issued by the BCRA.
LR: Leverage Ratio (LR).
Financial margin: income minus financial expenses. It includes interest and securities earnings, CER and CVS adjustments, exchange rate differences and other financial results.
Mill.: Million or million, as appropriate.
ON: Negotiable Obligations.
OS: Subordinated Obligations.
Other financial results: rental income from financial leases, contribution to the deposit guarantee fund, interest on availabilities, charges for loan depreciation, premiums for the sale of foreign currency and other unidentified items.
PN: Net Worth.
p.p.: percentage points.
SME: Small and Medium Enterprises.
Consolidated profit: Results from permanent holdings in local financial institutions are eliminated. Available since January 2008.
Income from securities: includes results from public securities, temporary shares, negotiable obligations, subordinated obligations, options and other credits for financial intermediation. In the case of public securities, it includes the results accrued in terms of income, differences in share price, exponential increase based on the internal rate of return (IRR) and sales, in addition to the charge for forecasts for the risk of impairment.
Interest income: interest charged minus interest paid for financial intermediation, following the accrual criterion (balance sheet information) and not what is received. It includes interest on loans and deposits of government securities and premiums for passes.
Result for services: commissions charged minus commissions paid. It includes fees related to obligations, credits, securities, guarantees granted, the rental of safe deposit boxes and foreign and exchange operations, excluding in the latter case the results from the purchase and sale of foreign currency, the latter being accounted for in the “Differences in quotation” account. Expenses include commissions paid, contributions to the ISSB, other contributions for income from services and charges accrued from the gross income tax.
ROA: Final result as a percentage of net assets. In the case of referring to accumulated results, the average of the NA for the reference months is considered in the denominator.
SWEE: Final result as a percentage of equity. In the case of referring to accumulated results, the average net worth for the reference months is considered in the denominator.
RPC: Computable Patrimonial Liability. For more details, see Ordered Text of Minimum Capitals of Financial Institutions.
TNA: Annual Nominal Rate.
US$: U.S. dollars.
UVA: Unit of Purchasing Value.
ICU: Housing Units.
Share on


