Summary
• In order to provide greater transparency to financial operations and increase the protection of users, the BCRA recently ordered that banks must highlight the Total Financial Cost (TFC) with a font 5 times larger than that used in all the documentation of the contracting of loans. In order to continue promoting the development of the sector, the deadlines that determine the situation of arrears to categorize debtors located in these areas were extended. In order to assist agricultural producers in those jurisdictions of the country declared in a state of emergency and/or agricultural disaster, the criteria that provide flexibility to categorize debtors located in these areas were extended. Finally, in order to continue promoting access to credit for MSMEs, the maximum limits of assistance that banks can channel to mutual guarantee societies (SGRs) or Public Guarantee Funds (FGCP) were made more flexible.
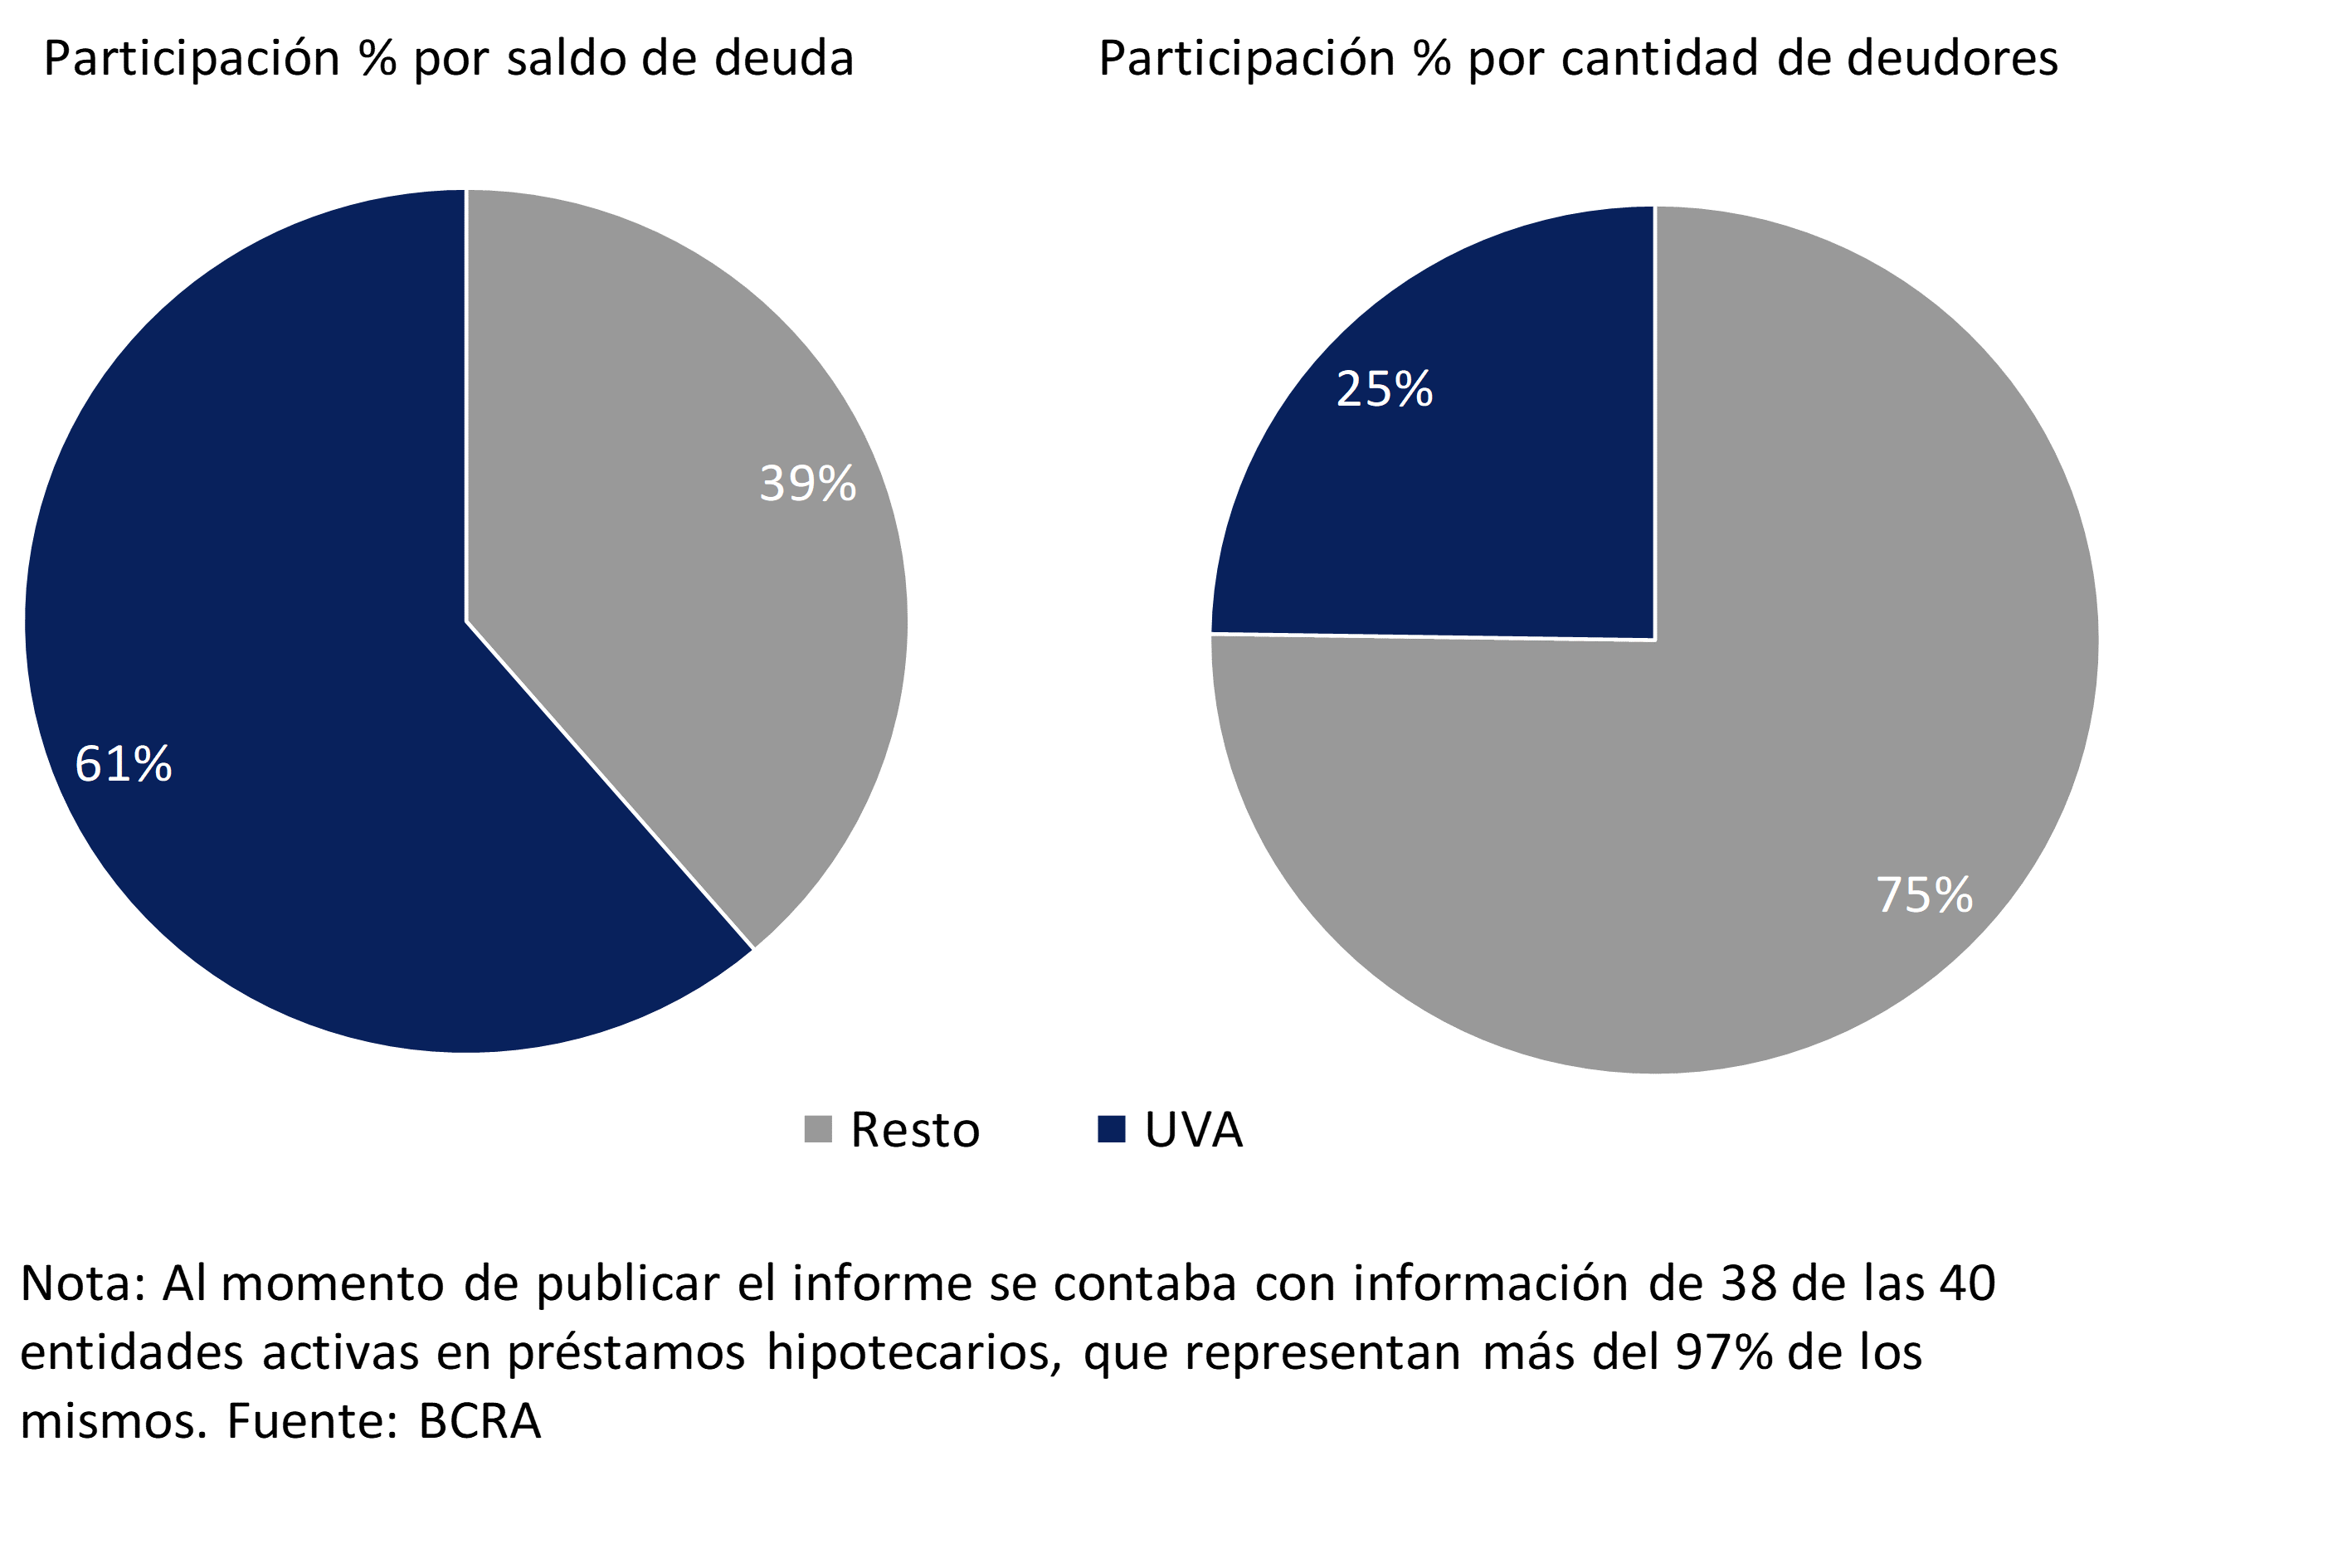
• Partly reflecting the effect of the summer recess, the month-end balance of total credit to the private sector expressed in real terms remained unchanged in February compared to January (the monthly growth of the real balance without seasonality was 1.3% in February). In the month, loans in foreign currency increased by 2.5% – in currency of origin – while financing in pesos fell by 0.4% when adjusted for inflation (nominally increased by 2%). In year-on-year terms, in February, loans to the private sector grew 23.2% adjusted for inflation, a slightly greater variation than that evidenced in January. During the period, the dynamism of mortgage loans to the private sector continued. In particular, it was observed that 61% of the total balance of mortgage credit to families corresponded to financing denominated in UVA.
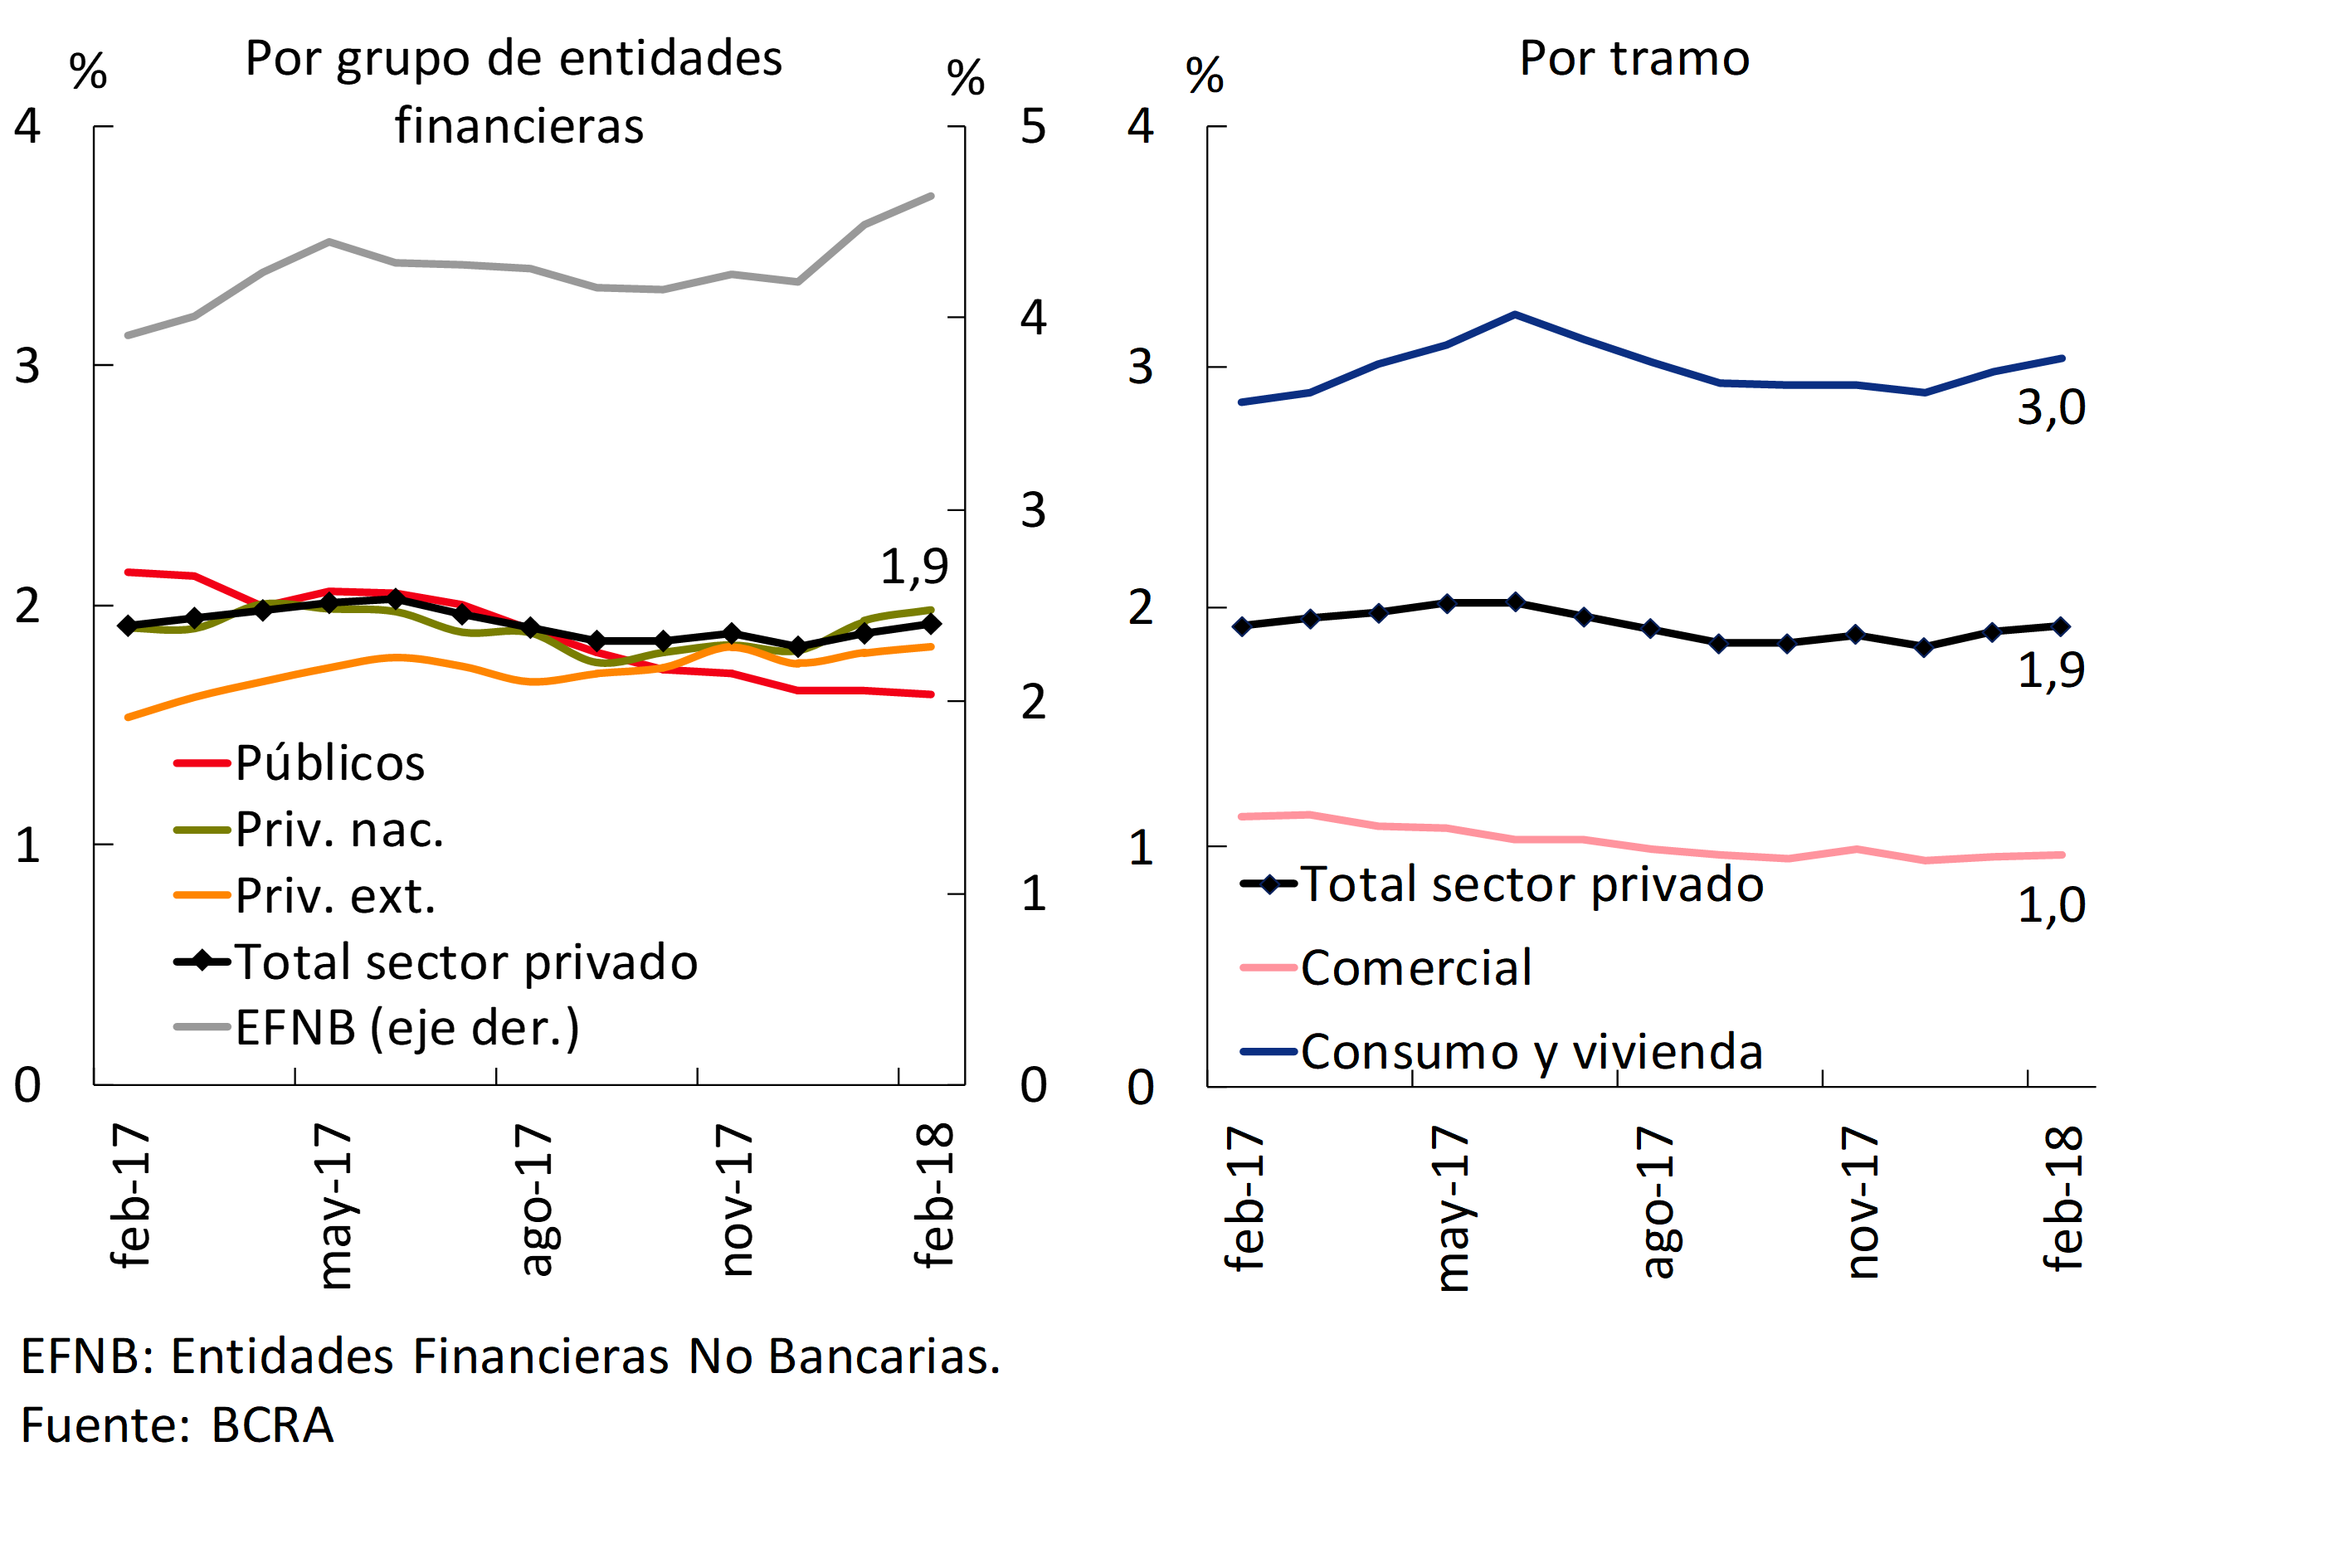
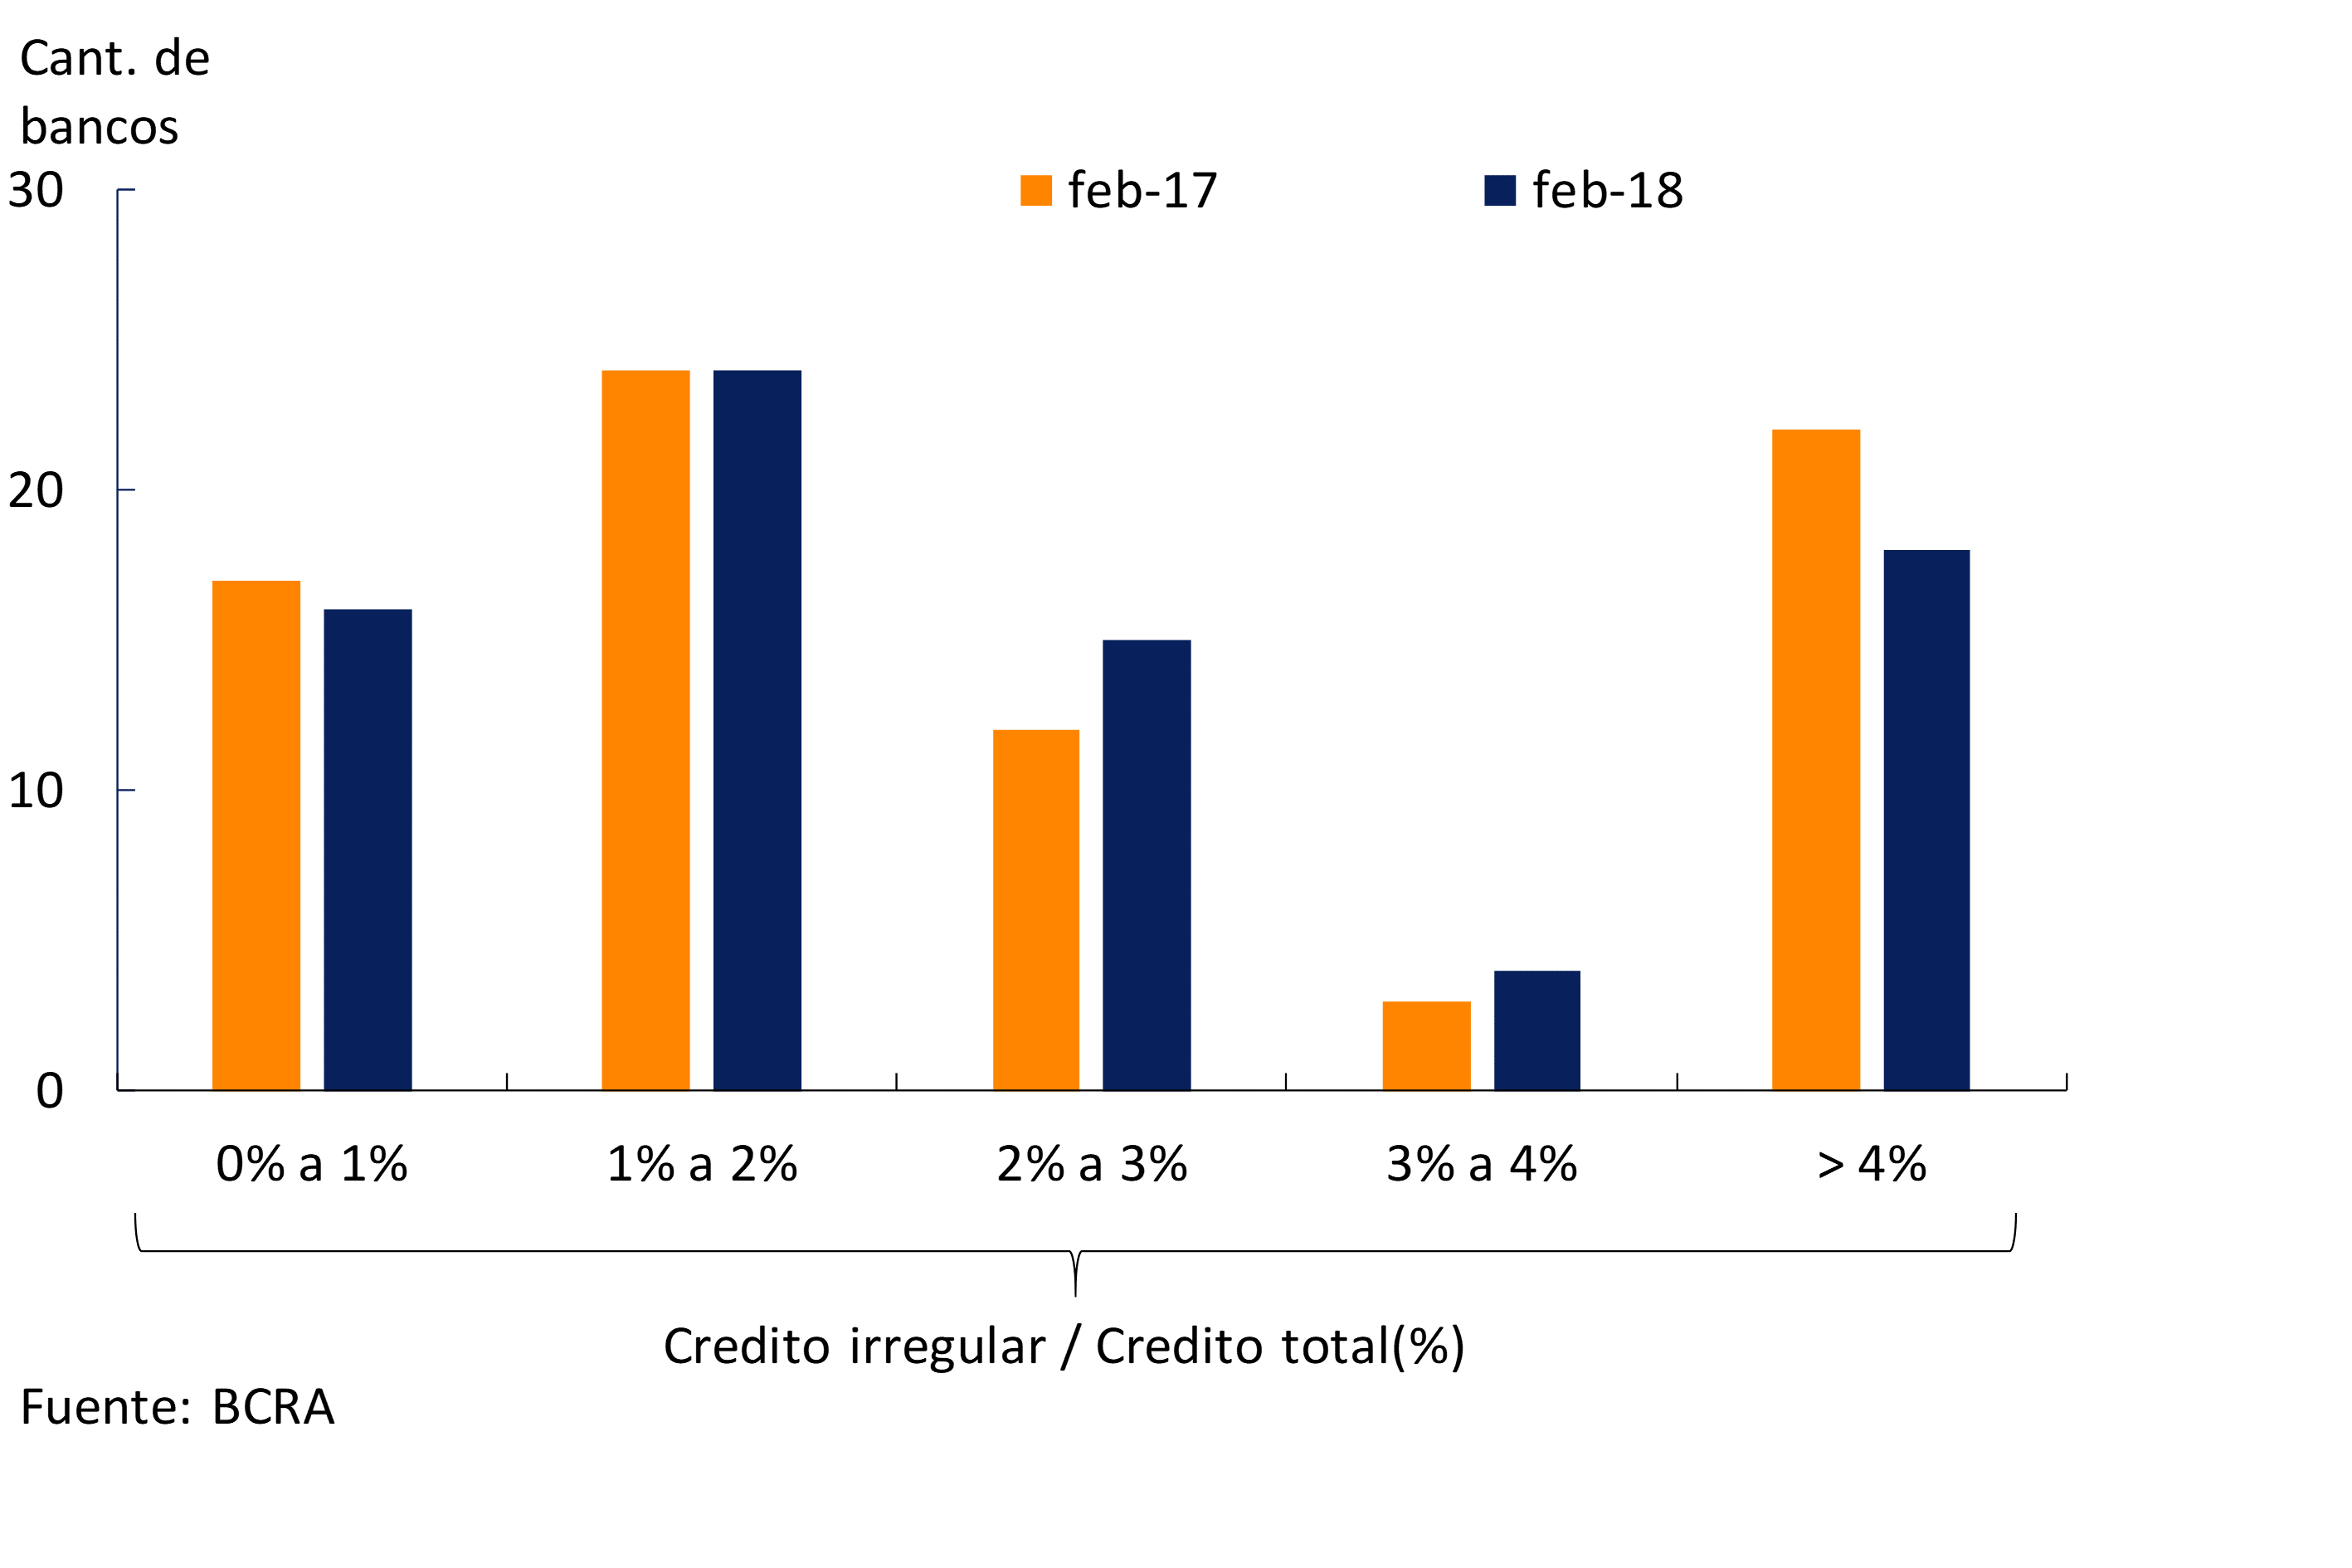
• In February, the non-performing loan ratio to the private sector stood at 1.9%, in line with the level of a year ago. Considering the distribution of the irregularity ratio among financial institutions, at the beginning of 2018 a lower dispersion was observed in relation to that evidenced 12 months ago. In the period, the balance of accounting forecasts of all banks reached an amount equivalent to 136% of loans in an irregular situation.
• The balance of total deposits grew 1.6% in real terms in February, driven by the increase in public sector deposits. For their part, in the month, private sector deposits fell 0.4% adjusted for inflation (nominally they grew 2%). Considering the last 12 months, total placements increased 1.8% in real terms, with an increase of 3.4% in private sector placements. Within the latter segment, deposits in dollars grew 10.8% y.o.y. (in currency of origin), while those arranged in national currency did not show significant changes in real terms in a year-on-year comparison.
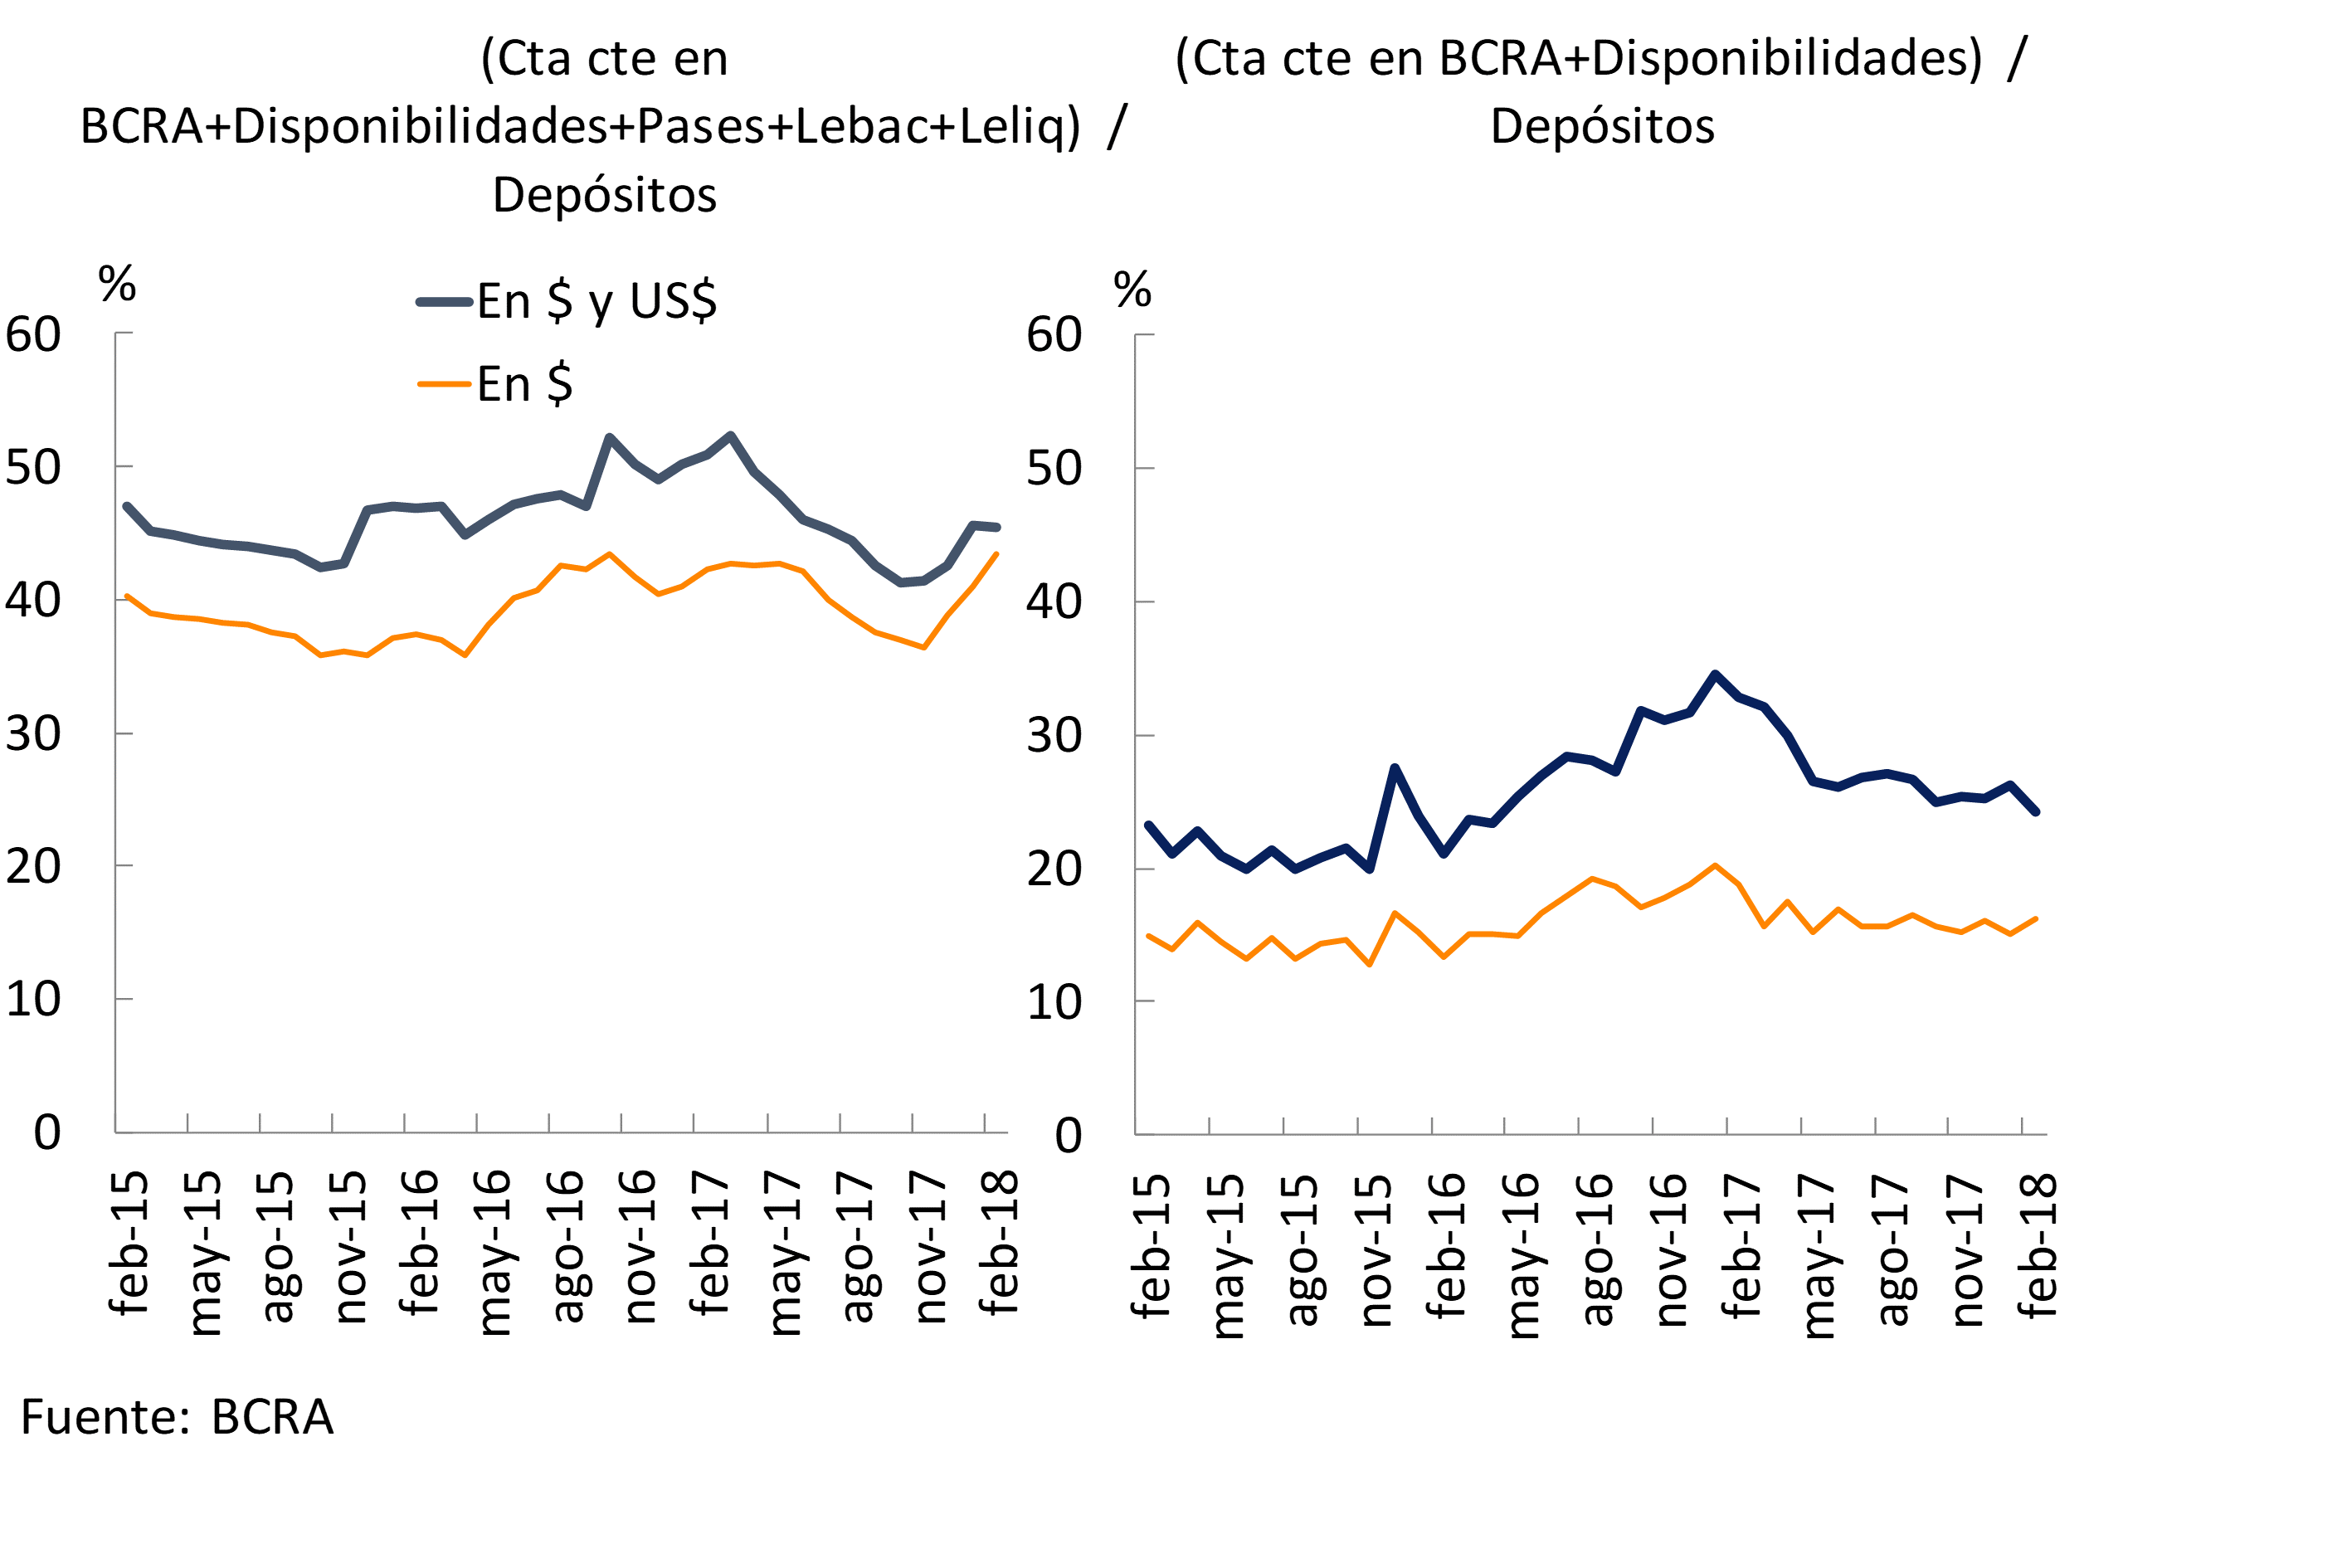
• In the month, the broad liquidity indicator of the financial system – considering items in national and foreign currency, including the current account of banks at the BCRA, availabilities, passes with the BCRA, LEBAC and LELIQ – totaled 45.5% of deposits, remaining without significant changes compared to January (falling 5.3 p.p. compared to February 2017). However, there was an increase in ample liquidity in pesos of all financial institutions in the month to reach 43.4%, which was mainly driven by public entities, although this indicator also increased in the group of private banks. At the aggregate level, this growth was almost entirely explained by the increase in LELIQ holdings. Liquidity in the strictest sense – considering only the availabilities and the balance of the current accounts that banks have in the BCRA – fell 2 p.p. of deposits in the second month of the year to reach 24.3%.
• In February, the solvency indicators of the financial system remained in a range of relatively high values. Capital integration totaled 16.4% of risk-weighted assets (RWA) in the month, slightly lower than at the beginning of 2017, mainly due to the dynamism of RWAs driven by credit to the private sector. Tier 1 capital accounted for more than 90% of total regulatory capital. The excess integration of normative capital reached 83% of the requirement, 12 p.p. less than in February 2017.
• The financial system obtained monthly gains that were equivalent to 2.3% of assets in February, down from last month’s level. In the twelve-month cumulative period, the results of the banks as a whole totaled 2.8% of assets, falling 0.4 p.p. y.o.y. The cumulative twelve-month ROA for private banks reached 3.3% without significant changes in a year-on-year comparison and for public banks it totaled 2.2%, falling 0.6 p.p. y.o.y.
I. Recent measures1
In order to provide greater transparency to financial operations and increase user protection, in March the BCRA established that, in all documentation related to the contracting of loans, the Total Financial Cost (TFC) must be identified with a font 5 times greater than that used for the rest of the contractual information2. This obligation has already been in force since 2016 for graphic and audiovisual advertising of loans and financial services.
In order to continue promoting the development of the sector, the conditions for the operation of ATMs operated by non-financial entitieswere recently extended 3. In particular, it was provided that financial institutions – by themselves or through the networks that process payments – must interconnect the ATMs of non-financial companies to the accounts and debit cards of their customers. In this way, it seeks to stimulate the installation of ATMs in commercial chains or in other public spaces by non-financial entities.
In order to assist agricultural producers in jurisdictions of the country declared in a state of emergency and/or agricultural disaster, the BCRA sanctioned the extension of the deadlines that determine the situation of arrears for those producers affected by climatic events. The benefit consists of adding 45 days to each of the terms necessary to be classified as a debtor in categories 1, 2 and 3 according to the BCRA classification. This measure will be in force until December 20194.
In March, the rules on “Authorities of financial institutions” were modified, establishing that financial institutions are now classified into two groups based on their assets5, instead of deposits. The growth of the financial system would lead to the development of funding alternatives in the capital market, making the variable “assets” more representative to reflect the size of the entities. On the one hand, Group “A” is made up of those entities in which the amount of their assets is greater than or equal to 1% of the total assets of the financial system and on the other, Group “B” made up of the remaining entities6. It should be considered that the entities of group “A” must observe the separation of executive and administrative functions, among other regulatory differences that exist between both groups7.
Finally, in order to continue promoting access to credit for MSMEs, in early 2018 this institution extended the maximum limits of assistance that banks can channel to mutual guarantee societies (SGRs) or Public Guarantee Funds (FGCP), from 25% to 50% of the computable patrimonial liability (RPC) of each entity8.
II. Activity
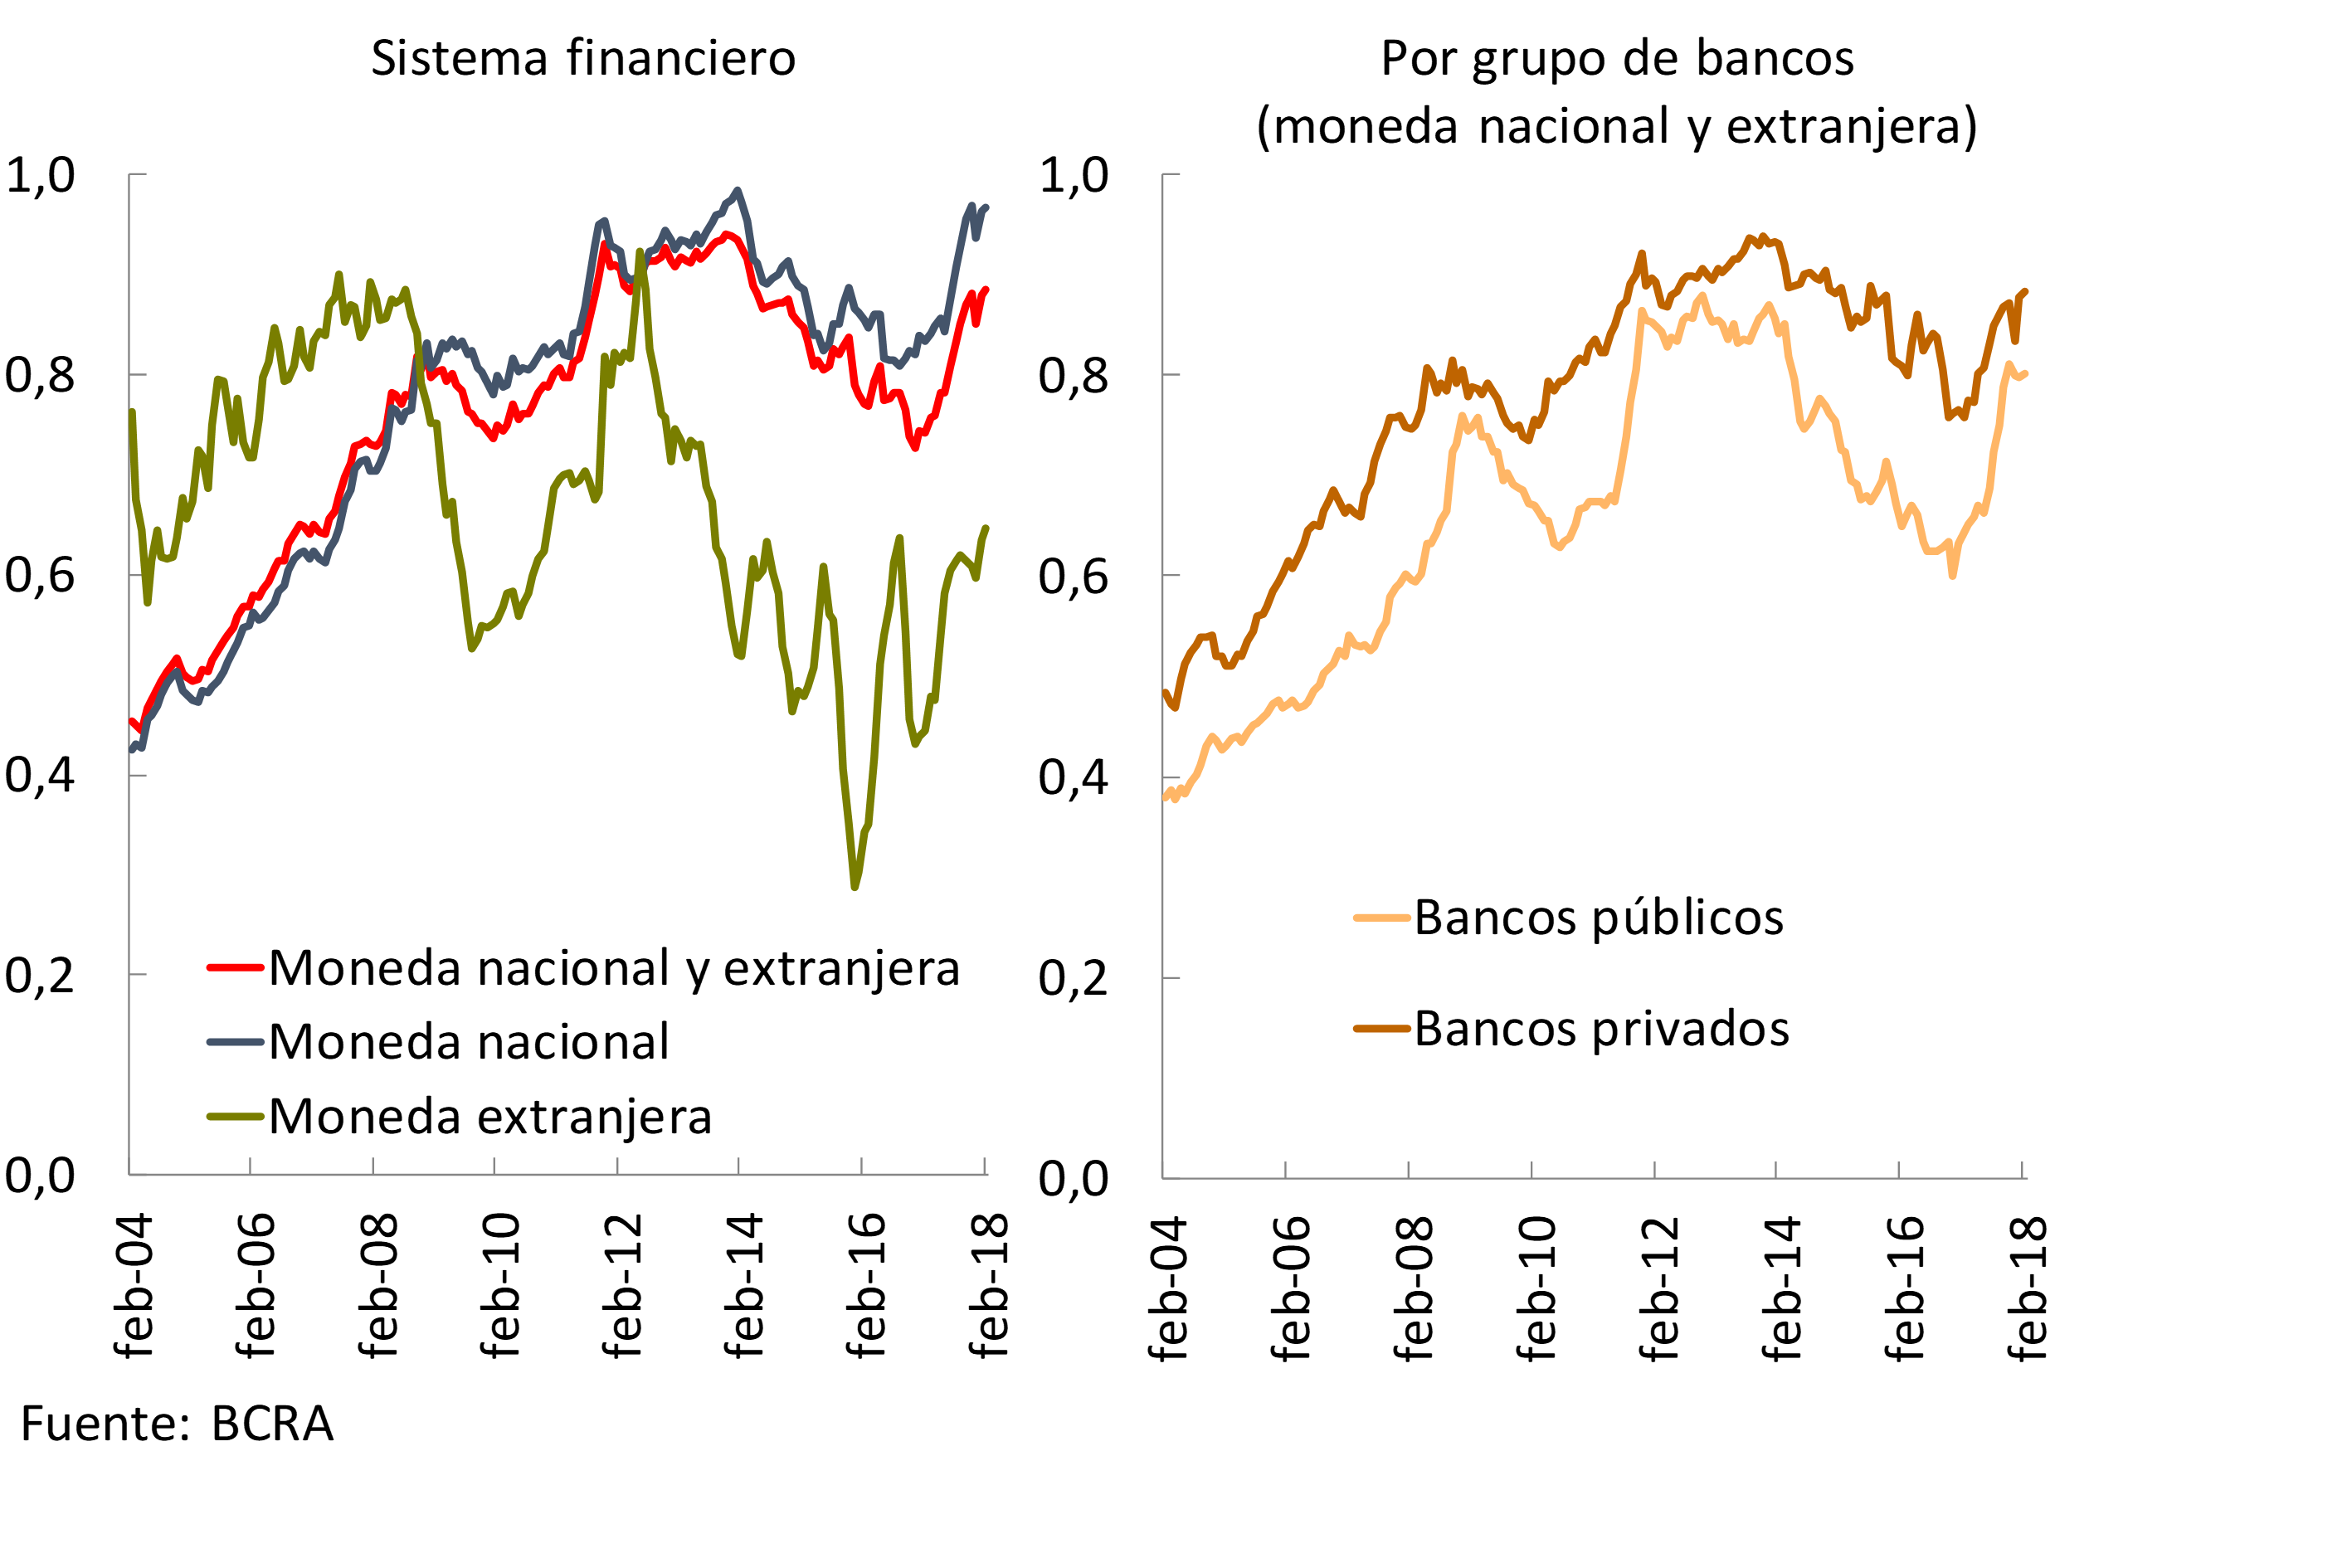
In February, the dynamics of banks’ financial intermediation with the private sector continued to be influenced by seasonal components, typical of the summer recess. As in the first month of 2018, financing to the private sector presented a better relative performance with respect to deposits in this sector, showing a slight increase in the ratio between these balances (see Chart 1), being an indicator that provides information on the liquidity situation of the financial system. Loans to the private sector totaled 88% of deposits in this sector, slightly above the January figure and 14 p.p. more in a year-on-year comparison.
Graph 1 | Loans in Deposit Terms – Balance Sheet Balances – Private Sector
With respect to the estimated monthly cash flow for the peso items on the balance sheet of the financial system, in February the increase in public sector deposits ($139,700 million) was the most relevant source of resources9 —mainly explained by public banks— (see Graph 2). To a lesser extent, the increase in deposits in national currency of the private sector, the net placement of negotiable obligations (ON) and the gains derived from the activity were also sources of funding for all financial institutions in the month. These resources were mainly used to increase the holdings of LELIQ ($73,300 million) – mostly public banks – and of non-interest-bearing liquid assets (especially in the current account at the BCRA, for $48,600 million). In addition, in February, other applications of funds in national currency were the increase in financing to the public sector – mainly in the group of public banks – and to the private sector.
Graph 2 | Monthly Cash Flow Estimate – February 2018
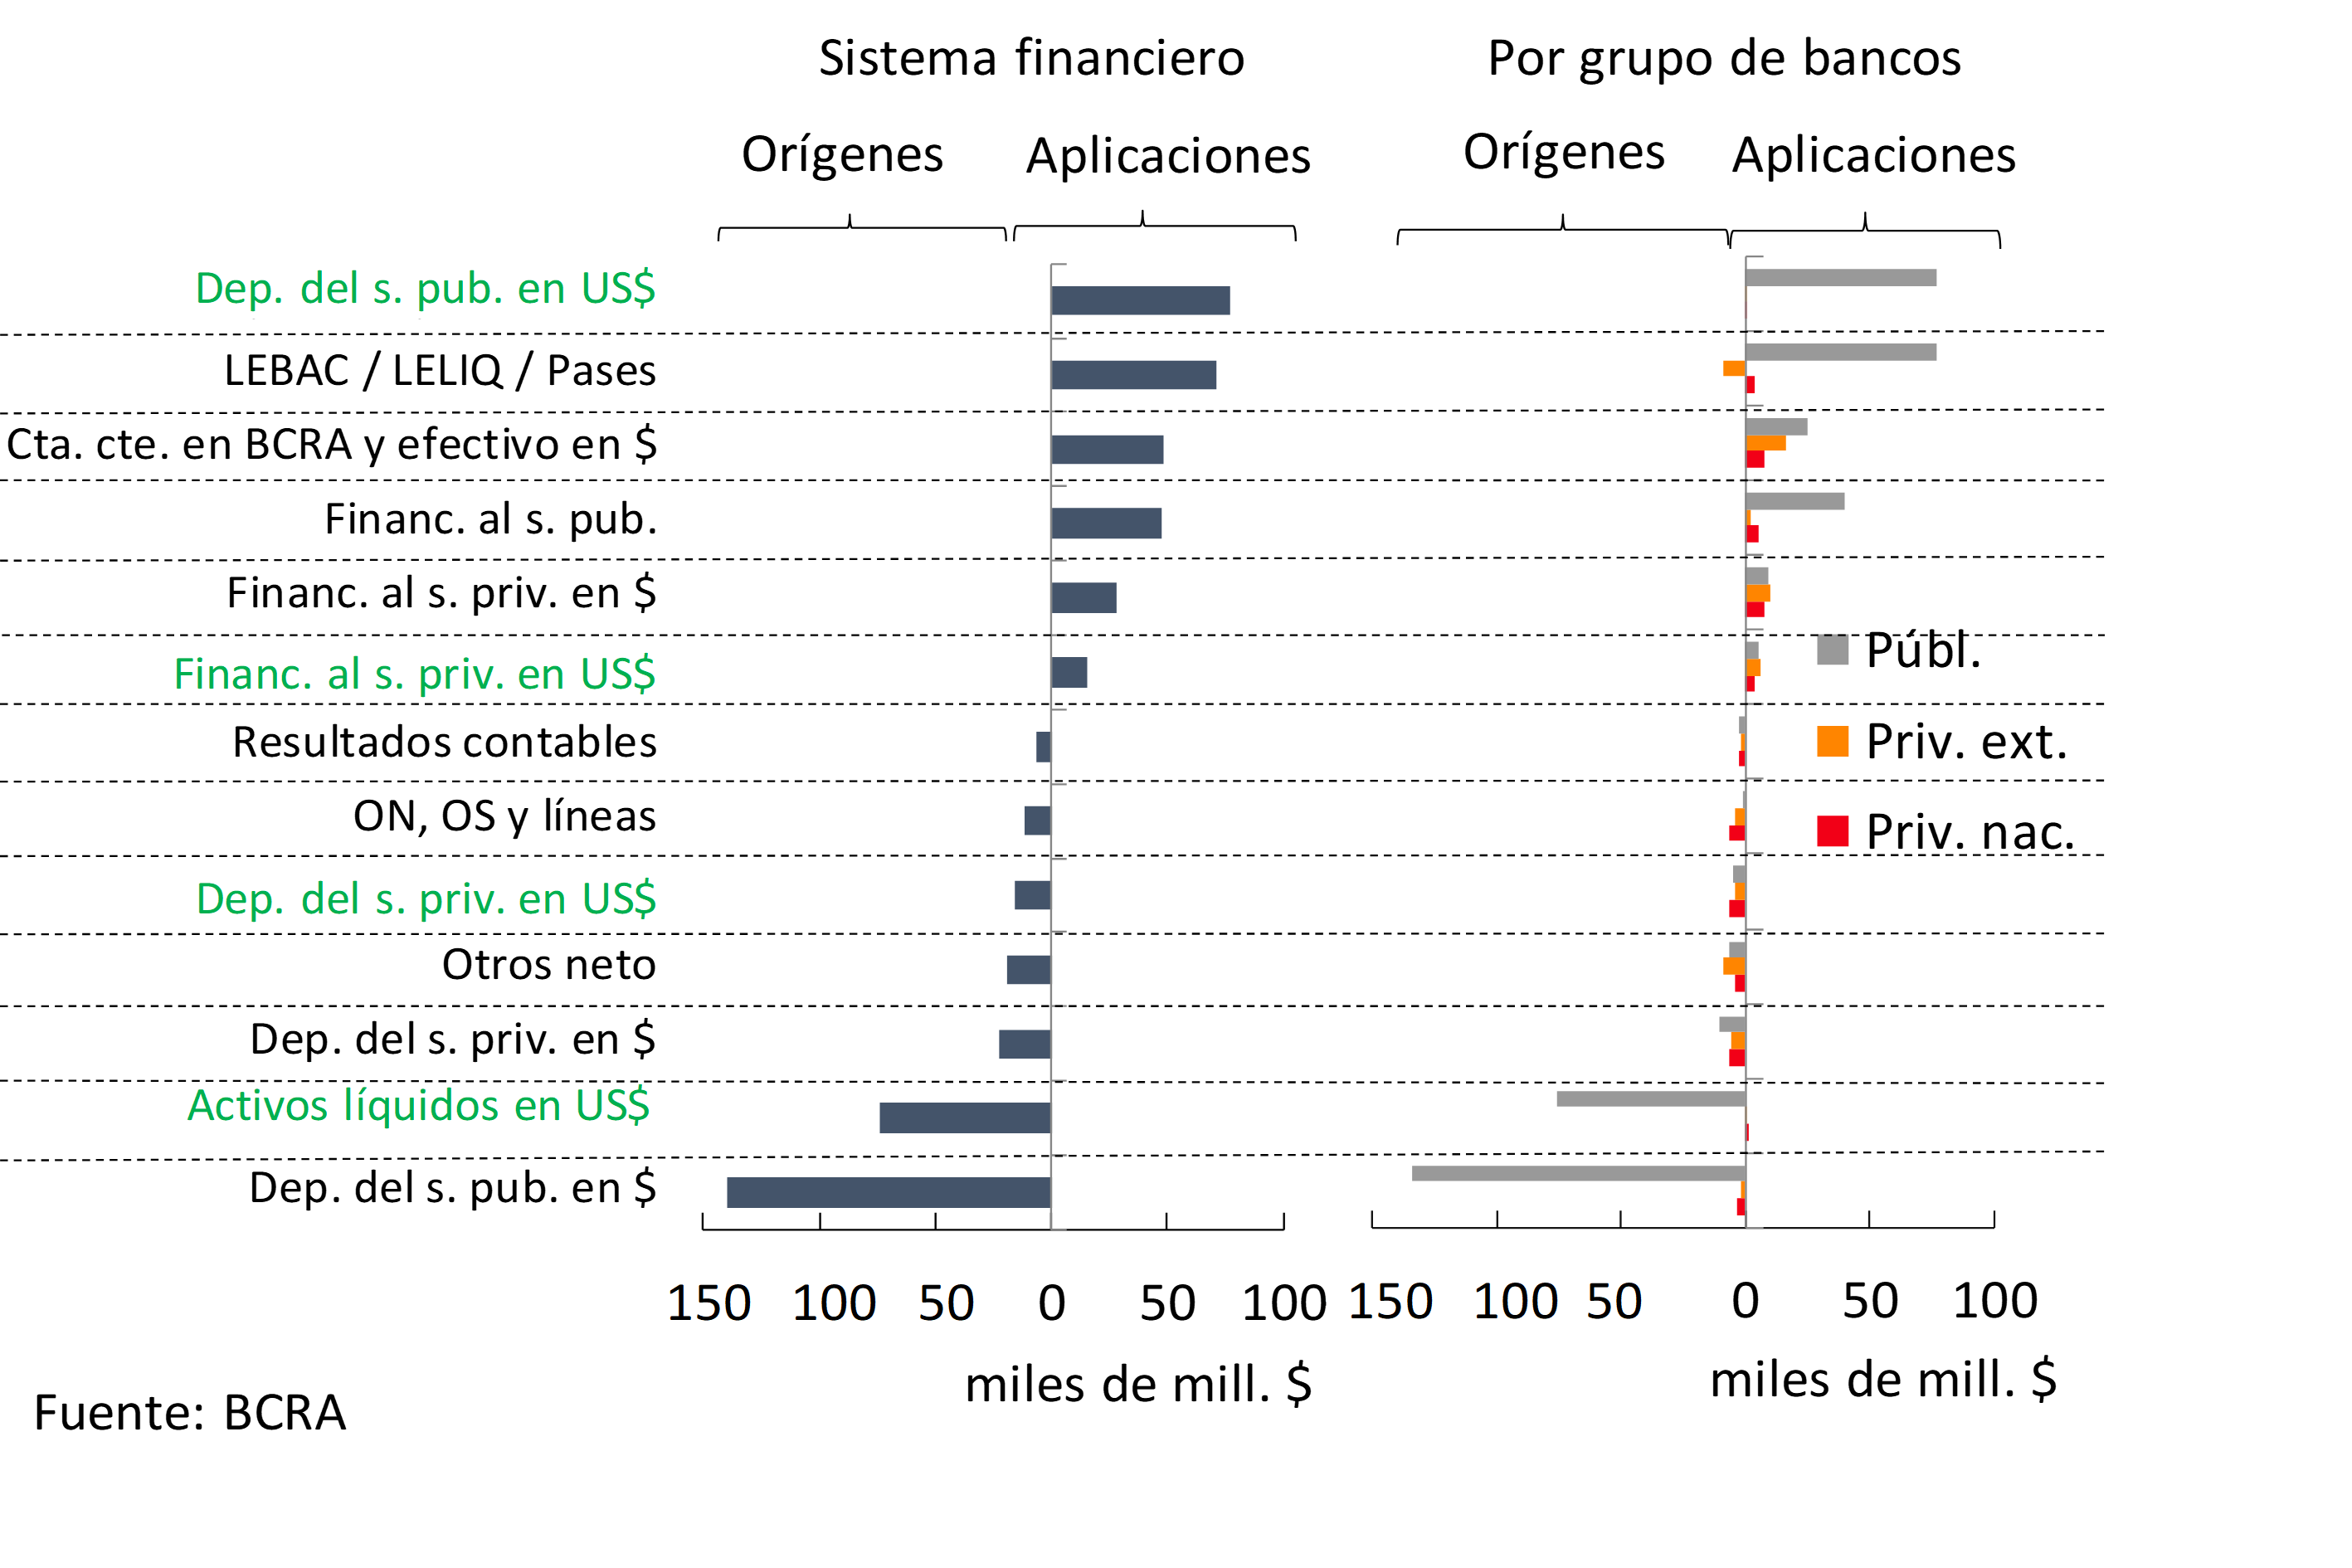
Taking into account the segment in foreign currency, in the month the reduction of liquid assets was the main source of resources of the financial system (equivalent to $73,600 million). To a lesser extent, the increase in private sector deposits in foreign currency was also a source of funds in the month. Such resources had as a counterpart the decrease in public sector deposits in this denomination (about $77,400 million) and the increase in credit to the private sector in dollars.
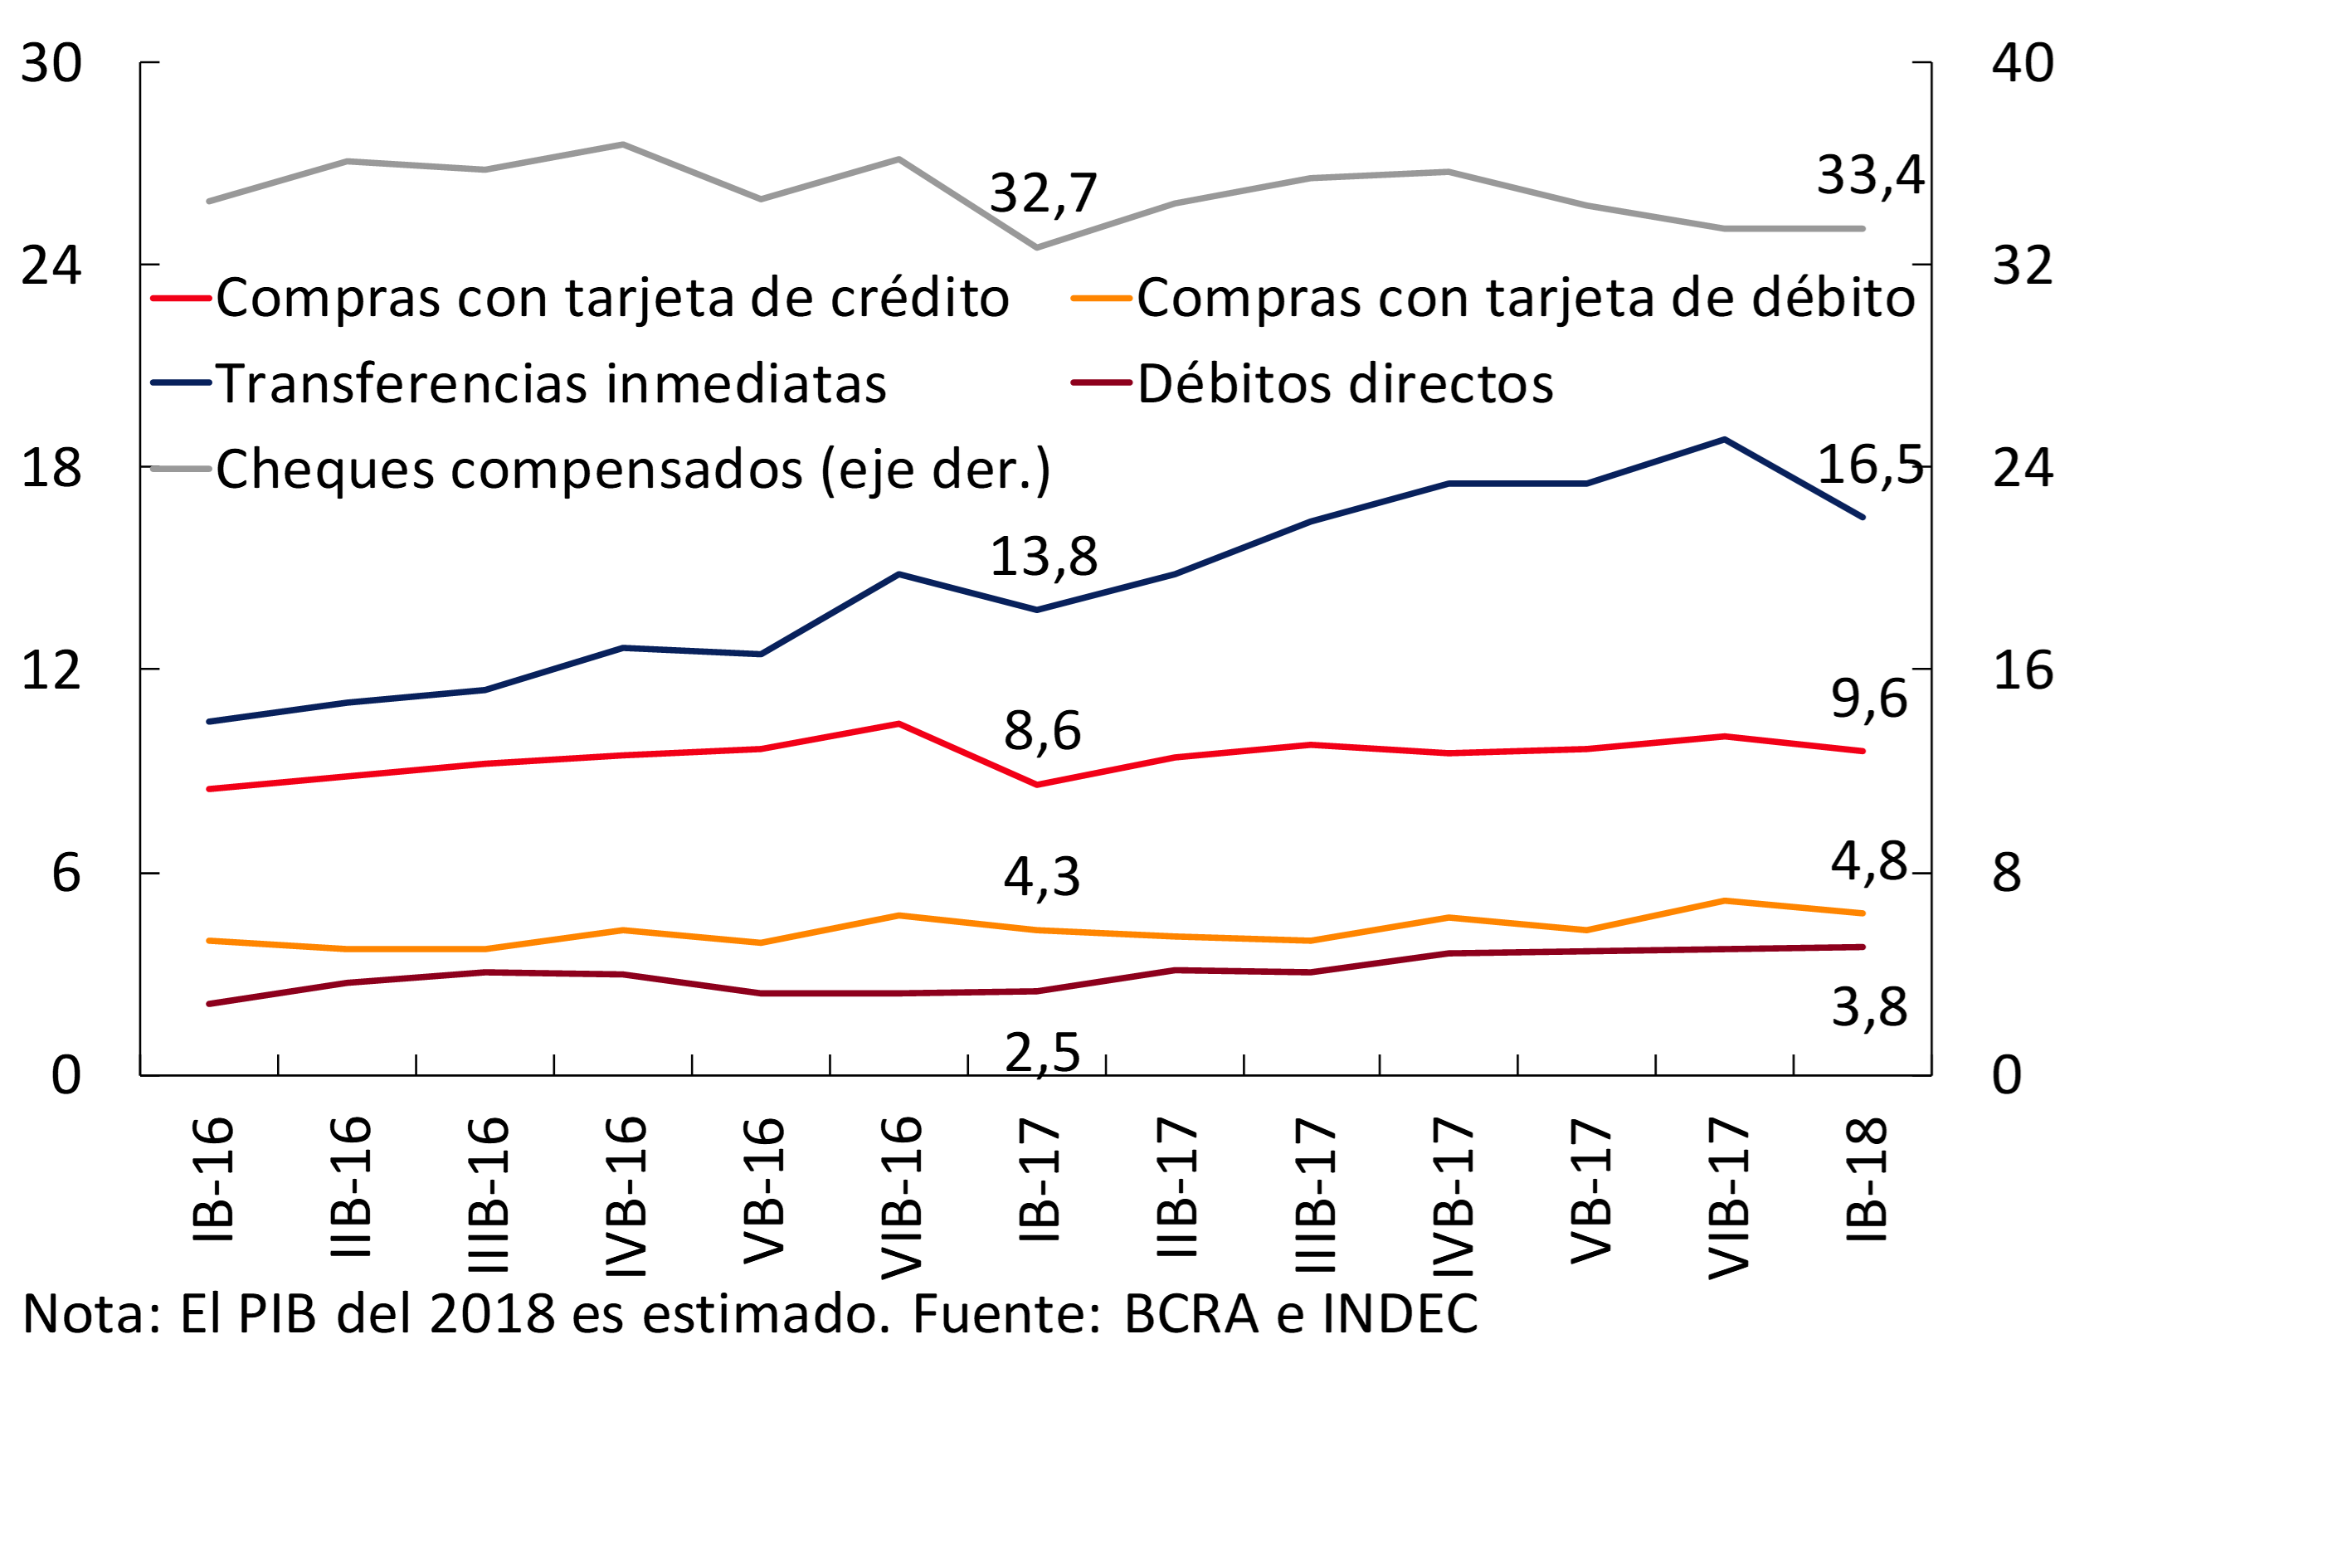
The use of electronic means of payment in the economy continues to deepen gradually. Beyond a performance in which a seasonal component predominates—mainly in the Electronic Business Banking channel—during the first two months of the year, it is estimated that immediate transfers grew 2.7 p.p. of GDP in a year-on-year comparison (see Chart 3). Direct debits also increased in relevance year-on-year (+1.3 p.p. of GDP). For its part, the year-on-year increase in the volume of cleared checks was more moderate.
Graph 3 | Alternative Means of Payment to Cash – Bimonthly annualized – In % of GDP
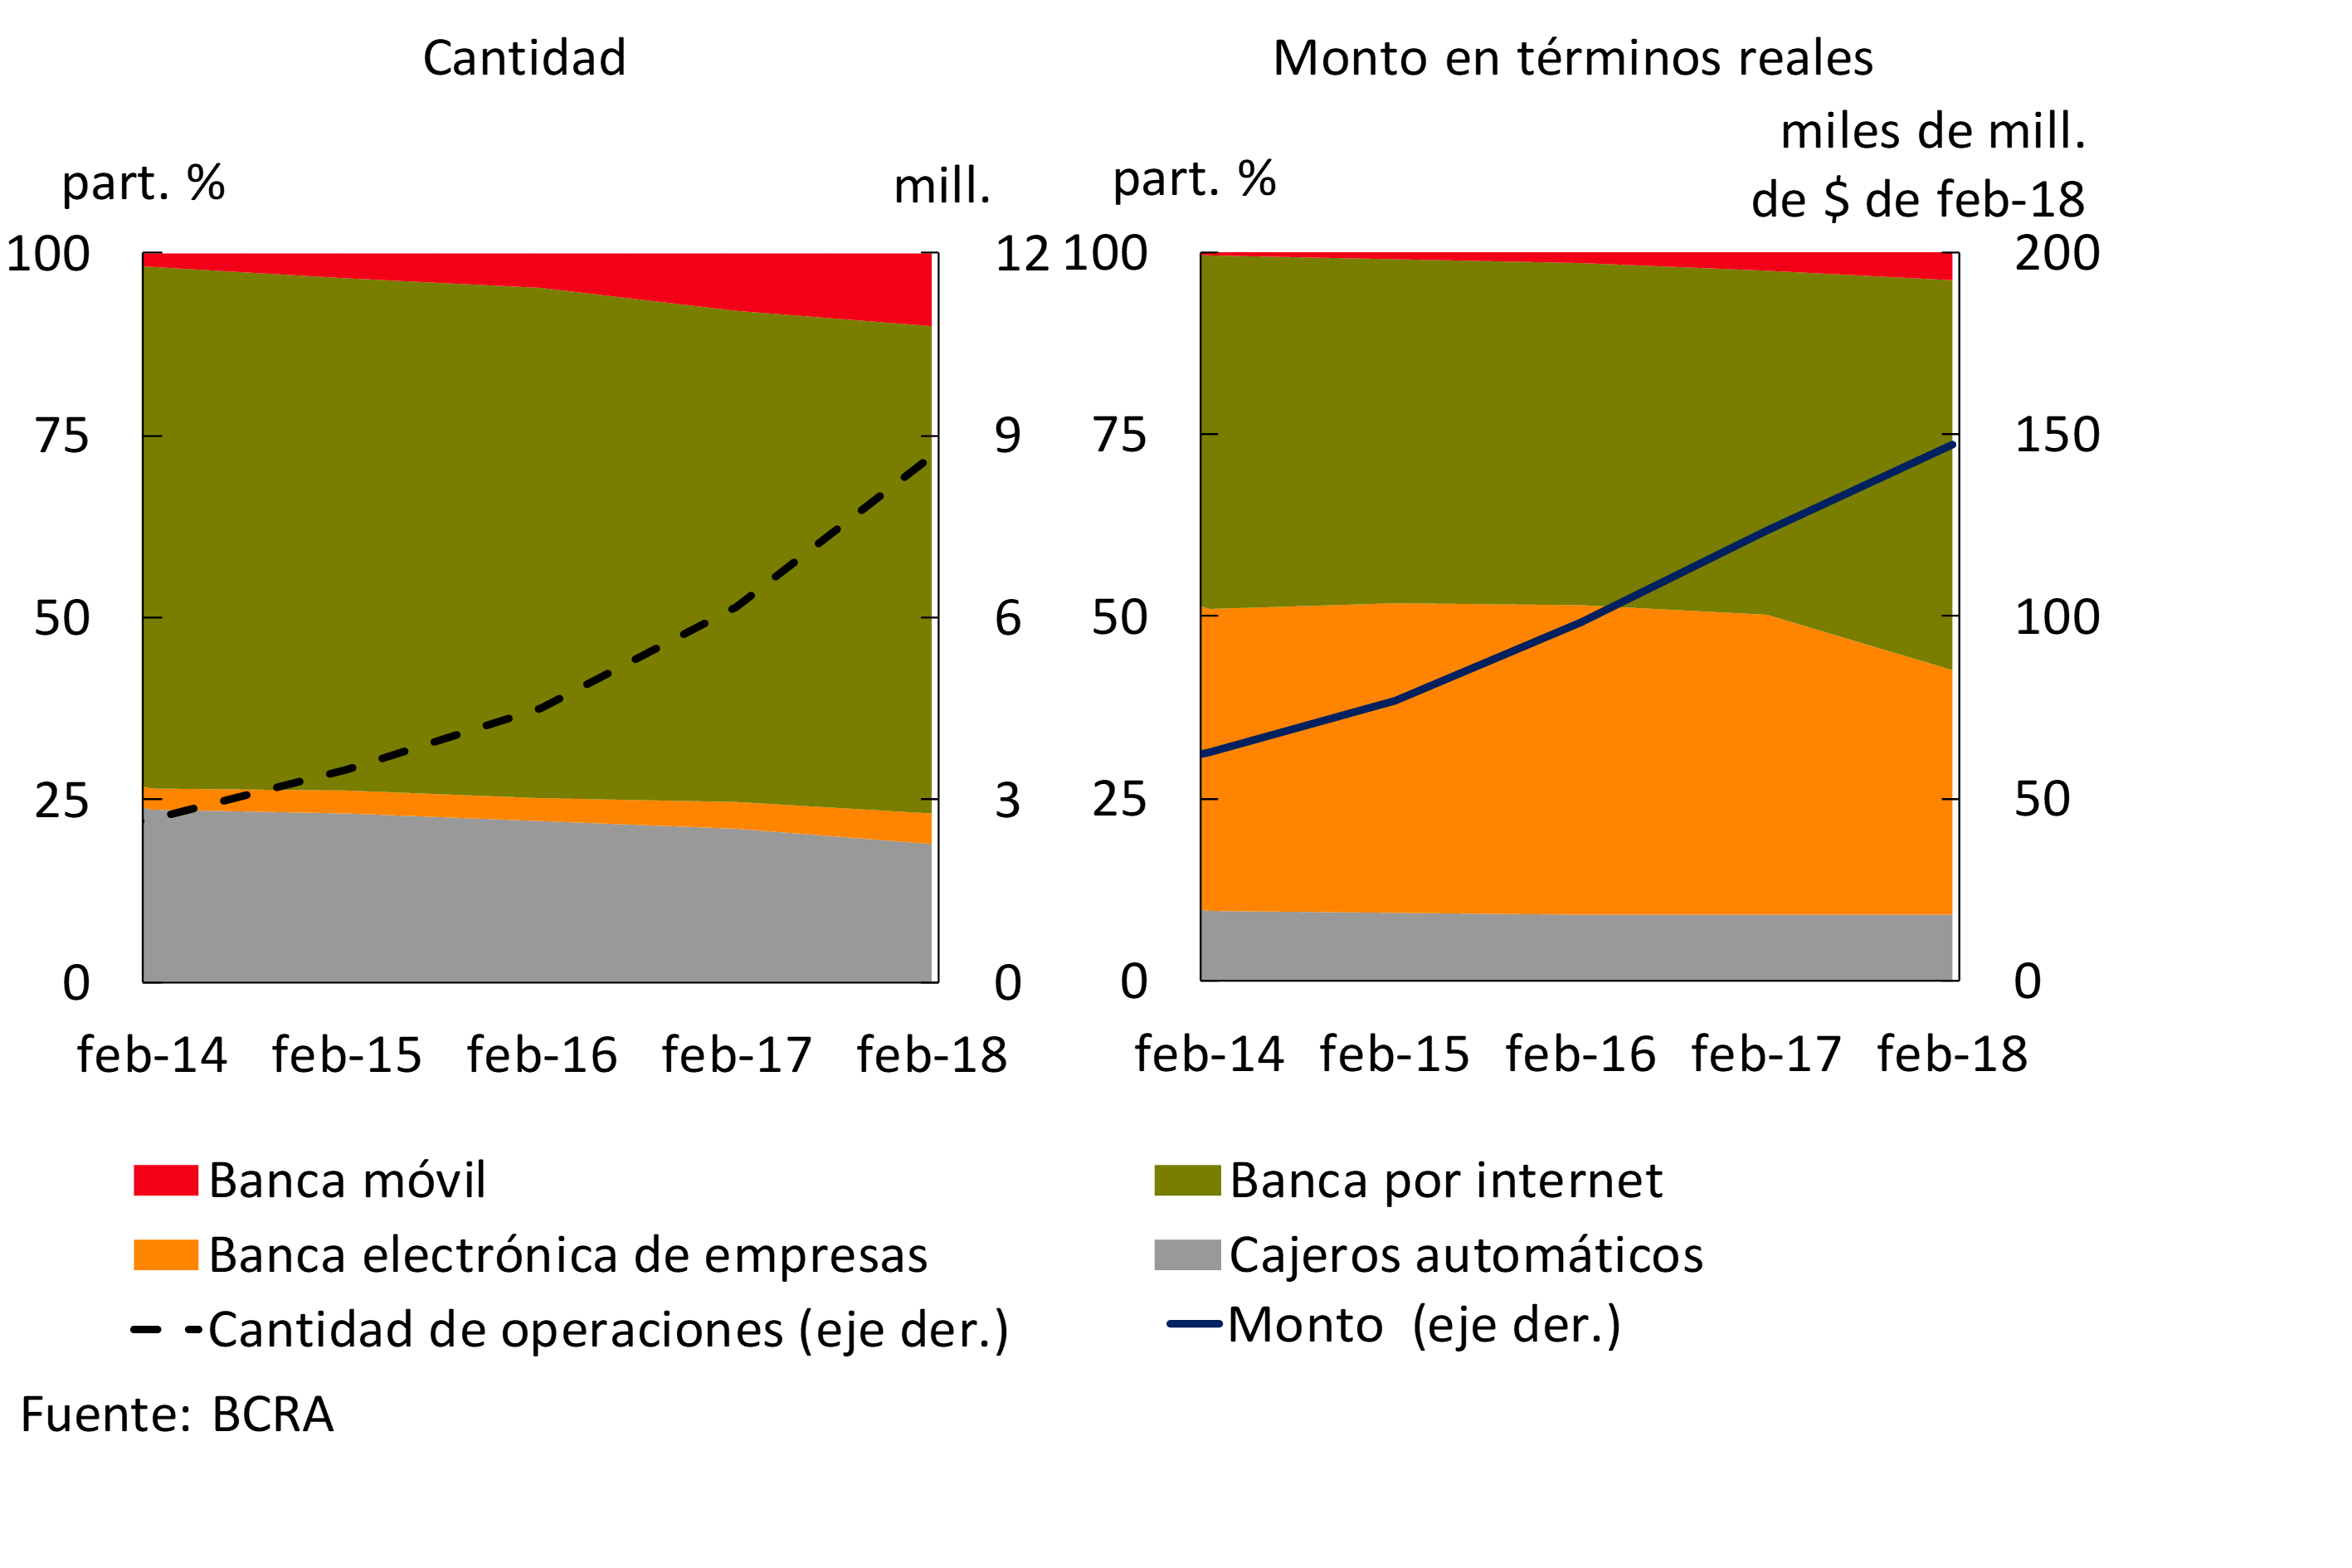
As for the channels through which immediate transfers are made, 67% of operations are carried out from Internet banking, while 19% are still made through ATMs. Finally, 10% is already carried out using the different mobile banking applications (see Graph 4) and the remaining 4% through electronic business banking.
Figure 4 | Immediate Channel Transfers of Funds
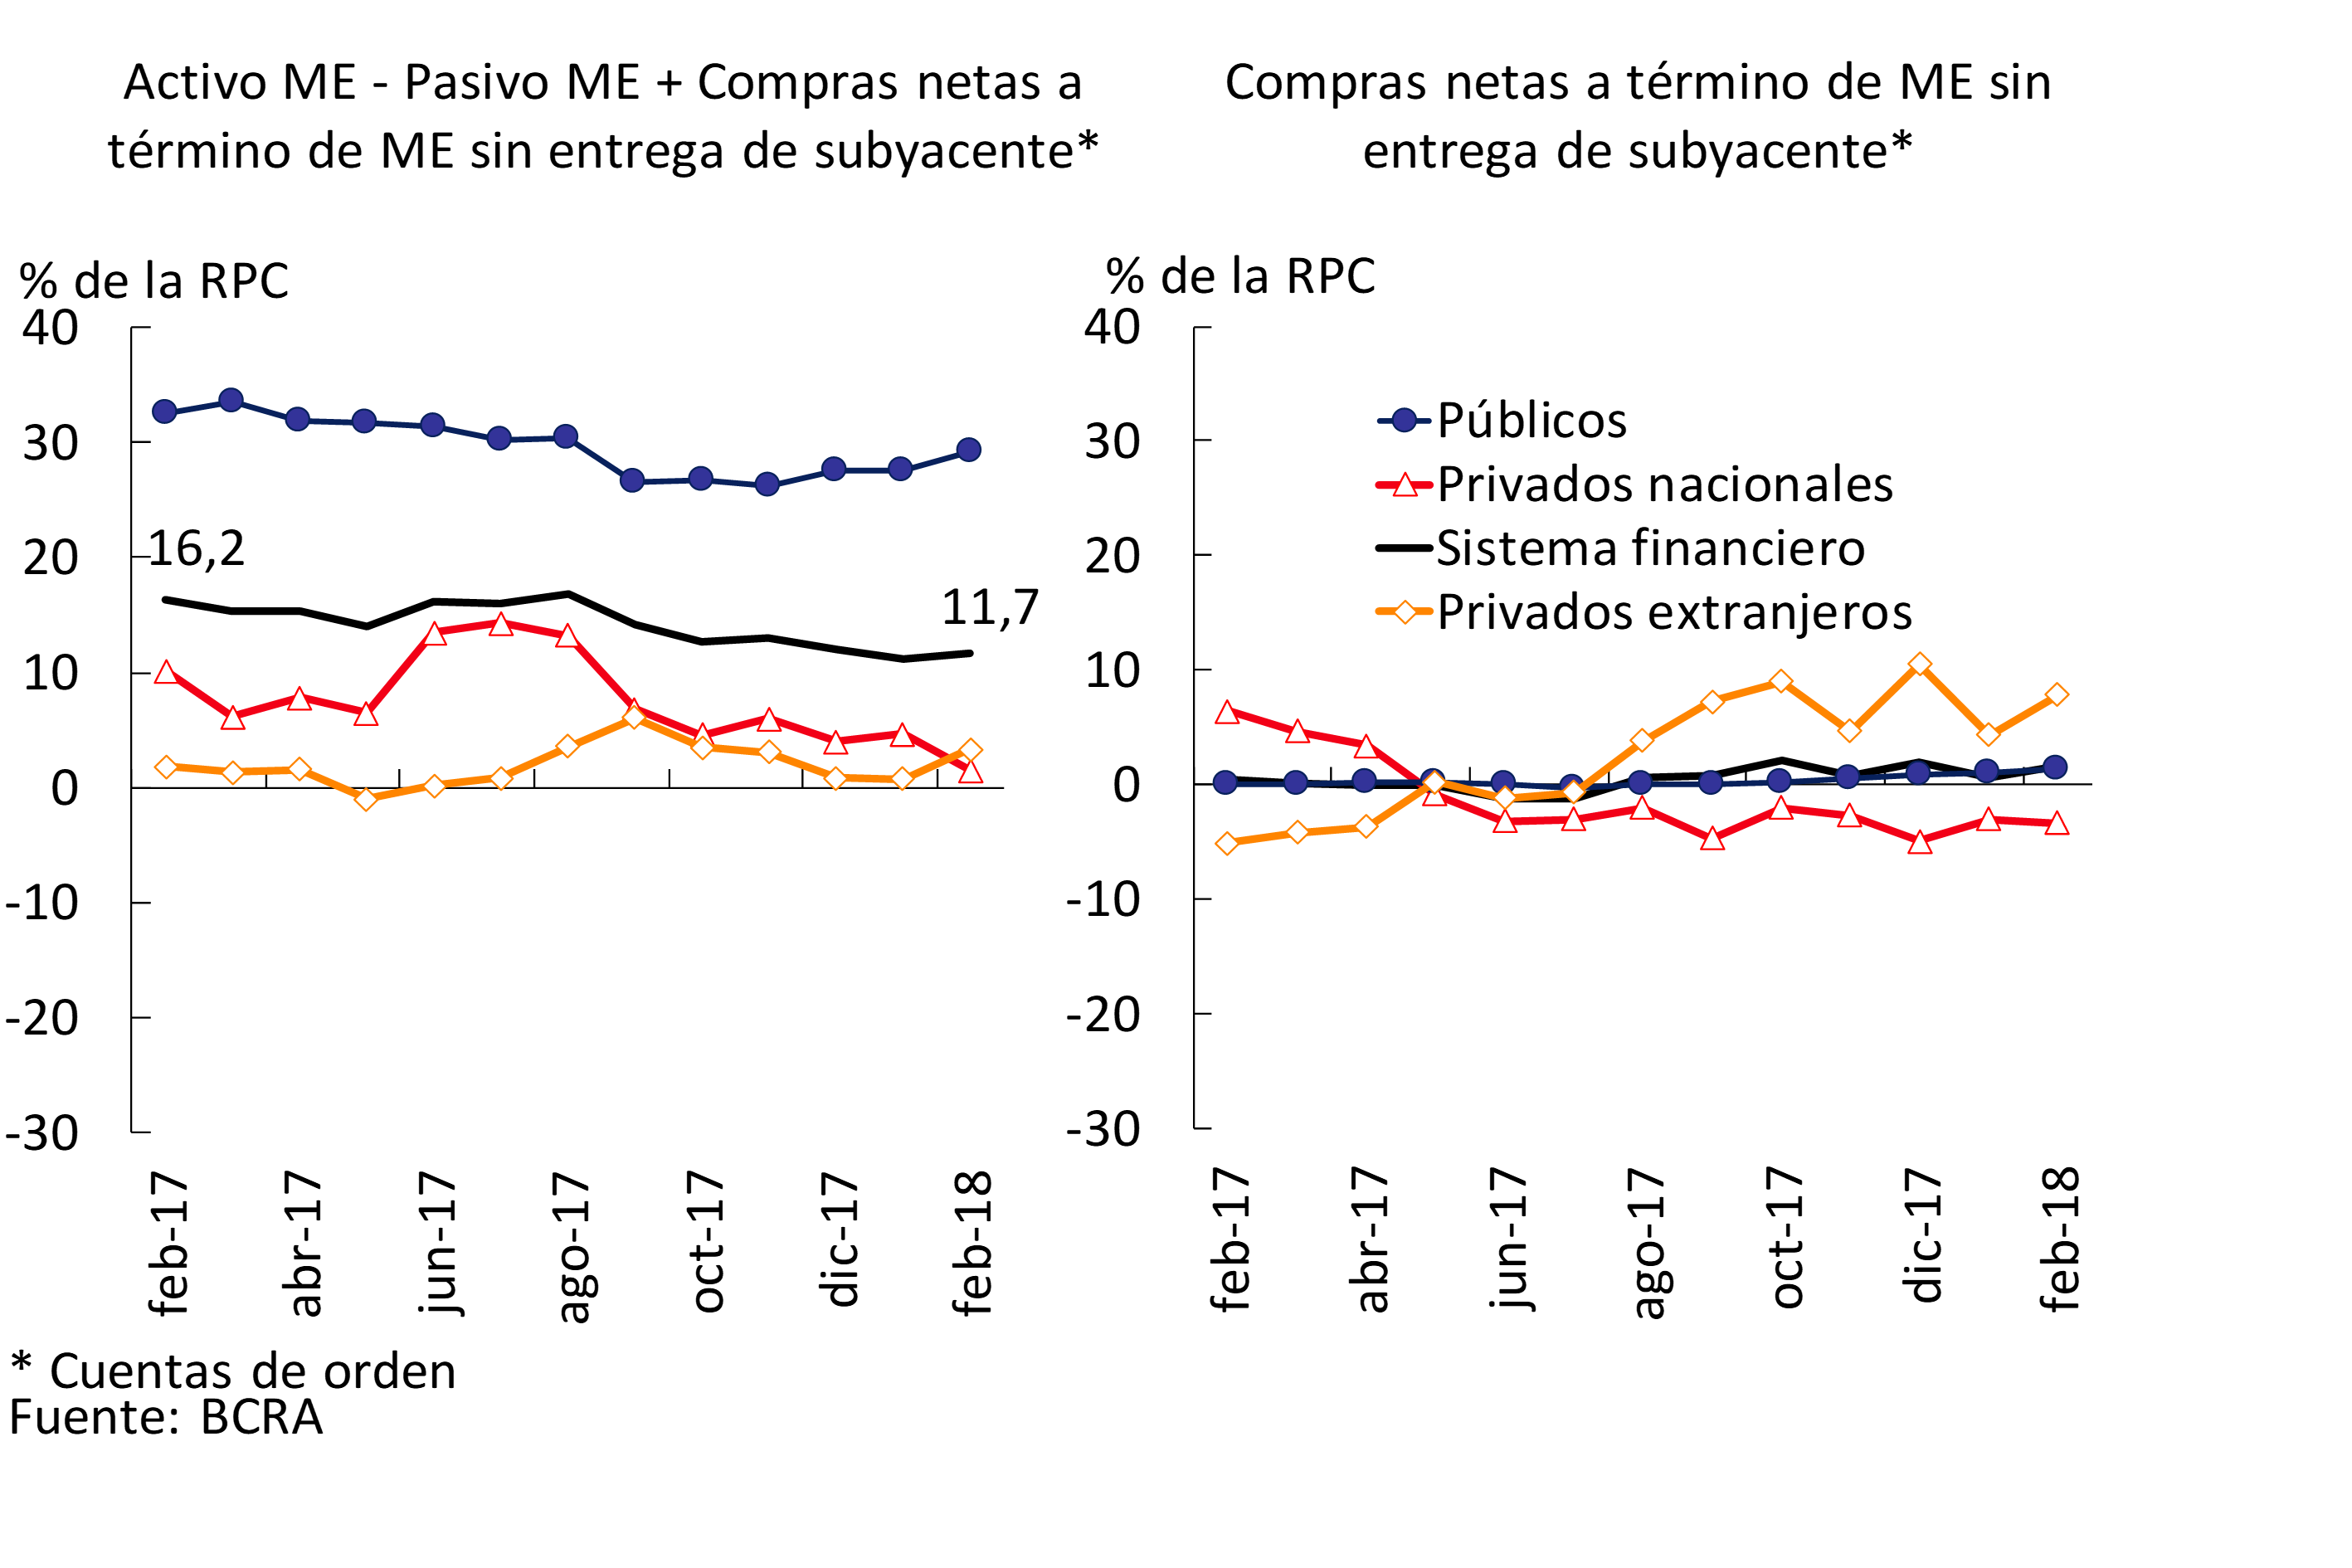
In February, the various equity mismatches in the financial system continued to be at moderate levels. On the one hand, it is estimated that the aggregate spread between assets and liabilities that are adjusted for inflation represented about a third of the Computable Patrimonial Liability (CPR) in the period (7.7% of the CPR in the group of private banks). On the other hand, the foreign currency mismatch faced by the set of financial institutions totaled 11.7% of the PRC, slightly above the value of January. However, in a year-on-year comparison, this ratio fell by 4.5 p.p. in the PRC, mainly due to the performance of domestic private banks (see Chart 5).
Graph 5 | Foreign Currency Mismatch
III. Deposits and liquidity
The balance of total deposits in the financial system grew 1.6% in real terms in February, driven by the increase in public sector deposits (+7.4% in real terms)10. This last increase was driven by time placements in pesos, while the balance of deposits in foreign currency fell11. For its part, in the month, total private sector deposits decreased 0.4% adjusted for inflation (2% nominal growth), with a fall of 0.8% in real terms in accounts in pesos (1.6% nominal increase). Within the latter segment, there were reductions in both term loans, of 1.6% in real terms12 (0.8% nominal increase) and in demand accounts, of 0.4% in real terms (2% nominal growth). In contrast, private sector deposits in foreign currency increased in the month (0.8% in foreign currency).
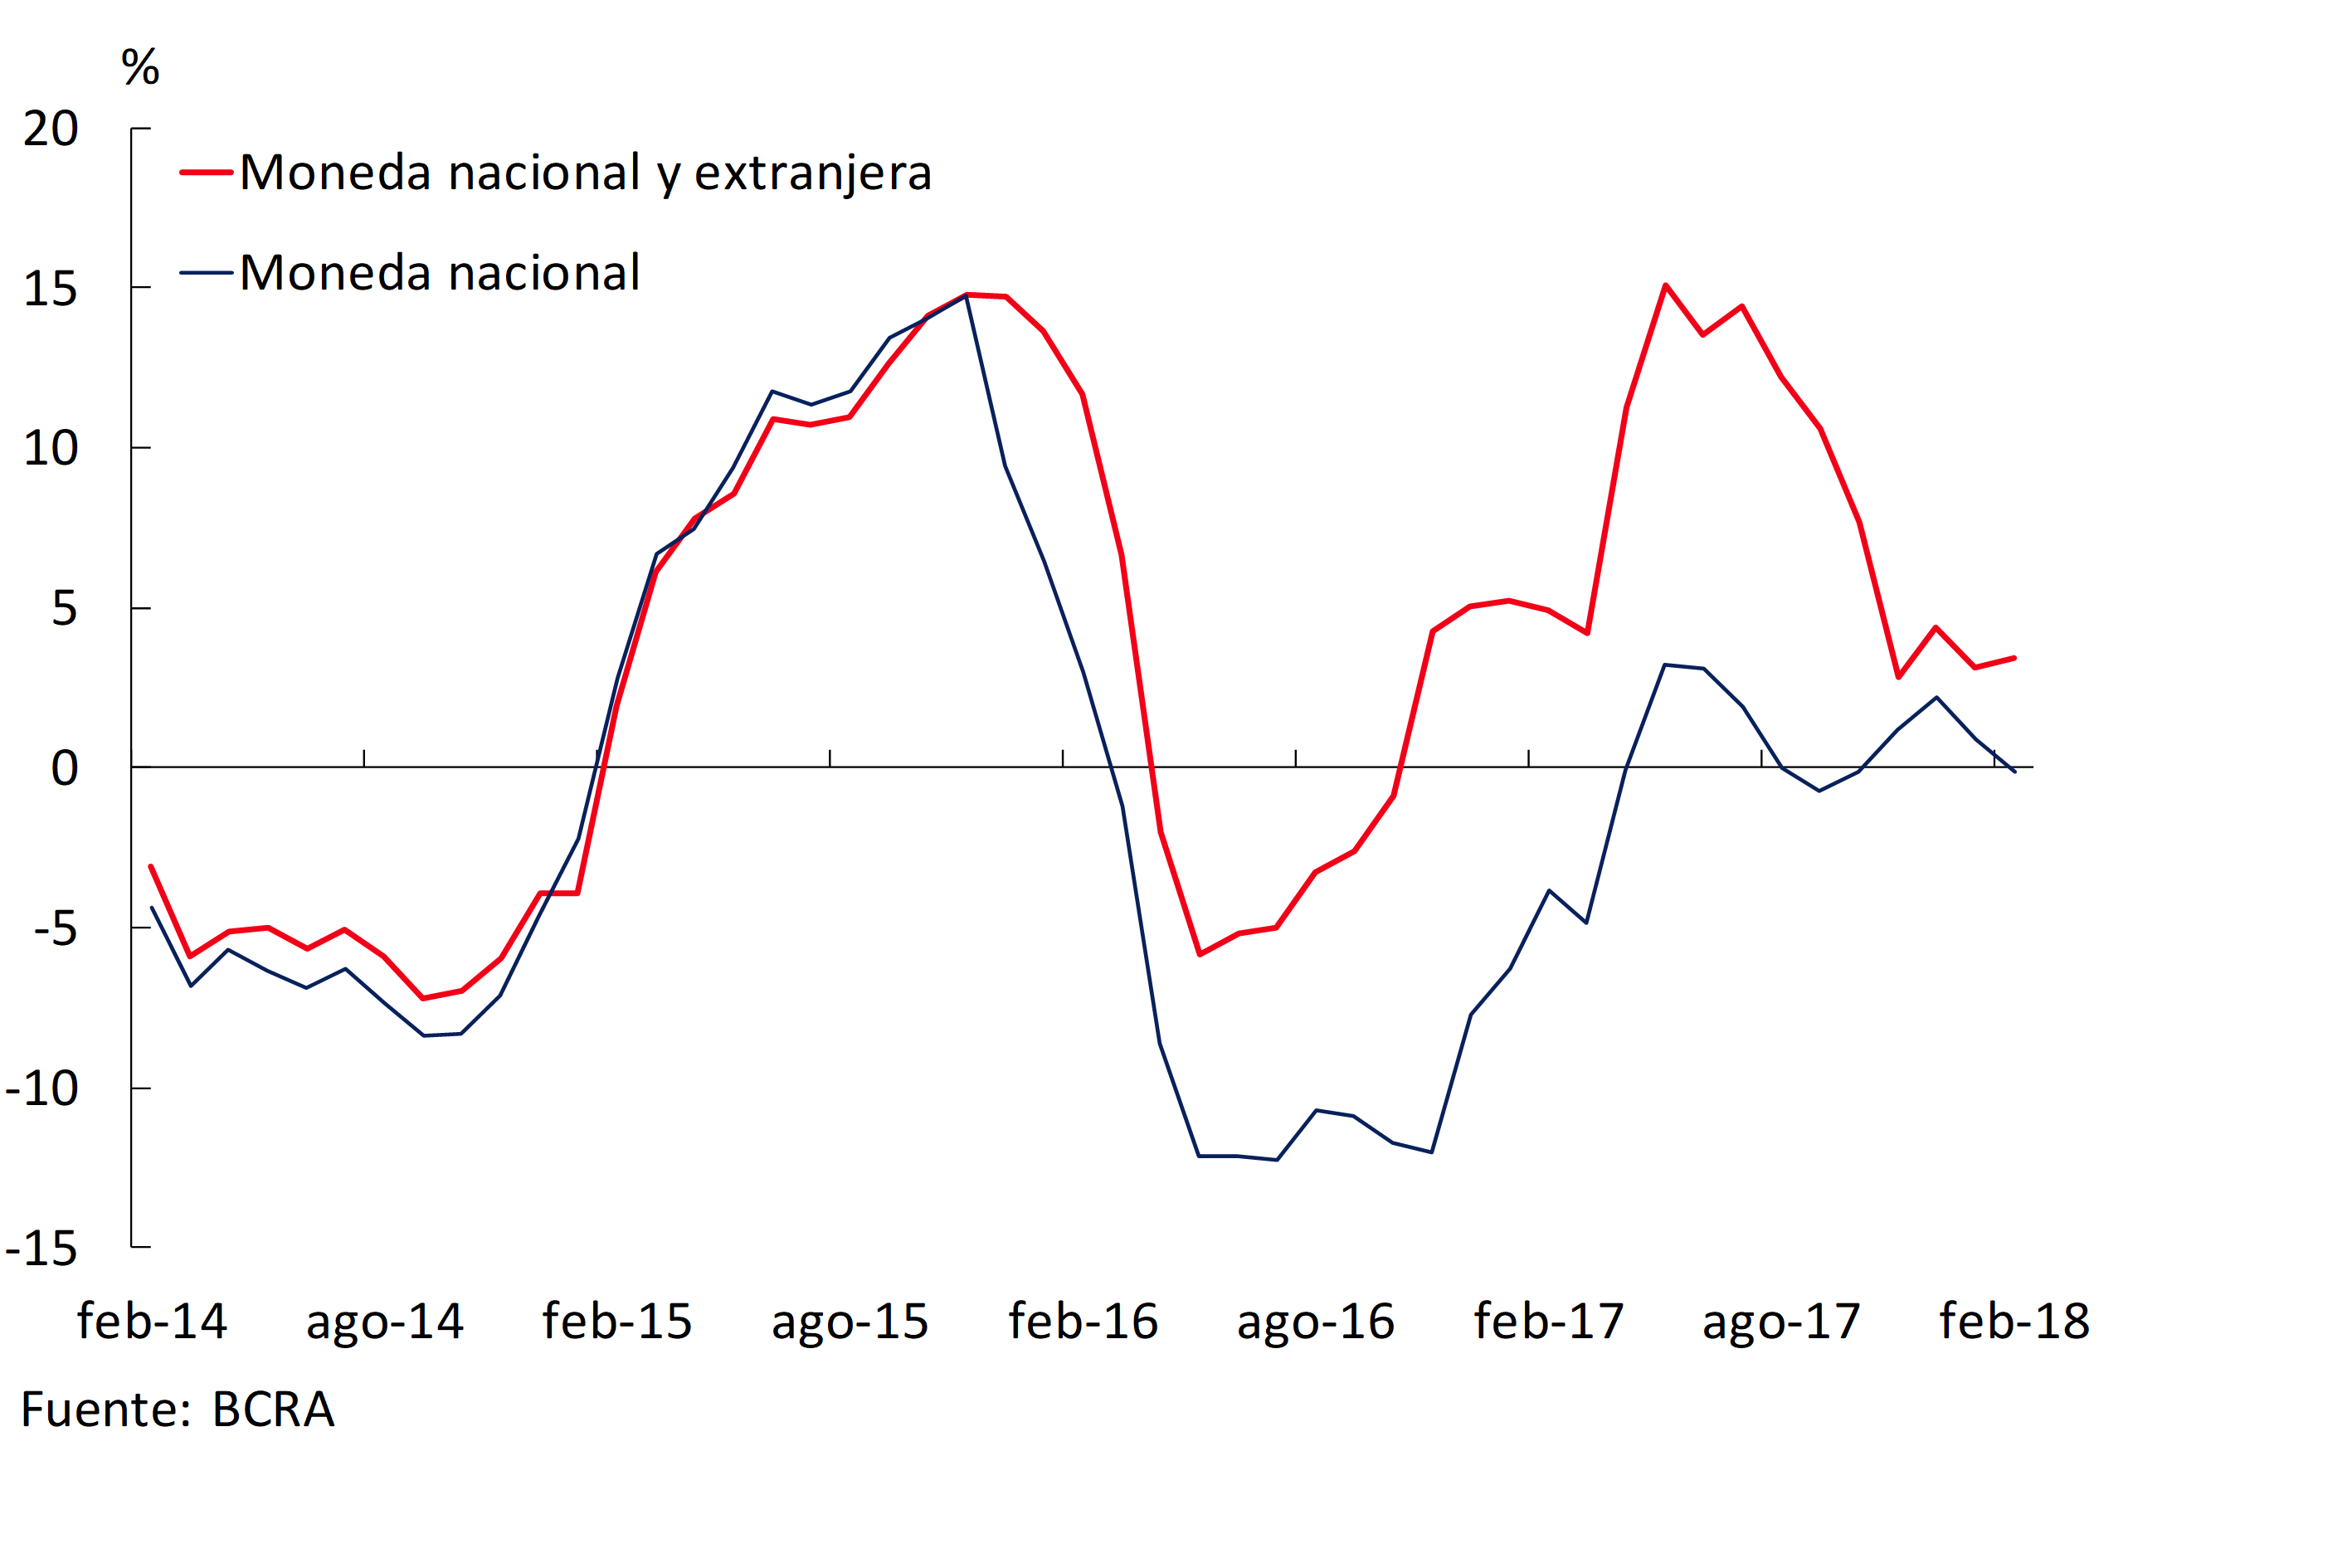
Considering the last 12 months, total deposits in the financial system grew 1.8% adjusted for inflation. The year-on-year performance of deposits was driven by placements by companies and households, which expanded 3.4% in real terms (see Chart 6), with a better performance of deposits in dollars (+10.8% y.o.y. in source currency) in relation to those arranged in national currency (without significant changes in real terms). Within the latter segment, the balance of demand accounts increased by 5.1% YoY, while term placements decreased by 5% YoY, both values adjusted for inflation. For their part, public sector deposits decreased 2.6% in real terms compared to February 2017.
Graph 6 | Total Private Sector Deposits – Var. A.I. of the balance in real terms
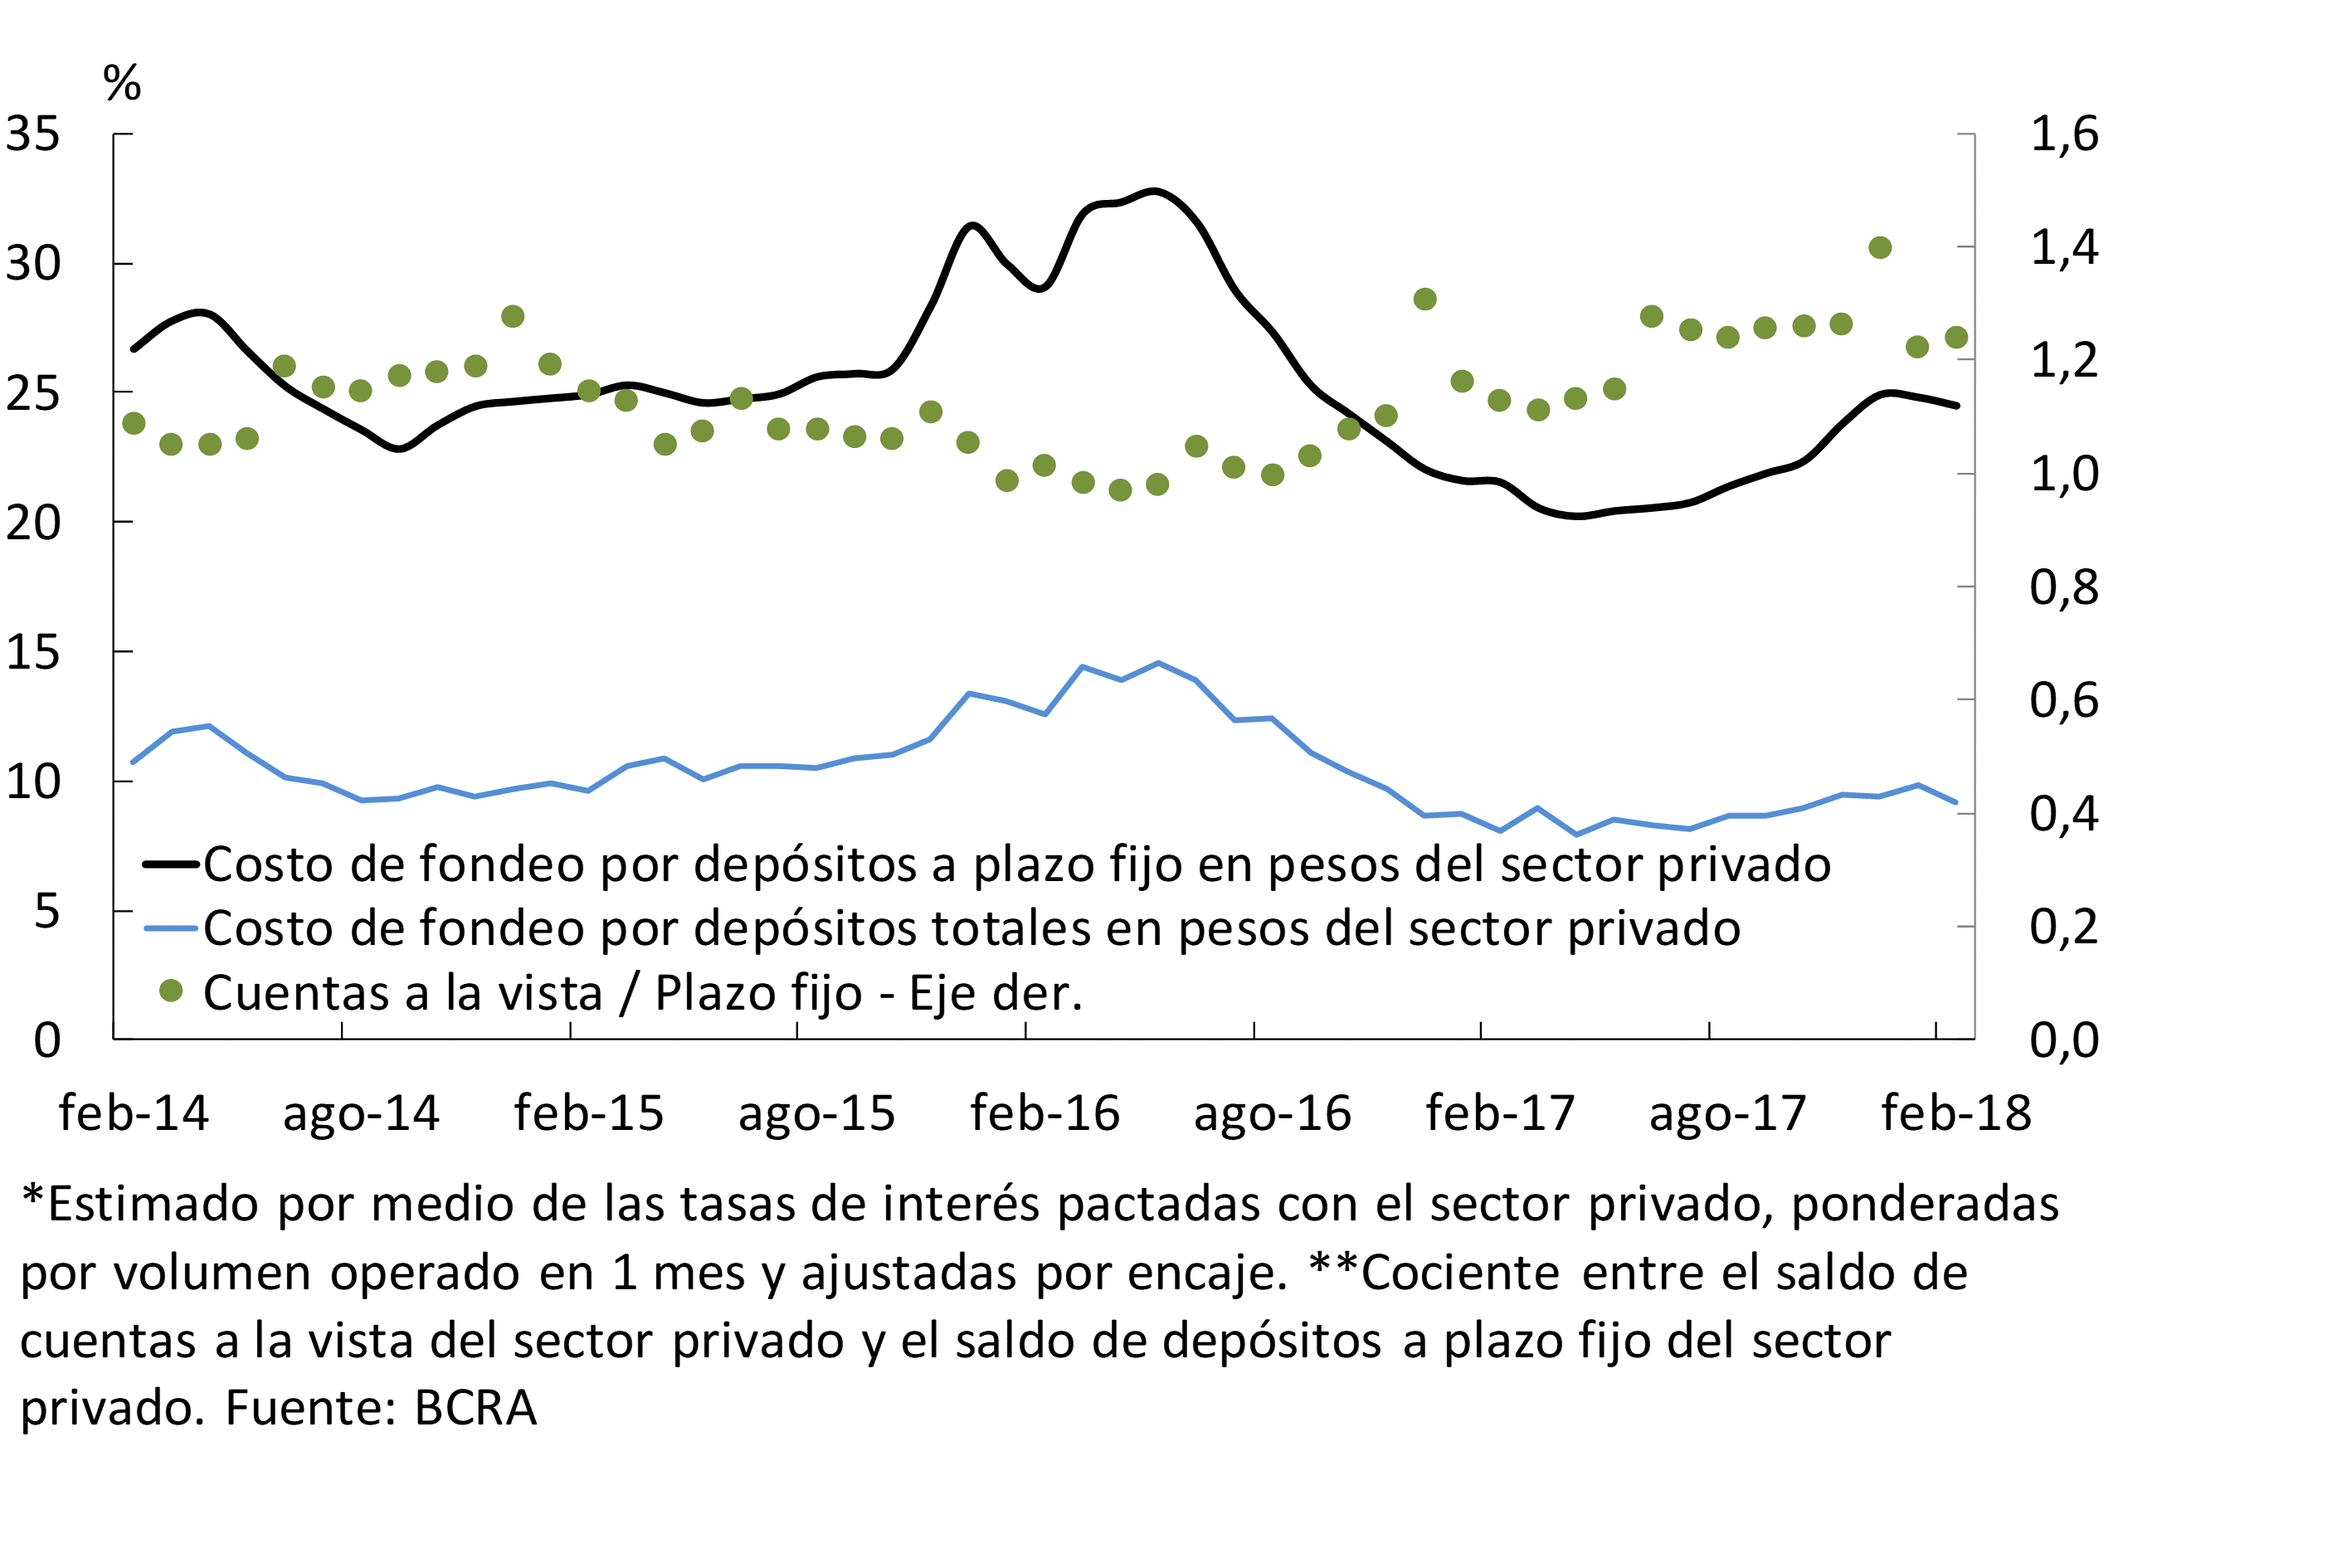
The funding cost for time deposits in pesos in the private sector fell slightly in February and compared to the end of 2017 (see Chart 7). This reduction occurs in the context of a fall in the average interest rate operated by fixed-term deposits in pesos (-0.3 p.p. compared to December 2017). This change occurred in the context of the reduction in the levels of monetary policy rates (-0.8 p.p. compared to January and -1.5 p.p. in the first two months of the year). In addition, the greater weighting of demand accounts in relation to term placements in the period contributed to reducing the total funding cost of the financial system aggregated by deposits in national currency.
Figure 7 | Funding Cost for Private Sector Deposits in Pesos* and Ratio between Demand and Time Deposits**
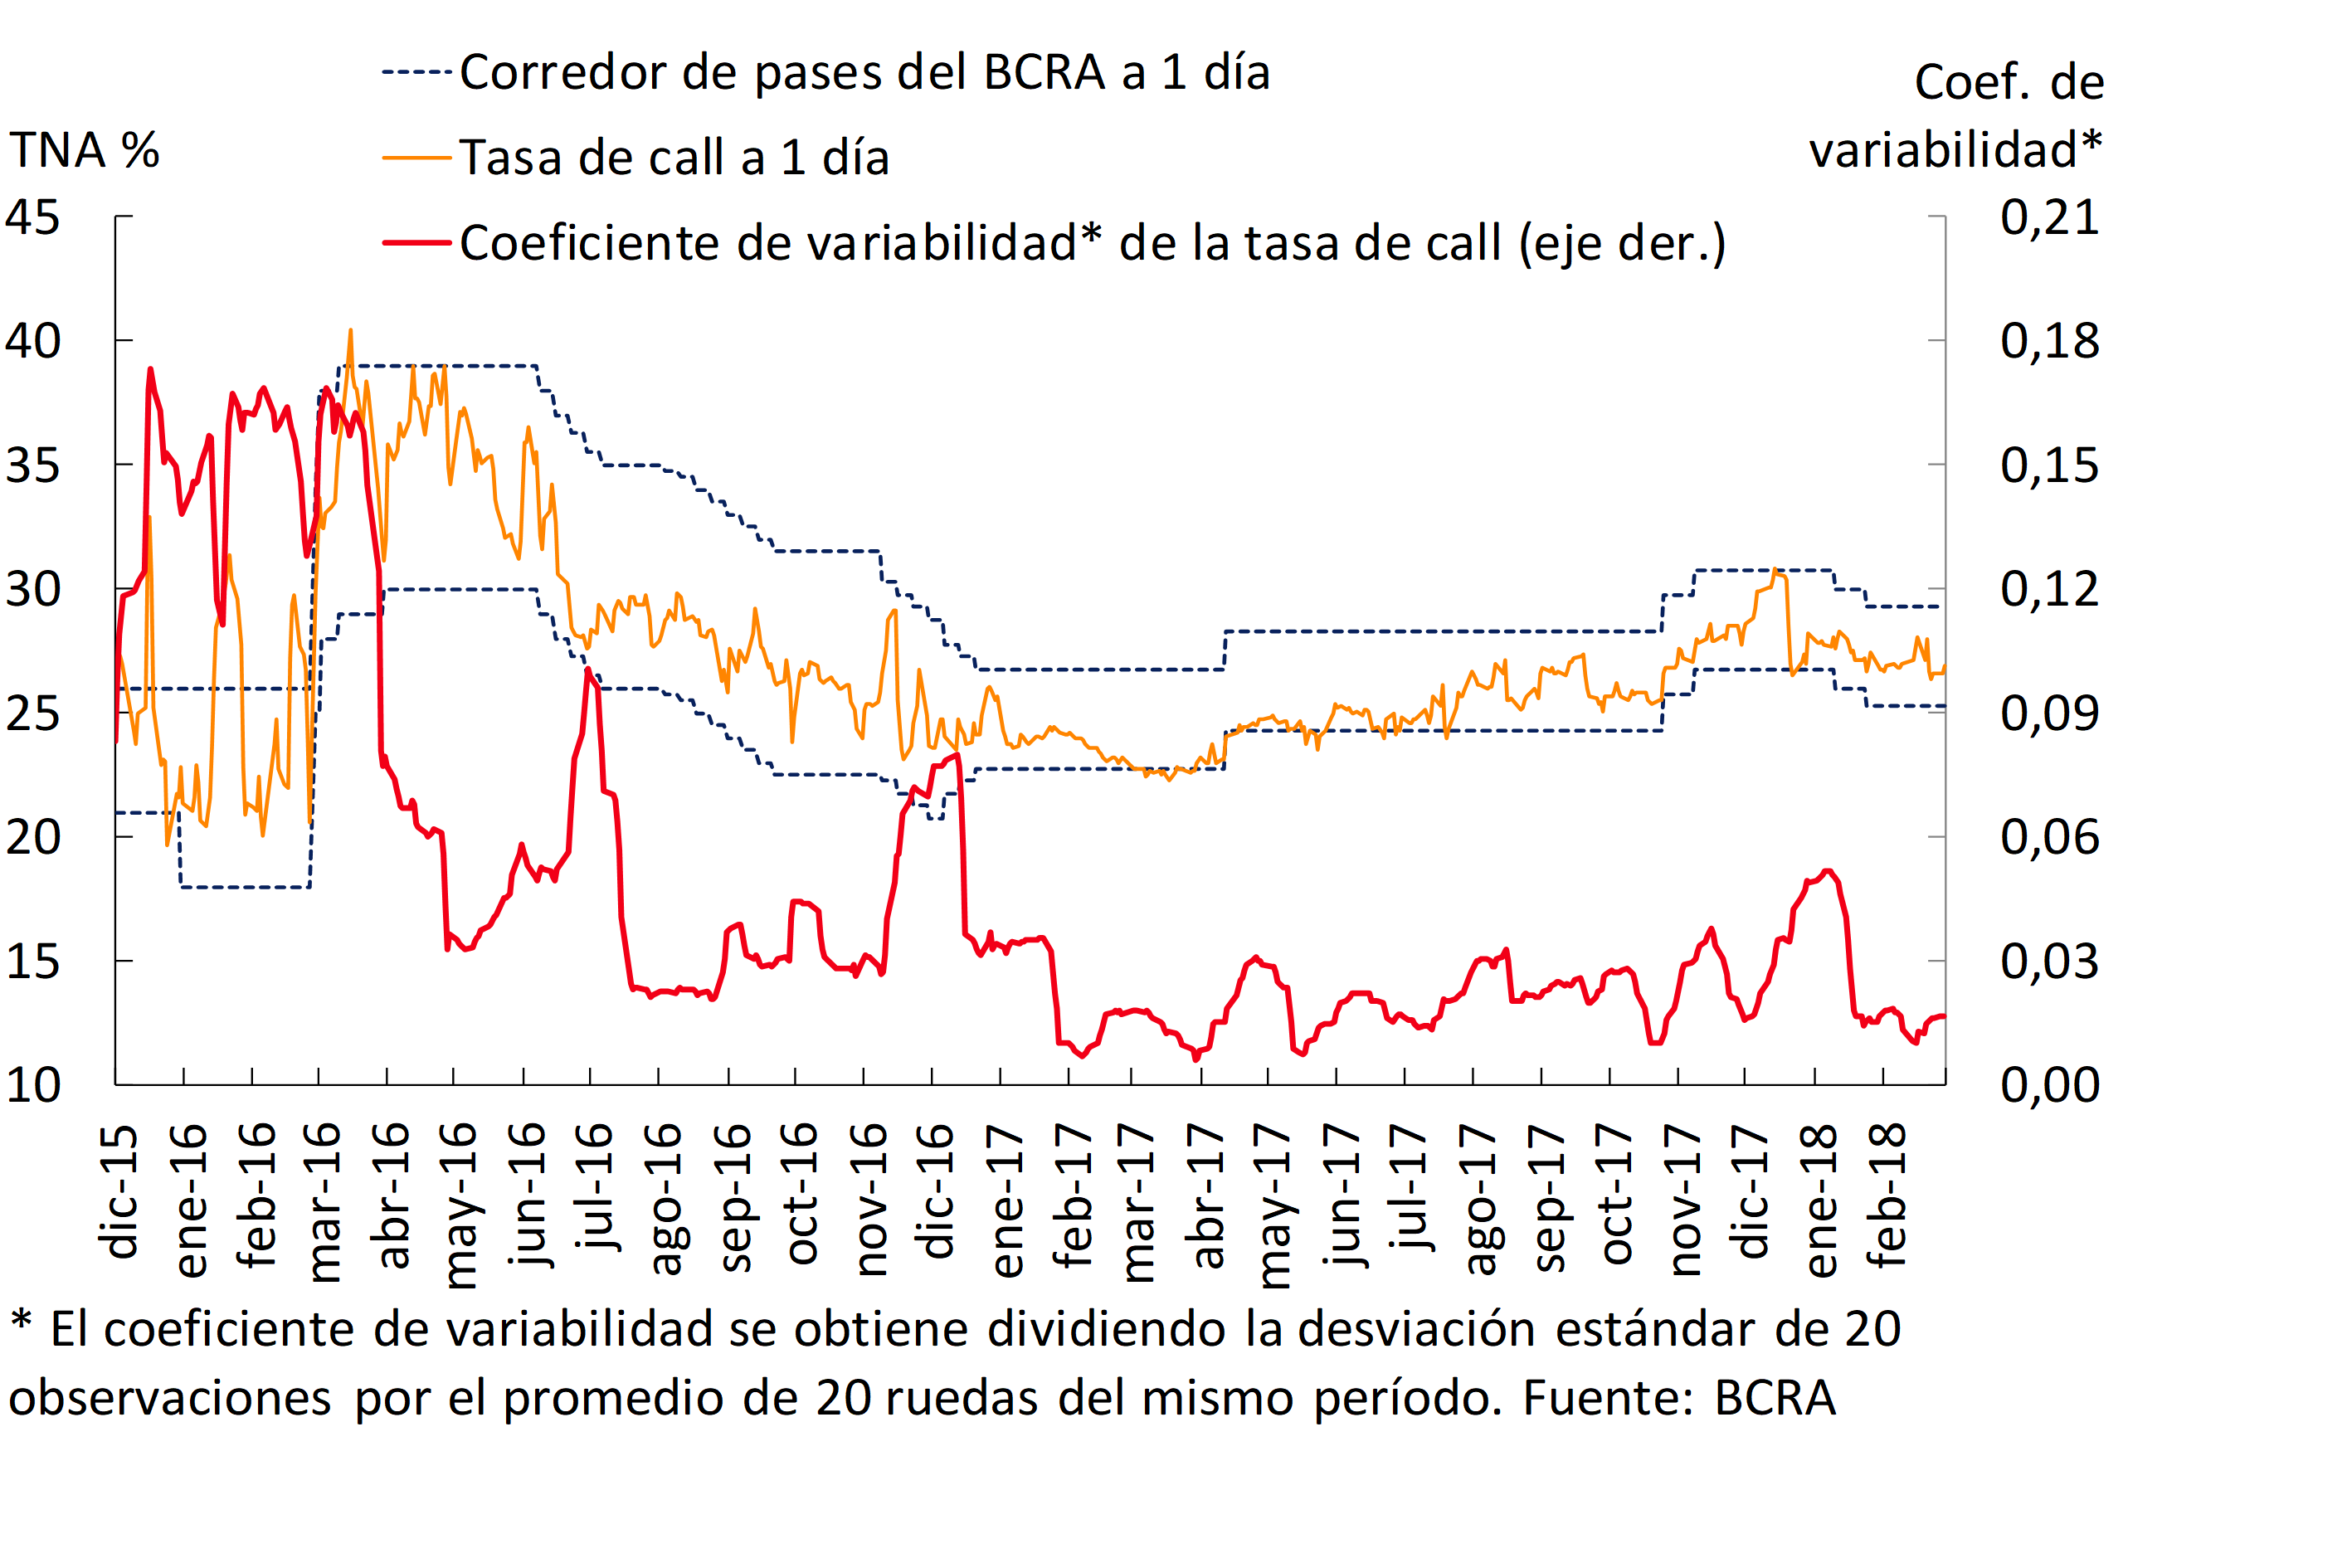
The average interest rates for loans between unsecured banks (call) fell in the month, placing most of the rounds within the rate corridor established by the BCRA (see Chart 8). The average monthly volume traded in February in this market was 15.3% higher than in January. In the month, limited volatility was maintained in the call rate.
Figure 8 | Interest Rates in Interfinancial Markets and Volatility
In February, the broad liquidity indicator – considering the banks’ current account at the BCRA, the availabilities, the passes with the BCRA, LEBAC and LELIQ – in domestic and foreign currency totaled 45.5% of the deposits of the financial system, remaining without significant changes with respect to the previous month (see Graph 9). However, there was an increase in ample liquidity in pesos of financial institutions to reach 43.4% (+2.5 p.p. compared to January) which was mainly driven by the behavior of public entities, although this indicator also increased in the group of private banks. This growth is almost entirely explained by the increase in the holdings of LELIQ, and, to a lesser extent, LEBAC. In a year-on-year comparison, ample liquidity was 5.3 p.p. of deposits below the value of February 2017, with a relatively greater drop in public banks. Liquidity in the strictest sense – considering only the availabilities and the balance of the current accounts that banks have in the BCRA – fell 2 p.p. of deposits in the second month of the year to reach 24.3%.
Figure 9 | Ample Liquidity of the Financial System
IV. Financing
The balance of total financing to the private sector remained unchanged from January in real terms. In the month, loans in foreign currency increased by 2.5%13, driven mainly by pre-financing for exports. Meanwhile, financing in national currency fell 0.4% in real terms, partly reflecting the effect of the summer recess. Lines in pesos with real collateral – mainly mortgage lines – and advances showed growth compared to January when adjusted for inflation, while the rest decreased.
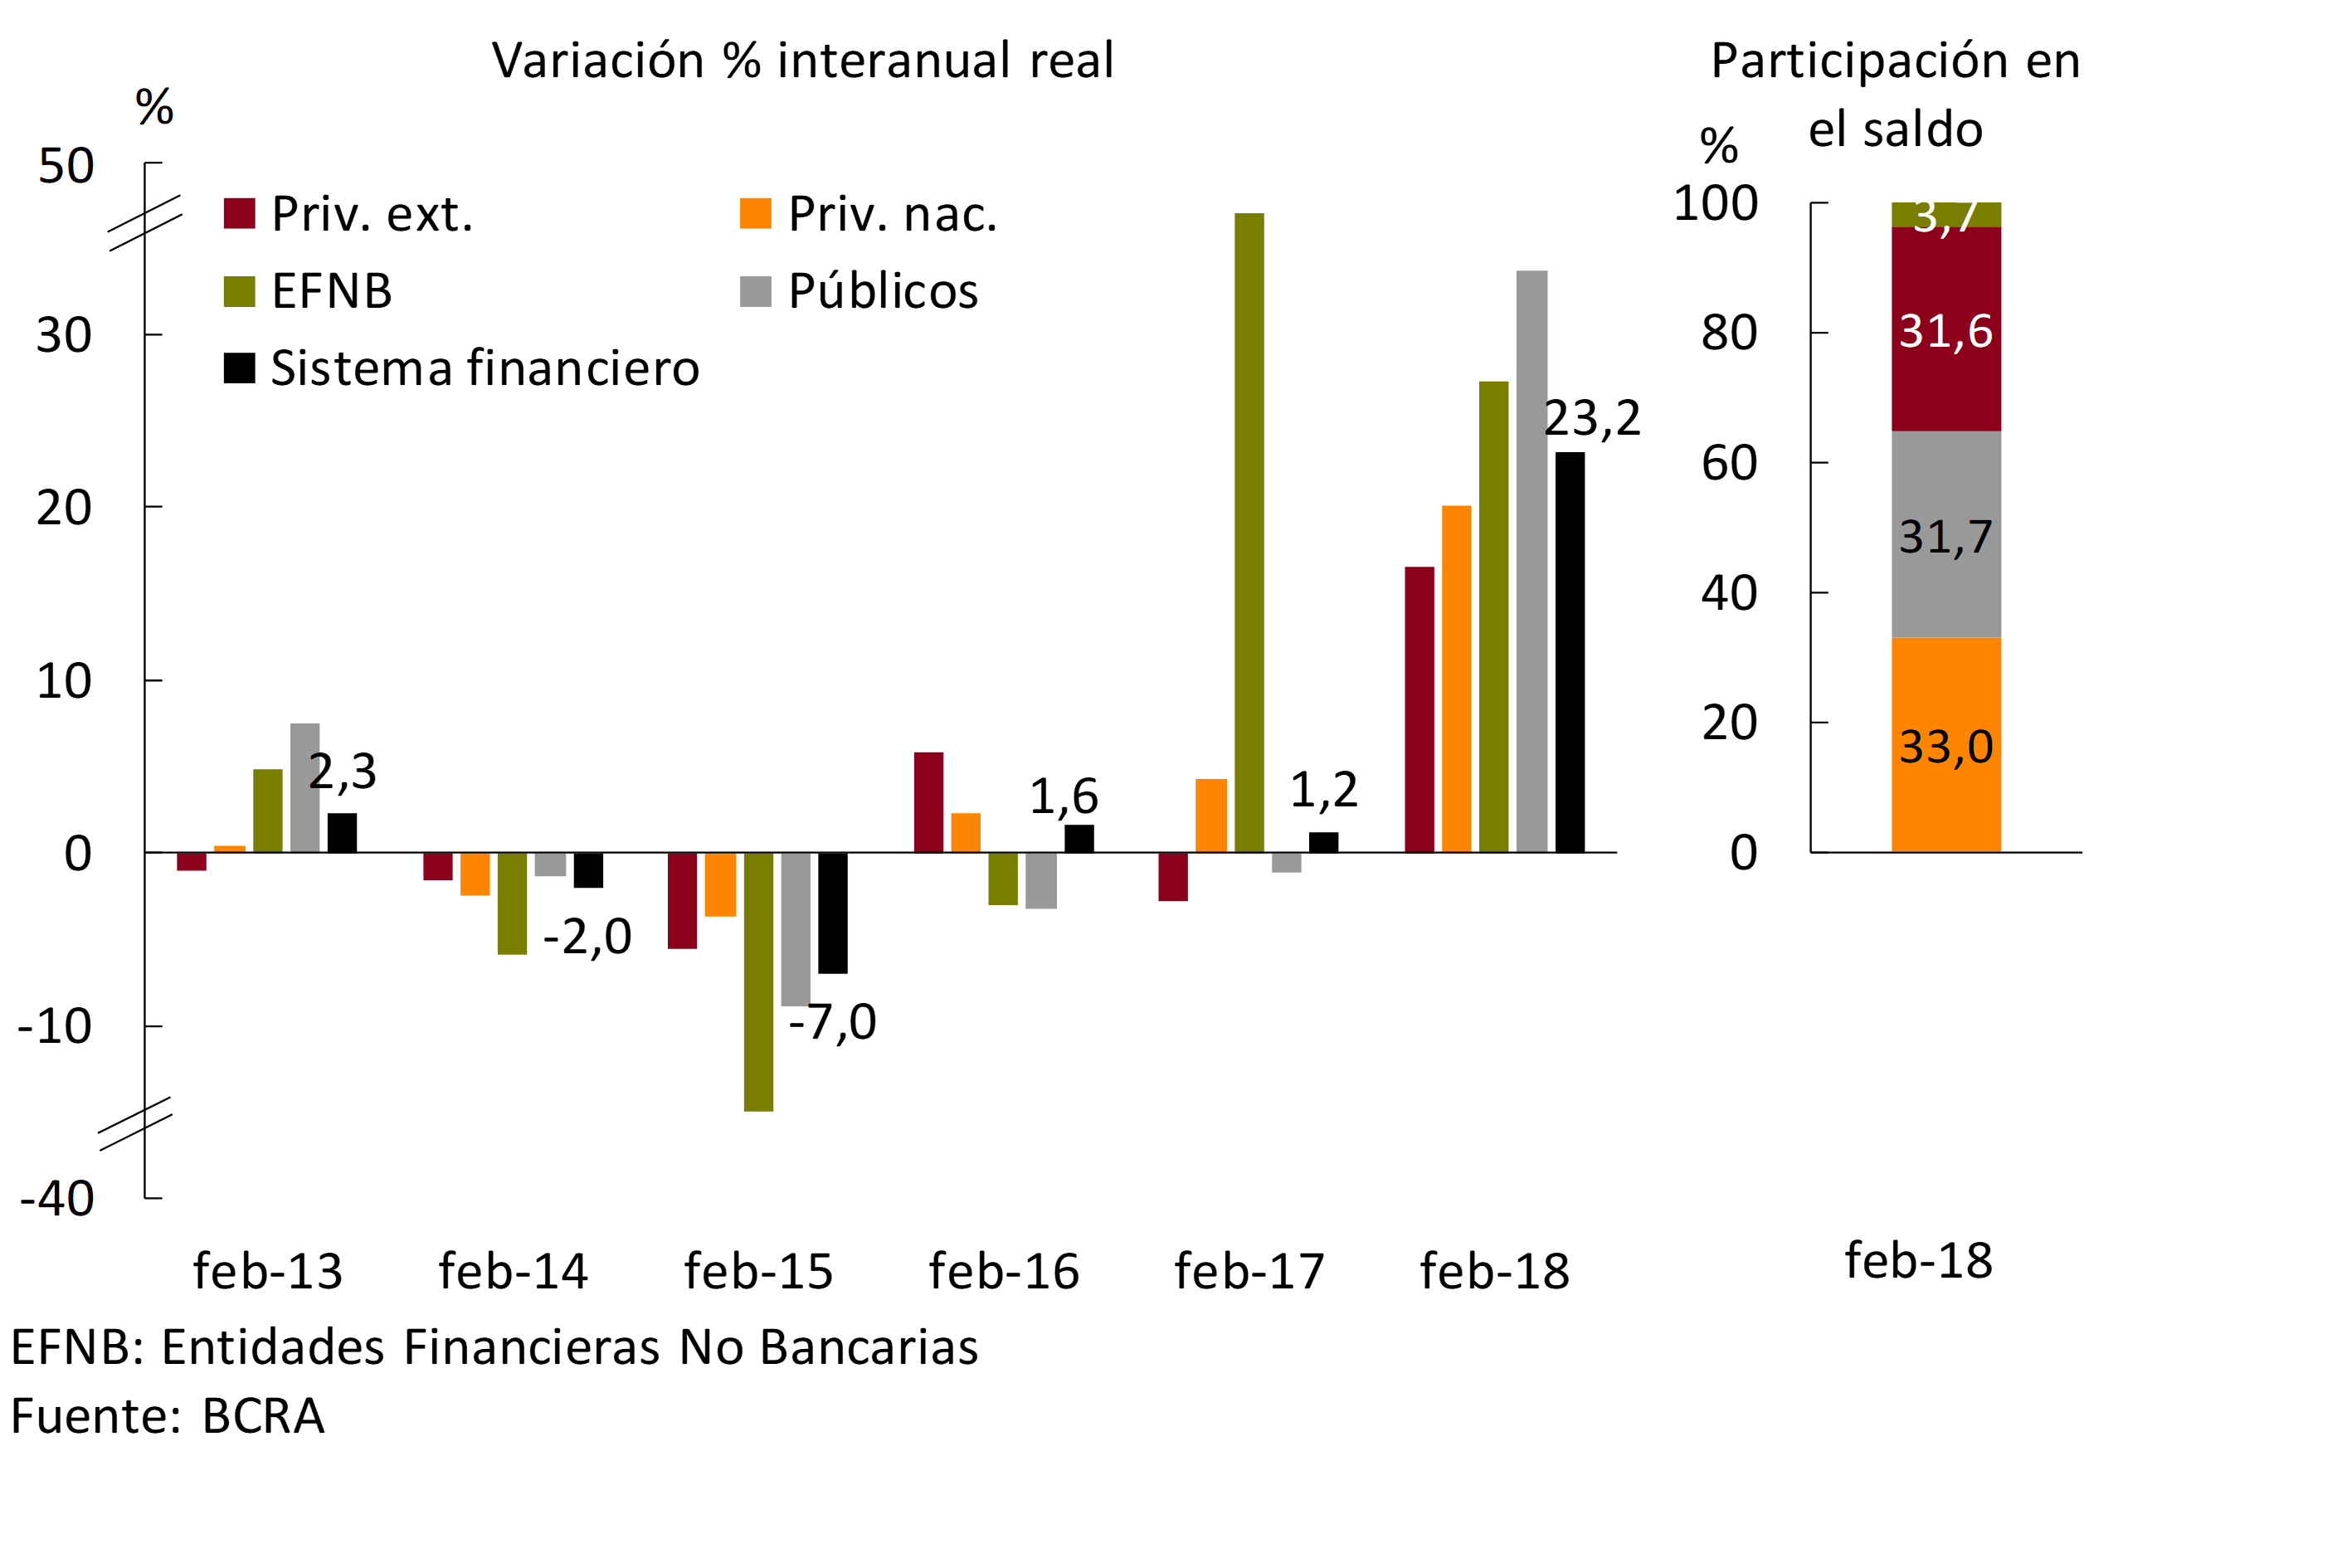
In a year-on-year comparison, the balance of credit to the private sector increased 23.2% in February in real terms (see Chart 10), 1.1 p.p. above last month’s value and 22 p.p. more than the figure of a year ago. The real year-on-year increase in financing to companies and households was widespread among all groups of financial institutions, with public banks standing out (see Graph 11). Differentiating by currency, in the last twelve months, loans in foreign currency to companies and families increased by 61.4%14, while lines in pesos increased at a rate of 16% when adjusting for inflation.
Figure 10 | Total Credit Balance to the Private Sector in Real Terms
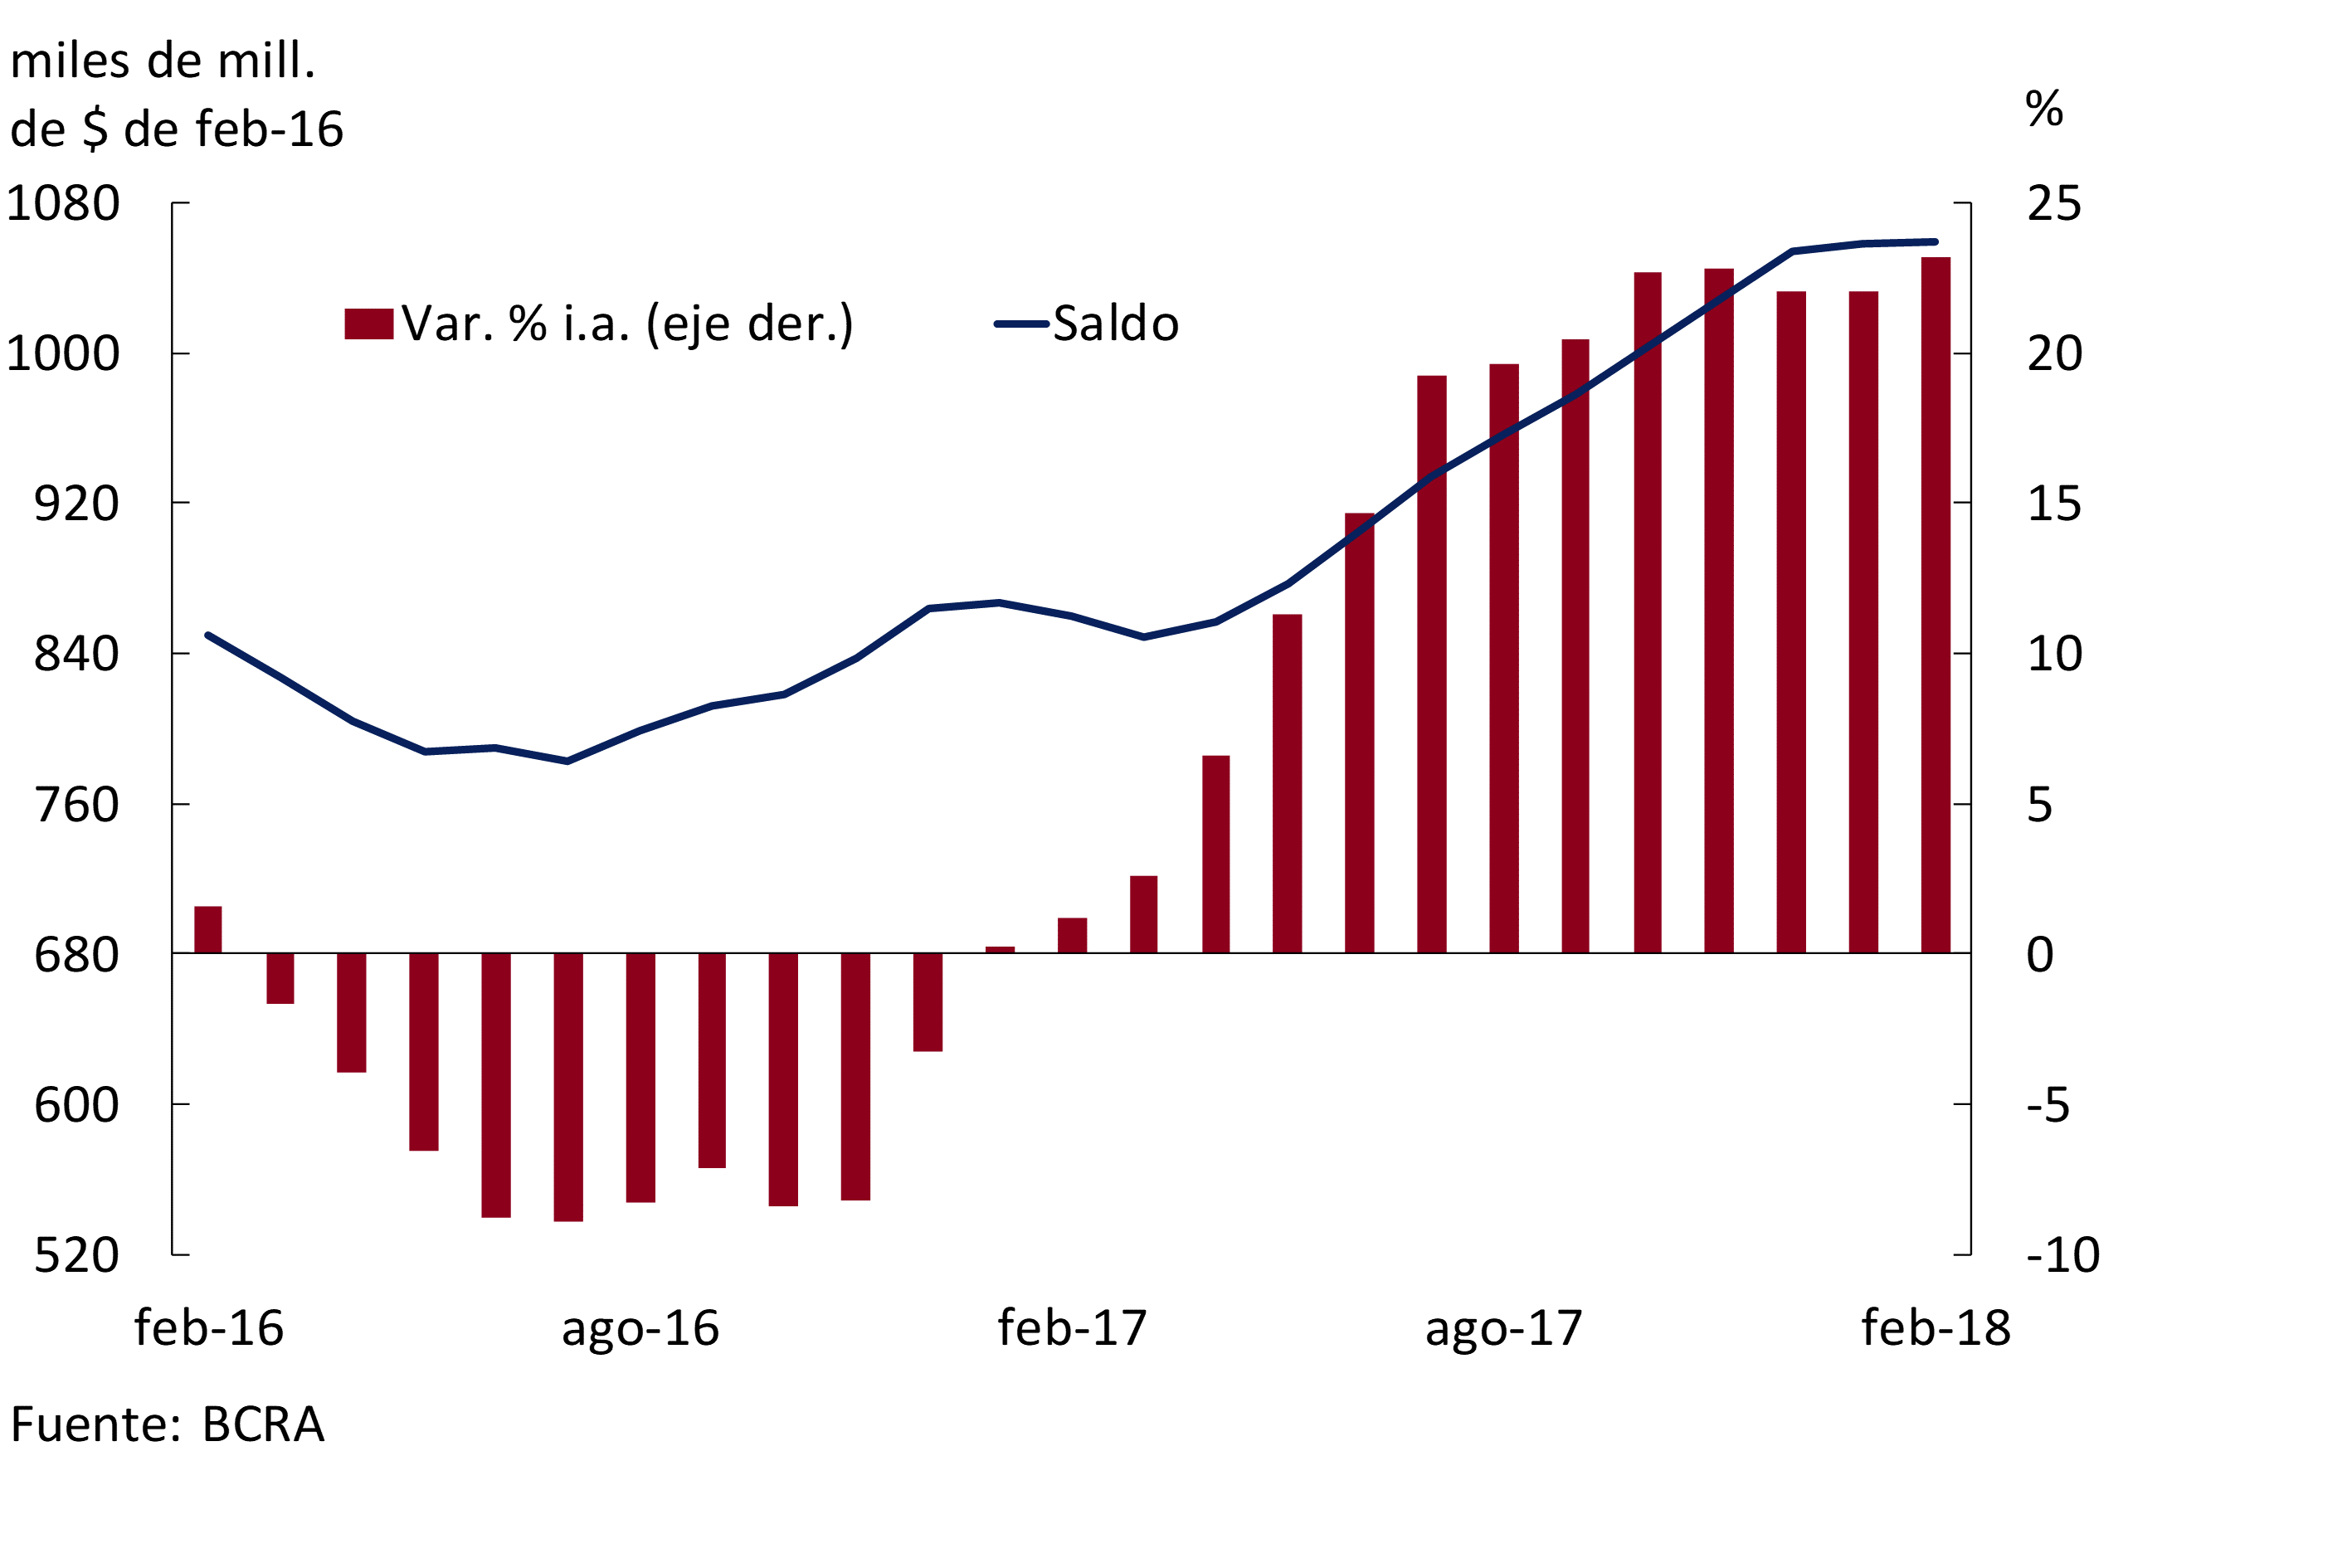
Figure 11 | Total Credit Balance to the Private Sector in Real Terms
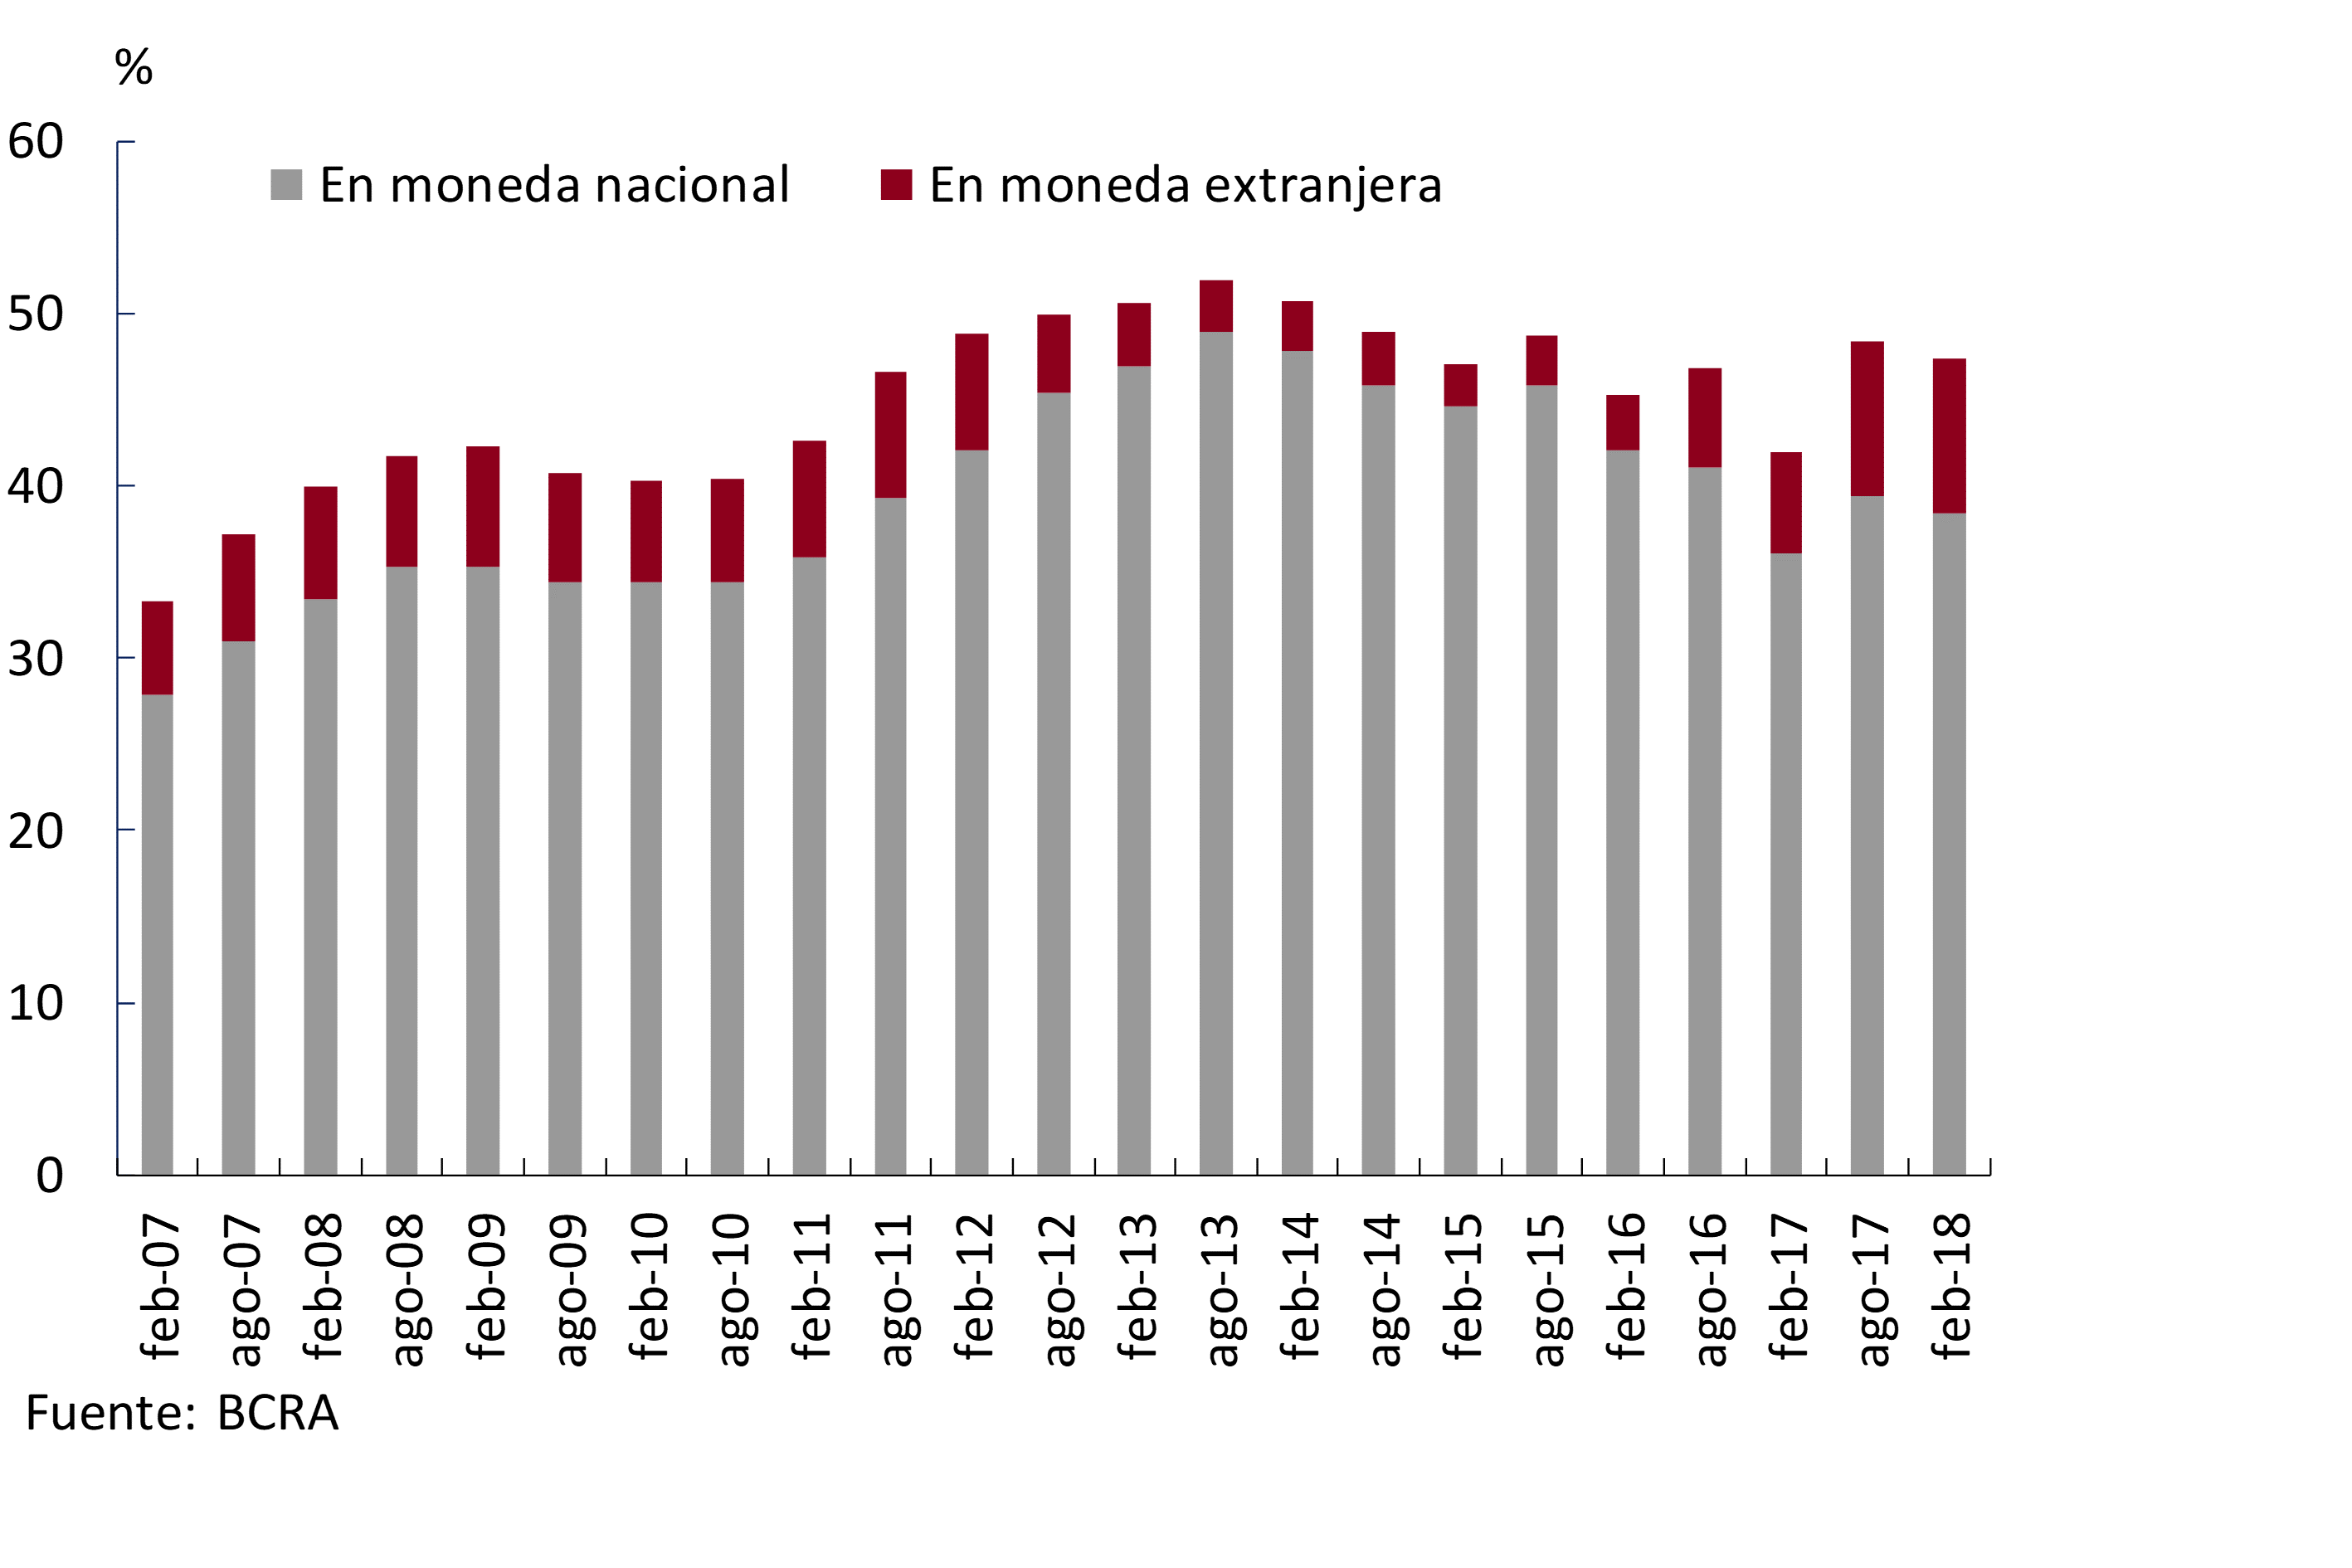
The performance of financing to companies and households in the last year was reflected in an increase in their participation in the total assets of the financial system (see Chart 12). Thus, in February, total financing to the private sector represented 47% of net assets, exceeding the level of a year ago by 5 p.p. Although most of this ratio is explained by loans in local currency, in recent months there has been an increase in the relevance of loans in foreign currency in bank assets, from low levels.
Figure 12 | Total Credit Balance to the Private Sector in Terms of Net Assets
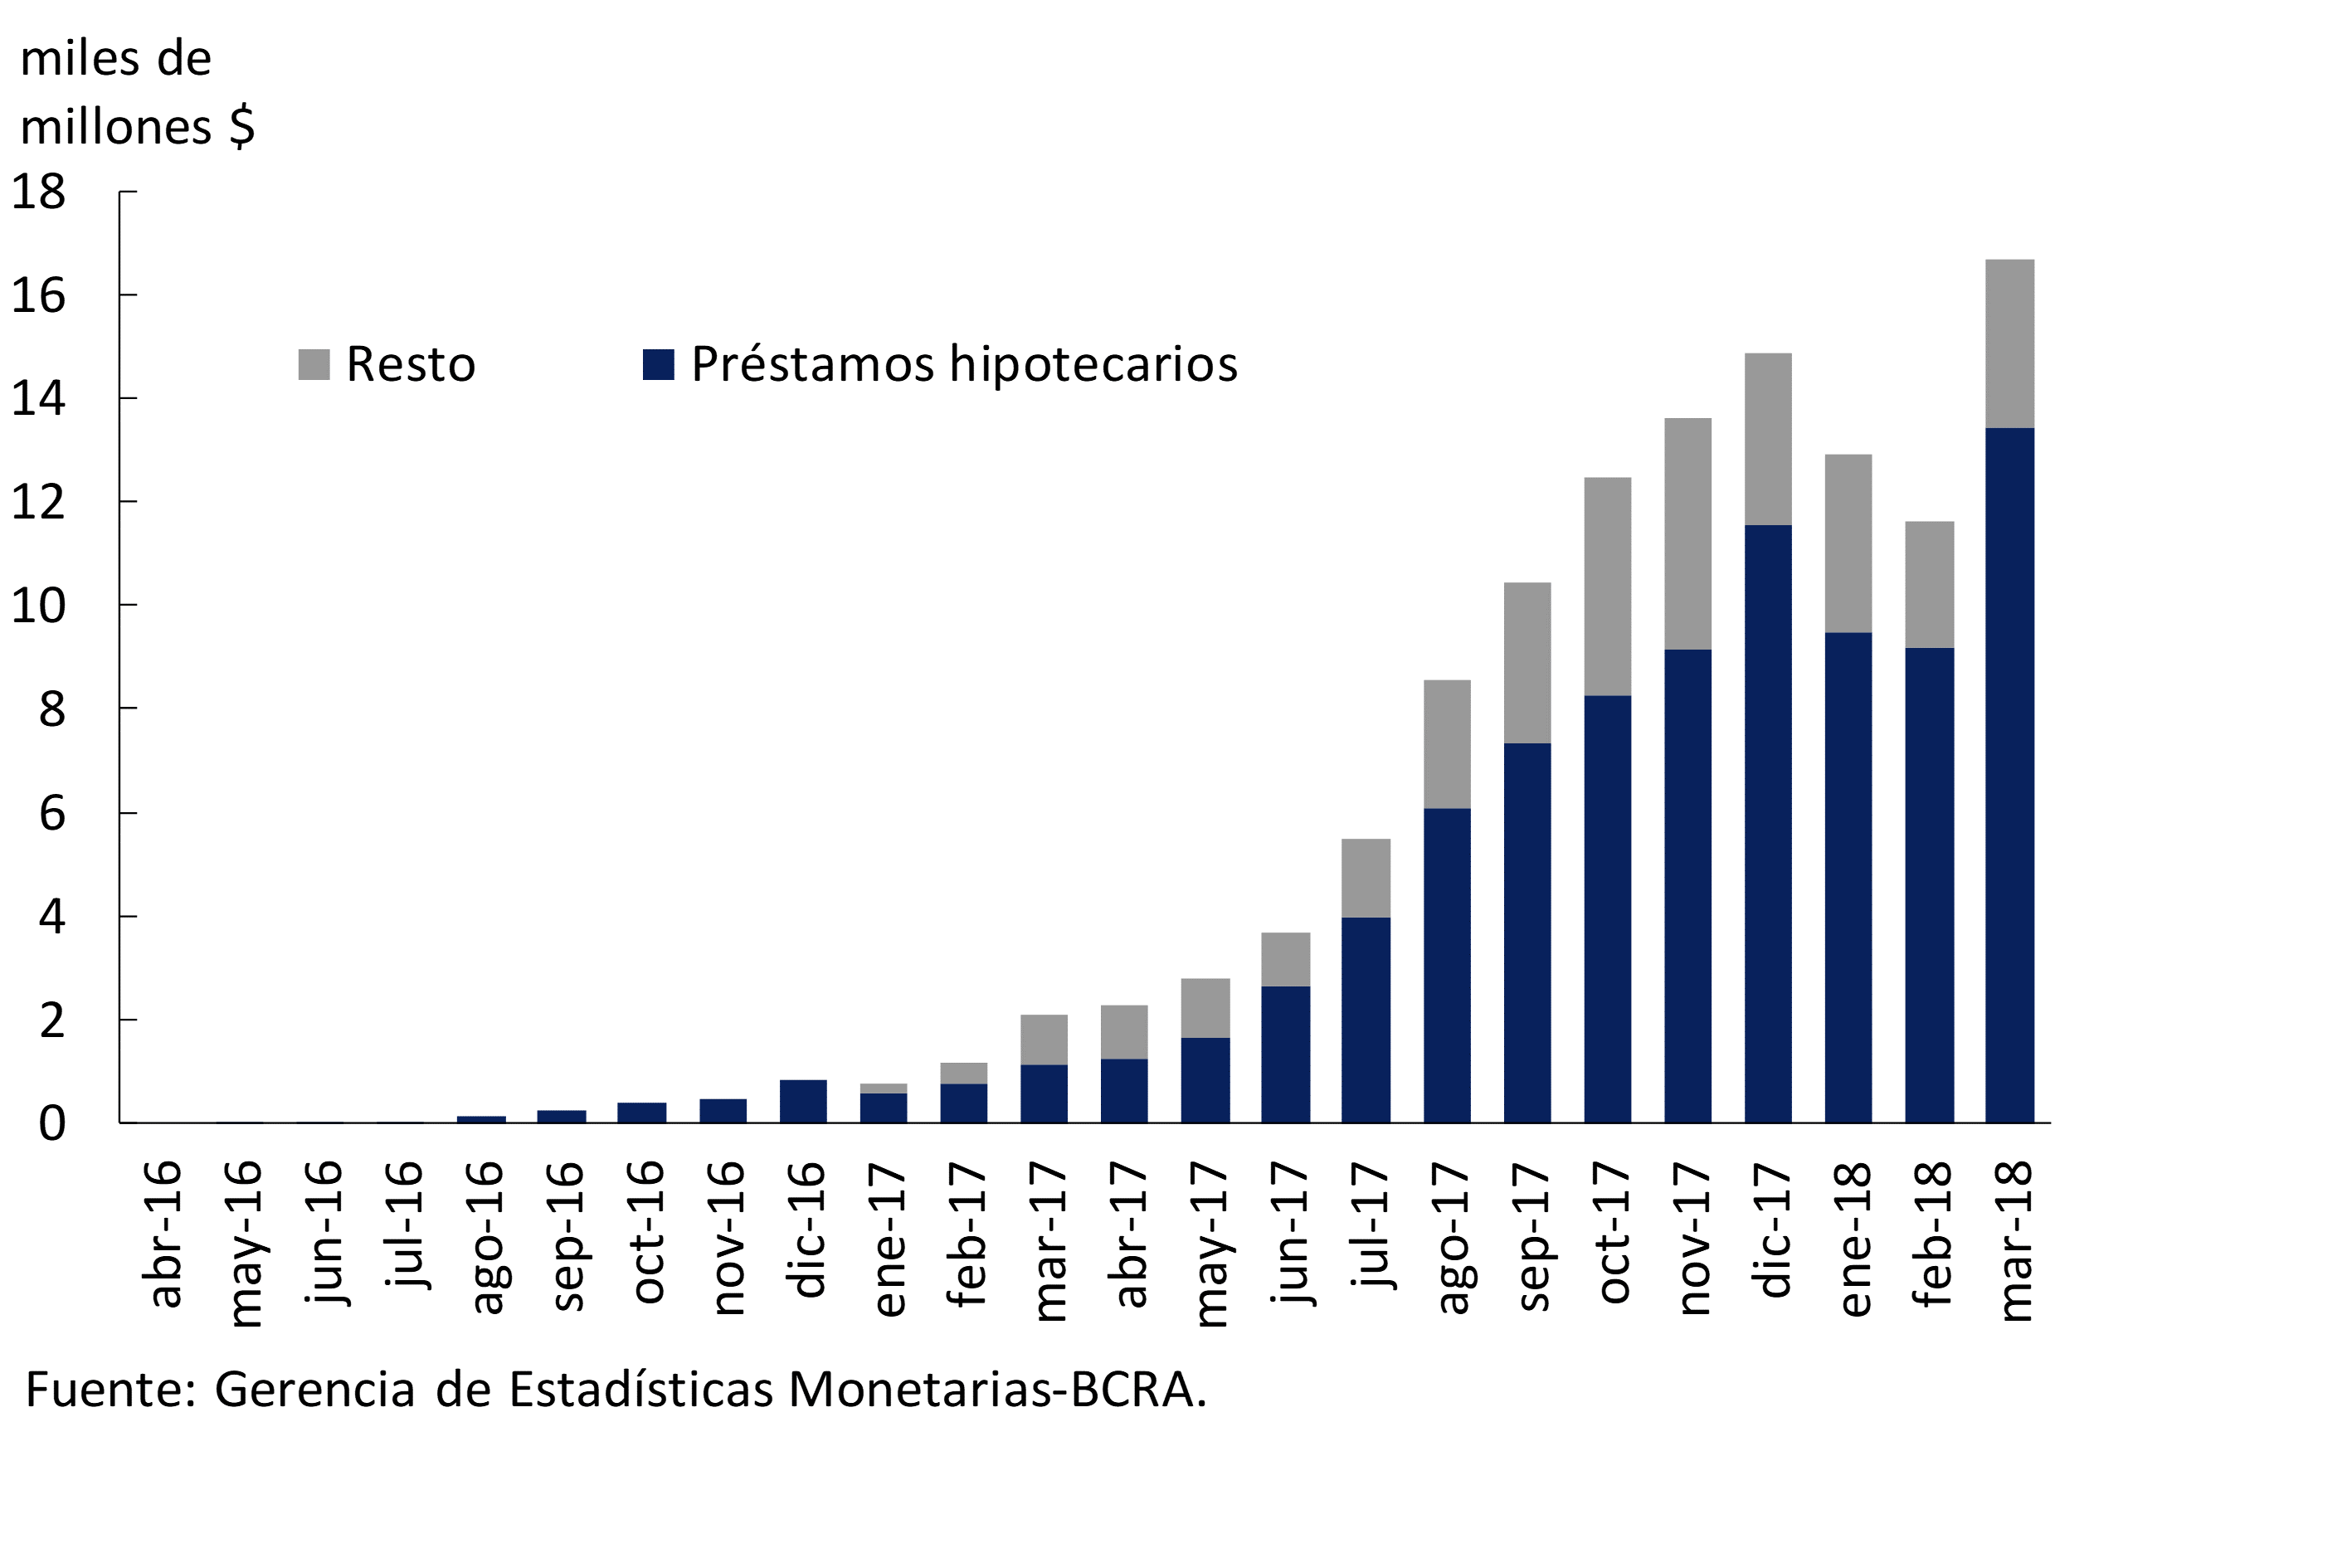
In March, more than $16,600 million in financing was granted to the private sector in UVA, more than 80% of which corresponded to mortgage loans (see Graph 13). Public banks continued to be the most dynamic in the origination of this type of loans, followed by national private banks. In this context, as of February 2018, the banks as a whole registered a balance of almost $117,000 million of loans in UVA15 (72% in mortgages, 23% in personal, 5% in pledges and 1% in documents).
Figure 13 | UVA Financing – Amounts Granted
Specifically in the mortgage lines to families, at the beginning of the year it was observed that of the total outstanding balance of approximately $113,000 million, 61% corresponded to loans denominated in UVA (see Graph 14).
Figure 14 | Mortgage Loans to Individuals – January 2018
The average nominal active interest rate operated in national currency with the private sector16 remained without significant changes with respect to January. In particular, the interest rates agreed on mortgages and cards increased, while on the rest of the lines they were reduced. Considering the average interest rates operated in UVA, in the month those agreed in personal were reduced, to 11.3%. On the other hand, interest rates on documents, pledges and mortgages adjustable by UVA, increased slightly in February, to 9.6%, 11.8% and 4.7% respectively.
V. Portfolio Quality
In February, the non-bank ratio of credit to the private sector increased slightly to 1.9%, mainly due to the performance of non-bank financial institutions and national private banks (see Chart 15). This coefficient was at a level similar to that of a year ago, with heterogeneous behaviors among groups of banks: a fall in public banks and slight increases in the remaining groups.
Figure 15 | Irregularity of Credit to the Private Sector – Irregular portfolio / Total financing (%)
Considering the distribution of the irregularity ratio among financial institutions, a lower dispersion was observed in the period compared to the levels of a year ago (see Graph 16). In particular, during the period, the number of banks with extreme delinquency values (both low and high) decreased and the number of banks with intermediate values, closer to the average of the financial system, increased.
Figure 16 | Distribution of Irregular Financing to the Private Sector – Irregular Portfolio / Financing (%)
In February, the irregularity of private sector loans channeled to consumption and housing stood at 3%, in line with the value of January and slightly above the level of a year ago (see Graph 15). For its part, non-performing loans on commercial loans stood at 1% in the period, falling 0.2 p.p. in a year-on-year comparison.
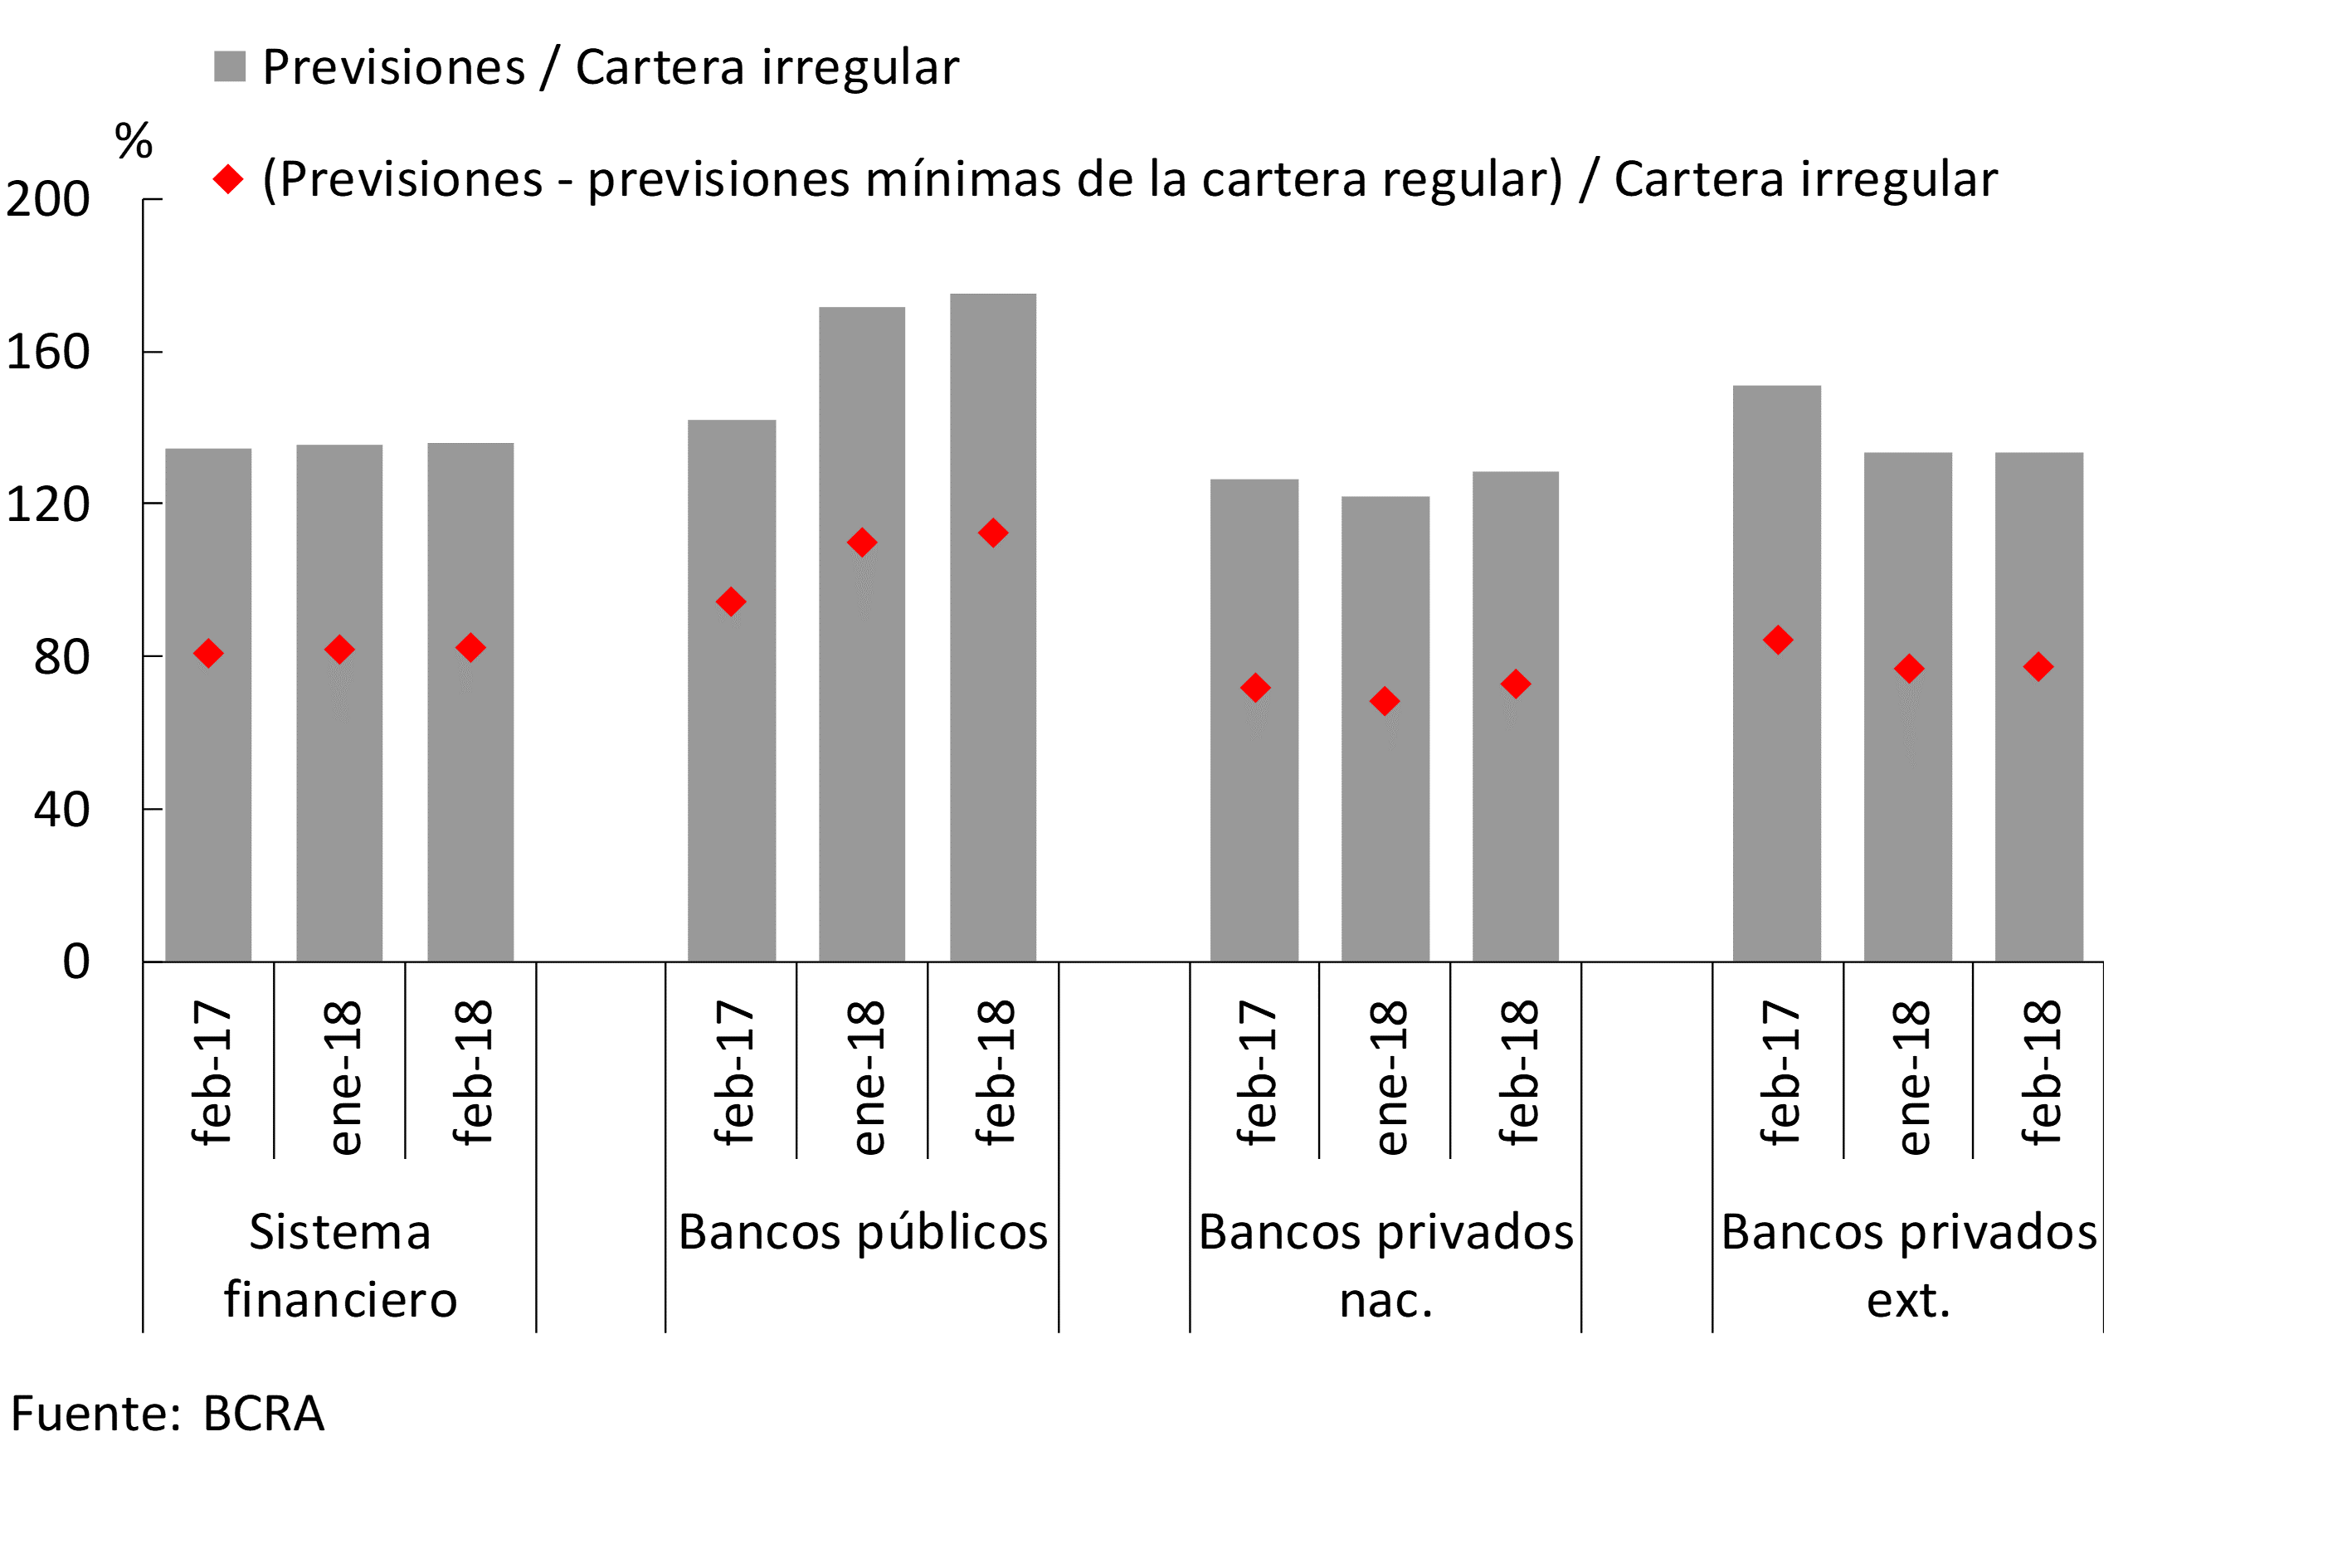
In the second month of the year, the balance of accounting forecasts of all financial institutions reached an amount equivalent to 136% of loans in an irregular situation (see Graph 17). Excluding the minimum forecasts attributable to the portfolio in regular standing, this ratio would stand at 82% in the period, slightly above the prior-year level.
Figure 17 | Forecasts and Irregular Portfolio by Group of Banks
VI. Solvency
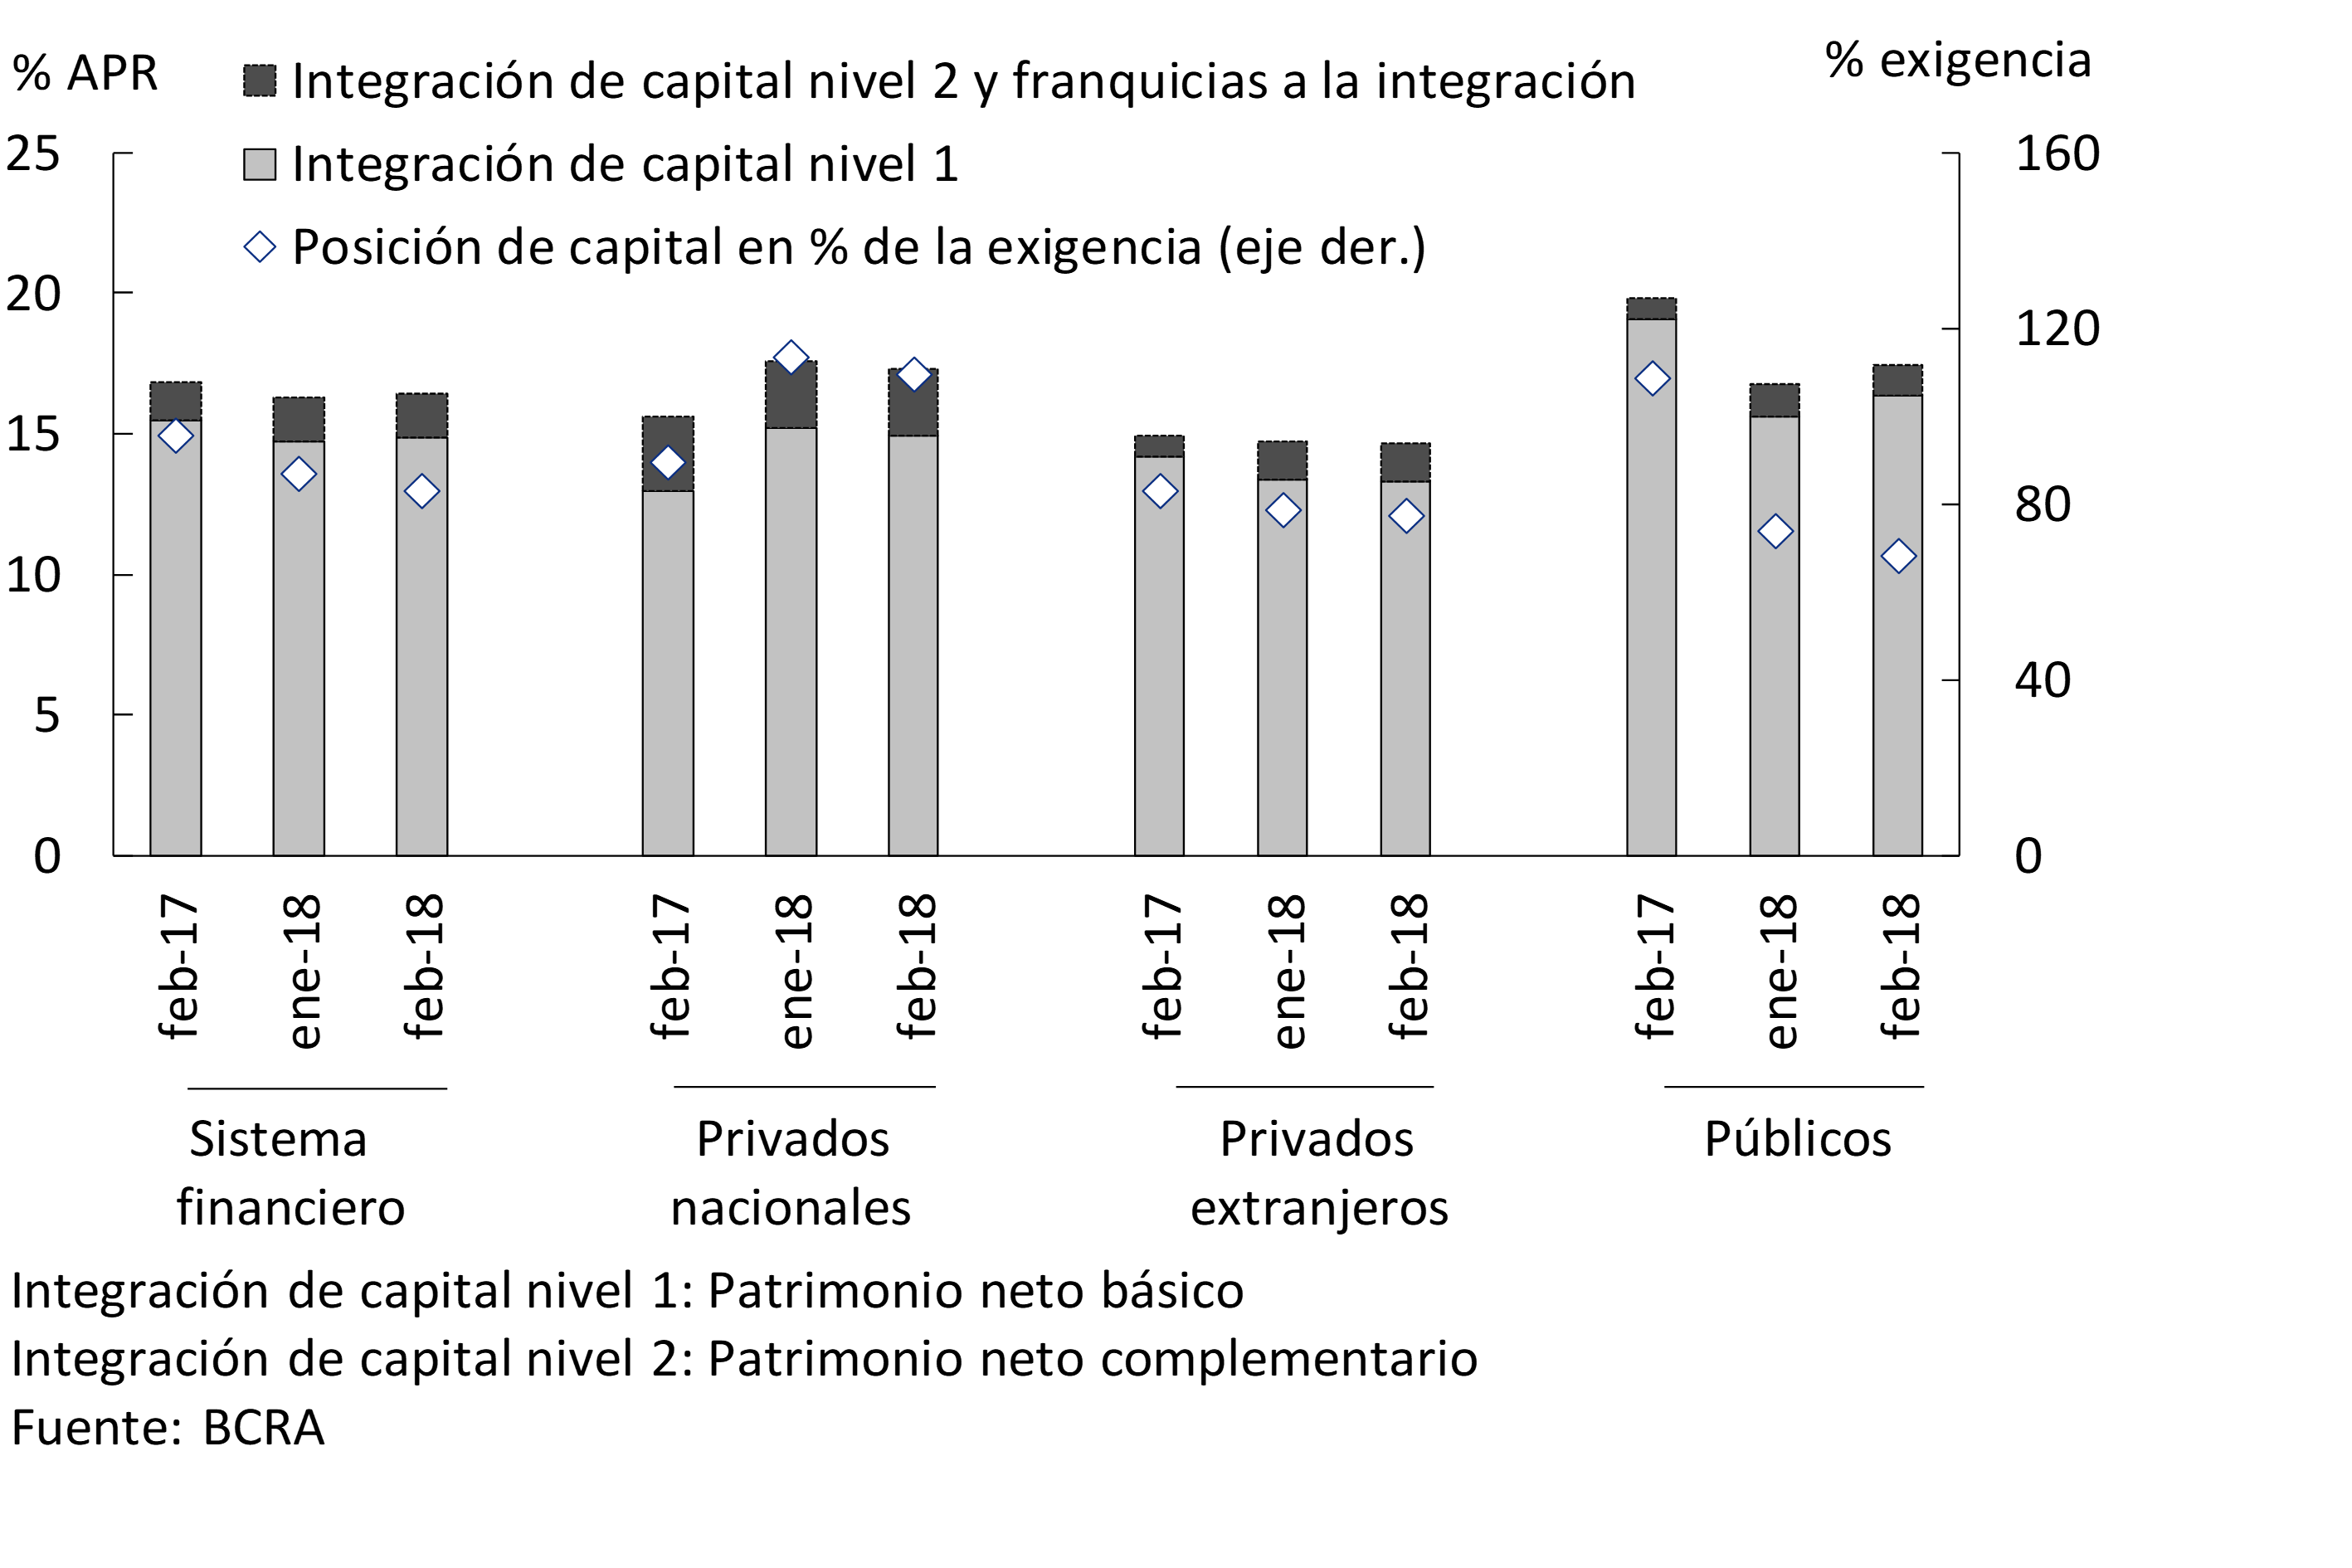
At the aggregate level, the sector’s solvency ratios remained relatively high in February. The capital integration of the financial system represented 16.4% of risk-weighted assets (RWA) in the month, a slightly higher figure than in January, mainly due to the performance of public banks17 (see Chart 18). Tier 1 capital18 totaled 14.8% of RWAs in the period – 90% of total capital. The excess integration of regulatory capital reached 83% of the regulatory requirement.
Figure 18 | Integration and Excess Regulatory Capital (Position)
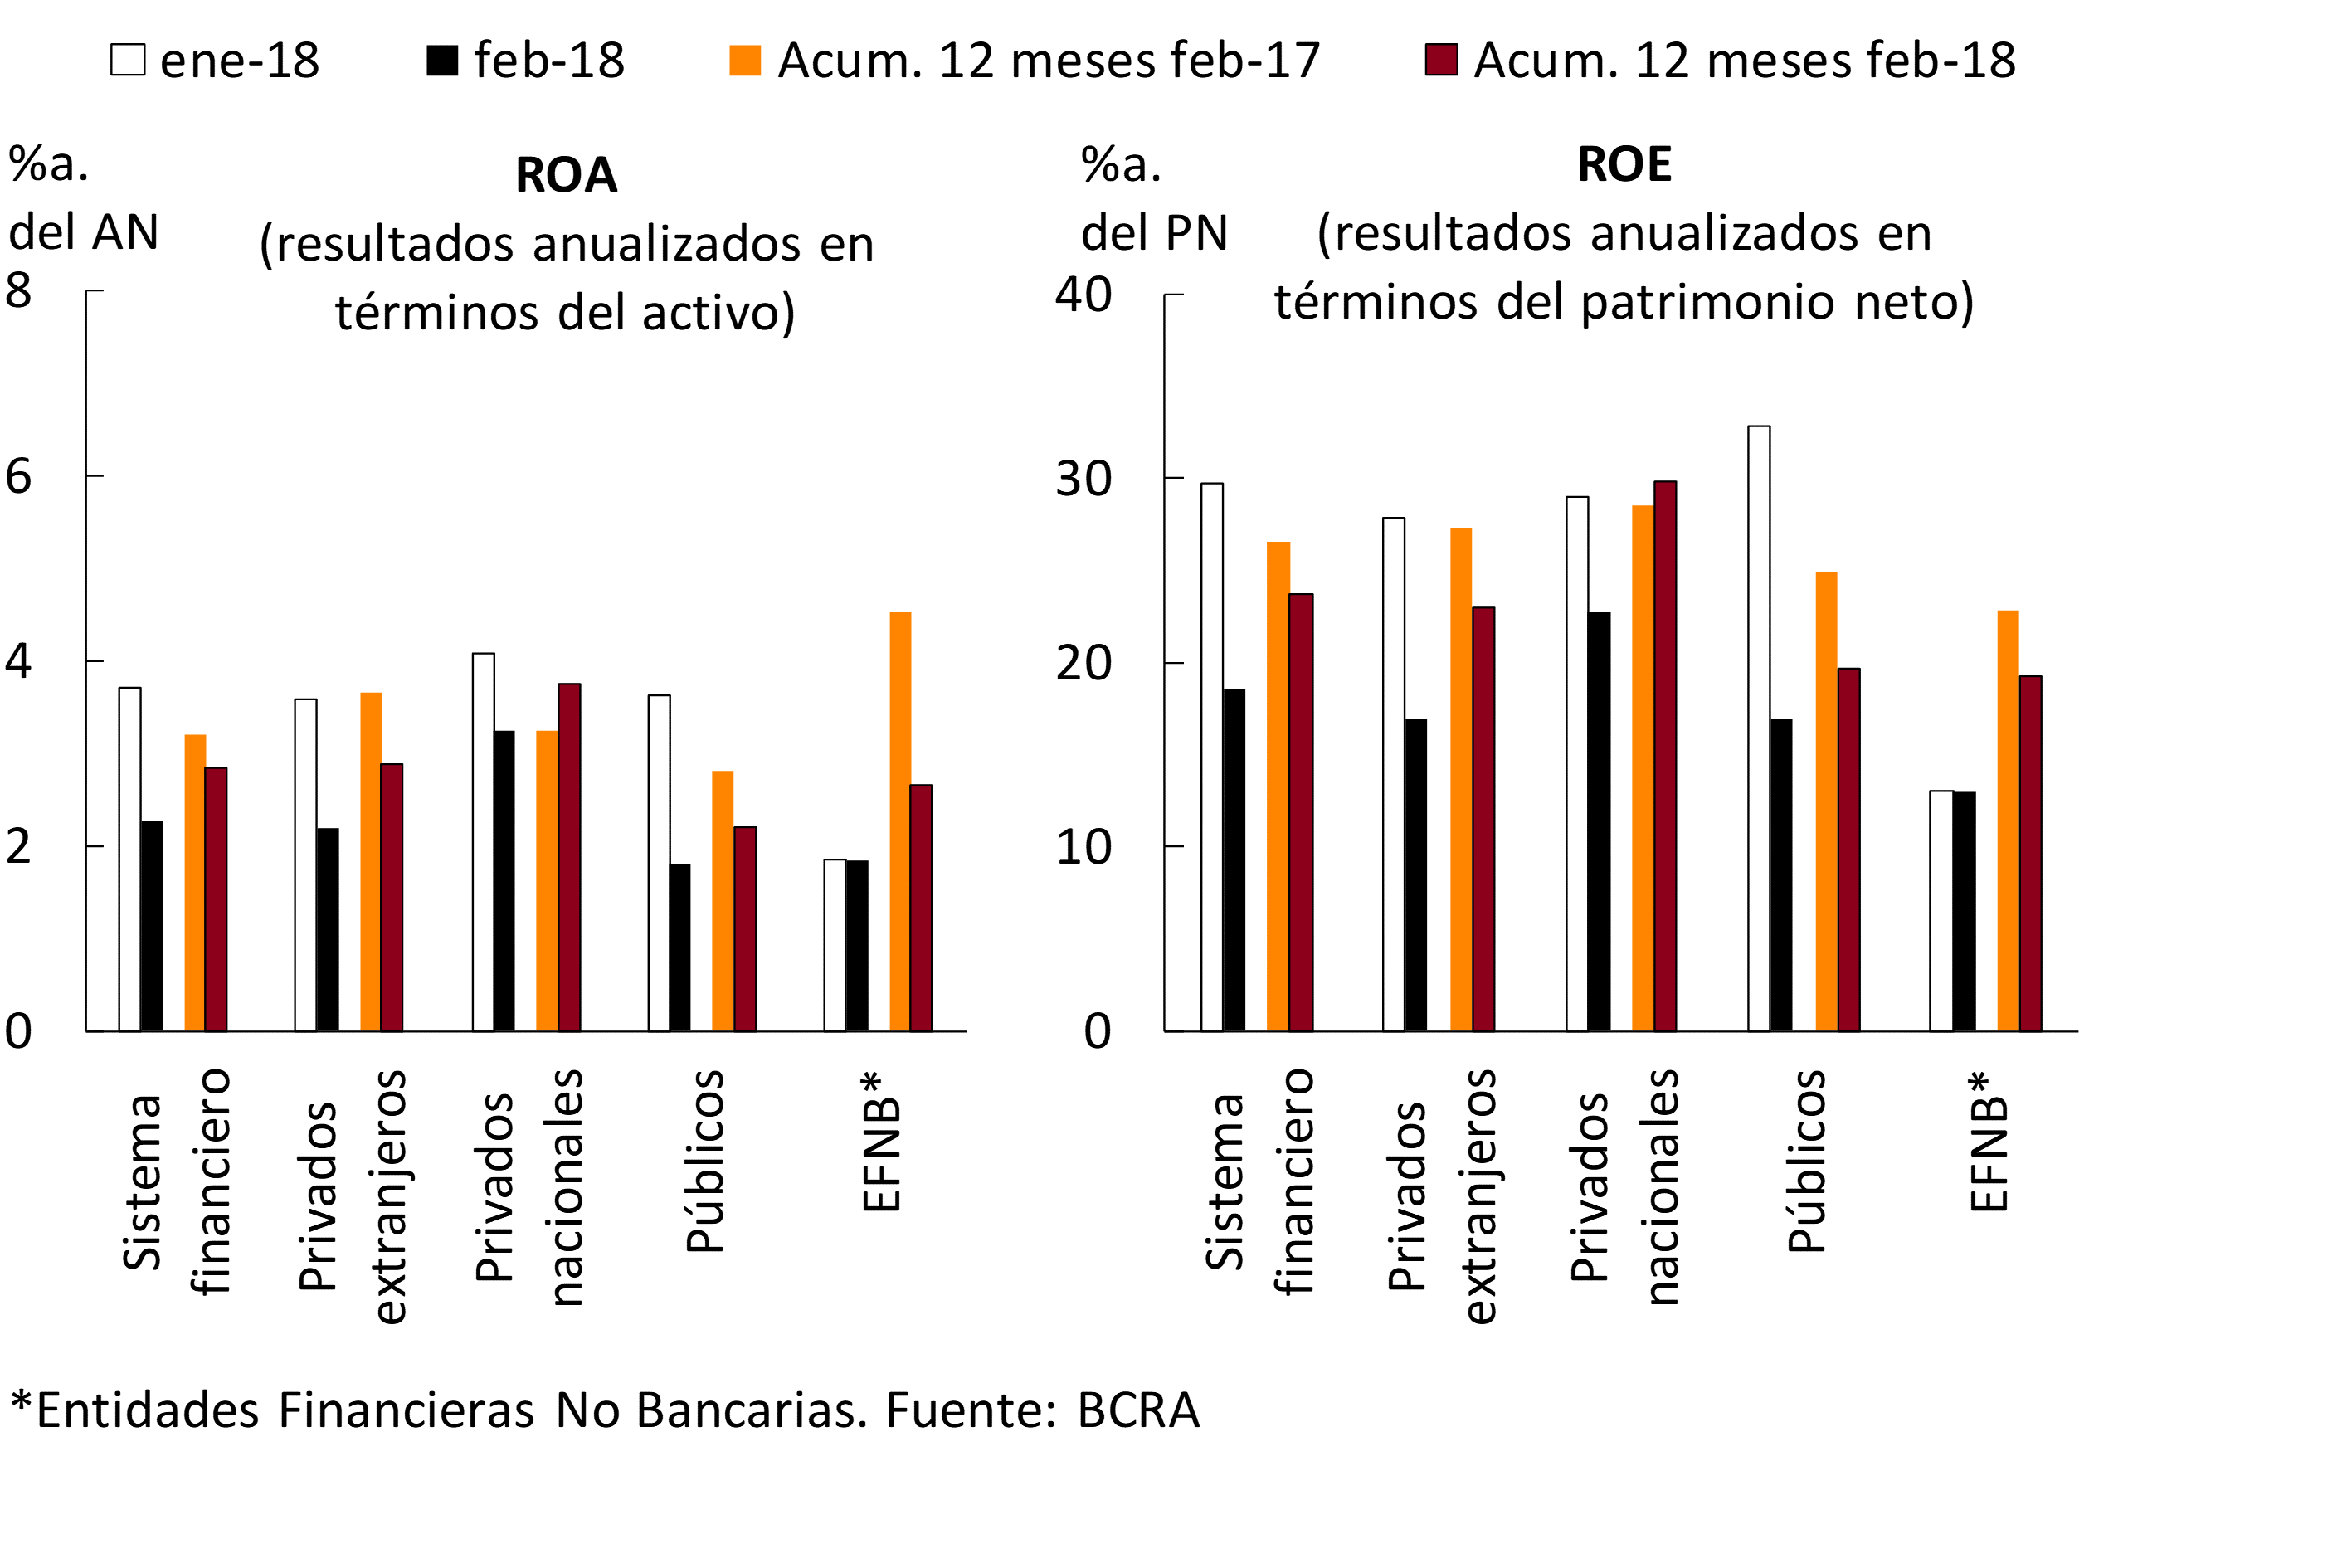
The gains accrued in February by the financial system totaled 2.3% annualized (y.) of assets (18.5% y. of net worth), falling compared to the January level. The group of private banks obtained gains of 2.7% of assets in the month. At the aggregate level, the accumulated accounting profits in the 12 months to February represented 2.8% of assets19 (these results reached $84,544 million, with an increase of 21.4% YoY), 0.4 p.p. less in a year-on-year comparison. In the last 12 months, the results totaled 23.7% of net worth (ROE), 2.9 p.p. lower in a year-on-year comparison (see Chart 19). For its part, the group of private banks obtained a cumulative ROA in 12 months of 3.3%, without significant changes in a year-on-year comparison.
Figure 19 | Income Statement by Financial Institution Group
The monthly financial margin totaled 9.2% of assets, falling 2.9 p.p. compared to January. The monthly decrease was mainly explained by lower results from securities and by a reduction in interest income (partly seasonal). The accumulated financial margin in the last 12 months represented 10.3% of assets, 0.4 p.p. less in a year-on-year comparison (see Chart 20). This reduction in the financial margin was explained by lower interest income (mainly from loans) and a fall in securities gains, effects tempered by a decrease in interest expenses (mainly from deposits).
Figure 20 | Components of the Income Table – Financial System
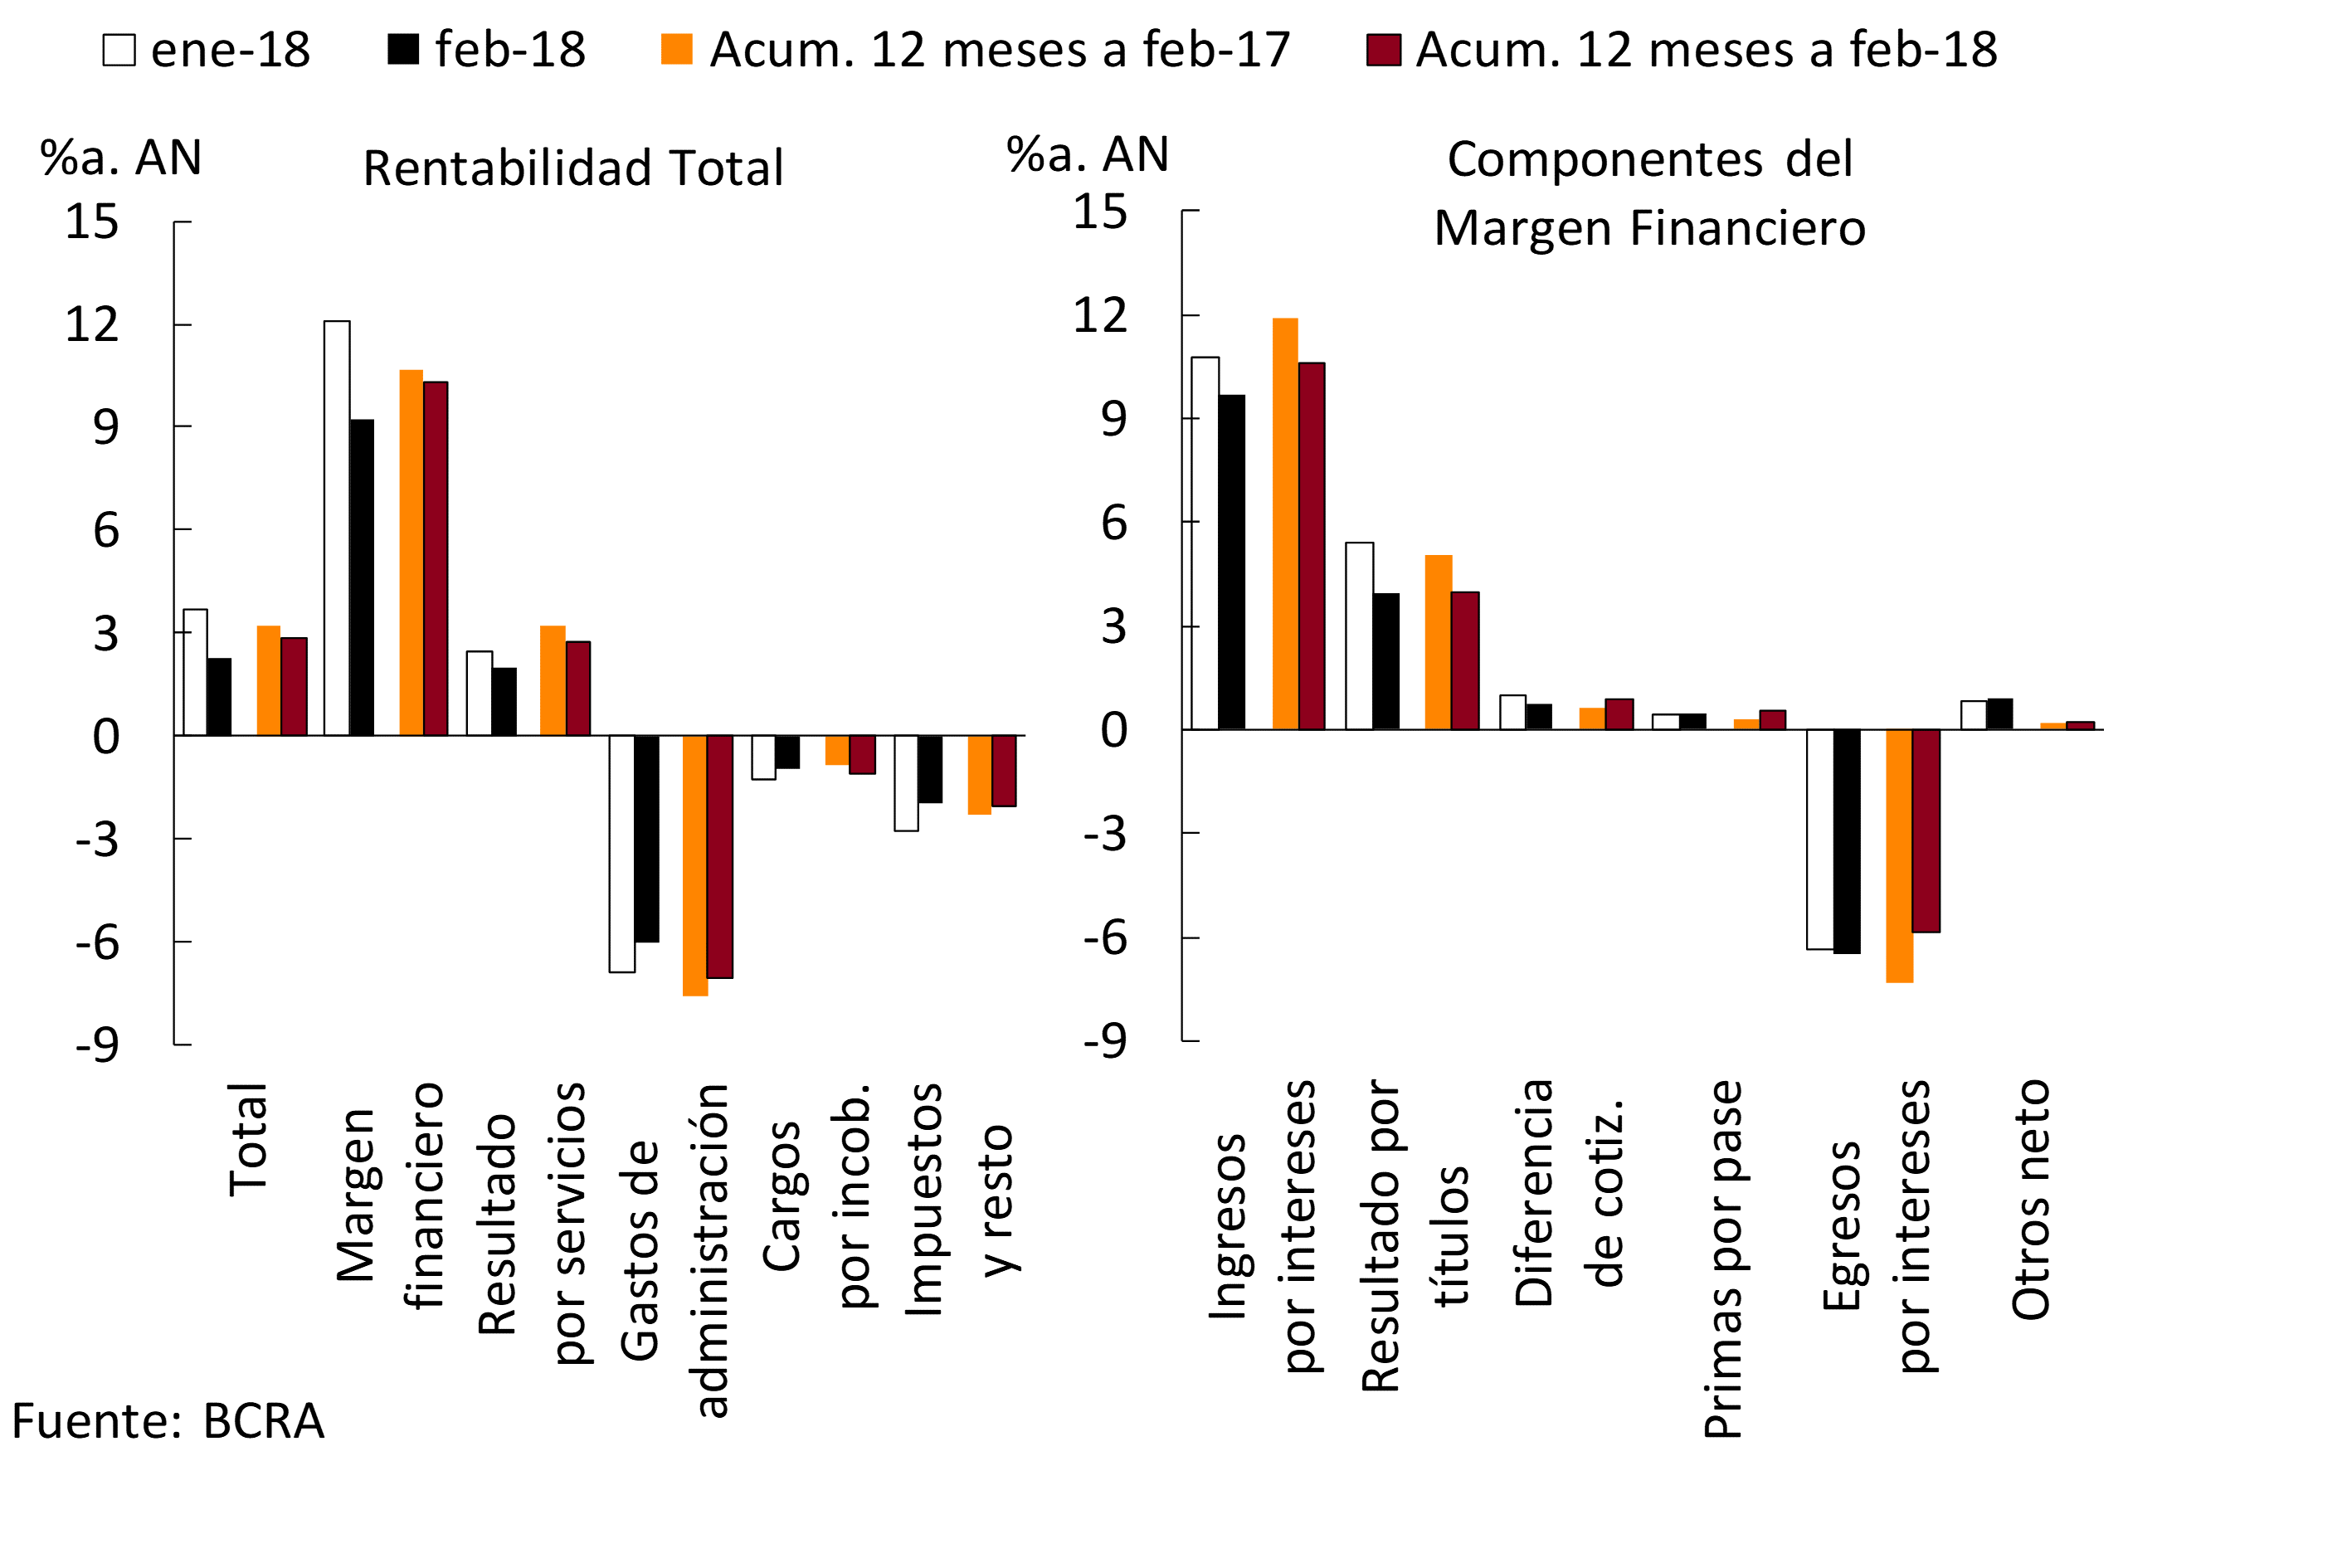
Net income from services20 of the banks as a whole stood at 2% y/y of assets in February, 0.5 p.p. less than in January partly due to seasonal issues. In the 12 months to February 2018, the results by services represented 2.7% of assets, falling 0.5 p.p. in a year-on-year comparison (see Chart 20).
In February, bad debt charges totaled 1% y/y of assets, falling slightly compared to January. Between March 2017 and February 2018, charges for uncollectibility in the financial system represented 1.1% of assets, up 0.2 p.p. in a year-on-year comparison.
Administrative expenses reached 6% of assets in the month, falling compared to January. In the accumulated 12 months, the sector’s administrative expenses stood at 7.1% of assets, down 0.5 p.p. in a year-on-year comparison (see Chart 20).
In February, tax burdenstotaled 1% of assets, with no significant changes compared to the first month of the year. These tax burdens reached 1.1% of assets in the accumulated 12 months. The income tax accrued in February stood at 1.1% of assets, falling in relation to January’s record. In 12 months, this tax represented 1.4% of assets.
Regulations
Summary of the main regulations of the month, implemented by the BCRA, related to financial intermediation activity. The effective date of the regulation is taken as a reference.
Communication A 6448 – 02/02/18
The procedure for revocation and/or termination of contractual relationships by users of financial services is simplified. It is provided that financial institutions and non-financial companies that issue credit cards that use electronic communication mechanisms must admit their use to revoke acceptance or terminate contractual relationships related to financial and/or non-financial products and services. The subjects covered must provide proof of the revocation or termination, not being able to accrue any type of commission and/or charge from that moment. In addition, it is established that users can cancel their accounts and other financial services at any branch of the entity.
Communication A 6449 – 08/02/18
It is incorporated as a concept excluded from the rules on “Financing to the non-financial public sector”, the holdings by financial institutions of debt instruments created within the framework of Law 27,328 on Public-Private Partnership Contracts and its regulatory Decree 118/17, so that prior authorization from the BCRA will not be required for the participation of financial institutions in the financing of the implementation of projects of investment that are disbursed within the framework of said law. The “Guarantees” rules are incorporated as preferred guarantee “B”, the pledge or assignment as a guarantee of the income from the contracts in question, whose coverage margin will be 100%.
Communication A 6457 – 23/02/18
The rules on “Minimum Security Measures in Financial Institutions” are modified, allowing meeting spaces and other goods and/or services provided by third parties to be set up in automated offices, as well as the use of data communication networks and mobile communication devices. It is established that automatic terminals that are located in automated premises must be installed in such a way that the observation of the monitor and keyboard by third parties is not allowed.
Communication A 6459 – 23/02/18
The rules on “Guidelines for risk management in financial institutions” are modified, allowing financial institutions belonging to Groups “B” and “C” to choose, within the framework of the “Internal Capital Adequacy Assessment Process” (ICAAP), to apply internal models or a simplified methodology to quantify economic capital needs according to their risk profile. A framing period of 5 years is allowed for these entities – counted from the year following the adoption of the simplified methodology – so that they can cover the insufficiency that may arise in the first year of application of this method. This measure will be effective as of 7/1/18.
Communication A 6460 – 23/02/18
The rules on “Application of the deposit guarantee insurance system” are adapted, establishing that demand deposits in which interest rates higher than the reference rates are agreed, and deposits and time investments that exceed 1.3 times that rate or the reference rate plus 5 percentage points – the greater of the two, are excluded from coverage.
References
*As of the change in the form of presentation of the financial statements due to the local application of International Financial Reporting Standards (IFRS), the information for January and February 2018 should be considered provisional and subject to rectification.
1 Reference is made to those measures of relevance to the financial system that were adopted since the date of publication of the previous Report on Banks.
2 Communication A 6474 and Press Release of 03/22/18.
3 Communication A 6483 and Press Release of 10/04/18.
6 It should be noted that, as before said regulatory change, this regulation will be considered individually, except for controlling entities subject to consolidated supervision, in which case it will be computed on a monthly consolidated basis.
7 For example, in the standards of “Liquidity coverage ratio”, “Stable net funding ratio”, “Minimum capital of financial institutions” and “Guidelines for risk management in financial institutions”.
9 These funds came mainly from the National Treasury from the placement of debt carried out in the month and from the sale of foreign currency obtained in securities issues made in previous periods (see in the following paragraph the effect on public sector deposits in foreign currency and on liquidity in this denomination, in particular, on public banks).
10 The increase in public sector deposits was mainly explained by funds from the placement of debt by the National Treasury.
11 The reduction in foreign currency deposits was correlated with the increase in deposits in pesos, mainly due to the sale of foreign currency (obtained in debt placements in previous months) made by the National Treasury to the BCRA.
12 The reduction in term placements occurred within the framework of the placement of debt in pesos by the National Government.
13 Variation in currency of origin.
14 Variation in currency of origin.
15 Includes capital and adjustment of capital for the evolution of the CER.
16 It includes a fixed and repacable interest rate.
17 This ratio increased in the group of public entities mainly due to the capital contribution received by a bank. On the other hand, it should be considered that the capital requirement was increased in another public bank of magnitude, which led to a slight decrease in the capital position that was reflected at the aggregate level. However, this entity continued to comfortably comply with regulatory requirements.
18 Tier 1 capital defined as basic equity (common and additional capital, net of deductible accounts). Com A 5369.
19 These data incorporate corrections made by a large public bank on the balance sheet for the month of December 2017 (the changes are reflected in the accumulated flows).
20 As of the publication of the February 2018 Report on Banks and its respective Annex, a regrouping of items is made among the items results by services and tax burdens. The aforementioned regrouping is also carried out on the historical series.
21 See previous note.
Glossary
%a.: annualized percentage.
% YoY: Year-on-year percentage.
Liquid assets: availabilities (integration of “minimum cash” in current accounts at the BCRA and in special guarantee accounts and other concepts, mainly cash in banks and correspondent offices) plus the net credit balance for transfer operations of financial institutions against the BCRA using LEBAC and NOBAC.
Consolidated assets and liabilities: those arising from deducting transactions between entities in the system.
Net Assets (NA): Assets and liabilities are net of accounting duplications for pass-through, forward and spot transactions to be settled.
APR: Total Risk Weighted Assets.
BCBS: Basel Committee on Banking Supervision (BCBS).
Irregular portfolio: portfolio in situation 3 to 6, in accordance with the “Classification of Debtors” regime.
Credit to the public sector: Position in public securities (without LEBAC or NOBAC) + Loans to the public sector + Compensation to be received + Debt securities and Certificates of participation in financial trusts (with underlying public securities) + Miscellaneous credits to the public sector.
Credit to the private sector: loans to the non-financial private sector including accrued interest and CER and CVS adjustment and leasing.
Contribution differences: Results from the monthly update of assets and liabilities in foreign currency. The item also includes the results originated by the purchase and sale of foreign currency, which arise as a difference between the agreed price (net of the direct expenses originated by the operation) and the book value.
Miscellaneous: miscellaneous profits (including, but not limited to, gains on permanent shares, recovered loans and unaffected provisions) less miscellaneous losses (including, but not limited to, losses on permanent shareholdings, loss on sale or disposal of goods for use and amortization of business keys).
Equity exposure to counterparty risk: irregular portfolio net of provisions in terms of equity.
Administration expenses: includes remunerations, social charges, services and fees, taxes and amortizations.
IEF II-17: BCRA Financial Stability Report.
IPCBA: Consumer Price Index of the City of Buenos Aires.
CSF: Liquidity Coverage Ratio (LCR).
LEBAC and NOBAC: bills and notes issued by the BCRA.
LELIQ: BCRA liquidity bills.
LR: Leverage Ratio (LR).
Financial margin: Income minus financial expenses. It includes interest and securities earnings, CER and CVS adjustments, exchange rate differences and other financial results.
Mill.: Million or million, as appropriate.
IFRS: International Financial Reporting Standards.
ON: Negotiable Obligations.
ORI: Other comprehensive results.
OS: Subordinated Obligations.
Other financial results: rental income from financial leases, contribution to the deposit guarantee fund, interest on availabilities, charges for loan depreciation, premiums for the sale of foreign currency and other unidentified items.
PN: Net Worth.
p.p.: percentage points.
SME: Small and Medium Enterprises.
Consolidated profit: Results from permanent holdings in local financial institutions are eliminated. Available since January 2008.
Income from securities: includes results from public securities, temporary shares, negotiable obligations, subordinated obligations, options and other credits for financial intermediation. In the case of public securities, it includes the results accrued in terms of income, differences in share price, exponential increase based on the internal rate of return (IRR) and sales, in addition to the charge for forecasts for the risk of impairment.
Interest income: interest charged minus interest paid for financial intermediation, following the accrual criterion (balance sheet information) and not what is received. It includes interest on loans and deposits of government securities and premiums for passes.
Result for services: commissions charged minus commissions paid. It includes fees related to obligations, credits, securities, guarantees granted, the rental of safe deposit boxes and foreign and exchange operations, excluding in the latter case the results from the purchase and sale of foreign currency, the latter being accounted for in the “Differences in quotation” account. Expenses include commissions paid, contributions to the ISSB, other contributions for income from services and charges accrued from the gross income tax.
ROA: Final result as a percentage of net assets. In the case of referring to accumulated results, the average of the NA for the reference months is considered in the denominator.
SWEE: Final result as a percentage of equity. In the case of referring to accumulated results, the average net worth for the reference months is considered in the denominator.
RPC: Computable Patrimonial Liability. For more details, see Ordered Text “Minimum Capitals of Financial Institutions”.
TNA: Annual nominal rate.
US$: US dollars.
UVA: Unit of Purchasing Value.
ICU: Housing Units.
Share on


