I. Financial intermediation activity
In March, the financial intermediation activity of the financial system with the private sector was reduced. Considering the main changes in the balance sheet balances of all entities on items in national currency (in real terms)1, liquidity in the broad sense decreased in the month and, to a lesser extent, credit to the private sector. These movements took place in a scenario of reduction in the balance of deposits. In the month, the foreign currency segment showed a similar performance to that of pesos: a fall in liquidity and financing, and a decrease in public sector deposits. 2
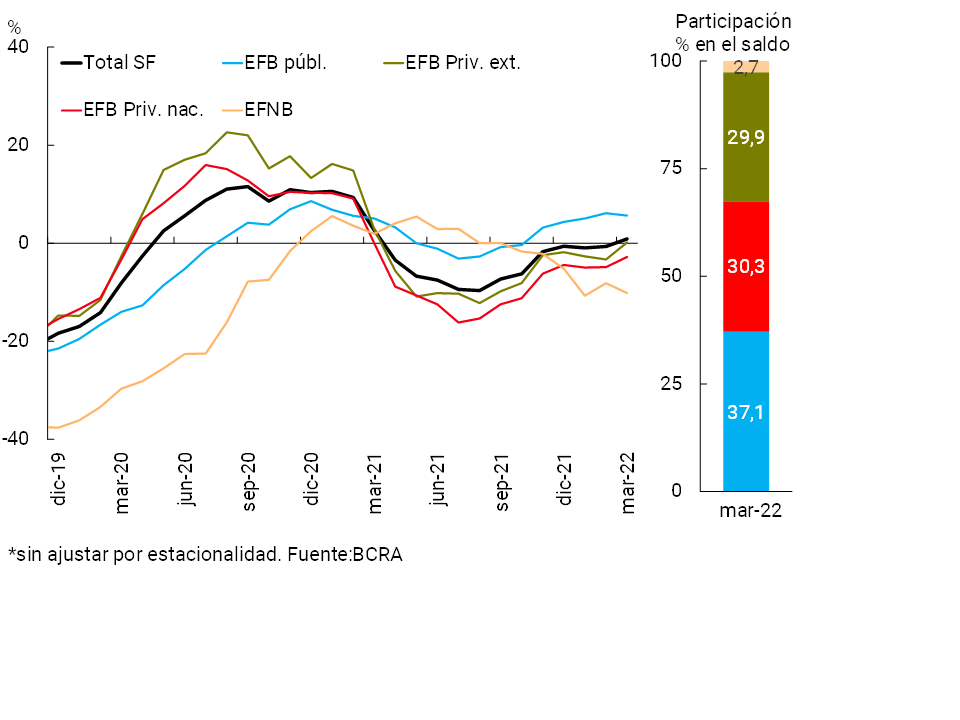
The balance of loans in pesos to the private sector fell by 1.9% in real terms in March compared to the previous month (+4.6% nominal), with falls in all credit lines and groups of financial institutions3. This occurs in a context in which the balance of credit to the private sector in pesos expressed in homogeneous currency remained without significant changes in year-on-year terms (+0.9% real y.o.y. or +56.3% nominal y.o.y.). Title loans and commercial lines of credit (documents, advances and leasing) showed year-on-year increases in real terms (see Chart 1); personnel remained unchanged in magnitude; while cards and mortgages verified reductions. Greater relative dynamism was observed in public financial institutions (see Graph 2).
Graph 1 | Credit balance to the private sector in pesos
In real terms* – Financial system
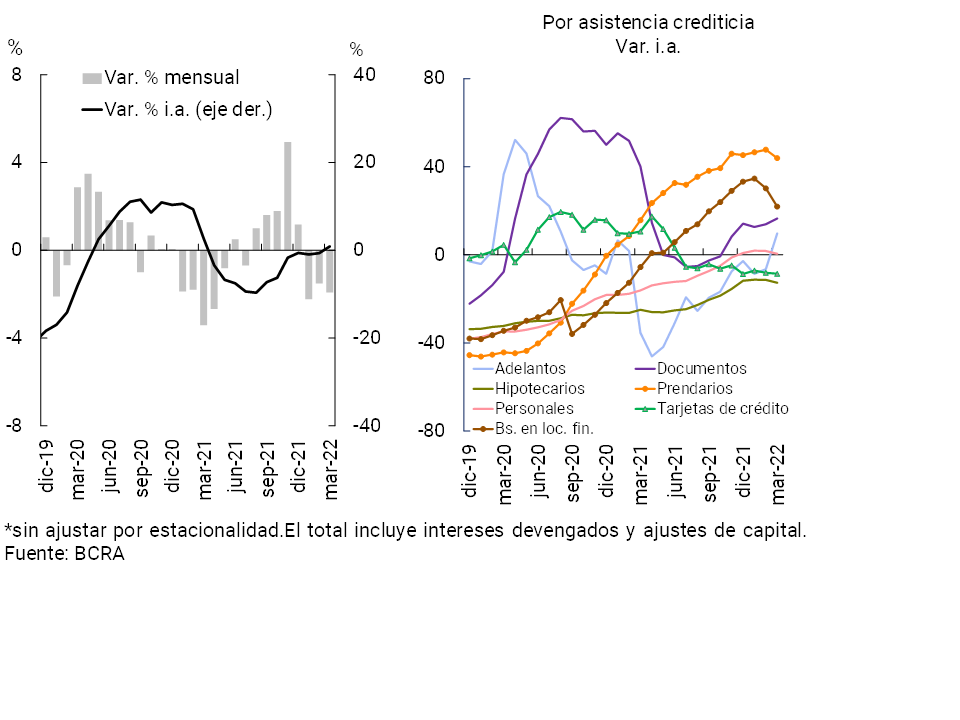
Graph 2 | Credit balance to the private sector in pesos
Var. A.I. in real terms* – By group of financial institutions
In order to continue stimulating credit to the productive sector, with particular emphasis on the role of MSMEs, at the end of the first quarter of 2022 the BCRA extended the Financing Line for Productive Investment (LFIP), maintaining favorable conditions for both debtors and participating financial institutions4. The credits channeled through this instrument totaled nominal disbursements of more than 2 trillion since its launch in October 2020 and until the end of March 2022, distributed among approximately 251,900 companies.
In March, the balance of financing to the private sector in foreign currency decreased by 3.2% – in the currency of origin – compared to February, with a greater relative drop in cards and documents. In this context, the total credit balance (in domestic and foreign currency) fell by 2.3% in real terms in the month (+4.2% nominal) and by 5.3% in real terms year-on-year (+46.8% YoY in nominal terms).
Recently, the BCRA modified monetary policy interest rates again, being the fifth adjustment so far in 20225. In particular, in mid-May, the 28-day LELIQ interest rate went from 47% to 49% TNA (61.8% TEA) (see Chart 3). In order to accompany this rise in policy rates, in May the minimum interest rates for fixed terms were increased: (i) for 30-day deposits, up to 10 million pesos from individuals, the new floor was set at 48% TNA (60.1% TEA), and (ii) for the rest of the private sector’s fixed-term deposits the minimum guaranteed rate was set at 46% (57.1% TEA).
Graph 3 | Interest rates traded: levels and spreads – Operations in pesos – Financial system
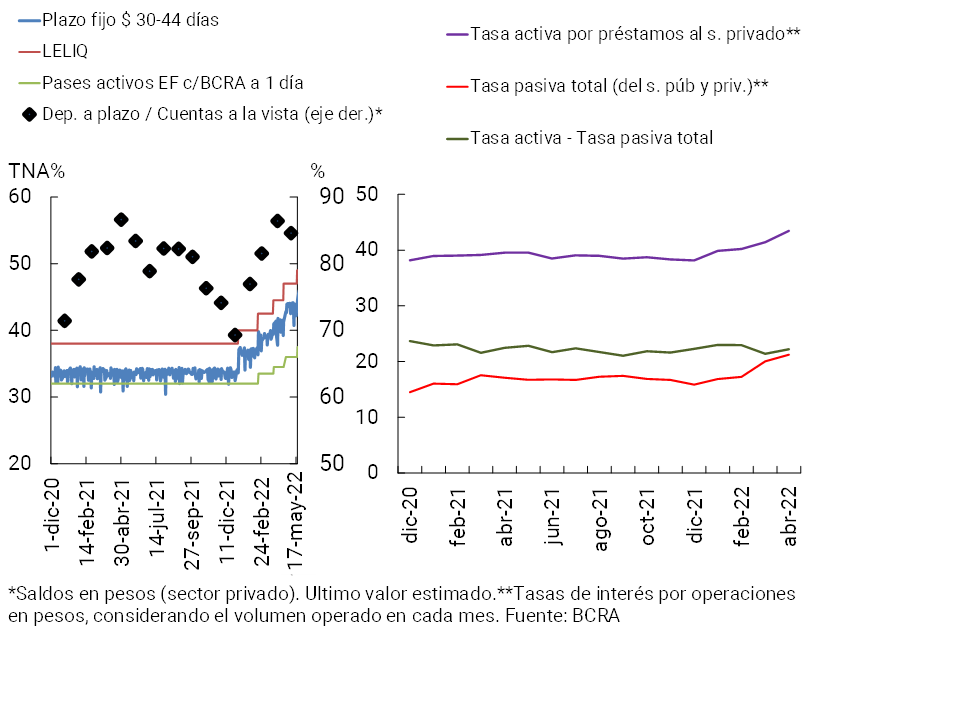
It is estimated that the average nominal lending rate for lending operations to the private sector increased more moderately in 2022 compared to what was experienced in the fixed-term rate. The rise in the lending rate was more in line with the performance of the total deposit rate on deposits in pesos (which includes total forward and demand transactions). Thus, the differential between interest rates for loans and nominal deposits operated in pesos would not have shown significant changes so far in 2022 (see Chart 3).
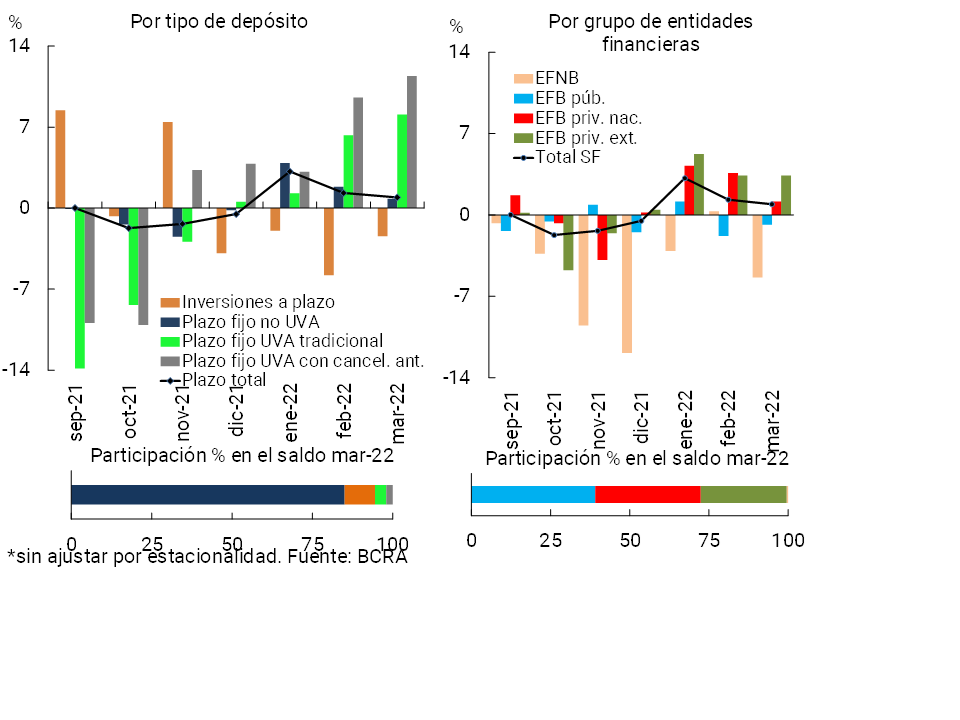
In terms of the funding of the aggregate financial system, in March the balance of deposits in pesos of the private sector fell by 2% in real terms compared to February (+4.5% nominal), mainly due to the decrease in demand accounts (-4.4% real or +2% nominal). Time deposits increased by 0.9% in real terms in March (+7.7% nominal, see Chart 4). The positive performance that has been observed since the beginning of 2022 in the private sector’s term placements in pesos was partly driven by the successive increases in minimum interest rates ordered by the BCRA. When distinguishing by type of time deposit, in March those denominated in UVA continued to grow at relatively higher rates: 11.4% in real terms for placements with early cancellation and 8.1% in real terms for traditional ones (see Graph 5). Time deposits in UVA account for 5.6% of the total balance of time deposits in pesos in the private sector (+1.2 p.p. year-on-year). Traditional fixed-term deposits increased 0.8% in real terms in the month and represent 85% of the private sector’s time deposits in pesos.
Figure 4 | Balance of private sector time deposits in pesos
In real terms* – Financial system
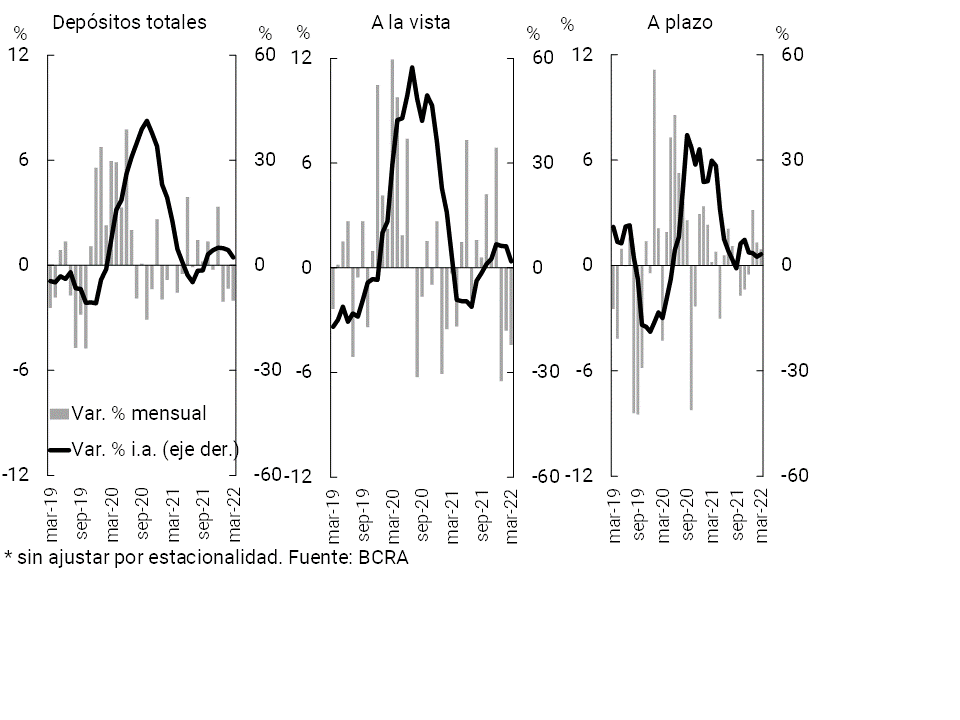
Graph 5 | Balance of private sector time deposits in pesos in real terms
Var. % monthly*
In March, the balance of private sector foreign currency deposits remained unchanged from the previous month (+0.3% in source currency), with decreases in demand accounts that were offset by increases in time deposits. The balance of total private sector deposits (in domestic and foreign currency) fell by 2.2% in real terms in the period (+4.4% nominal).
In year-on-year terms, the balance of deposits in national currency of the private sector increased by 2.2% in real terms in the period (+58.5% nominal), with a greater relative increase in time deposits. The balance of public sector deposits in pesos fell by 6.6% YoY in real terms (+44.8% YoY in nominal terms). Thus, the balance of total deposits in national currency of the public and private sectors remained unchanged with respect to the level of a year ago (+0.6% real y.o.y. or +56% nominal y.o.y.). When considering all currencies and sectors, the balance of total deposits accumulated a fall of 3.9% YoY in real terms (+49% YoY in nominal terms).
II. Aggregate evolution and composition of the balance sheet
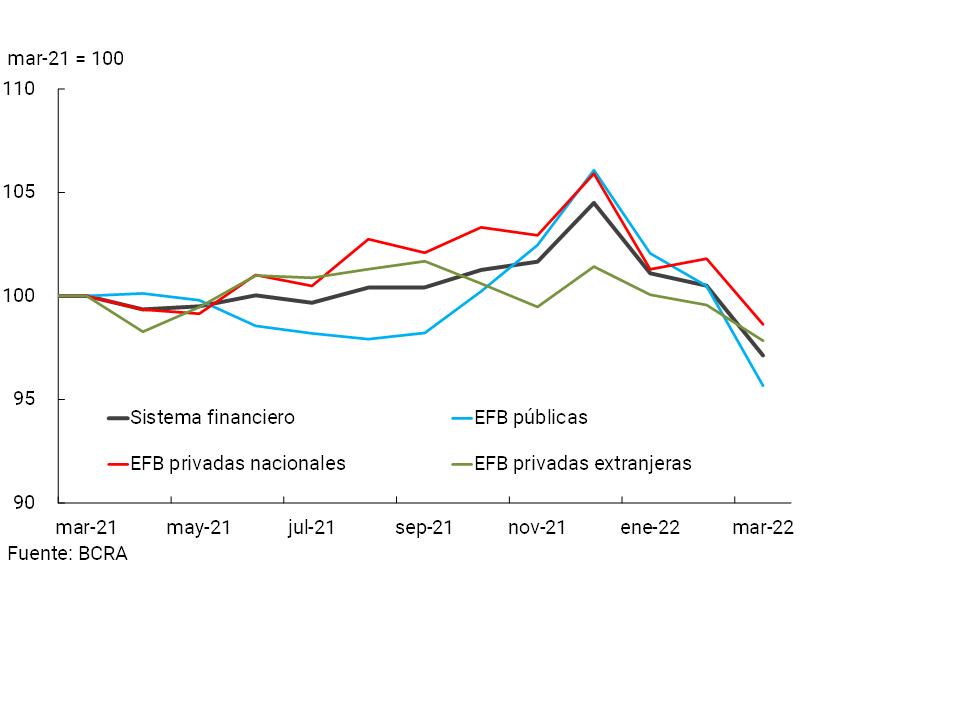
The total assets of all financial institutions decreased by 3.4% in real terms in March (+3.1% nominal), with falls in all groups of financial institutions (see Chart 6). In a year-on-year comparison, total assets accumulated a reduction of 2.9% in real terms (+50.5% nominal y.o.y.) at the systemic level.
Graph 6 | Total assets of the financial system
In real terms
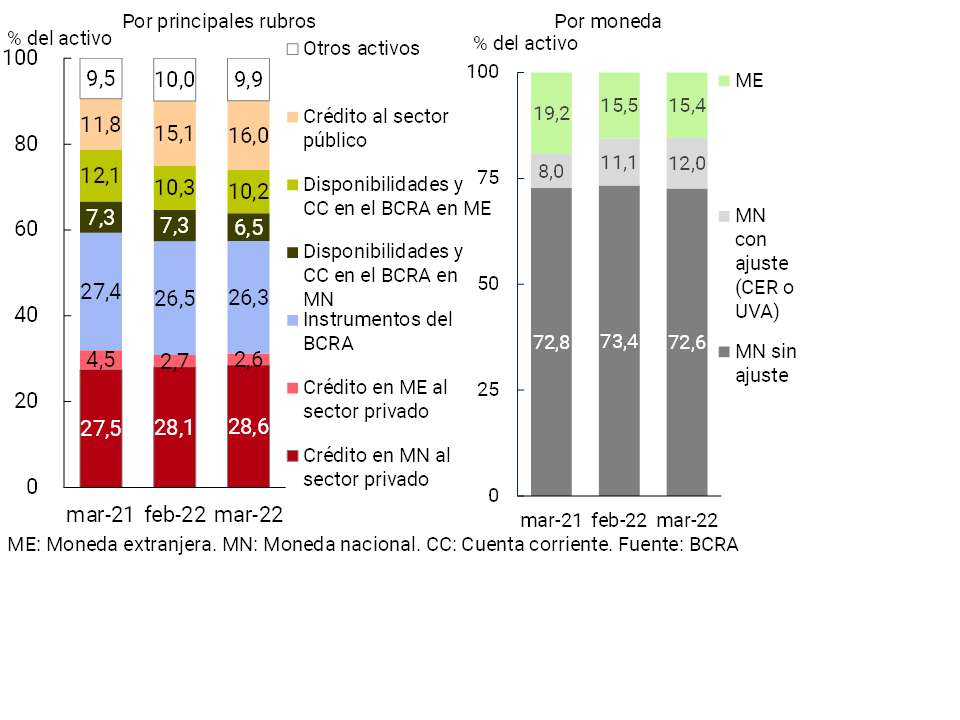
With respect to the main components of the total assets of the financial institutions as a whole, in March the relative importance of the balance of credit to the public sector and of financing in pesos to the private sector increased (see Graph 7); while the weighting of the balance of availabilities in national currency and the holding of BCRA instruments was reduced. When distinguishing by currency, in the period the assets in pesos with CER adjustment increased their relative importance in the total (mainly reflected in public securities with CER), while the weighting of assets in unadjusted pesos and those denominated in foreign currency decreased.
Figure 7 | Composition of total assets
Financial system – Share %
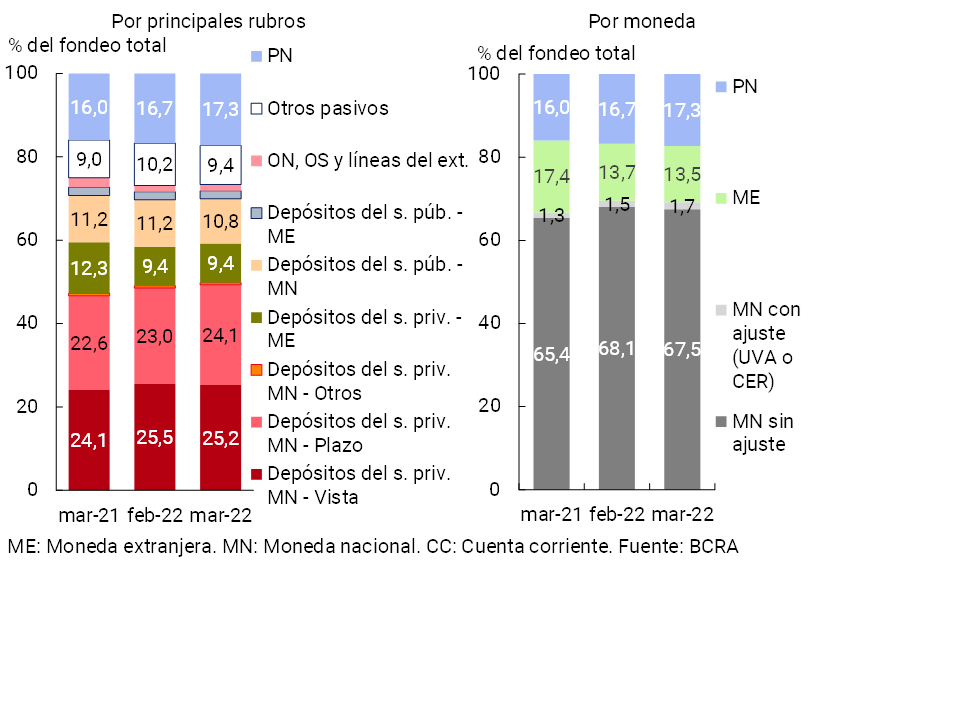
With regard to the composition of the total funding of the financial system, in the month the private sector’s time deposits in pesos increased their share of the total, while the relative weight of deposits in pesos in the public sector and demand accounts in pesos fell (see Chart 8). Disaggregated by currency, the share of items in pesos without an adjustment clause and those denominated in foreign currency fell slightly during the month.
Figure 8 | Total Funding Composition
Financial system – Share %
From levels limited within the framework of the macroprudential regulation in force, at the end of the first quarter of 2022 the financial system reduced its exposure to foreign currency items. The spread between assets and liabilities of all financial institutions in this denomination6 stood at 10.3% of regulatory capital in March, falling 1.5 p.p. compared to last month and 2.5 p.p. compared to the figure at the end of 2021 (see Chart 9). In year-on-year terms, this ratio showed a slight increase (+0.7 p.p.). Regarding the mismatch of items with CER adjustment in the aggregate financial system, it is estimated that in March the positive spread between assets and liabilities with capital adjustment by CER and/or UVA increased slightly compared to the level of February and the end of 2021, reaching 68.8% of regulatory capital in February (+ 21.3 p.p. y.o.y.)
Figure 9 | EM Assets – EM Liabilities + EM Forward Position — Financial System
III. Portfolio quality
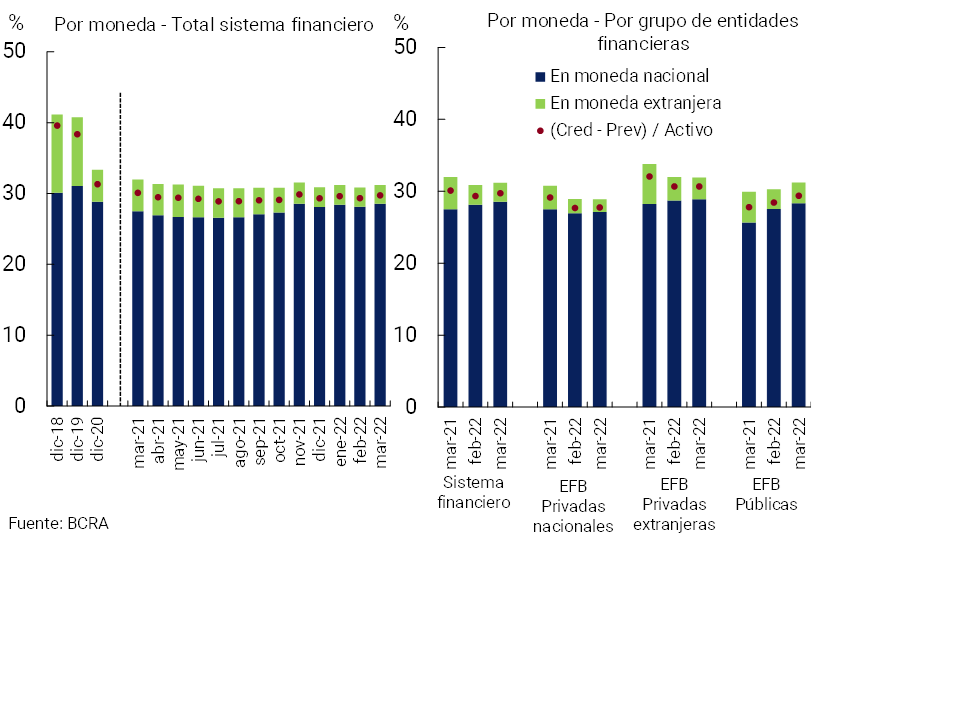
The financial system’s gross exposure to the private sector (including domestic and foreign currency) stood at 31.2% of assets in the month, 0.3 p.p. above February – driven by public banks – and 0.8 p.p. below March 2021 (see Chart 10). Considering exclusively financing in national currency, this ratio grew 0.4 p.p. in the month and 1.1 p.p. y.o.y. to reach 28.6%. Credit to the private sector denominated in foreign currency continued to lose relevance in the total assets of the entities, reaching historically low values.
Figure 10 | Credit balance to the Private Sector / Assets
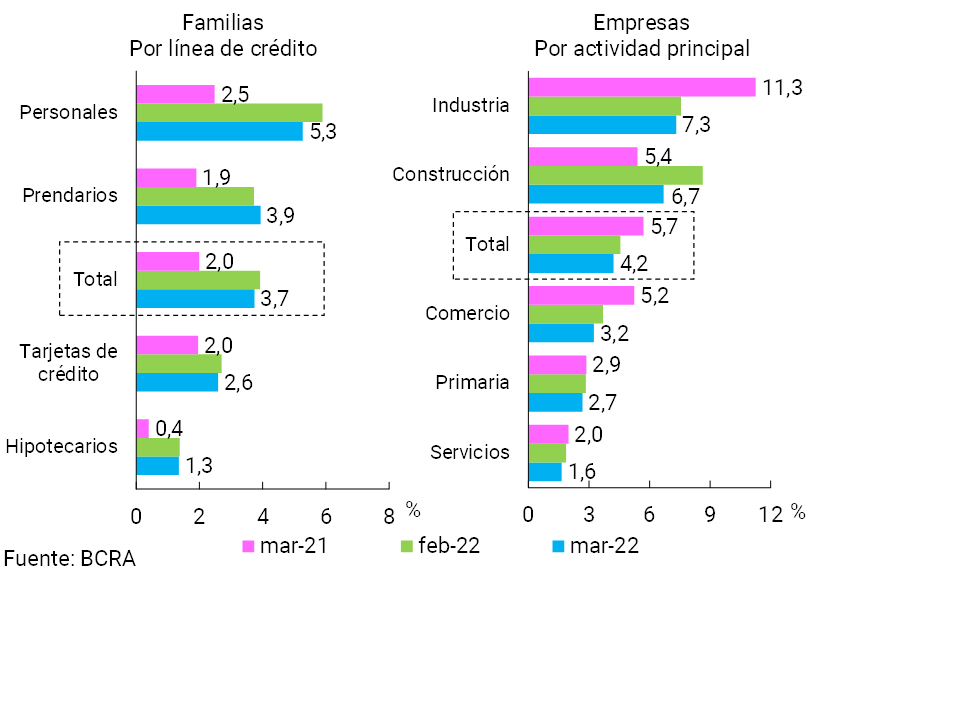
In March, the irregularity ratio of credit to the private sector fell 0.3 p.p. to 3.9% for the aggregate financial system7. The performance of this indicator occurs in a context of targeting the financial relief measures that were adopted during the course of the pandemic8. The monthly improvement in the quality of the loan portfolio was reflected in all groups of entities and financing segments (see Chart 11). In March, the irregularity ratio of credit to households stood at 3.7% at the systemic level, 0.2 p.p. less than last month, a variation driven mainly by personal loans (see Chart 12). On the other hand, non-performing loans for bank financing to companies totaled 4.2% of total credit to this sector in March, falling 0.4 p.p. compared to February, a dynamic reflected in all economic sectors (see Graph 12).
Figure 11 | Irregularity of credit to the private sector
Irregular financing / Total financing (%)
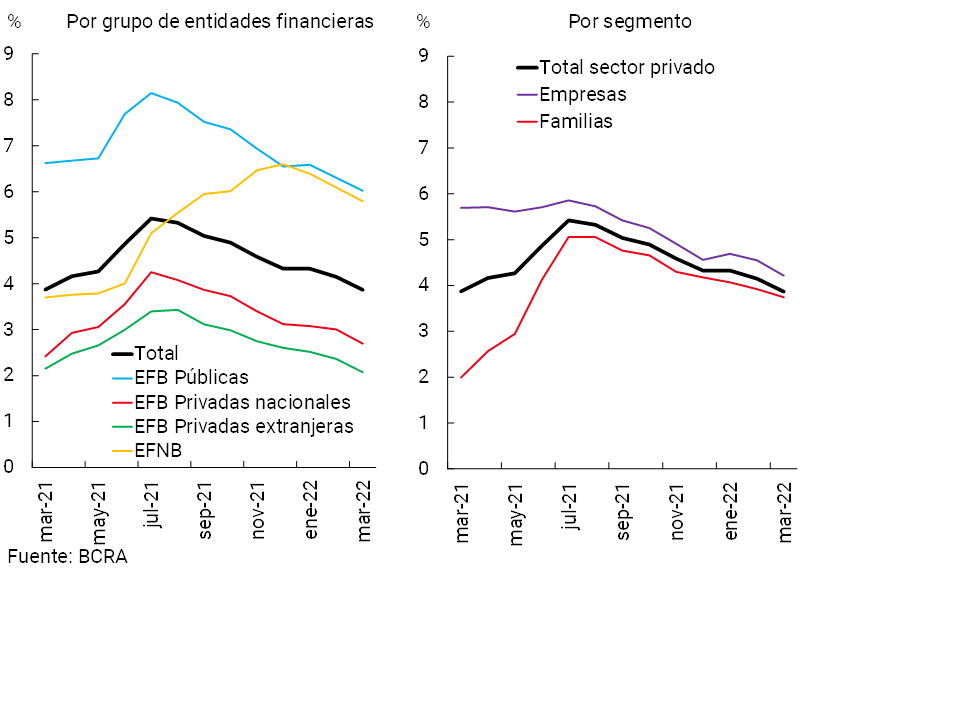
Figure 12 | Irregularity of credit to the private sector
Irregular financing / Total financing (%)
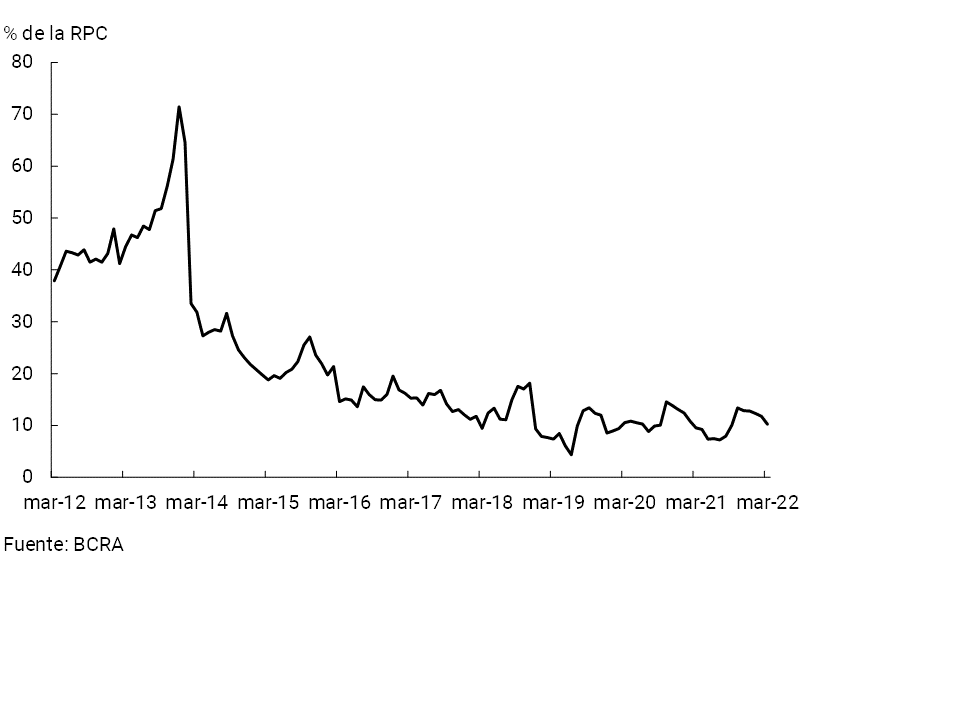
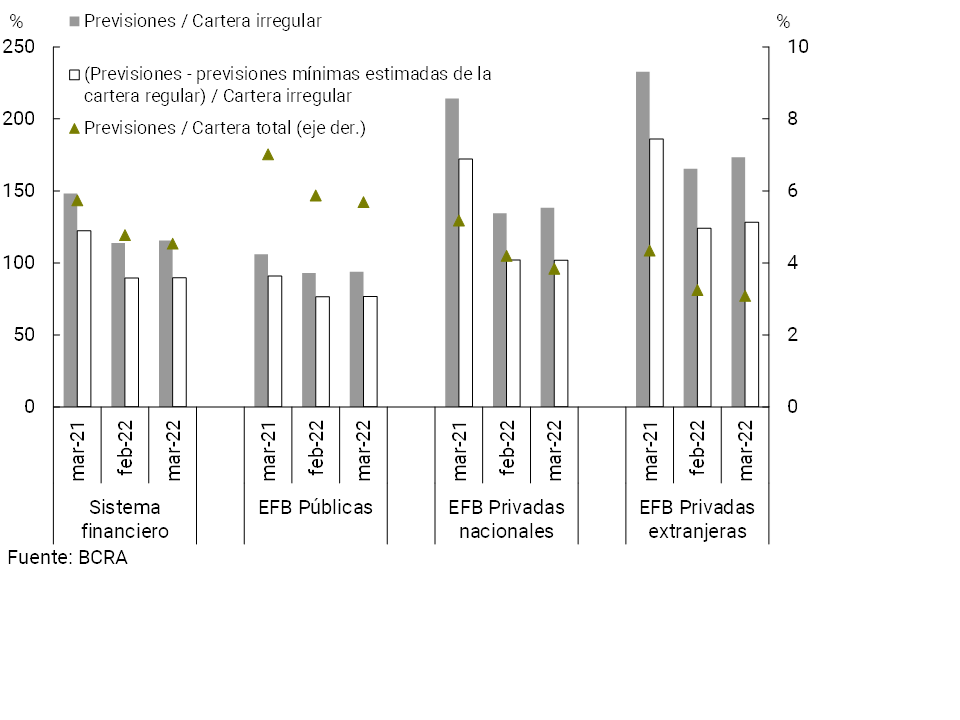
Forecast levels remained relatively high (see Figure 13). The total forecasts for the financial system as a whole represented 4.6% of the total credit balance to the private sector in March (0.2 p.p. below last month’s figure and -1.2 p.p. y.o.y.) and 115.6% of the non-performing portfolio (+1.9 p.p. monthly and -32.7 p.p. y.o.y.). In the period, the balance of regulatory forecasts attributable to the non-performing portfolio (following the criteria of the minimum regulatory forecasts for uncollectibility risk) totaled 89.7% of said portfolio at the systemic level.
Figure 13 | Credit to the private sector and forecasts
By Entity Group
IV. Liquidity and solvency
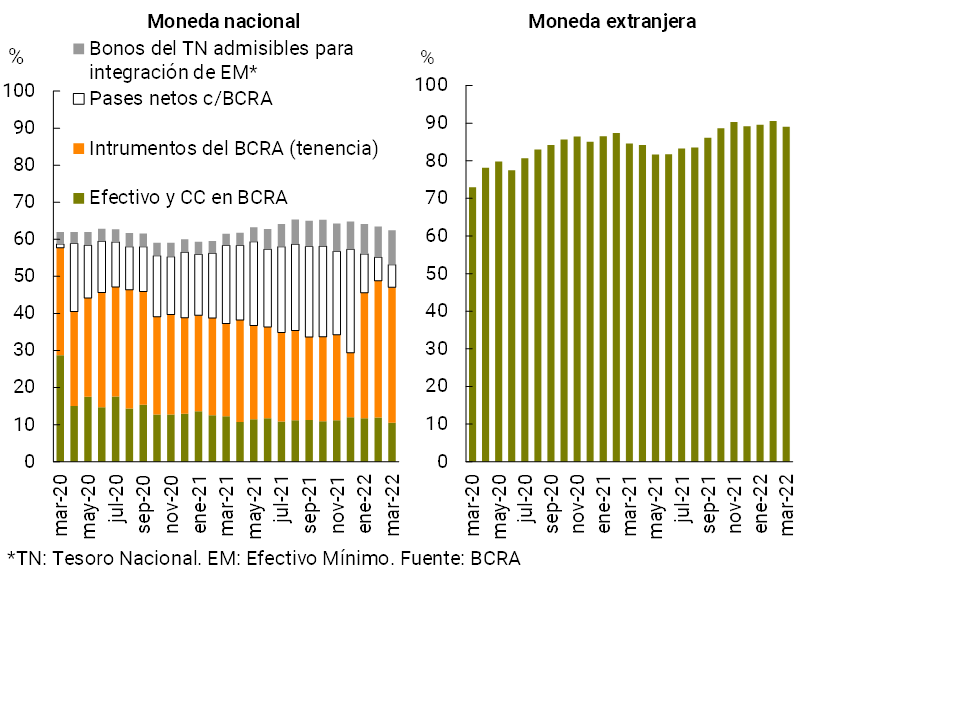
From historically high levels, the broad sense liquidity indicator9of all financial institutions fell in March for the third consecutive month. Liquid assets totaled 66.7% of total deposits at the end of the first quarter, 1.1 p.p. below the level recorded in February. Disaggregated by currency, this indicator stood at 62.5% for items in pesos and 89.1% for items in foreign currency, falling 1 p.p. and 1.5 p.p. compared to the previous month, respectively (see Chart 14). Most of the components of the liquidity indicator in national currency were reduced in month10. In a year-on-year comparison, the broad liquidity ratio for financial institutions as a whole (in pesos and abroad) increased slightly (+0.6 p.p. y.o.y. of total deposits).
Figure 14 | Liquidity of the financial system
In % of deposits
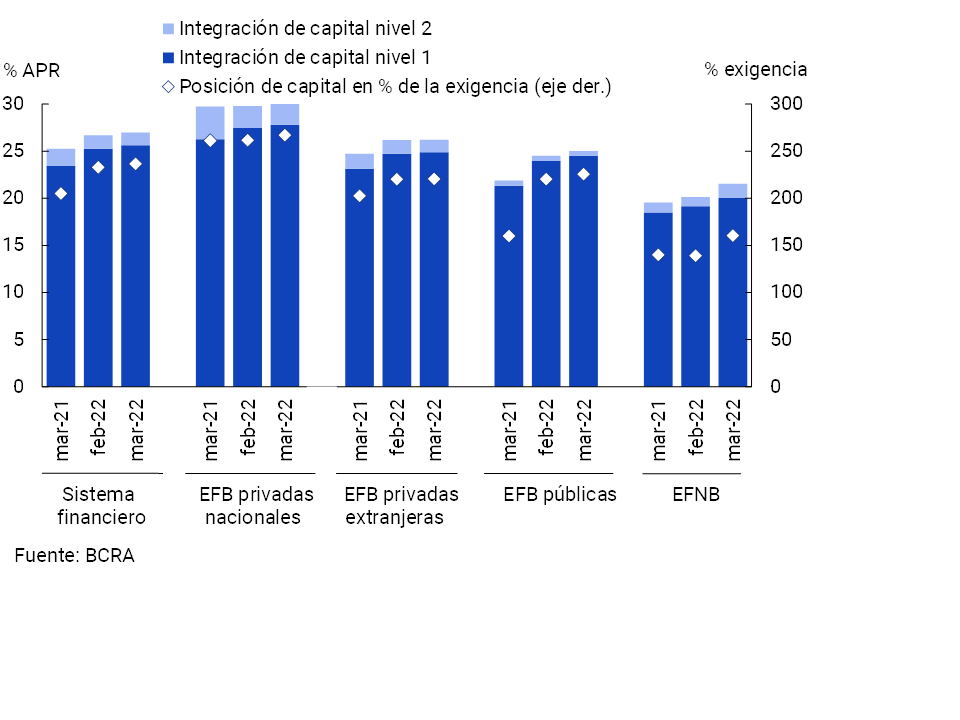
The financial system closed the first quarter of the year with high solvency indicators. Capital integration (CPR) of the aggregate of entities totaled 27% of their risk-weighted assets (RWA), 0.3 p.p. above the previous month’s figure (+1.7 p.p. y.o.y., see Chart 15). In turn, the integration of regulatory capital continued to comfortably exceed the regulatory requirement (surplus capital position), standing at 237% of the regulatory requirement in the month at the aggregate level, 3.8 p.p. more than in February (+31.5 p.p. y.o.y.). The ratio of excess regulatory capital to the balance of credit to the private sector net of forecasts totaled 34.7% at the systemic level in March, well above the average of the last 10 years (15.3%).
Figure 15 | Integration of regulatory capital
By financial institution group
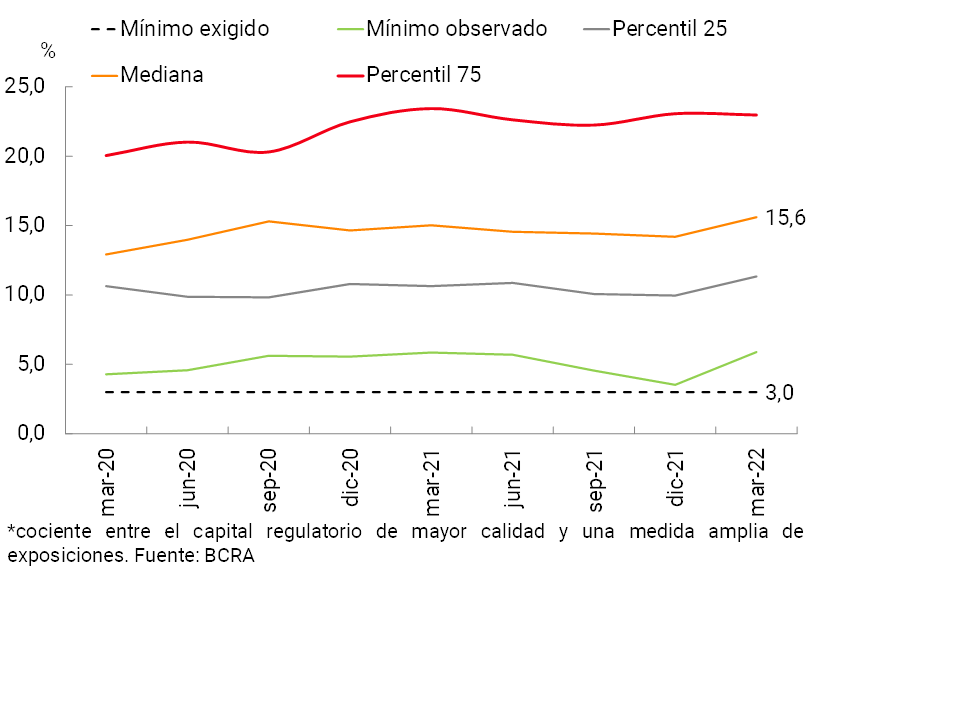
Almost 95% of the total regulatory capital of the financial system is accounted for by Tier 1 Capital, with a greater capacity to face potential losses. The ratio between this component of capital and a broad measure of exposures – leverage ratio, according to the guidelines established by the Basel Committee – continued to exceed the regulatory minimum of 3% for all financial institutions in March (see Chart 16).
Figure 16 | Leverage ratio*
With regard to the sector’s internal capital generation, in the first quarter of 2022 the profitability indicators for the aggregate financial system were at positive levels (see Chart 17). Between January and March 2022, the total comprehensive income in homogeneous currency of the group of entities totaled 1% annualized (yr.) of assets (ROA) and 6.2% y. of equity (ROE).
Figure 17 | Comprehensive total profit in homogeneous currency of the financial system
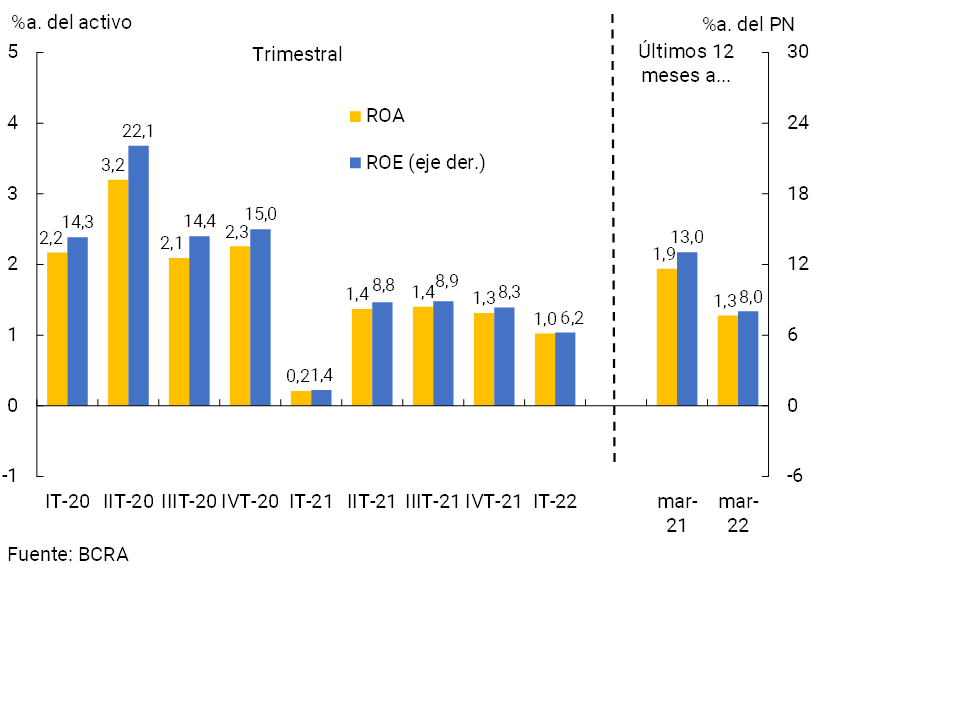
Considering the last 12 months to March, the ROA of the financial system reached 1.3% and ROE 8%, being 0.7 p.p. and 5 p.p. lower in a year-on-year comparison. This reduction in the sector’s cumulative profitability in 12 months was mainly reflected in the effects of increases in the cost of funding for deposits and greater monetary losses (effect of inflation on balance sheets), factors that were partly tempered by higher income from premiums for passes and lower charges for uncollectibility, among others.
V. Payment system
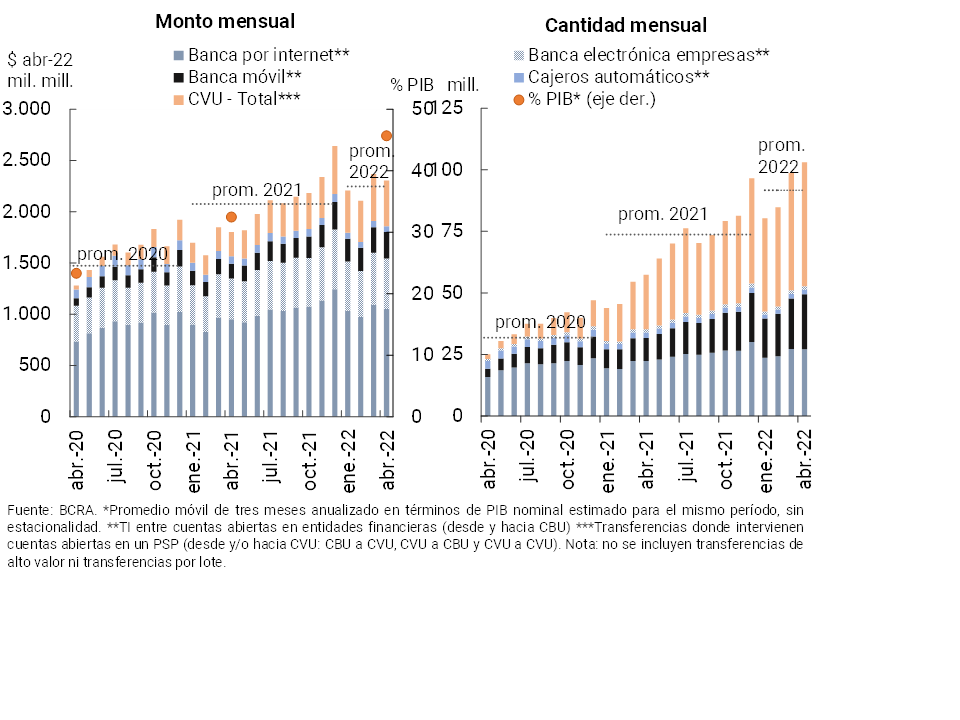
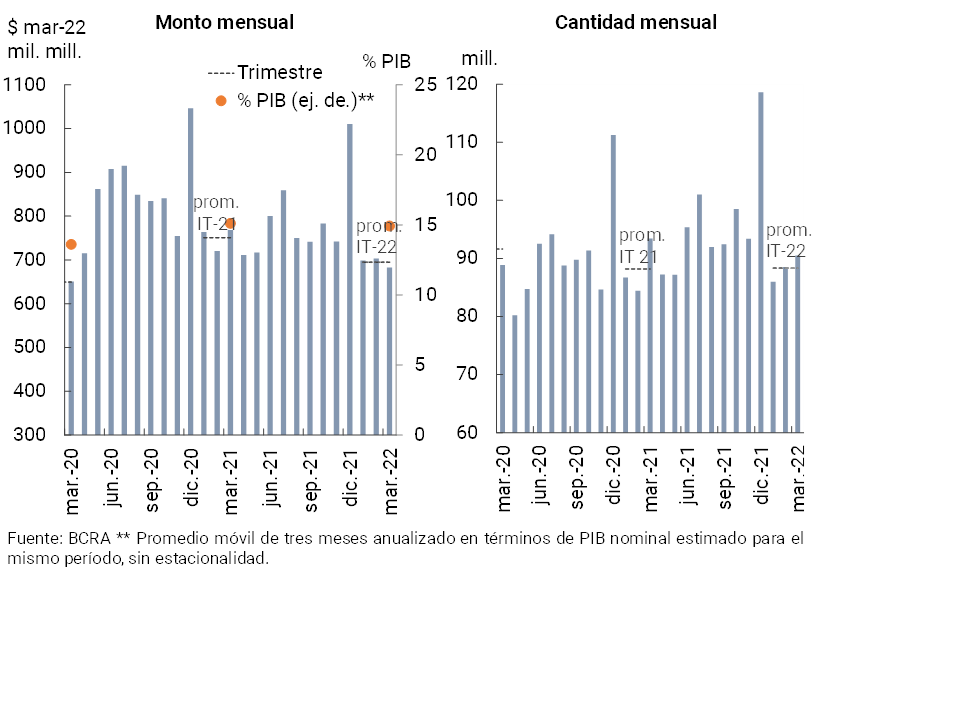
In April, immediate transfers (TI) increased compared to the previous month in amounts (4.4%) and decreased in real amounts (-2.7%). In year-on-year terms, these operations maintain a significant dynamism: IT expanded 79.5% YoY in quantities and 27.9% YoY in real terms. This year-on-year performance was explained both by the increases in transactions between accounts opened in financial institutions via CBU (+49.7% YoY in amounts and +18.7% YoY in real amounts)11 as well as by transactions involving accounts in payment service providers (PSPs) from and/or to CVU (+126.8% YoY in amounts and +88.1% YoY in real amounts)12. Thus, operations involving a CVU increased their relative share among TIs to 48.9% in quantities (+10.2 p.p. y.o.y.) and 19.4% in amounts (+6.2 p.p. y.o.y.). It is estimated that in March IT accounted for 45.7% of GDP13 (+13.2 p.p. compared to the same month of the previous year, see Graph 18).
Figure 18 | Instant Transfers (TI)
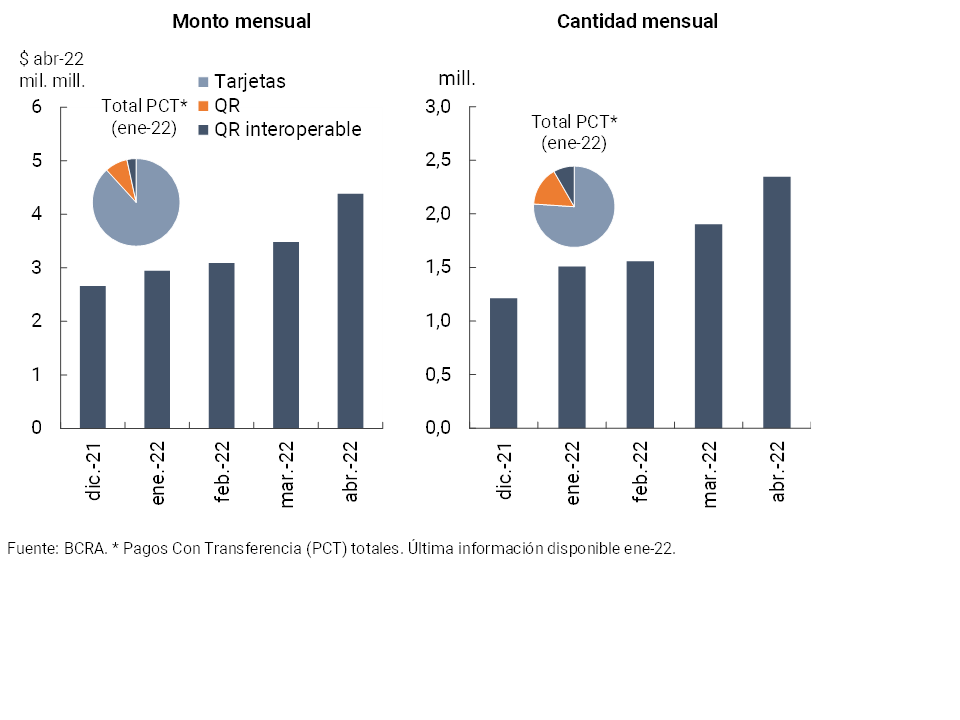
In April, transfer payments (PCT) initiated through interoperable QR14 increased significantly compared to the previous month in amounts (+23.3%) and in real amounts (+25.7%, see Chart 19). Since the beginning of the full QR interoperability scheme (end of November 2021), the number of operations under this modality accumulated to April reached 8.6 million, equivalent to $16,591 million at April 2022 prices (resulting in an average of $1,934 per transaction).
Figure 19 | Payments with transfers (PCT)
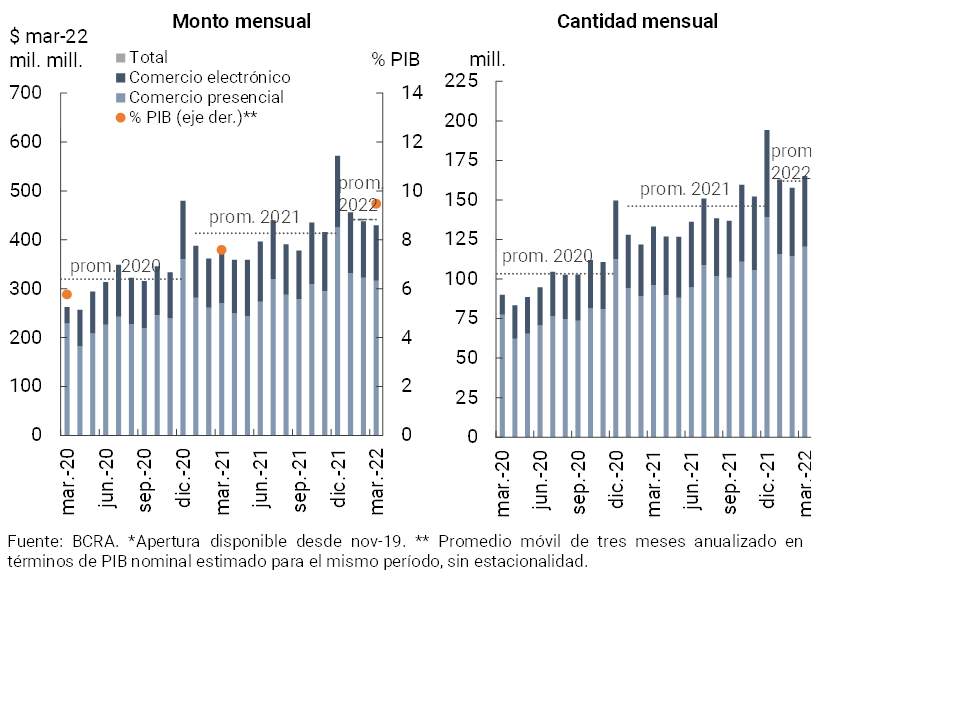
During March (latest available information) debit card transactions increased compared to the previous month in amounts (+4.7%) and decreased in real amounts (-1.8%). In year-on-year terms, debit card transactions grew significantly (+23.9% in amounts and +12.7% in real terms in amounts, see Chart 20). This behavior was reflected in both face-to-face and electronic operations15. Thus, it is estimated that debit card transactions accounted for 9.5% of GDP (1.9 p.p. more than in the same month of the previous year).
Figure 20 | Debit card transactions
In March (latest information available), ATM withdrawals increased compared to the previous month in quantities (+2.3%) and decreased in real amounts (-3%). Considering the accumulated in the first quarter, ATM withdrawals did not present significant changes in a year-on-year comparison in terms of the number of operations (+0.2% YoY), while they decreased 7.2% YoY in real amounts. It is estimated that in February the value of cash withdrawals via ATMs represented 14.9% of GDP16 (similar to the record for the same month of the previous year, see Graph 21)17.
Figure 21 |ATM cash withdrawals
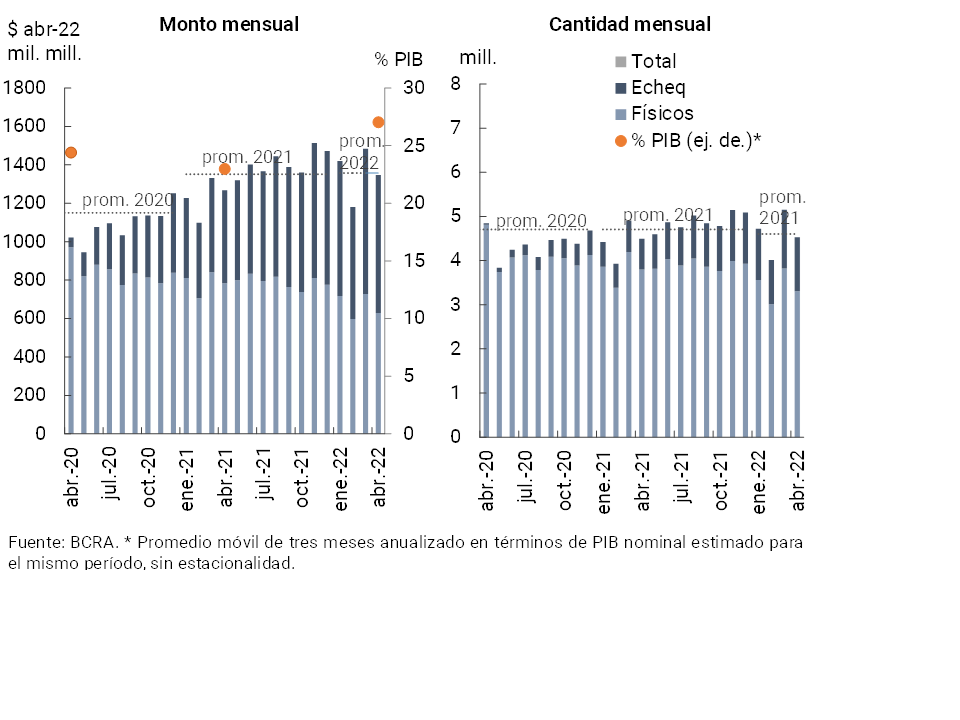
In April, partly due to seasonal reasons, the clearing of checks decreased compared to the previous month (-12.2% in quantities and -9.2% in real terms). However, the clearing of checks accumulated a slight increase of 0.6% in amounts and 6.2% in real amounts compared to the same month of the previous year. The year-on-year variation is explained entirely by the electronic format (+73.8% in quantities and +48.1% in real amounts). Thus, the ECHEQs continued to increase their weighting in total compensation, to represent 27% in quantities (+11.4 p.p. y.o.y.) and 53.3% in real amounts (+15.1 p.p. y.o.y., see Graph 22). It is estimated that the amount of checks cleared in terms of GDP totaled 27% (+4.1 p.p. y.o.y.).
Figure 22 | Check clearing
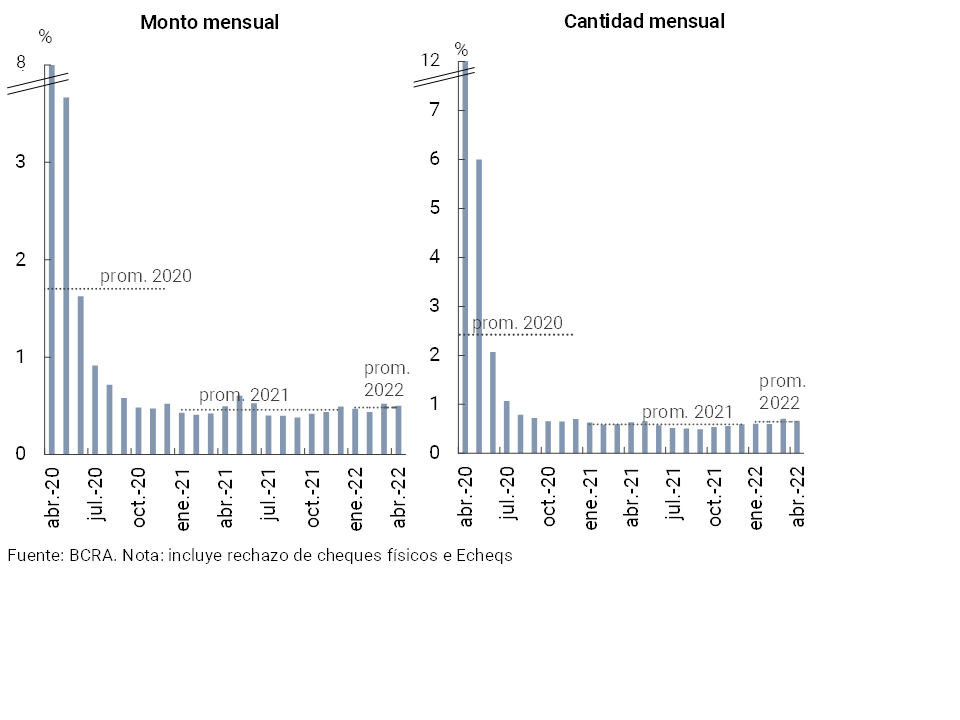
In April, the ratio of rejection of checks due to lack of funds in terms of the total compensated18 did not present changes in magnitude compared to the previous month (+0.04 p.p. to 0.7% in amounts) and -0.02 p.p. to 0.5% in amounts, see Graph 23), remaining in a range of values similar to the average of 2021 and at the beginning of 2022.
Figure 23 | Bounce checks due to insufficient funds
References
1 Differences in balance sheet balances expressed in homogeneous currency. Information extracted from the Monthly Accounting Information Regime for the Balance Sheet (March 2022, latest information available at the time of publication of this Report).
2 Expressed in currency of origin.
3 Includes principal adjustments and accrued interest.
4 For more details, see Ordered text “Financing line for productive investment in MSMEs”. Recently, within the framework of the readjustment of active and passive interest rates, the interest rates (TNA) of the financing channeled through this instrument were modified, setting them at 37% for those destined for investment projects and 47.5% for the lines destined for working capital (Communication “A” “7512”).
5 See Communication “A” “7512” and “Press Release” of 05/12/22.
6 Includes forward purchase and sale transactions of foreign currency classified off-balance sheet.
7 Part of the monthly reduction in this indicator occurred in the context of the migration made by a group of credit balance institutions (in foreign currency) in an irregular situation to off-balance sheet items.
8 In particular, as of April 2022, it was provided that the installment refinancing facility (incorporating them at the end of the life of the loan), in force only for customers who are employers covered by the Productive Recovery Program II (REPRO II), will exclusively include the outstanding installments of the financing disbursed until 4/28/22 to those customers. In addition, the possibility of refinancing is excluded from the installments that have already been subject to this treatment. See Communication “A” “6938”, Communication “A” “7107”, Communication “A” “7181”, Communication “A” “7245”, Communication “A” “7497” and Point 2.1.1. of the Ordered Text “Financial Services in the Framework of the Health Emergency Provided for by Decree No. 260/2020 CORONAVIRUS (COVID-19)”.
9 It considers availability, assets admitted for the integration of the Minimum Cash requirement and BCRA instruments, in national and foreign currency, all in terms of total deposits.
10 For its part, within the BCRA’s instruments, it is worth noting the growth in the month of NOTALIQ holdings – which began to be tendered in February – although its weighting in terms of deposits is limited.
11 In this year-on-year dynamic among accounts opened in financial institutions via CBU, the increase in transactions through Mobile Banking (+137.6% YoY in amounts and +79% YoY in real amounts), Internet Banking (+21.6% YoY in amounts and +10.5% YoY in real amounts) and Business Electronic Banking (+14.8% YoY in amounts and +24.5% YoY in real amounts) stood out.
12 Considering each segment, in April average transactions reached almost $349,900 in business electronic banking, $38,700 in internet banking, $31,800 in ATMs, $11,500 in mobile banking and $8,900 in CVU.
13 When considering annualized amounts of the last three months.
14 Within the framework of the Transfers 3.0 scheme and based on the boost received from the BCRA regulations, the interoperability of operations initiated with QR codes was provided (for more information, see the edition of the Banking Report of “(November 2021)”.
15 The greater openness of the economy due to the relaxation of the measures adopted during COVID-19 corresponds to a greater relative dynamism in face-to-face operations.
16 When considering annualized amounts of the last three months.
17 These values are in line with the historical average of 15.7% since March 2016
18 Consider physical checks as well as electronic checks.
Share on


